Introduction
Liver failure (LF) is a complex medical emergency
that evolves following a catastrophic insult to the liver with an
outcome that remains the most ominous of all the gastroenterologic
diseases. LF is severe liver damage resulting from various factors,
which cause obstruction or decompensation of function, such as
composition, detoxifιcation, drainage and biotransformation.
Various clinical syndromes appear, including the obstruction of
coagulation mechanisms, icterus, hepatic encephalopathy and
ascites. Serious complications, such as hepatic encephalopathy and
renal inadequacy tend to occur during the course of the disease and
further exacerbate clinical syndromes. It is conventionally defined
by an arterial oxygen tension (PaO2) <8.0
kPa (60 mmHg) and/or an arterial carbon dioxide tension
(PaCO2) >6.0 kPa (45 mmHg), and a serum
bilirubin level ≥12.0 mg/dl. The prognosis of patients with severe
liver injury, particularly with LF, largely depends upon the
regenerative capacity of hepatocytes during comprehensive
treatment. Liver transplantation improves survival and quality of
life. However, treatment is futile in certain patients, but it is
difficult to identify these patients a priori. In clinical
practice, serum α-fetoprotein is often used as a predictive
biomarker for monitoring the prognosis of patients with LF, as it
reflects the regeneration of hepatocytes in response to liver
injury (1–3). Although the most important function of
telomerase is associated with cell proliferation and regeneration,
to the best of our knowledge, there are no studies regarding the
association of the prognosis of LF and telomerase activation. Thus,
identification of molecular markers is required and novel
treatments against this disease must be developed. In addition,
improved non-invasive methods of detecting LF are urgently required
in order to influence the survival of the increasing numbers of
individuals affected by this disease.
The precise molecular pathogenic mechanism of LF
remains unknown. Development of biomarkers for a deeper
understanding of LF pathogenesis and improving diagnosis,
prognosis, and treatment remains one of the main goals and
challenges in LF research. Biomarkers within the blood and urine
reflect the status and possible future progression of a disease
(4). Aberrant functions of the
lymphocytic regulatory pathway are extensively involved in the
pathological mechanism of certain diseases (5); therefore, peripheral blood mononuclear
cells (PBMCs) are an attractive sample source in such studies.
Proteomic analysis is a research method that catalogs all of the
proteins within cells and organisms. Recent advancements in
quantitative and large-scale proteomic methods may be used to
optimize the clinical application of biomarkers (6). Furthermore, advancements of proteomic
techniques contribute to the identification of clinically useful
biomarkers and clarify the molecular mechanisms of disease
pathogenesis using body fluids, such as serum, as well as tissue
samples and cultured cells.
Proteomics analysis is a powerful technology used in
a myriad of studies, including those focused on liver diseases
(7–11).
The isobaric tags for relative and absolute quantitation (iTRAQ)
method allows a more comprehensive analysis. This method has a high
sensitivity and it is possible to detect low-abundance proteins.
iTRAQ has increasingly been applied in biomarker research in
various sample sources for various disease states (12–14).
Charlton et al (15) compared
the protein expression profiles in four groups of liver tissue
samples from obese patients using the combination of iTRAQ with
liquid chromatography (LC)-mass spectrometry (MS)/MS. The authors
identified a total of 1,362 hepatic-expressed proteins, and
identified two important proteins. Niu et al performed
various in vitro proteomic investigations of Hepatitis B
virus (HBV)-infected HepG2 hepatoma cells to evaluate the protein
changes associated with the virus infection. Using the combined
methods of iTRAQ with 2D-LC-MS/MS, the authors compared the protein
expression in non-infected HepG2 with that in HBV-infected HepG2
cells to identify various proteins that were downregulated in the
HBV-infected cells, including S100 calcium-binding protein A6 and
Αnnexin A2 (16,17).
In the present study, iTRAQ technology was used to
analyze the total proteins in PBMCs of LF patients. The aim was to
identify the differences in PBMC protein levels that were closely
associated with the progression of LF. Further investigation into
the molecular mechanism of the proteins involved may improve
understanding of the pathogenesis of LF and facilitate development
of novel approaches to diagnose and treat LF.
Materials and methods
Main reagents
Triton X-100 was purchased from GE Healthcare
(Waukesha, WI, USA). Triethylammonium bicarbonate buffer was
acquired from Sigma-Aldrich (Merck Millipore, Darmstadt, Germany).
ZipTip Pipette Tips and Milli-Q water were obtained from EMD
Millipore (Billerica, MA, USA). The iTRAQ Reagent-8 Plex Multiplex
kit was acquired from Applied Biosystems (Thermo Fisher Scientific,
Inc., Waltham, MA, USA) and Strata-X 33 Polymeric Reversed Phase
was purchased from Phenomenex (Los Angeles, CA, USA). All other
reagents were acquired from commercial sources.
Patients and healthy controls
Ten patients (6 male and 4 female; aged 23–57 years)
were diagnosed as LF between January and December 2014, and 10 age-
and gender-matched subjects were recruited as healthy controls.
HBV-associated LF refers to patients with LF caused by chronic HBV
infection. The 10 patients and 10 healthy control subjects were
from Shenzhen People's Hospital (Shenzhen, China). The diagnosis of
LF was confirmed by pathologic diagnosis and clinical evidence.
The control subjects were recruited and a general
health checkup program confirmed that there was no clinical
evidence of LF. All participants were informed of their
participation rights and written informed consent was obtained. The
present study was performed in accordance with the Helsinki
Declaration and approved by the Regional Ethics Committee.
PBMC isolation, protein extraction and
quantitation
One 10-ml fasting venous blood sample was collected
in heparinized vacutainers from each enrolled subject. PBMCs were
isolated with lymphocyte-H medium (Cedarlane Labs, Hornby, ON,
Canada) according to the manufacturer's instruction. The total
protein of PBMCs was extracted, and their concentration was
measured using a BCA protein assay kit (Pierce; Thermo Fisher
Scientific, Inc.) according to the manufacturer's instruction. The
proteins in the supernatant were maintained at −80°C for further
analysis.
iTRAQ labeling and strong cation
exchange (SCX) chromatography fractionation
Total protein (100 µg) from the PBMCs of the 10 LF
patients and 10 healthy control subjects was digested separately
with Trypsin Gold (Promega Corporation, Madison, WI, USA) with the
ratio of protein:trypsin 30:1 at 37°C for 16 h. Following trypsin
digestion, peptides were dried by vacuum centrifugation at 2,000 ×
g at room temperature for 10 min. Peptides were reconstituted in
0.5 M triethyl-ammonium bicarbonate buffer and processed according
to the manufacture's protocol for the 8-plex iTRAQ reagent.
Briefly, one unit of iTRAQ reagent was thawed and reconstituted in
24 µl isopropanol. Samples were labeled with the iTRAQ tags as
follows: Sample 113 and sample 115. The peptides were labeled with
the isobaric tags and incubated at room temperature for 2 h. The
labeled peptide mixtures were then pooled and dried by vacuum
centrifugation at 2,000 × g at room temperature for 10 min.
SCX chromatography was performed with a LC-20AB
high-performance LC (HPLC) Pump system (Shimadzu Corp., Kyoto,
Japan). The iTRAQ-labeled peptide mixtures were reconstituted with
4 ml buffer A (25 mM NaH2PO4 in 25% ACN, pH
2.7) and loaded onto a 4.6×250 mm Ultremex SCX column containing
5-µm particles (Phenomenex). The peptides were eluted at a flow
rate of 1 ml/min with a gradient of buffer A for 10 min, 5–60%
buffer B (25 mM NaH2PO4, 1 M KCl in 25% ACN,
pH 2.7) for 27 min and 60–100% buffer B for 1 min. The system was
then maintained at 100% buffer B for 1 min before equilibrating
with buffer A for 10 min prior to the next injection. Elution was
monitored by measuring the absorbance at 214 nm with
ultraviolet-visible spectrophotometry, and fractions were collected
at 1-min intervals. The eluted peptides were pooled into 20
fractions, desalted with a Strata X C18 column (Phenomenex) and
vacuum-dried.
LC-MS/MS analysis based on
Q-EXACTIVE
Each fraction was resuspended in buffer A (2% ACN,
0.1% FA) and centrifuged at 20,000 × g for 10 min at 4°C, the final
concentration of peptide was ~0.5 µg/µl on average. Supernatant (10
µl) was loaded onto an LC-20AD nano HPLC (Shimadzu Corp., Kyoto,
Japan) by the autosampler onto a 2-cm C18 trap column (inner
diameter, 200 µm). Then, the peptides were eluted onto a 10-cm
analytical C18 column (inner diameter, 75 µm) packed in-house. The
samples were loaded at 8 μl/min for 4 min, then the 44-min gradient
was run at 300 nl/min starting from 2 to 35% solvent B (98% ACN,
0.1% fatty acid), followed by a 2-min linear gradient to 80% and
maintenance at 80% solvent B for 4 min, and finally returning to 5%
in 1 min.
The peptides were subjected to nanoelectrospray
ionization followed by MS/MS in a Q-EXACTIVE (Thermo Fisher
Scientific, Inc.) coupled online to the HPLC. Intact peptides were
detected in the orbitrap (Thermo Fisher Scientific, Inc.) at a
resolution of 70,000. Peptides were selected for MS/MS using
high-energy collision dissociation operating mode with a normalized
collision energy setting of 27.0; ion fragments were detected in
the orbitrap at a resolution of 17,500. A data-dependent procedure
that alternated between one MS scan followed by 15 MS/MS scans was
applied for the 15 most abundant precursor ions above a threshold
ion count of 20,000 in the MS survey scan with a subsequent dynamic
exclusion duration of 15 sec. The electrospray voltage applied was
1.6 kV. Automatic gain control (AGC) was used to optimize the
spectra generated by the orbitrap. The AGC target for full MS was
3e6 and 1e5 for MS2. For the MS scans, the mass to charge ratio
(m/z) scan range was 350–2,000 Da, and for the MS2 scans, the m/z
scan range was 100–1,800.
Western blot analysis
The protein abundance of the pooled samples
previously analyzed by iTRAQ LC-MS/MS was confirmed essentially as
previously described using western blotting (18). Four protein samples (35 µg) were added
into electrophoretic buffer containing β-mercaptoethanol prior to
SDS-PAGE. GAPDH (Kangcheng, Shanghai, China) served as a loading
control. The primary antibody (dilution, 1:250; cat. no. ab89835)
for ADP-ribosylation factor 1 was obtained from Abcam (Cambidge,
MA, USA) and the peroxidase-conjugated goat anti-rabbit IgG
secondary antibody (dilution, 1:10,000) was obtained from
SouthernBiotech (Birmingham, AL, USA; cat. no. A21020). The band
intensity of western blot analysis was repeated three times using
ImageJ software (National Institutes of Health, Bethesda, MD,
USA).
Statistical analysis
Protein identification was performed using Mascot
version 2.3.02 (Matrix Science, London, UK). Peptide sequences were
searched against the non-redundant National Center for
Biotechnology Information database. For protein quantitation, it
was required that a protein contained at least two unique peptides.
The quantitative protein ratios were weighted and normalized by the
median ratio in Mascot. Only ratios with P<0.05 and fold-change
>1.2 were considered to be statistically significant. Search
criteria were set to permit a maximum of 1 missed cleavage. The
following peptide modifications were also allowed: Gln→pyro-Glu,
iTRAQ 8plex, Phospho. Automatic isotope correction was performed
using the two software packages using the values supplied with the
Applied Biosystems reagents. The PANTHER database (http://www.pantherdb.org/panther/) was then used
to establish the molecular function, biological process and
signaling pathway associated with each individual protein. GO and
KEGG pathway mapping were performed by web-accessible DAVID
annotation system (version 6.7; https://david-d.ncifcrf.gov/).
Results
Protein expression profile
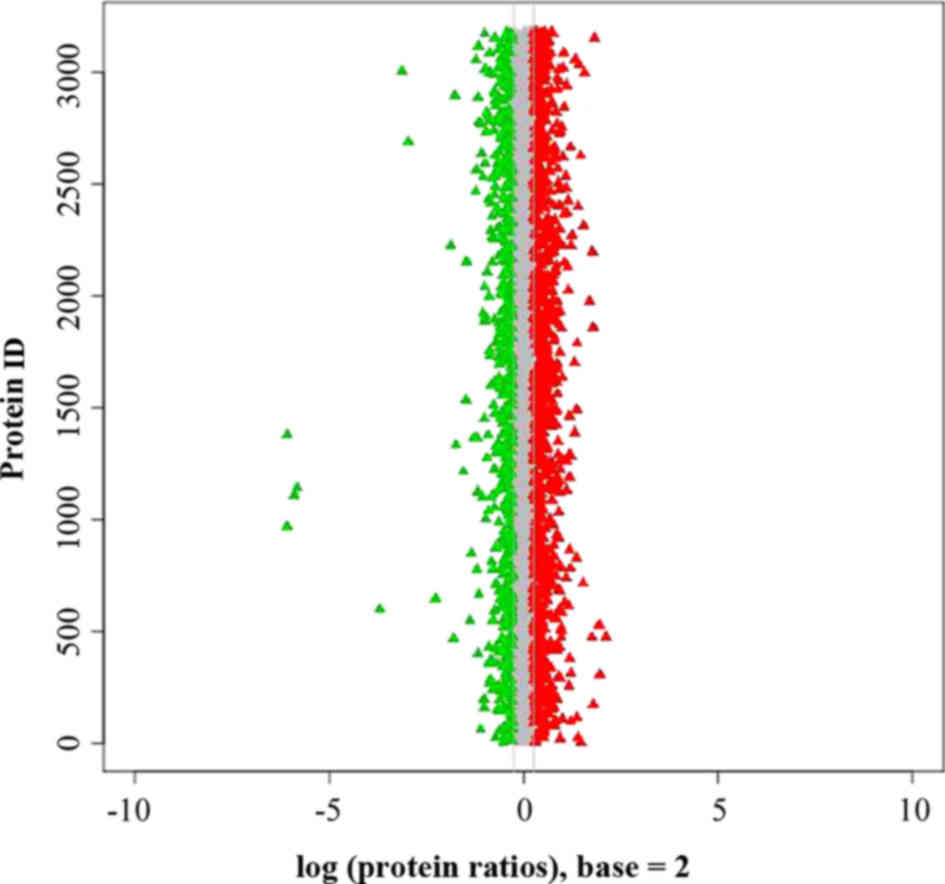
Compared with the control group, a total of 627
differently expressed proteins were detected, of which 409 proteins
showed increased expression levels and 218 proteins showed
decreased expression levels in LF (Table
I). The protein ratio distribution of these proteins is
illustrated in Fig. 1. Relative
quantification of proteins was based on the ratio of peak areas
from the MS/MS spectra, and the m/z of LF patients and control
subjects were involved in the present study.
 | Table I.LF proteome. |
Table I.
LF proteome.
| A, Top 30 increased
proteins in LF |
|---|
|
|---|
| No. | Accession | Description | Ratio of LF to
control |
|---|
| 1 |
sp|P22392|NDKB_HUMAN | Nucleoside
diphosphate kinase B | 3.953 |
| 2 |
sp|Q9UM07|PADI4_HUMAN | Protein-arginine
deiminase type-4 | 3.509 |
| 3 |
sp|Q9CQC6|BZW1_MOUSE | Basic leucine zipper
and W2 domain-containing protein 1 | 3.431 |
| 4 |
sp|Q96DA6|TIM14_HUMAN | Mitochondrial import
inner membrane translocase subunit TIM14 | 3.297 |
| 5 |
sp|P52790|HXK3_HUMAN | Hexokinase-3 | 2.957 |
| 6 |
sp|P80188|NGAL_HUMAN | Neutrophil
gelatinase-associated lipocalin | 2.928 |
| 7 |
sp|P25774|CATS_HUMAN | Cathepsin S | 2.8 |
| 8 |
sp|P12429|ANXA3_HUMAN | Annexin A3 | 2.631 |
| 9 |
sp|P37837|TALDO_HUMAN | Transaldolase | 2.595 |
| 10 |
sp|P41218|MNDA_HUMAN | Myeloid cell nuclear
differentiation antigen | 2.55 |
| 11 |
sp|Q9ULZ3|ASC_HUMAN | Apoptosis-associated
speck-like protein containing a CARD | 2.514 |
| 12 |
sp|Q4R6V2|TCPE_MACFA | T-complex protein 1
subunit epsilon | 2.362 |
| 13 |
sp|P26583|HMGB2_HUMAN | High mobility group
protein B2 | 2.361 |
| 14 |
sp|Q9UBW5|BIN2_HUMAN | Bridging integrator
2 | 2.355 |
| 15 |
sp|Q6P4A8|PLBL1_HUMAN | Phospholipase
B-like 1 | 2.339 |
| 16 |
sp|A6NI72|NCF1B_HUMAN | Putative neutrophil
cytosol factor 1B | 2.338 |
| 17 |
sp|P39687|AN32A_HUMAN | Acidic leucine-rich
nuclear phosphoprotein 32 family member A | 2.295 |
| 18 |
sp|Q92688|AN32B_HUMAN | Acidic leucine-rich
nuclear phosphoprotein 32 family member B | 2.295 |
| 19 |
sp|P61586|RHOA_HUMAN | Transforming
protein RhoA | 2.292 |
| 20 |
sp|P20700|LMNB1_HUMAN | Lamin-B1 | 2.249 |
| 21 |
sp|O75962|TRIO_HUMAN | Triple functional
domain protein | 2.233 |
| 22 |
sp|Q92905|CSN5_HUMAN | COP9 signalosome
complex subunit 5 | 2.201 |
| 23 |
sp|P18433|PTPRA_HUMAN | Receptor-type
tyrosine-protein phosphatase α | 2.187 |
| 24 |
sp|Q8BL97|SRSF7_MOUSE |
Serine/arginine-rich splicing factor
7 | 2.186 |
| 25 |
sp|P48595|SPB10_HUMAN | Serpin B10 | 2.171 |
| 26 |
sp|P50402|EMD_HUMAN | Emerin | 2.17 |
| 27 |
sp|O96006|ZBED1_HUMAN | Zinc finger BED
domain-containing protein 1 | 2.162 |
| 28 |
sp|P09668|CATH_HUMAN | Pro-cathepsin
H | 2.146 |
| 29 |
sp|P50395|GDIB_HUMAN | Rab GDP
dissociation inhibitor β | 2.1 |
| 30 |
sp|O73777|IF4G2_CHICK | Eukaryotic
translation initiation factor 4 γ 2 (Fragment) | 2.091 |
|
| B, Top 30 decreased
proteins in LF |
|
| No. | Accession | Description | Ratio of LF to
control |
|
| 1 |
sp|Q9Y2R4|DDX52_HUMAN | Probable
ATP-dependent RNA helicase DDX52 | 0.078 |
| 2 |
sp|O75015|FCG3B_HUMAN | Low affinity
immunoglobulin gamma Fc region receptor III-B | 0.211 |
| 3 |
sp|P12236|ADT3_HUMAN | ADP/ATP translocase
3 | 0.277 |
| 4 |
sp|Q9NTG7|SIR3_HUMAN | NAD-dependent
protein deacetylase sirtuin-3, mitochondrial | 0.298 |
| 5 |
sp|P14222|PERF_HUMAN | Perforin-1 | 0.346 |
| 6 |
sp|P20718|GRAH_HUMAN | Granzyme H | 0.39 |
| 7 |
sp|P04264|K2C1_HUMAN | Keratin, type II
cytoskeletal 1 | 0.419 |
| 8 |
sp|P19086|GNAZ_HUMAN | Guanine
nucleotide-binding protein G(z) subunit α | 0.433 |
| 9 |
sp|P11166|GTR1_HUMAN | Solute carrier
family 2, facilitated glucose transporter member 1 | 0.434 |
| 10 |
sp|Q969X1|LFG3_HUMAN | Protein lifeguard
3 | 0.437 |
| 11 |
sp|Q15050|RRS1_HUMAN | Ribosome biogenesis
regulatory protein homolog | 0.442 |
| 12 |
sp|P12544|GRAA_HUMAN | Granzyme A | 0.448 |
| 13 |
sp|P14209|CD99_HUMAN | CD99 antigen | 0.45 |
| 14 |
sp|P07996|TSP1_HUMAN |
Thrombospondin-1 | 0.454 |
| 15 |
sp|P05106|ITB3_HUMAN | Integrin β-3 | 0.454 |
| 16 |
sp|P02788|TRFL_HUMAN |
Lactotransferrin | 0.479 |
| 17 |
sp|P35527|K1C9_HUMAN | Keratin, type I
cytoskeletal 9 | 0.487 |
| 18 |
sp|O15533|TPSN_HUMAN | Tapasin | 0.491 |
| 19 |
sp|O60704|TPST2_HUMAN | Protein-tyrosine
sulfotransferase 2 | 0.504 |
| 20 |
sp|Q9BVC6|TM109_HUMAN | Transmembrane
protein 109 | 0.506 |
| 21 |
sp|P37840|SYUA_HUMAN | α-synuclein | 0.511 |
| 22 |
sp|Q08AF3|SLFN5_HUMAN | Schlafen family
member 5 | 0.514 |
| 23 |
sp|P16109|LYAM3_HUMAN | P-selectin | 0.517 |
| 24 |
sp|P01871|IGHM_HUMAN | Ig µ chain C
region | 0.523 |
| 25 |
sp|P50336|PPOX_HUMAN | Protoporphyrinogen
oxidase | 0.529 |
| 26 |
sp|P02788|TRFL_HUMAN |
Lactotransferrin | 0.543 |
| 27 |
sp|P68872|HBB_PANPA | Hemoglobin subunit
β | 0.548 |
| 28 |
sp|Q9Y6W5|WASF2_HUMAN | Wiskott-Aldrich
syndrome protein family member 2 | 0.549 |
| 29 |
sp|P18428|LBP_HUMAN |
Lipopolysaccharide-binding protein | 0.556 |
| 30 |
sp|Q99798|ACON_HUMAN | Aconitate
hydratase, mitochondrial | 0.556 |
Gene Ontology (GO) and Kyoto
Encyclopedia of Genes and Genomes (KEGG) pathway analysis
The functions of the differently expressed proteins
were analyzed using the GO and KEGG pathways annotation system. The
proteins produced a total of 420 GO terms in the LF group (Table II), including 284 in biological
process, 74 in cellular component and 62 in molecular function. The
results indicate that a set of highly abundant and significantly
differentially expressed proteins may promote the progression of LF
patients. In addition, 14 KEGG pathways of the differently
expressed proteins in LF were obtained (Table III).
| Table II.Up- and downregulated protein
annotation terms of the GO molecular function, cellular component
and biological process categories in LF. |
Table II.
Up- and downregulated protein
annotation terms of the GO molecular function, cellular component
and biological process categories in LF.
| Term | P-value | Term | P-value |
|---|
| Biological
process |
|
|
|
|
Transport | 6.41E-05 | Multi-organism
process | 0.001086326 |
|
Establishment of
localization | 6.58E-05 | DNA damage
response, signal transduction by p53 class mediator | 0.001163164 |
| Immune
system process | 0.000134159 | Vesicle-mediated
transport | 0.001412972 |
| Immune
response | 0.000164528 | Intracellular
transport | 0.001540664 |
|
Establishment of localization
in cell | 0.000176366 | Release of
sequestered calcium ion into cytosol | 0.001593621 |
|
Negative regulation of
molecular function | 0.000205286 | Regulation of
sequestering of calcium ion | 0.001593621 |
|
Negative regulation of
catalytic activity | 0.000304827 | Negative regulation
of sequestering of calcium ion | 0.001593621 |
|
Localization | 0.000494539 | Cytosolic calcium
ion transport | 0.001593621 |
| Vesicle
fusion | 0.00085815 | Calcium ion
transport into cytosol | 0.001593621 |
|
Cellular localization | 0.000951991 | Signal transduction
by p53 class mediator | 0.001850301 |
| Molecular
function |
|
|
|
| Cation
transmembrane transporter activity | 0.000354884 | endopeptidase
regulator activity | 0.006225752 |
|
Hydrogen ion transmembrane
transporter activity | 0.001472303 | Immunoglobulin
binding | 0.006472871 |
|
Inorganic cation transmembrane
transporter activity | 0.002536343 | Substrate-specific
transmembrane transporter activity | 0.006837942 |
|
Peptidase regulator
activity | 0.002777008 | Endopeptidase
inhibitor activity | 0.007710339 |
|
Transporter activity | 0.003623169 | Peptidase inhibitor
activity | 0.007710339 |
| Peptide
transporter activity | 0.004093554 | Monosaccharide
binding | 0.008311587 |
| Amide
transmembrane transporter activity | 0.004093554 |
Ubiquinol-cytochrome-c reductase
activity | 0.008525874 |
| Enzyme
inhibitor activity | 0.004329426 | Ferric iron
binding | 0.008525874 |
|
Substrate-specific transporter
activity | 0.004897002 | Oxidoreductase
activity, acting on diphenols and related substances as donors | 0.008525874 |
| Ion
transmembrane transporter activity | 0.005584917 | Oxidoreductase
activity, acting on diphenols and related substances as donors,
cytochrome as acceptor | 0.008525874 |
| Cellular
component |
|
|
|
|
Cytoplasmic vesicle | 0.000318 | Phagocytic
vesicle | 0.003696 |
|
Vesicle | 0.000409 | endosomal part | 0.005078 |
|
Cytoplasmic membrane-bounded
vesicle | 0.000483 | Proteasome
complex | 0.005818 |
|
Secretory granule | 0.000497 | Endosome | 0.006978 |
|
Cytoplasmic vesicle part | 0.000632 | Proteasome core
complex, alpha-subunit complex | 0.008175 |
|
Membrane-bounded vesicle | 0.000705 | TAP complex | 0.00878 |
|
Platelet alpha granule | 0.00168 | Cytoplasmic vesicle
membrane | 0.009488 |
|
Secondary lysosome | 0.002441 | Endosome
membrane | 0.010481 |
|
Phagolysosome | 0.002441 | Vesicle
membrane | 0.011522 |
|
Endocytic vesicle | 0.002743 | Organelle envelope
lumen | 0.011583 |
| Table III.The Kyoto Encyclopedia of Genes and
Genomes pathways of the differently expressed proteins in liver
failure. |
Table III.
The Kyoto Encyclopedia of Genes and
Genomes pathways of the differently expressed proteins in liver
failure.
| Pathway | P-value | Pathway ID |
|---|
| Spliceosome | 0.0004265046 | ko03040 |
| Cardiac muscle
contraction | 0.0006583187 | ko04260 |
| Proteasome | 0.002674917 | ko03050 |
| Oxidative
phosphorylation | 0.004688983 | ko00190 |
| Parkinson's
disease | 0.0061224 | ko05012 |
| Valine, leucine and
isoleucine biosynthesis | 0.008369825 | ko00290 |
| Malaria | 0.01015188 | ko05144 |
| Pathogenic
Escherichia coli infection | 0.0161563 | ko05130 |
| Leukocyte
transendothelial migration | 0.01934782 | ko04670 |
| Alzheimer's
disease | 0.01948298 | ko05010 |
|
Glycolysis/gluconeogenesis | 0.02570021 | ko00010 |
| Osteoclast
differentiation | 0.02836594 | ko04380 |
| Phagosome | 0.02839378 | ko04145 |
| Galactose
metabolism | 0.0475115 | ko00052 |
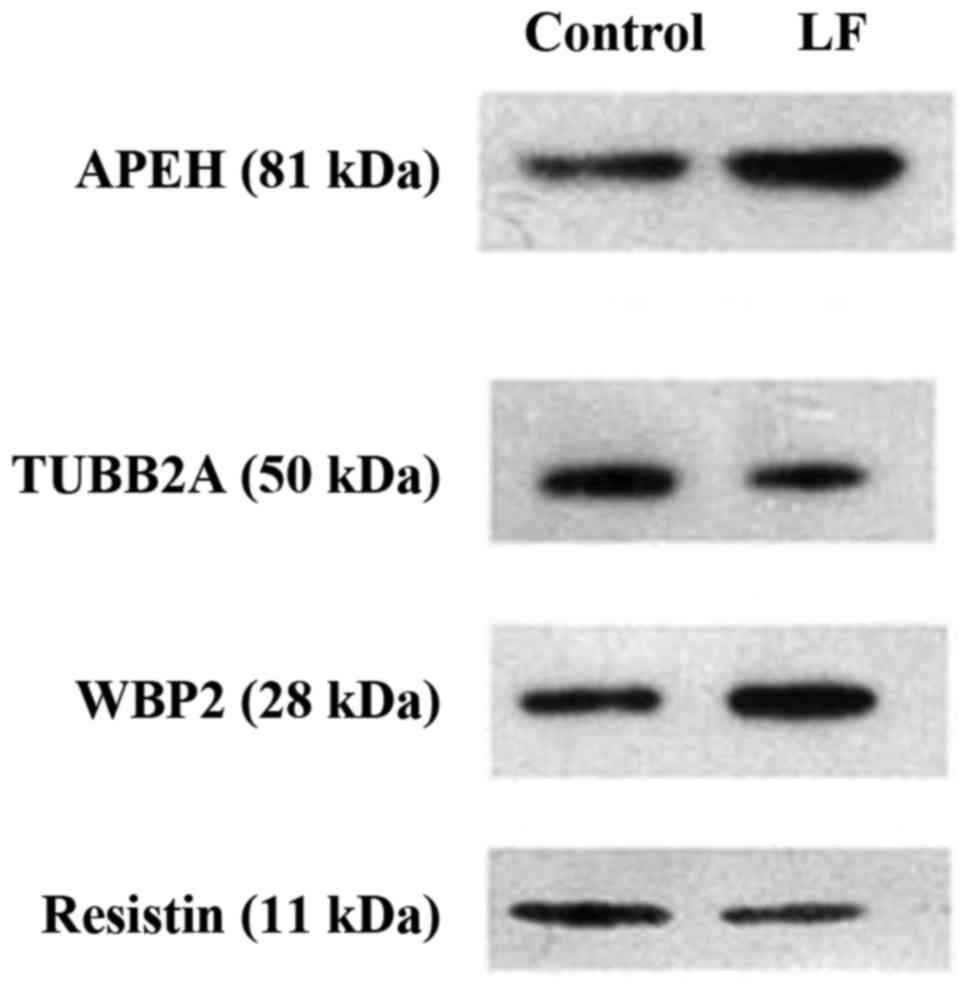
Western blot analysis
Four proteins, acylaminoacyl-peptide hydrolase
(APEH; 1.309), WW domain binding protein 2 (WBP2; 1.385), resistin
(0.747) and tubulin β 2A class IIa (TUBB2A; 0.764), were selected
from the 627 proteins with variable expression levels. These
differently expressed proteins between the LF and control groups
were verified by western blotting (Table
IV and Fig. 2), which indicated a
similar relative expression level when compared with the iTRAQ
LC-MS/MS analysis.
| Table IV.Western blot analysis of APEH, WBP2,
resistin and TUBB2A in the LF and control groups. |
Table IV.
Western blot analysis of APEH, WBP2,
resistin and TUBB2A in the LF and control groups.
| Name | Control (relative
expression) | LF (relative
expression) |
|---|
| Resistin | 1.000 | 0.715 |
| APEH | 1.000 | 1.297 |
| TUBB2A | 1.000 | 0.738 |
| WBP2 | 1.000 | 1.072 |
Discussion
Protein quantification has become an important and,
in many cases, critical component of modern MS-based proteomic
research (19,20). Proteomics is the term used for
exhaustive analysis of protein structure and function. It is useful
for elucidation of the pathology and identification of disease
markers for liver diseases. PBMCs are often used as clinical
samples, rather than tissue, as less invasive methods may be used
to obtain them. If a biomarker associated with the pathology,
disease progression or efficacy of treatment is identified in
PBMCs, it may be easily applied for early or differential diagnosis
of diseases. Of these, iTRAQ, which enables the parallel comparison
of protein abundance by measuring the peak intensities of reporter
ions released from iTRAQ-tagged peptides, has the potential to be a
key tool in the area of quantitative proteomic study. In the
current study, iTRAQ technology was adopted to quantitatively
analyze the proteomics of PBMCs from LF patients and healthy
control subjects. As a result, 627 proteins involving different
biological functions and cellular locations were identified. Among
these proteins, four proteins were significantly differentially
expressed; APEH and WBP2 were upregulated, and resistin and TUBB2A
were downregulated. It provided additional proof that the iTRAQ
technique accurately quantifies relative changes in protein
abundance of PBMCs, which has been demonstrated to be useful in
detecting pathological stages or prognosis in certain diseases,
such as osteoarthritis (21,22).
Resistin is cysteine-rich protein belonging to the
RELM family. The genetic structure of the Retn gene varies
between mammals and the similarity in the coding sequence ranges
from ~60% for rodents to 80% for livestock (23). The expression of this gene in rodents
occurs predominantly in mature adipocytes, although it was also
identified in other tissues. Retn is considered to be a factor
linking obesity and insulin resistance. In obesity, its expression
increases, leading to enhanced resistance of tissues to insulin
(24). TUBB2A is thought to
comprise ~30% of all β-tubulin within the brain (25) and contributes to the growing list of
tubulin gene mutations that are associated with impaired brain
development in humans. Increased expression levels of TUBB2A
have been correlated with decreased drug sensitivity in
paclitaxel-resistant cell lines (26).
A previous study demonstrated the potential of a model for gene
perturbation studies by demonstrating that decreased expression
levels of TUBB2A result in significantly increased
sensitivity of neurons to paclitaxel (27).
The role of WBP-2 is as a coactivator for estrogen
receptor and progesterone receptor transactivation pathways
(28). APEH has been postulated to
serve as a key regulator of N-terminal acetylated proteins
(29). As >80% of proteins in human
cells are N-terminal acetylated (30,31) and
protein acetylation is implicated in a variety of essential
cellular pathways (32), it is
feasible that APEH is involved in these processes. APEH, one of the
four members of the prolyl oligopeptidase class, catalyses the
removal of N-acetylated amino acids from acetylated peptides and it
has been postulated to be key in protein degradation machinery.
Disruption of protein turnover has been established as an effective
strategy to downregulate the ubiquitin proteasome system and as a
promising approach in anticancer therapy. APEH may be an upstream
modulator of the proteasome (33).
To establish the biological roles of the proteins
from LF, GO enrichment and KEGG pathway analyses were performed. GO
categories were separated into three groups: Molecular function,
biological process and cellular component. The present study
identified GO terms for molecular function significantly enriched
in protein binding (GO:0005515; P=0.02145) involving TUBB2A
and WBP2, and for cellular component, the enriched GO terms were
cytoplasm (GO:0005737; P=0.02634) involving APEH and TUBB2A. KEGG
analysis was performed with P<0.05 as the criteria for
significant pathway identification. The significant pathway in the
KEGG analysis was identified as phagosome (P=0.02839) involving
TUBB2A. Phagocytosis is the process of a cell taking in relatively
large particles, and is a central mechanism in tissue remodeling,
inflammation and defense against infectious agents. A phagosome is
formed when the specific receptors on the phagocyte surface
recognize ligands on the particle surface. Following formation,
nascent phagosomes progressively acquire digestive
characteristics.
In conclusion, proteomic technologies based on MS
have been developed, and the reliability of these technologies
continues to improve. Such advancements in proteomic techniques may
contribute to the identification of clinically useful biomarkers
and the elucidation of the molecular mechanisms involved in disease
pathogenesis. Therefore, a more sensitive detection system to
search for biomarkers is required, and this may allow clinically
useful markers for all liver diseases to be identified. Proteins
are assumed to be key molecules that define the characteristics and
dynamics of cells, and control biological reactions. Therefore,
investigation of changes in protein expression levels is
particularly important in understanding disease pathology. A
limitation of the current study is that it did not discuss each of
the candidate proteins in detail. The aim of this preliminary study
was to focus on delineating primary comparative protein profiles of
LF patients and healthy control subjects using iTRAQ technology. In
future, a large-scale clinical study is required to investigate
useful biomarkers of LF. This may result in a novel method for
diagnosing LF. In addition, the current study demonstrates the
potential application of iTRAQ-based quantitative proteomics for
identifying protein changes and detecting notable biomarker
candidates in certain diseases. Thus, identification and evaluation
of an easily measurable biomarker is imperative. A combination of
conventional markers with newly identified markers, the variation
of which was confirmed in the present study, may improve diagnosis
of the LF disease state and the capacity for prognosis.
Acknowledgements
The authors would like to thank the patients with LF
and the healthy volunteers who participated in the present study.
The study was performed by Beijing Genomics Institute and supported
by the Guangxi Key Laboratory Construction Project Plan (grant no.
15-140-10) and the Clinical Research Program of Guilin 181st
Hospital (Guilin, China; grant no. [2008]125).
References
|
1
|
Schiødt FV, Ostapowicz G, Murray N,
Satyanarana R, Zaman A, Munoz S and Lee WM: Alpha-fetoprotein and
prognosis in acute liver failure. Liver Transpl. 12:1776–1781.
2006. View
Article : Google Scholar : PubMed/NCBI
|
|
2
|
Li Q, Yuan GY, Tang KC, Liu GW, Wang R and
Cao WK: Prognostic factors for chronic severe hepatitis and
construction of a prognostic model. Hepatobiliary Pancreat Dis Int.
7:40–44. 2008.PubMed/NCBI
|
|
3
|
Du WB, Pan XP and Li LJ: Prognostic models
for acute liver failure. Hepatobiliary Pancreat Dis Int. 9:122–128.
2010.PubMed/NCBI
|
|
4
|
Henriksen K, O'Bryant SE, Hampel H,
Trojanowski JQ, Montine TJ, Jeromin A, Blennow K, Lönneborg A,
Wyss-Coray T, Soares H, et al: Blood-Based Biomarker Interest
Group: The future of blood-based biomarkers for Alzheimer's
disease. Alzheimers Dement. 10:115–131. 2014. View Article : Google Scholar : PubMed/NCBI
|
|
5
|
Chang X, Cui Y, Zong M, Zhao Y, Yan X,
Chen Y and Han J: Identification of proteins with increased
expression in rheumatoid arthritis synovial tissues. J Rheumatol.
36:872–880. 2009. View Article : Google Scholar : PubMed/NCBI
|
|
6
|
Zhou L, Beuerman RW, Chan CM, Zhao SZ, Li
XR, Yang H, Tong L, Liu S, Stern ME and Tan D: Identification of
tear fluid biomarkers in dry eye syndrome using iTRAQ quantitative
proteomics. J Proteome Res. 8:4889–4905. 2009. View Article : Google Scholar : PubMed/NCBI
|
|
7
|
Ren F, Chen Y, Wang Y, Yan Y, Zhao J, Ding
M, Zhang J, Jiang Y, Zhai Y and Duan Z: Comparative serum proteomic
analysis of patients with acute-on-chronic liver failure:
Alpha-1-acid glycoprotein maybe a candidate marker for prognosis of
hepatitis B virus infection. J Viral Hepat. 17:816–824. 2010.
View Article : Google Scholar : PubMed/NCBI
|
|
8
|
Yang L, Rudser KD, Higgins L, Rosen HR,
Zaman A, Corless CL, David L and Gourley GR: Novel biomarker
candidates to predict hepatic fibrosis in hepatitis C identified by
serum proteomics. Dig Dis Sci. 56:3305–3315. 2011. View Article : Google Scholar : PubMed/NCBI
|
|
9
|
Jin GZ, Li Y, Cong WM, Yu H, Dong H, Shu
H, Liu XH, Yan GQ, Zhang L, Zhang Y, et al: iTRAQ-2DLC-ESI-MS/MS
based identification of a new set of immunohistochemical biomarkers
for classification of dysplastic nodules and small hepatocellular
carcinoma. J Proteome Res. 10:3418–3428. 2011. View Article : Google Scholar : PubMed/NCBI
|
|
10
|
Lee HJ, Na K, Choi EY, Kim KS, Kim H and
Paik YK: Simple method for quantitative analysis of N-linked
glycoproteins in hepatocellular carcinoma specimens. J Proteome
Res. 9:308–318. 2010. View Article : Google Scholar : PubMed/NCBI
|
|
11
|
Goh WW, Lee YH, Zubaidah RM, Jin J, Dong
D, Lin Q, Chung MC and Wong L: Network-based pipeline for analyzing
MS data: An application toward liver cancer. J Proteome Res.
10:2261–2272. 2011. View Article : Google Scholar : PubMed/NCBI
|
|
12
|
DeSouza LV, Grigull J, Ghanny S, Dubé V,
Romaschin AD, Colgan TJ and Siu KW: Endometrial carcinoma biomarker
discovery and verification using differentially tagged clinical
samples with multidimensional liquid chromatography and tandem mass
spectrometry. Mol Cell Proteomics. 6:1170–1182. 2007. View Article : Google Scholar : PubMed/NCBI
|
|
13
|
Al Badaai Y, DiFalco MR, Tewfik MA and
Samaha M: Quantitative proteomics of nasal mucus in chronic
sinusitis with nasal polyposis. J Otolaryngol Head Neck Surg.
38:381–389. 2009.
|
|
14
|
Hergenroeder G, Redell JB, Moore AN,
Dubinsky WP, Funk RT, Crommett J, Clifton GL, Levine R, Valadka A
and Dash PK: Identification of serum biomarkers in brain-injured
adults: Potential for predicting elevated intracranial pressure. J
Neurotrauma. 25:79–93. 2008. View Article : Google Scholar : PubMed/NCBI
|
|
15
|
Charlton M, Viker K, Krishnan A, Sanderson
S, Veldt B, Kaalsbeek AJ, Kendrick M, Thompson G, Que F, Swain J,
et al: Differential expression of lumican and fatty acid binding
protein-1: New insights into the histologic spectrum of
nonalcoholic fatty liver disease. Hepatology. 49:1375–1384. 2009.
View Article : Google Scholar : PubMed/NCBI
|
|
16
|
Niu D, Sui J, Zhang J, Feng H and Chen WN:
iTRAQ-coupled 2-D LC-MS/MS analysis of protein profile associated
with HBV-modulated DNA methylation. Proteomics. 9:3856–3868. 2009.
View Article : Google Scholar : PubMed/NCBI
|
|
17
|
Feng H, Li X, Niu D and Chen WN: Protein
profile in HBx transfected cells: A comparative iTRAQ-coupled 2D
LC-MS/MS analysis. J Proteomics. 73:1421–1432. 2010. View Article : Google Scholar : PubMed/NCBI
|
|
18
|
Nayak D, Huo Y, Kwang WX, Pushparaj PN,
Kumar SD, Ling EA and Dheen ST: Sphingosine kinase 1 regulates the
expression of proinflammatory cytokines and nitric oxide in
activated microglia. Neuroscience. 166:132–144. 2010. View Article : Google Scholar : PubMed/NCBI
|
|
19
|
Bantscheff M, Schirle M, Sweetman G, Rick
J and Kuster B: Quantitative mass spectrometry in proteomics: A
critical review. Anal Bioanal Chem. 389:1017–1031. 2007. View Article : Google Scholar : PubMed/NCBI
|
|
20
|
Li X, Hu B, Ding J and Chen H: Rapid
characterization of complex viscous samples at molecular levels by
neutral desorption extractive electrospray ionization mass
spectrometry. Nat Protoc. 6:1010–1025. 2011. View Article : Google Scholar : PubMed/NCBI
|
|
21
|
Couttas TA, Raftery MJ, Erce MA and
Wilkins MR: Monitoring cytoplasmic protein complexes with blue
native gel electrophoresis and stable isotope labelling with amino
acids in cell culture: Analysis of changes in the 20S proteasome.
Electrophoresis. 32:1819–1823. 2011. View Article : Google Scholar : PubMed/NCBI
|
|
22
|
Albaum SP, Hahne H, Otto A, Haußmann U,
Becher D, Poetsch A, Goesmann A and Nattkemper TW: A guide through
the computational analysis of isotope-labeled mass
spectrometry-based quantitative proteomics data: An application
study. Proteome Sci. 9:302011. View Article : Google Scholar : PubMed/NCBI
|
|
23
|
Sassek M, Pruszynska-Oszmalek E,
Nowacka-Woszuk J, Szczerbal I, Szczepankiewicz D, Kaczmarek P,
Kolodziejski PA, Switonski M and Mackowiak P: Resistin - from gene
expression to development of diabetes. J Biol Regul Homeost Agents.
27:647–654. 2013.PubMed/NCBI
|
|
24
|
Li Y, Ding L, Hassan W, Abdelkader D and
Shang J: Adipokines and hepatic insulin resistance. J Diabetes Res.
2013:1705322013. View Article : Google Scholar : PubMed/NCBI
|
|
25
|
Leandro-García LJ, Leskelä S, Landa I,
Montero-Conde C, López-Jiménez E, Letón R, Cascón A, Robledo M and
Rodríguez-Antona C: Tumoral and tissue-specific expression of the
major human beta-tubulin isotypes. Cytoskeleton. 67:214–223. 2010.
View Article : Google Scholar : PubMed/NCBI
|
|
26
|
Tegze B, Szállási Z, Haltrich I, Pénzváltó
Z, Tóth Z, Likó I and Gyorffy B: Parallel evolution under
chemotherapy pressure in 29 breast cancer cell lines results in
dissimilar mechanisms of resistance. PLoS One. 7:e308042012.
View Article : Google Scholar : PubMed/NCBI
|
|
27
|
Wheeler HE, Wing C, Delaney SM, Komatsu M
and Dolan ME: Modeling chemotherapeutic neurotoxicity with human
induced pluripotent stem cell-derived neuronal cells. PLoS One.
10:e01180202015. View Article : Google Scholar : PubMed/NCBI
|
|
28
|
Dhananjayan SC, Ramamoorthy S, Khan OY,
Ismail A, Sun J, Slingerland J, O'Malley BW and Nawaz Z: WW domain
binding protein-2, an E6-associated protein interacting protein,
acts as a coactivator of estrogen and progesterone receptors. Mol
Endocrinol. 20:2343–2354. 2006. View Article : Google Scholar : PubMed/NCBI
|
|
29
|
Perrier J, Durand A, Giardina T and
Puigserver A: Catabolism of intracellular N-terminal acetylated
proteins: Involvement of acylpeptide hydrolase and acylase.
Biochimie. 87:673–685. 2005. View Article : Google Scholar : PubMed/NCBI
|
|
30
|
Arnesen T, Van Damme P, Polevoda B,
Helsens K, Evjenth R, Colaert N, Varhaug JE, Vandekerckhove J,
Lillehaug JR, Sherman F, et al: Proteomics analyses reveal the
evolutionary conservation and divergence of N-terminal
acetyltransferases from yeast and humans. Proc Natl Acad Sci USA.
106:8157–8162. 2009. View Article : Google Scholar : PubMed/NCBI
|
|
31
|
Goetze S, Qeli E, Mosimann C, Staes A,
Gerrits B, Roschitzki B, Mohanty S, Niederer EM, Laczko E,
Timmerman E, et al: Identification and functional characterization
of N-terminally acetylated proteins in Drosophila melanogaster.
PLoS Biol. 7:e10002362009. View Article : Google Scholar : PubMed/NCBI
|
|
32
|
Kouzarides T: Acetylation: A regulatory
modification to rival phosphorylation? EMBO J. 19:1176–1179. 2000.
View Article : Google Scholar : PubMed/NCBI
|
|
33
|
Palmieri G, Bergamo P, Luini A, Ruvo M,
Gogliettino M, Langella E, Saviano M, Hegde RN, Sandomenico A and
Rossi M: Acylpeptide hydrolase inhibition as targeted strategy to
induce proteasomal down-regulation. PLoS One. 6:e258882011.
View Article : Google Scholar : PubMed/NCBI
|