Introduction
Diabetes mellitus (DM) has reached epidemic
proportions and affects more than 382 million individuals worldwide
(1): The number of patients with DM
is expected to increase beyond 592 million individuals by 2035
(1). Approximately 90 to 95% of
individuals with DM have type 2 DM (T2DM), the characteristics of
which can range from predominant insulin deficiency with relatively
minor insulin resistance to predominant insulin resistance with
relatively minor insulin deficiency (2). T2DM is a major cause of nephropathy,
retinopathy, and neuropathy as well as cardiovascular disease and
stroke (3,4). Although obesity resulting from a
sedentary lifestyle and overeating is an important risk factor for
T2DM, genetic components are involved in the pathogenesis of this
condition, given that a positive family history confers a 2.4-fold
increased risk for T2DM (5). The
heritability of T2DM has been estimated to be 50 to 60% (6).
Genome-wide association studies (GWASs) and
meta-analyses have identified >120 susceptibility loci for T2DM
(7) in individuals of European
(8–13)
or African (14) ancestry, in East
Asians (15), or in multiple ethnic
groups (16,17). Among Japanese, GWASs have identified
KCNQ1, UBE2E2, and C2CD4A-B (18–20) as
susceptibility genes for T2DM, and a recent meta-analysis
identified an additional seven susceptibility loci for this
condition (21). Genetic variants
that contribute to predisposition to T2DM in Japanese subjects,
however, remain to be identified definitively.
Metabolic syndrome (MetS) is a cluster of metabolic
traits including abdominal obesity, an increased serum
triglycerides, a decreased serum high-density lipoprotein (HDL)
cholesterol, high blood pressure (BP), and an increased fasting
plasma glucose (FPG) level (22).
MetS is a risk factor for atherosclerotic cardiovascular disease,
DM (23), and cancer (24). The etiology of MetS is highly complex,
with both genetic and environmental factors being thought to play
important roles. The heritability of MetS has been estimated to be
approximately 50% (25) and traits of
this syndrome to be 28 to 48% (26).
GWASs have suggested various loci or genes involved
in predisposition to MetS or to traits of this syndrome in
individuals of European (27,28) or African (29) ancestry or in Asian Indians (30) or Chinese individuals (31). However, genetic variants that
contribute to predisposition to MetS in Japanese individuals remain
to be identified definitively.
Circulating uric acid levels are regulated by
multiple renal transporters by mediating the excretion or
reabsorption of uric acid in the proximal kidney tubules (32). Hyperuricemia is an important risk
factor for gout, a common inflammatory arthritis (33), as well as for cardiovascular disease
(34) and cancer (35). The heritability of the serum
concentration of uric acid has been estimated to be 40% (36), suggesting that genetic variants
contribute to regulation of the serum uric acid level by
influencing uric acid synthesis, excretion, or reabsorption
(36,37).
GWASs have identified single nucleotide
polymorphisms (SNPs) significantly associated with the serum uric
acid concentration or the prevalence of gout (38–45). A
large-scale GWAS in European ancestry populations identified 28
loci that influence the serum concentration of uric acid (46). Although several SNPs have been shown
to be associated with gout in Japanese (47,48),
genetic variants that contribute to predisposition to hyperuricemia
in Japanese remain to be identified definitively.
In a family study of T2DM, a heritability of T2DM
was higher in early-onset than late-onset individuals (6). These observations indicate that
early-onset T2DM has a strong genetic component (6,49). Similar
to T2DM, early-onset forms of MetS (50,51),
hyperuricemia, and gout (52,53) have been shown to have strong genetic
components. Given that genetic contribution may be greater in
early-onset forms of T2DM, MetS, and hyperuricemia than in
late-onset forms, statistical power of the genetic association
study may be increased by focusing on early-onset subjects with
these conditions.
In the present study, we performed exome-wide
association studies (EWASs) with the use of human exome array-based
genotyping methods to identify genetic variants that confer
susceptibility to early-onset T2DM, MetS, or hyperuricemia in
Japanese patients. To increase the statistical power of EWASs,
early-onset subjects were examined.
Materials and methods
Study subjects
In previous studies, the median age of subjects with
T2DM (54), MetS (55), or hyperuricemia (56) was 68, 64, or 62 years, respectively.
We thus defined subjects aged ≤65 years as early-onset cases in the
present study. A total of 8,102 individuals aged ≤65 years were
examined. The subjects were recruited from individuals either who
visited outpatient clinics of or were admitted to participating
hospitals in Japan (Gifu Prefectural Tajimi Hospital, Tajimi; Gifu
Prefectural General Medical Center, Gifu; Japanese Red Cross Nagoya
First Hospital, Nagoya; Northern Mie Medical Center Inabe General
Hospital, Inabe; Hirosaki University Hospital and Hirosaki Stroke
and Rehabilitation Center, Hirosaki) because of various symptoms or
for an annual health checkup between October 2002 and March 2014;
or who were community-dwelling individuals recruited to a
population-based cohort study in Inabe between March 2010 and
september 2014 (57).
T2DM was defined according to the criteria of the
World Health Organization as described previously (2,58,59). Subjects with T2DM had an FPG level of
≥6.93 mmol/l (126 mg/dl) or a blood hemoglobin A1c
content of ≥6.5% or were taking antidiabetes medication.
Individuals with T1DM, maturity-onset diabetes of the young, DM
associated with mitochondrial diseases or single-gene disorders,
pancreatic diseases, or other metabolic or endocrinologic diseases
were excluded from the study. Those taking medications that may
cause secondary DM were also excluded. The control subjects had an
FPG level of <6.05 mmol/l (110 mg/dl), a blood hemoglobin
A1c content of <6.2%, and no history of DM or of
having taken antidiabetes medication. We thus examined 1,696
subjects with T2DM and 5,711 controls.
Diagnosis of MetS was based on a modified version of
the definition proposed by the International Diabetes Federation
Task Force on Epidemiology and Prevention; National Heart, Lung,
and Blood Institute; American Heart Association; World Heart
Federation; International Atherosclerosis Society; and
International Association for the Study of Obesity (22). We used cut-off values for waist
circumference of ≥90 cm in men or ≥80 cm in women on the basis of a
recommendation of the International Diabetes Association (22). A total of 2,296 subjects with MetS
thus had three or more of the following five components: i) A waist
circumference of ≥90 cm for men or ≥80 cm for women; ii) a serum
triglyceride concentration of ≥1.65 mmol/l (150 mg/dl) or drug
treatment for elevated triglycerides; iii) a serum HDL-cholesterol
concentration of <1.04 mmol/l (40 mg/dl) for men or <1.30
mmol/l (50 mg/dl) for women; iv) a systolic BP of ≥130 mmHg,
diastolic BP of ≥85 mmHg, or drug treatment for hypertension; and
v) an FPG level of ≥5.50 mmol/l (100 mg/dl) or drug treatment for
elevated glucose. History of obesity, dyslipidemia, hypertension,
or DM was evaluated with a detailed questionnaire. The control
subjects comprised 1,919 individuals who had none of the five
traits of MetS.
Hyperuricemia was defined as a serum uric acid
concentration of >416 µmol/l (7 mg/dl) or taking of uric
acid-lowering medication. Individuals taking drugs that potentially
caused secondary hyperuricemia were excluded. The control
individuals for the study of hyperuricemia had a serum uric acid
concentration of ≤416 µmol/l and had no history of hyperuricemia or
gout or of taking uric acid-lowering medication. Thus, we examined
1,365 subjects with hyperuricemia and 6,554 controls.
The 1,040 subjects with both T2DM and MetS as well
as 1,884 controls overlapped between the corresponding studies, as
did the 375 subjects with both T2DM and hyperuricemia and 4,809
controls as well as the 628 subjects with both MetS and
hyperuricemia and 1,771 controls.
EWASs
Venous blood (5–7 ml) was collected into tubes
containing 50 mmol/l ethylenediaminetetraacetic acid (disodium
salt), peripheral blood leukocytes were isolated, and genomic DNA
was extracted from these cells either with the use of a kit
(Genomix from Talent Srl, Trieste, Italy or SMITEST EX-R&D from
Medical & Biological Laboratories, Co., Ltd., Nagoya,
Japan).
The EWAS for T2DM, MetS, or hyperuricemia included
7,407 individuals (1,696 subjects with T2DM, 5,711 controls), 4,215
individuals (2,296 subjects with MetS, 1,919 controls), or 7,919
individuals (1,365 subjects with hyperuricemia, 6,554 controls),
respectively. The EWASs were performed with the use of a Human
Exome-12 v1.2 DNA Analysis BeadChip or Infinium Exome-24 v1.0
BeadChip (Illumina, San Diego, CA, USA). These exome arrays include
putative functional exonic variants selected from ~12,000
individual exome and whole-genome sequences. The exonic content
consisted of ~244,000 SNPs from diverse populations, including
European, African, Chinese, and Hispanic individuals (60). SNPs contained in only one exome array
(~2.6% of all SNPs) were excluded from analysis. We performed
quality control (61) as follows: i)
Genotyping data with a call rate of <97% were discarded, with
the mean call rate for the remaining data being 99.9%. ii) Sex
specification was checked for all the samples, and those for which
sex phenotype in the clinical records was inconsistent with genetic
sex were discarded. iii) Duplicated samples and cryptic relatedness
were checked by calculation of identity by descent, with all the
pairs of samples showing a value of >0.1875 being inspected and
one sample from each pair excluded. iv) Heterozygosity of SNPs was
calculated for all the samples, and those with extremely low or
high heterozygosity (>3 standard deviations from the mean) were
discarded. v) SNPs in sex chromosomes or mitochondrial DNA were
excluded from the analysis, as were non-polymorphic SNPs or SNPs
with a minor allele frequency of <1.0%. vi) SNPs whose genotype
distributions deviated significantly (P<0.01) from the
Hardy-Weinberg equilibrium in control individuals were discarded.
vii) Genotype data were examined for population stratification by
principal components analysis (62),
and population outliers were excluded. Totals of 31,210, 31,521, or
31,142 SNPs passed quality control for the T2DM, MetS, and
hyperuricemia studies, respectively, and were subjected to
analysis.
Statistical analysis
For analysis of characteristics of the study
subjects, quantitative or categorical data were compared between
individuals with T2DM, MetS, or hyperuricemia and corresponding
controls with the unpaired Student's t-test or Pearson's Chi-square
test, respectively. Allele frequencies were estimated by the gene
counting method, and Fisher's exact test was used to identify
departure from Hardy-Weinberg equilibrium. The relationship of
allele frequencies of SNPs to T2DM, MetS, or hyperuricemia in the
EWAS was examined using the Fisher's exact test. To compensate for
multiple comparisons of allele frequencies with T2DM, MetS, or
hyperuricemia, we applied Bonferroni's correction for statistical
significance of association. The significance level was set at
P<1.60×10⁻⁶ (0.05/31210), P<1.59×10⁻⁶
(0.05/31521), or P<1.61×10⁻⁶ (0.05/31142) for the
EWAS of T2DM, MetS, or hyperuricemia, respectively. The inflation
factor (λ) was 1.04 for T2DM, 1.05 for MetS, or 1.09 for
hyperuricemia. Multivariable logistic regression analysis was
performed with T2DM, MetS, hyperuricemia as a dependent variable
and independent variables including age, sex (0, woman; 1, man),
and genotype of each SNP. Genotypes of each SNP were assessed
according to dominant [0, AA; 1, AB + BB
(A, major allele; B, minor allele)], recessive (0,
AA + AB; 1, BB), and additive genetic models,
and the P-value, OR, and 95% confidence interval were calculated.
Additive models comprised additive 1 (0, AA; 1, AB;
0, BB) and additive 2 (0, AA; 0, AB; 1,
BB) scenarios, which were analyzed simultaneously with a
single statistical model. The relation of genotypes of identified
SNPs to T2DM-, MetS-, or hyperuricemia-related traits was examined
by one-way analysis of variance (ANOVA). Bonferroni's correction
was also applied to other statistical analysis as indicated.
Statistical tests were performed with JMP Genomics version 9.0
software (SAS Institute, Cary, NC, USA).
Results
Characteristics of subjects
The characteristics of the 7,407 subjects enrolled
in the T2DM study are shown in Table
I. Age, the frequency of men, and the prevalence of obesity,
hypertension, dyslipidemia, chronic kidney disease (CKD), and
hyperuricemia as well as body mass index (BMI), systolic and
diastolic BP, and serum concentrations of triglycerides,
creatinine, and uric acid were greater, whereas serum concentration
of HDL-cholesterol and estimated glomerular filtration rate (eGFR)
were lower, in subjects with T2DM than in controls.
 | Table I.Characteristics of subjects with type
2 diabetes mellitus and control individuals. |
Table I.
Characteristics of subjects with type
2 diabetes mellitus and control individuals.
| Characteristic | Control | Type 2 diabetes
mellitus | P-value |
|---|
| No. of
subjects | 5,711 | 1,696 |
|
| Age (years) |
50.4±10.2 | 56.3±7.2 | <0.0001 |
| Sex (men/women,
%) | 52.1/47.9 | 76.2/23.8 | <0.0001 |
| Smoking (%) | 40.0 | 47.5 |
0.0105 |
| Obesity (%) | 28.1 | 45.2 | <0.0001 |
| Body mass index
(kg/m2) | 22.9±3.3 | 24.7±3.9 | <0.0001 |
| Hypertension
(%) | 32.0 | 71.0 | <0.0001 |
| Systolic BP
(mmHg) | 122±20 | 140±27 | <0.0001 |
| Diastolic BP
(mmHg) |
75±13 |
80±15 | <0.0001 |
| Fasting plasma
glucose (mmol/l) |
5.17±0.48 |
8.95±3.77 | <0.0001 |
| Blood hemoglobin
A1c (%) |
5.48±0.31 |
7.33±1.87 | <0.0001 |
| Dyslipidemia
(%) | 54.4 | 80.2 | <0.0001 |
| Serum triglycerides
(mmol/l) |
1.29±0.89 |
1.82±1.47 | <0.0001 |
| Serum
HDL-cholesterol (mmol/l) |
1.62±0.46 |
1.32±0.43 | <0.0001 |
| Serum
LDL-cholesterol (mmol/l) |
3.14±0.82 |
3.15±0.97 |
0.8052 |
| Chronic kidney
disease (%) | 10.9 | 26.8 | <0.0001 |
| Serum creatinine
(µmol/l) |
70.4±63.1 |
93.1±122.6 | <0.0001 |
| eGFR (ml
min−1 1.73 m−2) |
78.4±18.9 |
73.2±24.6 | <0.0001 |
| Hyperuricemia
(%) | 14.5 | 22.9 | <0.0001 |
| Serum uric acid
(µmol/l) | 321±90 |
340±102 | <0.0001 |
Characteristics of the 4,215 subjects enrolled in
the MetS study are shown in Table
II. Age, the frequency of men, and the prevalence of smoking,
CKD, and hyperuricemia as well as BMI, blood hemoglobin
A1c content, and serum concentrations of low-density
lipoprotein (LDL) cholesterol, creatinine, and uric acid were
greater, whereas eGFR were lower, in subjects with MetS than in
controls.
| Table II.Characteristics of subjects with
metabolic syndrome and control individuals. |
Table II.
Characteristics of subjects with
metabolic syndrome and control individuals.
| Characteristic | Control | Metabolic
syndrome | P-value |
|---|
| No. of
subjects | 1,919 | 2,296 |
|
| Age (years) |
47.0±10.7 | 55.0±8.0 | <0.0001 |
| Sex (men/women,
%) | 42.3/57.7 | 67.9/32.1 | <0.0001 |
| Smoking (%) | 35.2 | 46.1 | <0.0001 |
| Waist circumference
(cm) | 74.0±6.0 | 88.3±9.0 | <0.0001 |
| Body mass index
(kg/m2) | 20.8±2.2 | 26.0±3.7 | <0.0001 |
| Systolic BP
(mmHg) | 109±11 | 140±25 | <0.0001 |
| Diastolic BP
(mmHg) | 67±9 |
83±14 | <0.0001 |
| Fasting plasma
glucose (mmol/l) |
4.97±0.36 |
7.25±3.07 | <0.0001 |
| Blood hemoglobin
A1c (%) |
5.39±0.29 |
6.58±1.60 | <0.0001 |
| Serum triglycerides
(mmol/l) |
0.82±0.30 |
2.17±1.46 | <0.0001 |
| Serum
HDL-cholesterol (mmol/l) |
1.86±0.42 |
1.24±0.37 | <0.0001 |
| Serum
LDL-cholesterol (mmol/l) |
2.95±0.74 |
3.28±0.96 | <0.0001 |
| Chronic kidney
disease (%) | 15.9 | 56.6 | <0.0001 |
| Serum creatinine
(µmol/l) |
63.0±18.2 |
84.4±97.5 | <0.0001 |
| eGFR (ml
min−1 1.73 m−2) |
81.6±17.0 |
73.3±23.5 | <0.0001 |
| Hyperuricemia
(%) | 5.2 | 28.0 | <0.0001 |
| Serum uric acid
(µmol/l) | 286±76 | 356±97 | <0.0001 |
Characteristics of the 7,919 subjects enrolled in
the hyperuricemia study are shown in Table III. Age, the frequency of men, and
the prevalence of smoking, obesity, hypertension, DM, dyslipidemia,
and CKD as well as BMI, systolic and diastolic BP, FPG level, and
serum concentrations of triglycerides and creatinine were greater,
whereas the serum concentration of HDL-cholesterol and eGFR were
lower, in subjects with hyperuricemia than in controls.
| Table III.Characteristics of subjects with
hyperuricemia and control individuals. |
Table III.
Characteristics of subjects with
hyperuricemia and control individuals.
| Characteristic | Control | Hyperuricemia | P-value |
|---|
| No. of
subjects | 6,554 | 1,365 |
|
| Age (years) | 51.5±9.9 | 52.9±9.1 | <0.0001 |
| Sex (men/women,
%) | 52.6/47.4 | 90.2/9.8 | <0.0001 |
| Smoking (%) | 38.3 | 61.6 | <0.0001 |
| Obesity (%) | 30.0 | 47.4 | <0.0001 |
| Body mass index
(kg/m2) | 23.2±3.5 | 24.8±3.8 | <0.0001 |
| Hypertension
(%) | 38.2 | 62.0 | <0.0001 |
| Systolic BP
(mmHg) | 126±23 | 134±24 | <0.0001 |
| Diastolic BP
(mmHg) |
75±14 |
82±15 | <0.0001 |
| Diabetes mellitus
(%) | 20.8 | 31.6 | <0.0001 |
| Fasting plasma
glucose (mmol/l) |
6.04±2.38 |
6.25±2.27 |
0.0022 |
| Blood hemoglobin
A1c (%) |
5.96±1.26 |
6.10±1.28 |
0.0042 |
| Dyslipidemia
(%) | 57.9 | 79.0 | <0.0001 |
| Serum triglycerides
(mmol/l) |
1.34±0.99 |
1.90±1.38 | <0.0001 |
| Serum
HDL-cholesterol (mmol/l) |
1.57±0.47 |
1.37±0.42 | <0.0001 |
| Serum
LDL-cholesterol (mmol/l) |
3.15±0.85 |
3.20±0.93 |
0.0506 |
| Chronic kidney
disease (%) | 11.0 | 33.0 | <0.0001 |
| Serum creatinine
(µmol/l) |
68.7±52.3 |
109.4±150.3 | <0.0001 |
| eGFR (ml
min−1 1.73 m−2) |
79.2±18.3 |
67.4±25.8 | <0.0001 |
| Serum uric acid
(µmol/l) | 296±67 | 455±78 | <0.0001 |
EWAS for T2DM, MetS, or
hyperuricemia
We examined the relationship of allele frequencies
of 31,210 SNPs that passed quality control to T2DM with the use of
Fisher's exact test. After Bonferroni's correction, four SNPs were
significantly (P<1.60×10⁻⁶) associated with T2DM
(Table IV). The relationship of
allele frequencies of 31,521 SNPs to MetS was examined with
Fisher's exact test. After Bonferroni's correction, six SNPs were
significantly (P<1.59×10⁻⁶) associated with MetS
(Table V). The relationship of allele
frequencies of 31,142 SNPs to hyperuricemia was also examined with
Fisher's exact test. After Bonferroni's correction, nine SNPs were
significantly (P<1.61×10⁻⁶) associated with
hyperuricemia (Table VI).
| Table IV.The four SNPs significantly
(P<1.60×10⁻⁶) associated with type 2 diabetes
mellitus in the exome-wide association study. |
Table IV.
The four SNPs significantly
(P<1.60×10⁻⁶) associated with type 2 diabetes
mellitus in the exome-wide association study.
| Gene | SNP | Nucleotide
substitutiona | Amino acid
substitution | Chromosome | Position | MAF (%) | Allele odds
ratio | P-value (allele
frequency) |
|---|
| OR4F6 | rs141569282 | G/A | A117T | 15 | 101806068 |
1.7 |
0.29 |
2.45×10⁻¹² |
| ZNF860 | rs140232911 | C/T | S161L | 3 | 31989561 | 10.4 |
3.67 |
1.25×10⁻⁸ |
| LPGAT1 | rs150552771 | T/C | K200E | 1 | 211783358 |
5.0 | 20.00 |
2.08×10⁻⁸ |
| KRR1 | rs17115182 | G/A | P43S | 12 | 75508405 |
7.0 |
3.57 |
8.08×10⁻⁷ |
| Table V.The six SNPs significantly
(P<1.59×10⁻⁶) associated with metabolic syndrome in
the exome-wide association study. |
Table V.
The six SNPs significantly
(P<1.59×10⁻⁶) associated with metabolic syndrome in
the exome-wide association study.
| Gene | SNP | Nucleotide
substitutiona | Amino acid
substitution | Chromosome | Position | MAF (%) | Allele odds
ratio | P-value (allele
frequency) |
|---|
| CCDC6 | rs1053266 | A/C | T470P | 10 | 59792934 | 28.6 | 2.33 |
3.18×10−52 |
| APOA5 | rs2075291 | G/T | G185C | 11 | 116790676 |
7.3 | 1.72 |
3.94×10⁻¹¹ |
| OR4F6 | rs141569282 | G/A | A117T | 15 | 101806068 |
1.7 | 0.34 |
1.35×10⁻¹⁰ |
|
HLA-DQB2 | rs200716952 | C/T | A167T | 6 | 32758997 |
2.5 | 0.47 |
2.15×10⁻¹⁰ |
| OR52E4 | rs11823828 | T/G | F227L | 11 | 5884973 | 36.6 | 1.27 |
7.99×10⁻⁷ |
|
| rs17482753 | G/T |
| 8 | 19975135 | 12.6 | 0.73 |
1.55×10⁻⁶ |
| Table VI.The nine SNPs significantly
(P<1.61×10⁻⁶) associated with hyperuricemia in the
exome-wide association study. |
Table VI.
The nine SNPs significantly
(P<1.61×10⁻⁶) associated with hyperuricemia in the
exome-wide association study.
| Gene | SNP | Nucleotide
substitutiona | Amino acid
substitution | Chromosome | Position | MAF (%) | Allele odds
ratio | P-value (allele
frequency) |
|---|
|
SLC22A12 | rs121907892 | G/A | W224* | 11 | 64593747 |
2.4 | 0.07 |
3.13×10⁻²⁴ |
| BRAP | rs3782886 | A/G |
| 12 | 111672685 | 29.3 | 0.73 |
1.78×10⁻¹¹ |
| ACAD10 | rs11066015 | G/A |
| 12 | 111730205 | 27.5 | 0.73 |
7.72×10⁻¹¹ |
| HECTD4 | rs11066280 | T/A |
| 12 | 112379979 | 29.0 | 0.75 |
1.36×10⁻⁹ |
|
| rs12229654 | T/G |
| 12 | 110976657 | 22.5 | 0.74 |
1.83×10⁻⁹ |
| SLC2A9 | rs3775948 | G/C |
| 4 | 9993558 | 42.4 | 0.80 |
1.49×10⁻⁷ |
| HERPUD2 | rs2305335 | T/A | L200H | 7 | 35638368 |
1.6 | 2.13 |
2.63×10⁻⁷ |
| CCDC63 | rs10774610 | T/C |
| 12 | 110902439 | 23.7 | 0.78 |
1.14×10⁻⁶ |
| CCDC63 | rs10849915 | T/C |
| 12 | 110895818 | 23.6 | 0.78 |
1.23×10⁻⁶ |
Multivariable logistic regression
analysis of the relationship of SNPs to T2DM, MetS, or
hyperuricemia
The relationship of the four identified SNPs in the
EWAS of T2DM to this condition was further examined by
multivariable logistic regression analysis with adjustment for age
and sex (Table VII). Three SNPs
(rs141569282 of OR4F6, rs140232911 of ZNF860,
rs150552771 of LPGAT1) were significantly [P<0.0031
(0.05/16) in at least one genetic model] related to T2DM. The
relationship of the six SNPs identified in the EWAS for MetS to
this condition was examined by multivariable logistic regression
analysis with adjustment for age and sex (Table VIII). All the SNPs were
significantly [P<0.0021 (0.05/24)] related to MetS. The
relationship of the 9 SNPs identified by the EWAS of hyperuricemia
to this condition was also examined by multivariable logistic
regression analysis with adjustment for age and sex (Table IX). All SNPs were significantly
[P<0.0014 (0.05/36)] related to hyperuricemia.
| Table VII.Association of SNPs to type 2
diabetes mellitus as determined by multivariable logistic
regression analysis. |
Table VII.
Association of SNPs to type 2
diabetes mellitus as determined by multivariable logistic
regression analysis.
|
|
|
| Dominant | Recessive | Additive 1 | Additive 2 |
|---|
|
|
|
|
|
|
|
|
|---|
| Gene | SNP |
| P-value | OR | 95% CI | P-value | OR | 95% CI | P-value | OR | 95% CI | P-value | OR | 95% CI |
|---|
| OR4F6 | rs141569282 | G/A | <0.0001 |
0.31 | 0.21–0.47 |
|
|
| <0.0001 |
0.31 | 0.21–0.47 |
|
|
|
| ZNF860 | rs140232911 | C/T |
0.0005 |
2.26 | 1.43–3.59 |
|
|
|
0.0005 |
2.26 | 1.43–3.59 |
|
|
|
| LPGAT1 | rs150552771 | T/C |
0.0001 | 12.09 |
3.40–43.00 |
|
|
|
0.0001 | 12.09 |
3.40–43.00 |
|
|
|
| Table VIII.Relation of SNPs to metabolic
syndrome as determined by multivariable logistic regression
analysis. |
Table VIII.
Relation of SNPs to metabolic
syndrome as determined by multivariable logistic regression
analysis.
|
|
|
| Dominant | Recessive | Additive 1 | Additive 2 |
|---|
|
|
|
|
|
|
|
|
|---|
| Gene | SNP |
| P-value | OR | 95% CI | P-value | OR | 95% CI | P-value | OR | 95% CI | P-value | OR | 95% CI |
|---|
| CCDC6 | rs1053266 | A/C | <0.0001 | 1.97 | 1.70–2.28 | <0.0001 | 2.73 | 1.96–3.78 | <0.0001 | 1.79 | 1.53–2.09 | <0.0001 | 3.28 | 2.36–4.57 |
| APOA5 | rs2075291 | G/T | <0.0001 | 1.85 | 1.51–2.25 |
0.1335 |
|
| <0.0001 | 1.84 | 1.50–2.25 |
0.0947 |
|
|
| OR4F6 | rs141569282 | G/A | <0.0001 | 0.37 | 0.25–0.54 |
|
|
| <0.0001 | 0.37 | 0.25–0.54 |
|
|
|
|
HLA-DQB2 | rs200716952 | C/T | <0.0001 | 0.58 | 0.44–0.76 |
|
|
| <0.0001 | 0.58 | 0.44–0.76 |
|
|
|
| OR52E4 | rs11823828 | T/G | 0.0177 | 1.19 | 1.03–1.37 | <0.0001 | 1.76 | 1.43–2.17 |
0.6181 |
|
| <0.0001 | 1.80 | 1.44–2.24 |
|
| rs17482753 | G/T | 0.0003 | 0.74 | 0.63–0.87 |
0.5086 |
|
|
0.0003 | 0.74 | 0.63–0.87 |
0.3690 |
|
|
| Table IX.Association of SNPs to hyperuricemia
as determined by multivariable logistic regression analysis. |
Table IX.
Association of SNPs to hyperuricemia
as determined by multivariable logistic regression analysis.
|
|
|
| Dominant | Recessive | Additive 1 | Additive 2 |
|---|
|
|
|
|
|
|
|
|
|---|
| Gene | SNP |
| P-value | OR | 95% CI | P-value | OR | 95% CI | P-value | OR | 95% CI | P-value | OR | 95% CI |
|---|
|
SLC22A12 | rs121907892 | G/A | <0.0001 | 0.06 | 0.03–0.14 |
0.9959 |
|
| <0.0001 | 0.06 | 0.03–0.14 |
0.9959 |
|
|
| BRAP | rs3782886 | A/G | <0.0001 | 0.66 | 0.58–0.74 | <0.0001 | 0.53 | 0.42–0.67 | <0.0001 | 0.71 | 0.62–0.81 | <0.0001 | 0.45 | 0.36–0.58 |
| ACAD10 | rs11066015 | G/A | <0.0001 | 0.66 | 0.58–0.75 | <0.0001 | 0.51 | 0.40–0.66 | <0.0001 | 0.72 | 0.63–0.82 | <0.0001 | 0.45 | 0.35–0.57 |
| HECTD4 | rs11066280 | T/A | <0.0001 | 0.69 | 0.61–0.78 | <0.0001 | 0.53 | 0.42–0.67 | <0.0001 | 0.75 | 0.66–0.86 | <0.0001 | 0.47 | 0.37–0.60 |
|
| rs12229654 | T/G | <0.0001 | 0.69 | 0.61–0.78 | <0.0001 | 0.47 | 0.34–0.64 | <0.0001 | 0.74 | 0.65–0.84 | <0.0001 | 0.42 | 0.31–0.58 |
| SLC2A9 | rs3775948 | G/C | <0.0001 | 0.77 | 0.68–0.88 | <0.0001 | 0.67 | 0.57–0.80 |
0.0109 | 0.84 | 0.73–0.96 | <0.0001 | 0.61 | 0.50–0.73 |
| HERPUD2 | rs2305335 | T/A | <0.0001 | 1.89 | 1.40–2.53 |
0.4553 |
|
| <0.0001 | 1.88 | 1.40–2.52 |
0.4345 |
|
|
| CCDC63 | rs10774610 | T/C | <0.0001 | 0.71 | 0.62–0.80 |
0.0048 | 0.67 | 0.51–0.89 | <0.0001 | 0.73 | 0.64–0.83 |
0.0003 | 0.60 | 0.45–0.79 |
| CCDC63 | rs10849915 | T/C | <0.0001 | 0.71 | 0.62–0.80 |
0.0036 | 0.66 | 0.50–0.87 | <0.0001 | 0.73 | 0.64–0.83 |
0.0002 | 0.59 | 0.44–0.78 |
Relationship of SNPs associated with
T2DM to FPG level or blood hemoglobin A1c content
We examined the relationship of genotypes for the 3
SNPs associated with T2DM to FPG level or blood hemoglobin
A1c content by one-way ANOVA (Table X). A SNP rs141569282 of OR4F6
was significantly [P<0.0083 (0.05/6)] associated with FPG level
and blood hemoglobin A1c content, and rs140232911 of
ZNF860 with blood hemoglobin A1c content.
| Table X.Relation of SNPs identified in the
present study to fasting plasma glucose level and blood hemoglobin
A1c content. |
Table X.
Relation of SNPs identified in the
present study to fasting plasma glucose level and blood hemoglobin
A1c content.
| Gene | SNP | Pasting plasma
glucose (mmol/l) | P-value | Blood hemoglobin
A1c (%) | P-value |
|---|
| OR4F6 | rs141569282 | G/A | GG | GA |
<0.0001 | GG | GA |
<0.0001 |
|
|
|
| 6.26±2.76 | 5.35±0.71 |
| 6.15±1.46 | 5.57±0.43 |
|
| ZNF860 | rs140232911 | C/T | CC | CT |
0.6279 | CC | CT |
0.0070 |
|
|
|
| 6.06±2.46 | 6.25±1.97 |
| 5.52±0.73 | 6.00±1.32 |
|
| LPGAT1 | rs150552771 | T/C | TT | TC |
0.6320 | TT | TC |
0.3280 |
|
|
|
| 6.05±2.45 | 6.63±3.88 |
| 5.35±0.53 | 5.99±1.31 |
|
Relationship of SNPs associated with
MetS to each trait of MetS
We examined the relationship of genotypes for the
six SNPs associated with MetS to waist circumference, serum
concentrations of triglycerides and HDL-cholesterol, systolic and
diastolic BP, and FPG level by one-way ANOVA (Table XI). Three SNPs (rs1053266 of
CCDC6, rs141569282 of OR4F6, rs200716952 of
HLA-DQB2) were significantly (P<0.0014) related to all
the traits; rs2075291 of APOA5 to waist circumference and
serum concentrations of triglycerides and HDL-cholesterol;
rs11823828 of OR52E4 to serum concentrations of
triglycerides and HDL-cholesterol, systolic BP, and FPG level; and
rs17482753 at chromosome 8p21.3 to serum concentrations of
triglycerides and HDL-cholesterol.
| Table XI.Relationship of SNPs identified in
the present study to each trait of metabolic syndrome. |
Table XI.
Relationship of SNPs identified in
the present study to each trait of metabolic syndrome.
| Gene | SNP | Waist circumference
(cm) | P-value |
|---|
| CCDC6 | rs1053266 | A/C | AA | AC | CC |
<0.0001 |
|
|
|
| 81.0±10.6 | 83.8±10.4 | 87.0±8.6 |
|
| APOA5 | rs2075291 | G/T | GG | GT | TT | 0.0012 |
|
|
|
| 82.0±10.6 | 83.7±10.3 | 82.8±10.3 |
|
| OR4F6 | rs141569282 | G/A | GG | GA |
|
<0.0001 |
|
|
|
| 83.2±10.4 | 79.1±10.8 |
|
|
|
HLA-DQB2 | rs200716952 | C/T | CC | CT |
|
<0.0001 |
|
|
|
| 82.5±10.5 | 79.5±10.7 |
|
|
| OR52E4 | rs11823828 | T/G | TT | TG | GG |
0.0159 |
|
|
|
| 81.8±10.8 | 81.8±10.8 | 83.2±10.3 |
|
|
| rs17482753 | G/T | GG | GT | TT |
0.0070 |
|
|
|
| 82.5±10.7 | 81.3±10.3 | 83.2±10.9 |
|
|
| Gene | SNP | Serum
triglycerides (mmol/l) | P-value |
|
| CCDC6 | rs1053266 | A/C | AA | AC | CC |
<0.0001 |
|
|
|
| 1.45±1.21 | 1.79±1.46 | 2.13±1.33 |
|
| APOA5 | rs2075291 | G/T | GG | GT | TT |
<0.0001 |
|
|
|
| 1.51±1.15 | 2.06±1.84 | 2.71±2.63 |
|
| OR4F6 | rs141569282 | G/A | GG | GA |
|
<0.0001 |
|
|
|
| 1.71±1.38 | 1.19±1.00 |
|
|
|
HLA-DQB2 | rs200716952 | C/T | CC | CT |
|
<0.0001 |
|
|
|
| 1.62±1.32 | 1.26±1.11 |
|
|
| OR52E4 | rs11823828 | T/G | TT | TG | GG |
0.0003 |
|
|
|
| 1.52±1.22 | 1.49±1.15 | 1.74±1.41 |
|
|
| rs17482753 | G/T | GG | GT | TT |
<0.0001 |
|
|
|
| 1.65±1.32 | 1.41±1.22 | 1.55±1.72 |
|
|
| Gene | SNP | Serum
HDL-cholesterol (mmol/l) | P-value |
|
| CCDC6 | rs1053266 | A/C | AA | AC | CC |
<0.0001 |
|
|
|
| 1.59±0.49 | 1.39±0.48 | 1.17±0.35 |
|
| APOA5 | rs2075291 | G/T | GG | GT | TT |
<0.0001 |
|
|
|
| 1.53±0.50 | 1.38±0.48 | 1.28±0.43 |
|
| OR4F6 | rs141569282 | G/A | GG | GA |
|
<0.0001 |
|
|
|
| 1.44±0.49 | 1.72±0.42 |
|
|
|
HLA-DQB2 | rs200716952 | C/T | CC | CT |
|
<0.0001 |
|
|
|
| 1.49±0.47 | 1.69±0.47 |
|
|
| OR52E4 | rs11823828 | T/G | TT | TG | GG |
0.0001 |
|
|
|
| 1.54±0.49 | 1.54±0.51 | 1.44±0.47 |
|
|
| rs17482753 | G/T | GG | GT | TT |
<0.0001 |
|
|
|
| 1.48±0.49 | 1.58±0.53 | 1.62±0.52 |
|
|
| Gene | SNP | Systolic blood
pressure (mmHg) | P-value |
|
| CCDC6 | rs1053266 | A/C | AA | AC | CC |
<0.0001 |
|
|
|
| 122±22 | 134±28 | 145±26 |
|
| APOA5 | rs2075291 | G/T | GG | GT | TT |
0.0493 |
|
|
|
| 127±25 | 130±24 | 132±30 |
|
| OR4F6 | rs141569282 | G/A | GG | GA |
|
<0.0001 |
|
|
|
| 131±27 | 115±16 |
|
|
|
HLA-DQB2 | rs200716952 | C/T | CC | CT |
|
<0.0001 |
|
|
|
| 128±26 | 117±17 |
|
|
| OR52E4 | rs11823828 | T/G | TT | TG | GG |
<0.0001 |
|
|
|
| 125±24 | 126±25 | 130±25 |
|
|
| rs17482753 | G/T | GG | GT | TT |
0.0616 |
|
|
|
| 128±25 | 126±25 | 130±23 |
|
|
| Gene | SNP | Diastolic blood
pressure (mmHg) | P-value |
|
| CCDC6 | rs1053266 | A/C | AA | AC | CC |
<0.0001 |
|
|
|
| 75±14 | 79±16 | 82±16 |
|
| APOA5 | rs2075291 | G/T | GG | GT | TT |
0.0055 |
|
|
|
| 76±15 | 78±14 | 80±13 |
|
| OR4F6 | rs141569282 | G/A | GG | GA |
|
<0.0001 |
|
|
|
| 78±15 | 71±13 |
|
|
|
HLA-DQB2 | rs200716952 | C/T | CC | CT |
|
0.0002 |
|
|
|
| 77±15 | 73±13 |
|
|
| OR52E4 | rs11823828 | T/G | TT | TG | GG |
0.5502 |
|
|
|
| 76±15 | 76±15 | 76±14 |
|
|
| rs17482753 | G/T | GG | GT | TT |
0.3685 |
|
|
|
| 76±15 | 76±15 | 77±14 |
|
|
| Gene | SNP | Fasting plasma
glucose (mmol/l) | P-value |
|
| CCDC6 | rs1053266 | A/C | AA | AC | CC |
<0.0001 |
|
|
|
| 5.90±2.05 | 6.90±3.33 | 7.41±3.02 |
|
| APOA5 | rs2075291 | G/T | GG | GT | TT |
0.2227 |
|
|
|
| 6.25±2.57 | 6.46±2.77 | 6.15±1.77 |
|
| OR4F6 | rs141569282 | G/A | GG | GA |
|
<0.0001 |
|
|
|
| 6.53±2.87 | 5.34±0.76 |
|
|
|
HLA-DQB2 | rs200716952 | C/T | CC | CT |
|
<0.0001 |
|
|
|
| 6.36±2.67 | 5.41±1.05 |
|
|
| OR52E4 | rs11823828 | T/G | TT | TG | GG |
0.0001 |
|
|
|
| 6.09±2.32 | 6.07±2.30 | 6.57±2.95 |
|
|
| rs17482753 | G/T | GG | GT | TT |
0.0048 |
|
|
|
| 6.35±2.63 | 6.03±2.42 | 6.55±2.78 |
|
Relationship of SNPs associated with
hyperuricemia to serum concentrations of uric acid
We examined the relationship of the 9 SNPs
associated with hyperuricemia to serum concentrations of uric acid
by one-way ANOVA (Table XII). Seven
SNPs (rs121907892 of SLC22A12, rs3782886 of BRAP,
rs11066015 of ACAD10, rs11066280 of HECTD4,
rs12229654 at chromosome 12q24.1, rs3775948 of SLC2A9,
rs2305335 of HERPUD2) were significantly (P<0.0056)
associated with serum concentrations of uric acid.
| Table XII.Relationship of SNPs identified in
the present study to the serum concentration of uric acid. |
Table XII.
Relationship of SNPs identified in
the present study to the serum concentration of uric acid.
| Gene | SNP | Serum uric acid
(µmol/l) | P-value |
|---|
|
SLC22A12 | rs121907892 | G/A | GG | GA | AA |
<0.0001 |
|
|
|
| 333±91 | 231±82 | 52±19 |
|
| BRAP | rs3782886 | A/G | AA | AG | GG |
0.0002 |
|
|
|
| 332±97 | 324±91 | 318±88 |
|
| ACAD10 | rs11066015 | G/A | GG | GA | AA |
0.0004 |
|
|
|
| 332±97 | 324±91 | 319±88 |
|
| HECTD4 | rs11066280 | T/A | TT | TA | AA |
0.0006 |
|
|
|
| 332±96 | 325±92 | 318±87 |
|
|
| rs12229654 | T/G | TT | TG | GG |
0.0002 |
|
|
|
| 331±96 | 326±91 | 312±84 |
|
| SLC2A9 | rs3775948 | G/C | GG | GC | CC |
<0.0001 |
|
|
|
| 335±94 | 328±92 | 312±96 |
|
| HERPUD2 | rs2305335 | T/A | TT | TA | AA |
<0.0001 |
|
|
|
| 327±93 | 358±116 | 407±88 |
|
| CCDC63 | rs10774610 | T/C | TT | TC | CC |
0.0067 |
|
|
|
| 330±96 | 325±91 | 318±92 |
|
| CCDC63 | rs10849915 | T/C | TT | TC | CC |
0.0083 |
|
|
|
| 330±96 | 325±91 | 318±92 |
|
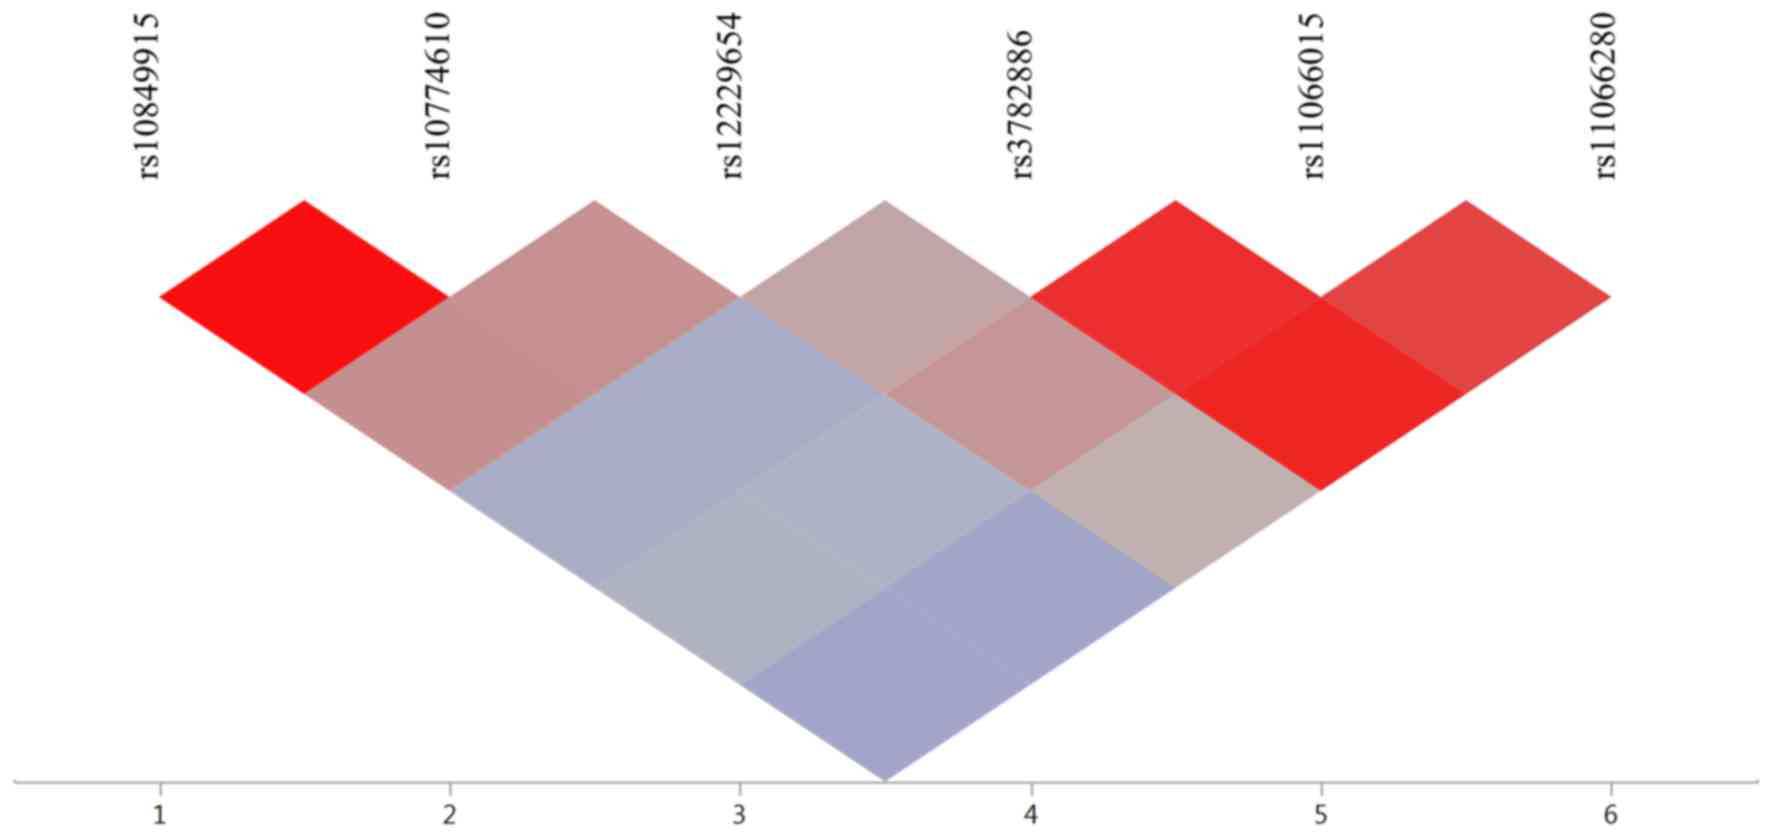
Linkage disequilibrium (LD)
analyses
We examined LD in SNPs associated with MetS or
hyperuricemia. For the MetS study, rs11823828 of OR52E4 and
rs2075291 of APOA5 were not in LD [square of the correlation
coefficient (r2)<0.001]. For the hyperuricemia study,
6 SNPs were located at chromosomal 12q24.11 to 12q24.13. LD plots
of these SNPs are shown in Fig. 1.
Strong LD was observed between rs10849915 and rs10774610 of
CCDC63 (r2, 0.991) and among rs3782886 of
BRAP, rs11066015 of ACAD10, and rs11066280 of
HECTD4 (r2, 0.876 to 0.941).
Relation of genes, chromosomal loci, and SNPs
identified in the present study to phenotypes reported by previous
GWASs. We examined the genes, chromosomal loci, and SNPs identified
in the present study to phenotypes previously reported by GWASs
available in Genome-Wide Repository of Associations Between SNPs
and Phenotypes (GRASP) Search database (https://grasp.nhlbi.nih.gov/Search.aspx) developed by
the Information Technology and Applications Center, National Center
for Biotechnology Information, National Heart, Lung, and Blood
Institute, National Institute of Health (Bethesda, MD, USA).
In the T2DM study, none of the three genes or SNPs
was shown to be associated with T2DM or diabetes-related traits in
previous GWASs (Table XIII). In
the MetS study, HLA-DQB2 was shown to be related to T1DM and
plasma total cholesterol; rs17482753 at chromosome 8p21.3 to plasma
concentrations of triglycerides and HDL-cholesterol; CCDC6
to serum uric acid level; and APOA5 to plasma concentrations
of triglycerides, HDL-cholesterol, and LDL-cholesterol (Table XIV). In the hyperuricemia study,
SLC2A9, SLC22A12, and BRAP were shown to be related
to serum uric acid concentrations; rs12229654 at 12q24.1 to plasma
HDL-cholesterol; ACAD10 to plasma LDL-cholesterol and T1DM;
and HECTD4 to plasma HDL-cholesterol and LDL-cholesterol and
FPG level (Table XV).
| Table XIII.Relationship of genes and SNPs
associated with type 2 diabetes mellitus in the present study to
previously reported diabetes-related phenotypes. |
Table XIII.
Relationship of genes and SNPs
associated with type 2 diabetes mellitus in the present study to
previously reported diabetes-related phenotypes.
| Gene | SNP | Chromosome | Position | Previously reported
phenotypes |
|---|
| LPGAT1 | rs150552771 | 1 | 211783358 | None |
| ZNF860 | rs140232911 | 3 | 31989561 | None |
| OR4F6 | rs141569282 | 15 | 101806068 | None |
| Table XIV.Relationship of genes, chromosomal
locus, and SNPs associated with metabolic syndrome in the present
study to previously reported metabolic disease-related
phenotypes. |
Table XIV.
Relationship of genes, chromosomal
locus, and SNPs associated with metabolic syndrome in the present
study to previously reported metabolic disease-related
phenotypes.
| Gene/chr.
locus | SNP | Chr. | Position | Previously reported
phenotypes |
|---|
|
HLA-DQB2 | rs200716952 | 6 | 32758997 | Type 1 diabetes
(17554300, 17632545), total cholesterol (20686565) |
| 8p21.3 | rs17482753 | 8 | 19975135 | Triglycerides
(20686565, 23063622, 19060906, 18193043, 21943158, 18179892,
19913121, 17463246), HDL-cholesterol (20686565, 23063622, 19060906,
21943158, 20031538, 20370913, 20339536, 19913121) |
| CCDC6 | rs1053266 | 10 | 59792934 | Serum urate
(23263486) |
| OR52E4 | rs11823828 | 11 | 5884973 | None |
| APOA5 | rs2075291 | 11 | 116790676 | Triglycerides
(20686565, 23063622, 22629316, 19060906, 21943158, 19913121,
18193043, 19802338, 23505323, 23236364, 21386085, 19197348),
HDL-cholesterol (23063622, 22629316, 20686565, 21386085, 19913121,
23236364), LDL-cholesterol (20686565, 19913121), total cholesterol
(20686565, 23063622, 20339536, 18179892) |
| OR4F6 | rs141569282 | 15 | 101806068 | None |
| Table XV.Relationship of genes, chromosomal
locus, and SNPs associated with hyperuricemia in the present study
to previously reported metabolic disease-related phenotypes. |
Table XV.
Relationship of genes, chromosomal
locus, and SNPs associated with hyperuricemia in the present study
to previously reported metabolic disease-related phenotypes.
| Gene/chr.
locus | SNP | Chr. | Position | Previously reported
phenotypes |
|---|
| SLC2A9 | rs3775948 | 4 | 9993558 | Serum urate
(23263486) |
| HERPUD2 | rs2305335 | 7 | 35638368 | None |
|
SLC22A12 | rs121907892 | 11 | 64593747 | Serum urate
(20139978, 23263486, 21768215, 20884846, 19503597) |
| CCDC63 | rs10849915 | 12 | 110895818 | None |
|
| rs10774610 | 12 | 110902439 | None |
| 12q24.1 | rs12229654 | 12 | 110976657 | HDL-cholesterol
(21909109) |
| BRAP | rs3782886 | 12 | 111672685 | Serum urate
(23263486) |
| ACAD10 | rs11066015 | 12 | 111730205 | LDL-cholesterol
(20686565), type 1 diabetes (17554300) |
| HECTD4 | rs11066280 | 12 | 112379979 | HDL-cholesterol
(21572416, 21909109, 22751097), LDL-cholesterol (21572416,
20686565), fasting blood glucose (23575436) |
Discussion
T2DM, MetS, and hyperuricemia are important public
health problems because of the high prevalence of these conditions
as well as risk factors for more serious conditions such as
cardiovascular disease, cancer, or gout (1,3,4,23,24,33–35).
Identification of genetic variants that confer susceptibility to
T2DM, MetS, and hyperuricemia are thus clinically important to
prevent these conditions. We have now performed EWASs for T2DM,
MetS, and hyperuricemia in early-onset subjects with these
conditions who likely had greater genetic components compared with
late-onset individuals.
In the T2DM study, rs150552771 of LPGAT1,
rs140232911 of ZNF860, and rs141569282 of OR4F6 were
significantly associated with early-onset T2DM. None of these genes
was shown to be associated with T2DM or diabetes-related traits in
the previous GWASs. Given that rs150552771 of LPGAT1 was not
related to FPG level or blood hemoglobin A1c content,
LPGAT1 was removed from new susceptibility locus, even
though this discrepancy may be attributable to the effect of
medical treatment for T2DM. We have thus newly identified
ZNF860 and OR4F6 as susceptibility loci for T2DM. A
SNP rs141569282 of OR4F6 was significantly related to FPG
level and blood hemoglobin A1c content with the minor
A allele being related to decreases in these parameters,
while rs140232911 of ZNF860 was related to blood hemoglobin
A1c content with the minor T allele being related
to an increase in this parameter. Analyses of these traits as well
as logistic regression analysis indicate that the A allele
of rs141569282 in OR4F6 is protective against T2DM, whereas
the T allele of rs140232911 in ZNF860 is a risk
factor for this condition.
In the MetS study, six SNPs in five genes and one
chromosomal locus were significantly associated with early-onset
MetS. Of these genes and locus, HLA-DQB2 (63), rs17482753 at 8p21.3 (63), and APOA5 (63) were previously shown to be related to
lipid profiles; and CCDC6 to serum uric acid level (46). OR52E4 or OR4F6 has not
been shown to be associated with MetS or MetS-related traits in the
previous GWASs. A SNP rs11823828 of OR52E4 was significantly
related to serum concentrations of triglycerides and
HDL-cholesterol, systolic BP, and FPG level; and rs141569282 of
OR4F6 to all traits. We have thus newly identified
OR52E4 and OR4F6 as susceptibility loci for MetS. The
minor G allele of rs11823828 in OR52E4 was
significantly related to increased serum triglycerides, decreased
serum HDL-cholesterol, increased systolic BP, and increased FPG
level, whereas the minor A allele of rs141569282 in
OR4F6 was related to reduced waist circumference, decreased
serum triglycerides, increased serum HDL-cholesterol, decreased
systolic and diastolic BP, and reduced FPG level. Analyses of these
traits and logistic regression analysis indicate that the G
allele of rs11823828 in OR52E4 represents a risk factor for
MetS, whereas the A allele of rs141569282 in OR4F6 is
protective against this condition.
In the hyperuricemia study, 9 SNPs in seven genes
and one chromosomal locus were significantly associated with
early-onset hyperuricemia. Of these genes and locus, SLC2A9
(46), SLC22A12 (46), and BRAP (46) were previously shown to be related to
serum uric acid level; and rs12229654 at 12q24.1 (64), ACAD10 (63), and HECTD4 (63) to lipid profiles. HERPUD2 or
CCDC63 has not been shown to be associated with
hyperuricemia, gout, or serum uric acid level in the previous
GWASs. A SNP rs2305335 of HERPUD2 was significantly related
to the serum uric acid level, whereas two SNPs of CCDC63
were not related to this parameter. Therefore CCDC63 was
removed from new loci. We have thus newly identified HERPUD2
as a susceptibility locus for hyperuricemia. The minor A
allele of rs2305335 in HERPUD2 was significantly related to
increased serum uric acid. Examination of this trait and logistic
regression analysis indicate that the A allele of rs2305335
in HERPUD2 represents a risk factor or hyperuricemia.
Furthermore, OR4F6 was significantly associated with both
T2DM and MetS. We thus newly identified four genes (ZNF860,
OR4F6, OR52E4, HERPUD2) that confer susceptibility to
early-onset T2DM, MetS, or hyperuricemia.
We previously showed that four, five, or three SNPs
were related to T2DM (P<1.44×10⁻⁴), MetS (P<0.05),
or hyperuricemia (P<0.05) determined by multivariable logistic
regression analysis with adjustment for age and sex after the
initial EWAS screening of allele frequencies in both early-onset
and late-onset individuals with these conditions (54–56). The
relationship of two of four SNPs [rs138313632
(P=1.11×10⁻⁷), rs139012426 (P=4.29×10⁻⁵)] to
T2DM were replicated (P<0.05) in the present study. The
relationship of two of five SNPs [rs1007732 (P=0.0405), rs7350481
(P=3.17×10⁻⁵)] to MetS were replicated in the present
study. The relationship of two of three SNPs [rs115445569
(P=0.0205), rs60854092 (P=0.0490)] to hyperuricemia were replicated
in the present study. These results suggest that genetic variants
associated with T2DM, MetS, or hyperuricemia differ, in part,
between early-onset and late-onset individuals with these
conditions.
There are several limitations to our study: i)
Given that the results were not replicated, their validation will
be necessary in independent study populations or in other ethnic
groups. ii) It is possible that SNPs identified in the present
study are in LD with other genetic variants in the same gene or in
other nearby genes that are actually responsible for the
development of T2DM, MetS, or hyperuricemia. iii) The functional
relevance of identified SNPs to the pathogenesis of T2DM, MetS, or
hyperuricemia remains to be elucidated.
In conclusion, we have newly identified four genes
(ZNF860, OR4F6, OR52E4, HERPUD2) that confer susceptibility
to early-onset T2DM, MetS, or hyperuricemia. Determination of
genotypes for the SNPs in these genes may prove informative for
assessment of the genetic risk for T2DM, MetS, or hyperuricemia in
Japanese.
Acknowledgements
Not applicable.
Funding
This study was supported by CREST (JPMJCR1302),
Japan Science and Technology Agency (to YYamada, JS and IT).
Availability of data and materials
All data underlying the findings described in the
article are available upon request from the corresponding
author.
Authors' contributions
YYam contributed to conception and design of the
study; to acquisition, analysis, and interpretation of the data;
and to drafting of the manuscript. KK, MO, HH and TF each
contributed to acquisition of the data and to revision of the
manuscript. YYas, IT and JS contributed to analysis and
interpretation of the data as well as to revision of the
manuscript.
Ethics approval and consent to
participate
The study protocol complied with the Declaration of
Helsinki and was approved by the Committees on the Ethics of Human
Research of Mie University Graduate School of Medicine, Hirosaki
University Graduate School of Medicine, and participating hospitals
(Gifu Prefectural Tajimi Hospital, Gifu Prefectural General Medical
Center, Japanese Red Cross Nagoya First Hospital, Northern Mie
Medical Center Inabe General Hospital, and Hirosaki Stroke and
Rehabilitation Center). Written informed consent was obtained from
all subjects.
Consent for publication
All authors approved submission of the final
version of the article for publication.
Competing interests
The authors declare that they have no competing
interests.
References
|
1
|
Kharroubi AT and Darwish HM: Diabetes
mellitus: The epidemic of the century. World J Diabetes. 6:850–867.
2015. View Article : Google Scholar : PubMed/NCBI
|
|
2
|
Expert Committee on the Diagnosis and
Classification of Diabetes Mellitus: Report of the expert committee
on the diagnosis and classification of diabetes mellitus. Diabetes
Care. 26(Suppl 1): S5–S20. 2003.PubMed/NCBI
|
|
3
|
Ismail-Beigi F: Clinical practice.
Glycemic management of type 2 diabetes mellitus. N Engl J Med.
366:1319–1327. 2012.
|
|
4
|
Emerging Risk Factors Collaboration1;
Sarwar N, Gao P, Seshasai SR, Gobin R, Kaptoge S, Di Angelantonio
E, Ingelsson E, Lawlor DA, Selvin E, et al: Diabetes mellitus,
fasting blood glucose concentration, and risk of vascular disease:
A collaborative meta-analysis of 102 prospective studies. Lancet.
375:2215–2222. 2010. View Article : Google Scholar : PubMed/NCBI
|
|
5
|
Stumvoll M, Goldstein BJ and van Haeften
TW: Type 2 diabetes: Principles of pathogenesis and therapy.
Lancet. 365:1333–1346. 2005. View Article : Google Scholar : PubMed/NCBI
|
|
6
|
Almgren P, Lehtovirta M, Isomaa B, Sarelin
L, Taskinen MR, Lyssenko V, Tuomi T and Groop L; Botnia Study
Group: Heritability and familiality of type 2 diabetes and related
quantitative traits in the Botnia Study. Diabetologia.
54:2811–2819. 2011. View Article : Google Scholar : PubMed/NCBI
|
|
7
|
Prasad RB and Groop L: Genetics of type 2
diabetes-pitfalls and possibilities. Genes (Basel). 6:87–123. 2015.
View Article : Google Scholar : PubMed/NCBI
|
|
8
|
Wellcome Trust Case Control Consortium:
Genome-wide association study of 14,000 cases of seven common
diseases and 3,000 shared controls. Nature. 447:661–678. 2007.
View Article : Google Scholar : PubMed/NCBI
|
|
9
|
Sladek R, Rocheleau G, Rung J, Dina C,
Shen L, Serre D, Boutin P, Vincent D, Belisle A, Hadjadj S, et al:
A genome-wide association study identifies novel risk loci for type
2 diabetes. Nature. 445:881–885. 2007. View Article : Google Scholar : PubMed/NCBI
|
|
10
|
Dupuis JI, Langenberg C, Prokopenko I,
Saxena R, Soranzo N, Jackson AU, Wheeler E, Glazer NL, Bouatia-Naji
N, Gloyn AL, et al: New genetic loci implicated in fasting glucose
homeostasis and their impact on type 2 diabetes risk. Nat Genet.
42:105–116. 2010. View Article : Google Scholar : PubMed/NCBI
|
|
11
|
Voight BF, Scott LJ, Steinthorsdottir V,
Morris AP, Dina C, Welch RP, Zeggini E, Huth C, Aulchenko YS,
Thorleifsson G, et al: MAGIC investigators; GIANT Consortium:
Twelve type 2 diabetes susceptibility loci identified through
large-scale association analysis. Nat Genet. 42:579–589. 2010.
View Article : Google Scholar : PubMed/NCBI
|
|
12
|
Morris AP, Voight BF, Teslovich TM,
Ferreira T, Segrè AV, Steinthorsdottir V, Strawbridge RJ, Khan H,
Grallert H, Mahajan A, et al: DIAbetes Genetics Replication And
Meta-analysis (DIAGRAM) Consortium: Large-scale association
analysis provides insights into the genetic architecture and
pathophysiology of type 2 diabetes. Nat Genet. 44:981–990. 2012.
View Article : Google Scholar : PubMed/NCBI
|
|
13
|
Scott RA, Lagou V, Welch RP, Wheeler E,
Montasser ME, Luan J, Mägi R, Strawbridge RJ, Rehnberg E,
Gustafsson S, et al: DIAbetes Genetics Replication and
Meta-analysis (DIAGRAM) Consortium: Large-scale association
analyses identify new loci influencing glycemic traits and provide
insight into the underlying biological pathways. Nat Genet.
44:991–1005. 2012. View Article : Google Scholar : PubMed/NCBI
|
|
14
|
Ng MC, Shriner D, Chen BH, Li J, Chen WM,
Guo X, Liu J, Bielinski SJ, Yanek LR, Nalls MA, et al: FIND
Consortium; eMERGE Consortium; DIAGRAM Consortium; MuTHER
Consortium; MEta-analysis of type 2 DIabetes in African Americans
Consortium: Meta-analysis of genome-wide association studies in
African Americans provides insights into the genetic architecture
of type 2 diabetes. PLoS Genet. 10:e10045172014. View Article : Google Scholar : PubMed/NCBI
|
|
15
|
Cho YS, Chen CH, Hu C, Long J, Ong RT, Sim
X, Takeuchi F, Wu Y, Go MJ, Yamauchi T, et al: MuTHER Consortium:
Meta-analysis of genome-wide association studies identifies eight
new loci for type 2 diabetes in east Asians. Nat Genet. 44:67–72.
2011. View Article : Google Scholar : PubMed/NCBI
|
|
16
|
Mahajan A, Go MJ, Zhang W, Below JE,
Gaulton KJ, Ferreira T, Horikoshi M, Johnson AD, Ng MC, Prokopenko
I, et al: DIAbetes Genetics Replication And Meta-analysis (DIAGRAM)
Consortium; Asian Genetic Epidemiology Network Type 2 Diabetes
(AGEN-T2D) Consortium; South Asian Type 2 Diabetes (SAT2D)
Consortium; Mexican American Type 2 Diabetes (MAT2D) Consortium;
Type 2 Diabetes Genetic Exploration by Nex-generation sequencing in
muylti-Ethnic Samples (T2D-GENES) Consortium: Genome-wide
trans-ancestry meta-analysis provides insight into the genetic
architecture of type 2 diabetes susceptibility. Nat Genet.
46:234–244. 2014. View Article : Google Scholar : PubMed/NCBI
|
|
17
|
Zhao W, Rasheed A, Tikkanen E, Lee JJ,
Butterworth AS, Howson JMM, Assimes TL, Chowdhury R, Orho-Melander
M, Damrauer S, et al: CHD Exome+Consortium; EPIC-CVD
Consortium; EPIC-Interact Consortium; Michigan Biobank:
Identification of new susceptibility loci for type 2 diabetes and
shared etiological pathways with coronary heart disease. Nat Genet.
49:1450–1457. 2017. View Article : Google Scholar : PubMed/NCBI
|
|
18
|
Unoki H, Takahashi A, Kawaguchi T, Hara K,
Horikoshi M, Andersen G, Ng DP, Holmkvist J, Borch-Johnsen K,
Jørgensen T, et al: SNPs in KCNQ1 are associated with
susceptibility to type 2 diabetes in East Asian and European
populations. Nat Genet. 40:1098–1102. 2008. View Article : Google Scholar : PubMed/NCBI
|
|
19
|
Yasuda K, Miyake K, Horikawa Y, Hara K,
Osawa H, Furuta H, Hirota Y, Mori H, Jonsson A, Sato Y, et al:
Variants in KCNQ1 are associated with susceptibility to type 2
diabetes mellitus. Nat Genet. 40:1092–1097. 2008. View Article : Google Scholar : PubMed/NCBI
|
|
20
|
Yamauchi T, Hara K, Maeda S, Yasuda K,
Takahashi A, Horikoshi M, Nakamura M, Fujita H, Grarup N, Cauchi S,
et al: A genome-wide association study in the Japanese population
identifies susceptibility loci for type 2 diabetes at UBE2E2 and
C2CD4A-C2CD4B. Nat Genet. 42:864–868. 2010. View Article : Google Scholar : PubMed/NCBI
|
|
21
|
Imamura M, Takahashi A, Yamauchi T, Hara
K, Yasuda K, Grarup N, Zhao W, Wang X, Huerta-Chagoya A, Hu C, et
al: Genome-wide association studies in the Japanese population
identify seven novel loci for type 2 diabetes. Nat Commun.
7:105312016. View Article : Google Scholar : PubMed/NCBI
|
|
22
|
Alberti KG, Eckel RH, Grundy SM, Zimmet
PZ, Cleeman JI, Donato KA, Fruchart JC, James WP, Loria CM and
Smith SC Jr; International Diabetes Federation Task Force on
Epidemiology and Prevention; Hational Heart, Lung, and Blood
Institute; American Heart Association; World Heart Federation;
International Atherosclerosis Society; International Association
for the Study of Obesity: Harmonizing the metabolic syndrome: A
joint interim statement of the International Diabetes Federation
Task Force on Epidemiology and Prevention; National Heart, Lung,
and Blood Institute; American Heart Association; World Heart
Federation; International Atherosclerosis Society; and
International Association for the Study of Obesity. Circulation.
120:1640–1645. 2009. View Article : Google Scholar : PubMed/NCBI
|
|
23
|
Grundy SM, Cleeman JI, Daniels SR, Donato
KA, Eckel RH, Franklin BA, Gordon DJ, Krauss RM, Savage PJ, Smith
SC Jr, et al: American Heart Association; National Heart, Lung, and
Blood Institute: Diagnosis and management of the metabolic
syndrome: An American Heart Association/National Heart, Lung, and
Blood Institute Scientific Statement. Circulation. 112:2735–2752.
2005. View Article : Google Scholar : PubMed/NCBI
|
|
24
|
Esposito K, Chiodini P, Colao A, Lenzi A
and Giugliano D: Metabolic syndrome and risk of cancer: A
systematic review and meta-analysis. Diabetes Care. 35:2402–2411.
2012. View Article : Google Scholar : PubMed/NCBI
|
|
25
|
Abou Ziki MD and Mani A: Metabolic
syndrome: Genetic insights into disease pathogenesis. Curr Opin
Lipidol. 27:162–171. 2016. View Article : Google Scholar : PubMed/NCBI
|
|
26
|
Vattikuti S, Guo J and Chow CC:
Heritability and genetic correlations explained by common SNPs for
metabolic syndrome traits. PLoS Genet. 8:e10026372012. View Article : Google Scholar : PubMed/NCBI
|
|
27
|
Kraja AT, Vaidya D, Pankow JS, Goodarzi
MO, Assimes TL, Kullo IJ, Sovio U, Mathias RA, Sun YV, Franceschini
N, et al: A bivariate genome-wide approach to metabolic syndrome:
STAMPEED consortium. Diabetes. 60:1329–1339. 2011. View Article : Google Scholar : PubMed/NCBI
|
|
28
|
Kristiansson K, Perola M, Tikkanen E,
Kettunen J, Surakka I, Havulinna AS, Stancáková A, Barnes C, Widen
E, Kajantie E, et al: Genome-wide screen for metabolic syndrome
susceptibility Loci reveals strong lipid gene contribution but no
evidence for common genetic basis for clustering of metabolic
syndrome traits. Circ Cardiovasc Genet. 5:242–249. 2012. View Article : Google Scholar : PubMed/NCBI
|
|
29
|
Tekola-Ayele F, Doumatey AP, Shriner D,
Bentley AR, Chen G, Zhou J, Fasanmade O, Johnson T, Oli J, Okafor
G, et al: Genome-wide association study identifies African-ancestry
specific variants for metabolic syndrome. Mol Genet Metab.
116:305–313. 2015. View Article : Google Scholar : PubMed/NCBI
|
|
30
|
Zabaneh D and Balding DJ: A genome-wide
association study of the metabolic syndrome in Indian Asian men.
PLoS One. 5:e119612010. View Article : Google Scholar : PubMed/NCBI
|
|
31
|
Zhu Y, Zhang D, Zhou D, Li Z, Li Z, Fang
L, Yang M, Shan Z, Li H, Chen J, et al: Susceptibility loci for
metabolic syndrome and metabolic components identified in Han
Chinese: A multi-stage genome-wide association study. J Cell Mol
Med. 21:1106–1116. 2017. View Article : Google Scholar : PubMed/NCBI
|
|
32
|
Eraly SA, Vallon V, Rieg T, Gangoiti JA,
Wikoff WR, Siuzdak G, Barshop BA and Nigam SK: Multiple organic
anion transporters contribute to net renal excretion of uric acid.
Physiol Genomics. 33:180–192. 2008. View Article : Google Scholar : PubMed/NCBI
|
|
33
|
Choi HK, Mount DB and Reginato AM;
American College of Physicians; American Physiological Society:
Pathogenesis of gout. Ann Intern Med. 143:499–516. 2005. View Article : Google Scholar : PubMed/NCBI
|
|
34
|
Feig DI, Kang DH and Johnson RJ: Uric acid
and cardiovascular risk. N Engl J Med. 359:1811–1821. 2008.
View Article : Google Scholar : PubMed/NCBI
|
|
35
|
Fini MA, Elias A, Johnson RJ and Wright
RM: Contribution of uric acid to cancer risk, recurrence, and
mortality. Clin Transl Med. 1:162012. View Article : Google Scholar : PubMed/NCBI
|
|
36
|
Reginato AM, Mount DB, Yang I and Choi HK:
The genetics of hyperuricaemia and gout. Nat Rev Rheumatol.
8:610–621. 2012. View Article : Google Scholar : PubMed/NCBI
|
|
37
|
Merriman TR: An update on the genetic
architecture of hyperuricemia and gout. Arthritis Res Ther.
17:982015. View Article : Google Scholar : PubMed/NCBI
|
|
38
|
Wallace C, Newhouse SJ, Braund P, Zhang F,
Tobin M, Falchi M, Ahmadi K, Dobson RJ, Marçano AC, Hajat C, et al:
Genome-wide association study identifies genes for biomarkers of
cardiovascular disease: Serum urate and dyslipidemia. Am J Hum
Genet. 82:139–149. 2008. View Article : Google Scholar : PubMed/NCBI
|
|
39
|
Dehghan A, Köttgen A, Yang Q, Hwang SJ,
Kao WL, Rivadeneira F, Boerwinkle E, Levy D, Hofman A, Astor BC, et
al: Association of three genetic loci with uric acid concentration
and risk of gout: A genome-wide association study. Lancet.
372:1953–1961. 2008. View Article : Google Scholar : PubMed/NCBI
|
|
40
|
Vitart V, Rudan I, Hayward C, Gray NK,
Floyd J, Palmer CN, Knott SA, Kolcic I, Polasek O, Graessler J, et
al: SLC2A9 is a newly identified urate transporter influencing
serum urate concentration, urate excretion and gout. Nat Genet.
40:437–442. 2008. View
Article : Google Scholar : PubMed/NCBI
|
|
41
|
Döring A, Gieger C, Mehta D, Gohlke H,
Prokisch H, Coassin S, Fischer G, Henke K, Klopp N, Kronenberg F,
et al: SLC2A9 influences uric acid concentrations with pronounced
sex-specific effects. Nat Genet. 40:430–436. 2008. View Article : Google Scholar : PubMed/NCBI
|
|
42
|
Kolz M, Johnson T, Sanna S, Teumer A,
Vitart V, Perola M, Mangino M, Albrecht E, Wallace C, Farrall M, et
al: EUROSPAN Consortium; ENGAGE Consortium; PROCARDIS Consortium;
KORA Study; WTCCC: Meta-analysis of 28,141 individuals identifies
common variants within five new loci that influence uric acid
concentrations. PLoS Genet. 5:e10005042009. View Article : Google Scholar : PubMed/NCBI
|
|
43
|
Yang Q, Köttgen A, Dehghan A, Smith AV,
Glazer NL, Chen MH, Chasman DI, Aspelund T, Eiriksdottir G, Harris
TB, et al: Multiple genetic loci influence serum urate levels and
their relationship with gout and cardiovascular disease risk
factors. Circ Cardiovasc Genet. 3:523–530. 2010. View Article : Google Scholar : PubMed/NCBI
|
|
44
|
Tin A, Woodward OM, Kao WH, Liu CT, Lu X,
Nalls MA, Shriner D, Semmo M, Akylbekova EL, Wyatt SB, et al: CARe
and CHARGE Consortia: Genome-wide association study for serum urate
concentrations and gout among African Americans identifies genomic
risk loci and a novel URAT1 loss-of-function allele. Hum Mol Genet.
20:4056–4068. 2011. View Article : Google Scholar : PubMed/NCBI
|
|
45
|
Li C, Li Z, Liu S, Wang C, Han L, Cui L,
Zhou J, Zou H, Liu Z, Chen J, et al: Genome-wide association
analysis identifies three new risk loci for gout arthritis in Han
Chinese. Nat Commun. 6:70412015. View Article : Google Scholar : PubMed/NCBI
|
|
46
|
Köttgen A, Albrecht E, Teumer A, Vitart V,
Krumsiek J, Hundertmark C, Pistis G, Ruggiero D, O'Seaghdha CM,
Haller T, et al: LifeLines Cohort Study; CARDIoGRAM Consortium;
DIAGRAM Consortium; ICBP Consortium; MAGIC Consortium: Genome-wide
association analyses identify 18 new loci associated with serum
urate concentrations. Nat Genet. 45:145–154. 2013. View Article : Google Scholar : PubMed/NCBI
|
|
47
|
Matsuo H, Yamamoto K, Nakaoka H, Nakayama
A, Sakiyama M, Chiba T, Takahashi A, Nakamura T, Nakashima H,
Takada Y, et al: Genome-wide association study of clinically
defined gout identifies multiple risk loci and its association with
clinical subtypes. Ann Rheum Dis. 75:652–659. 2016. View Article : Google Scholar : PubMed/NCBI
|
|
48
|
Nakayama A, Nakaoka H, Yamamoto K,
Sakiyama M, Shaukat A, Toyoda Y, Okada Y, Kamatani Y, Nakamura T,
Takada T, et al: Eurogout Consortium; Eurogout Consortium: GWAS of
clinically defined gout and subtypes identifies multiple
susceptibility loci that include urate transporter genes. Ann Rheum
Dis. 76:869–877. 2017. View Article : Google Scholar : PubMed/NCBI
|
|
49
|
Ng MC, Lee SC, Ko GT, Li JK, So WY, Hashim
Y, Barnett AH, Mackay IR, Critchley JA, Cockram CS, et al: Familial
early-onset type 2 diabetes in Chinese patients: Obesity and
genetics have more significant roles than autoimmunity. Diabetes
Care. 24:663–671. 2001. View Article : Google Scholar : PubMed/NCBI
|
|
50
|
Bueno AC, Sun K, Martins CS, Elias Junior
J, Miranda W, Tao C, Foss-Freitas MC, Barbieri MA, Bettiol H, de
Castro M, et al: A novel ADIPOQ mutation (p.M40K) impairs assembly
of high-molecular-weight adiponectin and is associated with
early-onset obesity and metabolic syndrome. J Clin Endocrinol
Metab. 99:E683–E693. 2014. View Article : Google Scholar : PubMed/NCBI
|
|
51
|
de Bruin C, Mericq V, Andrew SF, van
Duyvenvoorde HA, Verkaik NS, Losekoot M, Porollo A, Garcia H, Kuang
Y, Hanson D, et al: An XRCC4 splice mutation associated with severe
short stature, gonadal failure, and early-onset metabolic syndrome.
J Clin Endocrinol Metab. 100:E789–E798. 2015. View Article : Google Scholar : PubMed/NCBI
|
|
52
|
Zivná M, Hůlková H, Matignon M, Hodanová
K, Vylet'al P, Kalbácová M, Baresová V, Sikora J, Blazková H, Zivný
J, et al: Dominant renin gene mutations associated with early-onset
hyperuricemia, anemia, and chronic kidney failure. Am J Hum Genet.
85:204–213. 2009. View Article : Google Scholar : PubMed/NCBI
|
|
53
|
Matsuo H, Ichida K, Takada T, Nakayama A,
Nakashima H, Nakamura T, Kawamura Y, Takada Y, Yamamoto K, Inoue H,
et al: Common dysfunctional variants in ABCG2 are a major cause of
early-onset gout. Sci Rep. 3:20142013. View Article : Google Scholar : PubMed/NCBI
|
|
54
|
Yamada Y, Sakuma J, Takeuchi I, Yasukochi
Y, Kato K, Oguri M, Fujimaki T, Horibe H, Muramatsu M, Sawabe M, et
al: Identification of five genetic variants as novel determinants
of type 2 diabetes mellitus in Japanese by exome-wide association
studies. Oncotarget. 8:80492–80505. 2017. View Article : Google Scholar : PubMed/NCBI
|
|
55
|
Yamada Y, Sakuma J, Takeuchi I, Yasukochi
Y, Kato K, Oguri M, Fujimaki T, Horibe H, Muramatsu M, Sawabe M, et
al: Identification of rs7350481 at chromosome 11q23.3 as a novel
susceptibility locus for metabolic syndrome in Japanese individuals
by an exome-wide association study. Oncotarget. 8:39296–39308.
2017. View Article : Google Scholar : PubMed/NCBI
|
|
56
|
Yamada Y, Sakuma J, Takeuchi I, Yasukochi
Y, Kato K, Oguri M, Fujimaki T, Horibe H, Muramatsu M, Sawabe M, et
al: Identification of C21orf59 and ATG2A as novel determinants of
renal function-related traits in Japanese by exome-wide association
studies. Oncotarget. 8:45259–45273. 2017. View Article : Google Scholar : PubMed/NCBI
|
|
57
|
Yamada Y, Matsui K, Takeuchi I, Oguri M
and Fujimaki T: Association of genetic variants with hypertension
in a longitudinal population-based genetic epidemiological study.
Int J Mol Med. 35:1189–1198. 2015. View Article : Google Scholar : PubMed/NCBI
|
|
58
|
Kuzuya T, Nakagawa S, Satoh J, Kanazawa Y,
Iwamoto Y, Kobayashi M, Nanjo K, Sasaki A, Seino Y, Ito C, et al:
Committee of the Japan Diabetes Society on the diagnostic criteria
of diabetes mellitus: Report of the Committee on the classification
and diagnostic criteria of diabetes mellitus. Diabetes Res Clin
Pract. 55:65–85. 2002. View Article : Google Scholar : PubMed/NCBI
|
|
59
|
World Health Organization and
International Diabetes Federation: Definition and diagnosis of
diabetes mellitus and intermediate hyperglycemia: Report of a
WHO/IDF consultation. World Health Organization; Geneva,
Switzerland; pp. 1–46. 2006
|
|
60
|
Grove ML, Yu B, Cochran BJ, Haritunians T,
Bis JC, Taylor KD, Hansen M, Borecki IB, Cupples LA, Fornage M, et
al: Best practices and joint calling of the HumanExome BeadChip:
The CHARGE Consortium. PLoS One. 8:e680952013. View Article : Google Scholar : PubMed/NCBI
|
|
61
|
Anderson CA, Pettersson FH, Clarke GM,
Cardon LR, Morris AP and Zondervan KT: Data quality control in
genetic case-control association studies. Nat Protoc. 5:1564–1573.
2010. View Article : Google Scholar : PubMed/NCBI
|
|
62
|
Price AL, Patterson NJ, Plenge RM,
Weinblatt ME, Shadick NA and Reich D: Principal components analysis
corrects for stratification in genome-wide association studies. Nat
Genet. 38:904–909. 2006. View
Article : Google Scholar : PubMed/NCBI
|
|
63
|
Teslovich TM, Musunuru K, Smith AV,
Edmondson AC, Stylianou IM, Koseki M, Pirruccello JP, Ripatti S,
Chasman DI, Willer CJ, et al: Biological, clinical and population
relevance of 95 loci for blood lipids. Nature. 466:707–713. 2010.
View Article : Google Scholar : PubMed/NCBI
|
|
64
|
Kim YJ, Go MJ, Hu C, Hong CB, Kim YK, Lee
JY, Hwang JY, Oh JH, Kim DJ, Kim NH, et al: MAGIC consortium:
Large-scale genome-wide association studies in East Asians identify
new genetic loci influencing metabolic traits. Nat Genet.
43:990–995. 2011. View
Article : Google Scholar : PubMed/NCBI
|