Introduction
Gout is among the most common inflammatory
arthritides, characterized by deposition of monosodium urate (MSU)
crystals in and around the joint and soft tissue (1–3).
Persistent hyperuricemia is an important factor in the development
of gout, but not all hyperuricemic patients develop gouty arthritis
(4). The risk of supersaturation and
crystal formation increases with increasing urate concentration.
Alteration in various factors including pH and temperature also
aggravates crystal formation and deposition in joints such as the
first metatarsophalangeal (MTP) joint, a normally lower-temperature
joint (5). The release of these
preformed crystals initiates an intense inflammatory response in
the synovium causing acute gouty arthritis (6).
Worldwide prevalence of gout ranges from 0.1 to 10%,
with an incidence of 0.3 to 6 cases per 1,000 person-years
(7). However, Asian countries
including India (8), Bangladesh
(9) and Pakistan (10) have been reported as having low gout
prevalence, with prevalence rates below 0.5% according to data
published by the Community Oriented Programme for Control of
Rheumatic Diseases (7).
Gout typically presents in middle-aged men as severe
pain and/or swelling with redness around joints, which may last
from hours to days. Acute gouty arthritis usually has monoarticular
presentation with a predisposition to develop in joints of lower
extremities, particularly the first MTP joint. Other joints
including the ankle and wrist may also be affected. Oligo- or
polyarticular presentation may also occur, albeit rarely, typically
in conditions such as chronic untreated gout or in postmenopausal
women (11).
The gold standard test for the diagnosis of gout
remains to be identification of MSU crystals in the synovial fluid
(SF) by polarizing microscopy (12–14), which
has previously been reported to have a sensitivity of at least
84.4% (15) and specificity of 97.2%
(16). This technique requires
specialized equipment and training, and is not available freely in
countries with limited resources. Although hyperuricemia is a
feature of gout, serum uric acid (UA) level may be within normal
range during an acute attack (11).
Such normouricemia at the time of an acute attack may be attributed
to release of interleukin 6 (IL-6) during the acute inflammatory
process (17). UA levels may be
efficiently measured in the SF by colorimetric and enzymatic
methods. The enzymatic method of UA measurement results from
oxidation of UA by the uricase enzyme (18). The present study used the latter
method with the aim of evaluating the utility of SF to serum UA
ratio (SSR) for diagnosis of gout.
Materials and methods
Study design
The current study followed a cross-sectional design
and was conducted at the rheumatology outpatient clinic of the
National Center for Rheumatic Diseases (NCRD) from June 2013 to
September 2016. Informed written consent was obtained from all
patients prior to enrollment in the study or performing aspiration
of joint fluid. The study protocol was approved by the ethical
review board of the NCRD.
Study population
The study population comprised all patients
presenting with joint pain at the NCRD. The sample size was
calculated using the worldwide prevalence of gout of 1.7% (7), a 95% confidence interval and an 80%
power of the study. Though the calculated sample size was 106, 181
patients were included in the study as the patient pool was
adequate. The inclusion criteria were as follows: Patients with
pain and swelling in one or multiple joints of acute onset (≤1
day). The exclusion criteria were as follows: i) Patients with
chronic joint pain (>14 days); ii) diagnosed cases of rheumatoid
arthritis (RA), spondyloarthritis, or gout on treatment with
disease-modifying anti-rheumatic drugs or urate lowering therapy;
iii) those not willing to give consent for the study protocol. Gout
was diagnosed on the basis of American College of
Rheumatology/European League Against Rheumatism (ACR/EULAR) 2015
classification criteria (19). RA was
diagnosed on the basis of the ACR/EULAR 2010 criteria (20). Spondyloarthritis was diagnosed using
the Assessment of Spondyloarthritis International Society
classification criteria (21), and
ankylosing spondylitis (AS) on the basis of modified New York
criteria (22). Osteoarthritis (OA)
was diagnosed on the basis of X-ray findings of reduced medial
joint space in the absence of chondrocalcinosis with or without
apatite crystals in the SF. Pseudogout was diagnosed if there was
detection of chondrocalcinosis by X-ray or calcium pyrophosphate
dihydrate crystals on SF examination.
Sample collection and analysis
At least 1 ml of SF was aspirated from any swollen
joint, which included the first MTP, ankle, knee, wrist and
metacarpophalangeal joints. SF aspiration was performed with a
heparinized syringe in all patients and the fluid was sent for
assessment of UA level, crystallization, pH, cell counts and gram
staining at the NCRD. Additionally, serum samples were assessed for
UA levels. Serum and SF UA levels were measured by the enzymatic
uricase method using an automated analyzer (Erba XL 200; Erba
Diagnostics, Mannheim, Germany). The sample collection and
microcrystal examination were performed by a standard method as in
a previous study by Montagna et al (23). The analyses of SF cell count and gram
staining and culture were performed as described by Brannan and
Jerrard (24). However, crystal count
was not determined. The SSR was calculated for each patient.
Statistical analysis
Statistical tests were performed using SPSS version
17.0 (SPSS, Inc., Chicago, IL, USA). Data were expressed as the
mean ± standard deviation unless otherwise stated. The difference
in SSR ratio between gout and non-gout effusions was calculated
using one-way analysis of variance followed by Bonferroni's post
hoc tests for multiple comparisons. A receiver operating
characteristic (ROC) curve was plotted to calculate the cutoff
value of SSR ratio for the diagnosis of gout. Internal validation
was performed using bootstrapping. P<0.05 was considered to
indicate a statistically significant difference.
Results
Clinicodemographic profile
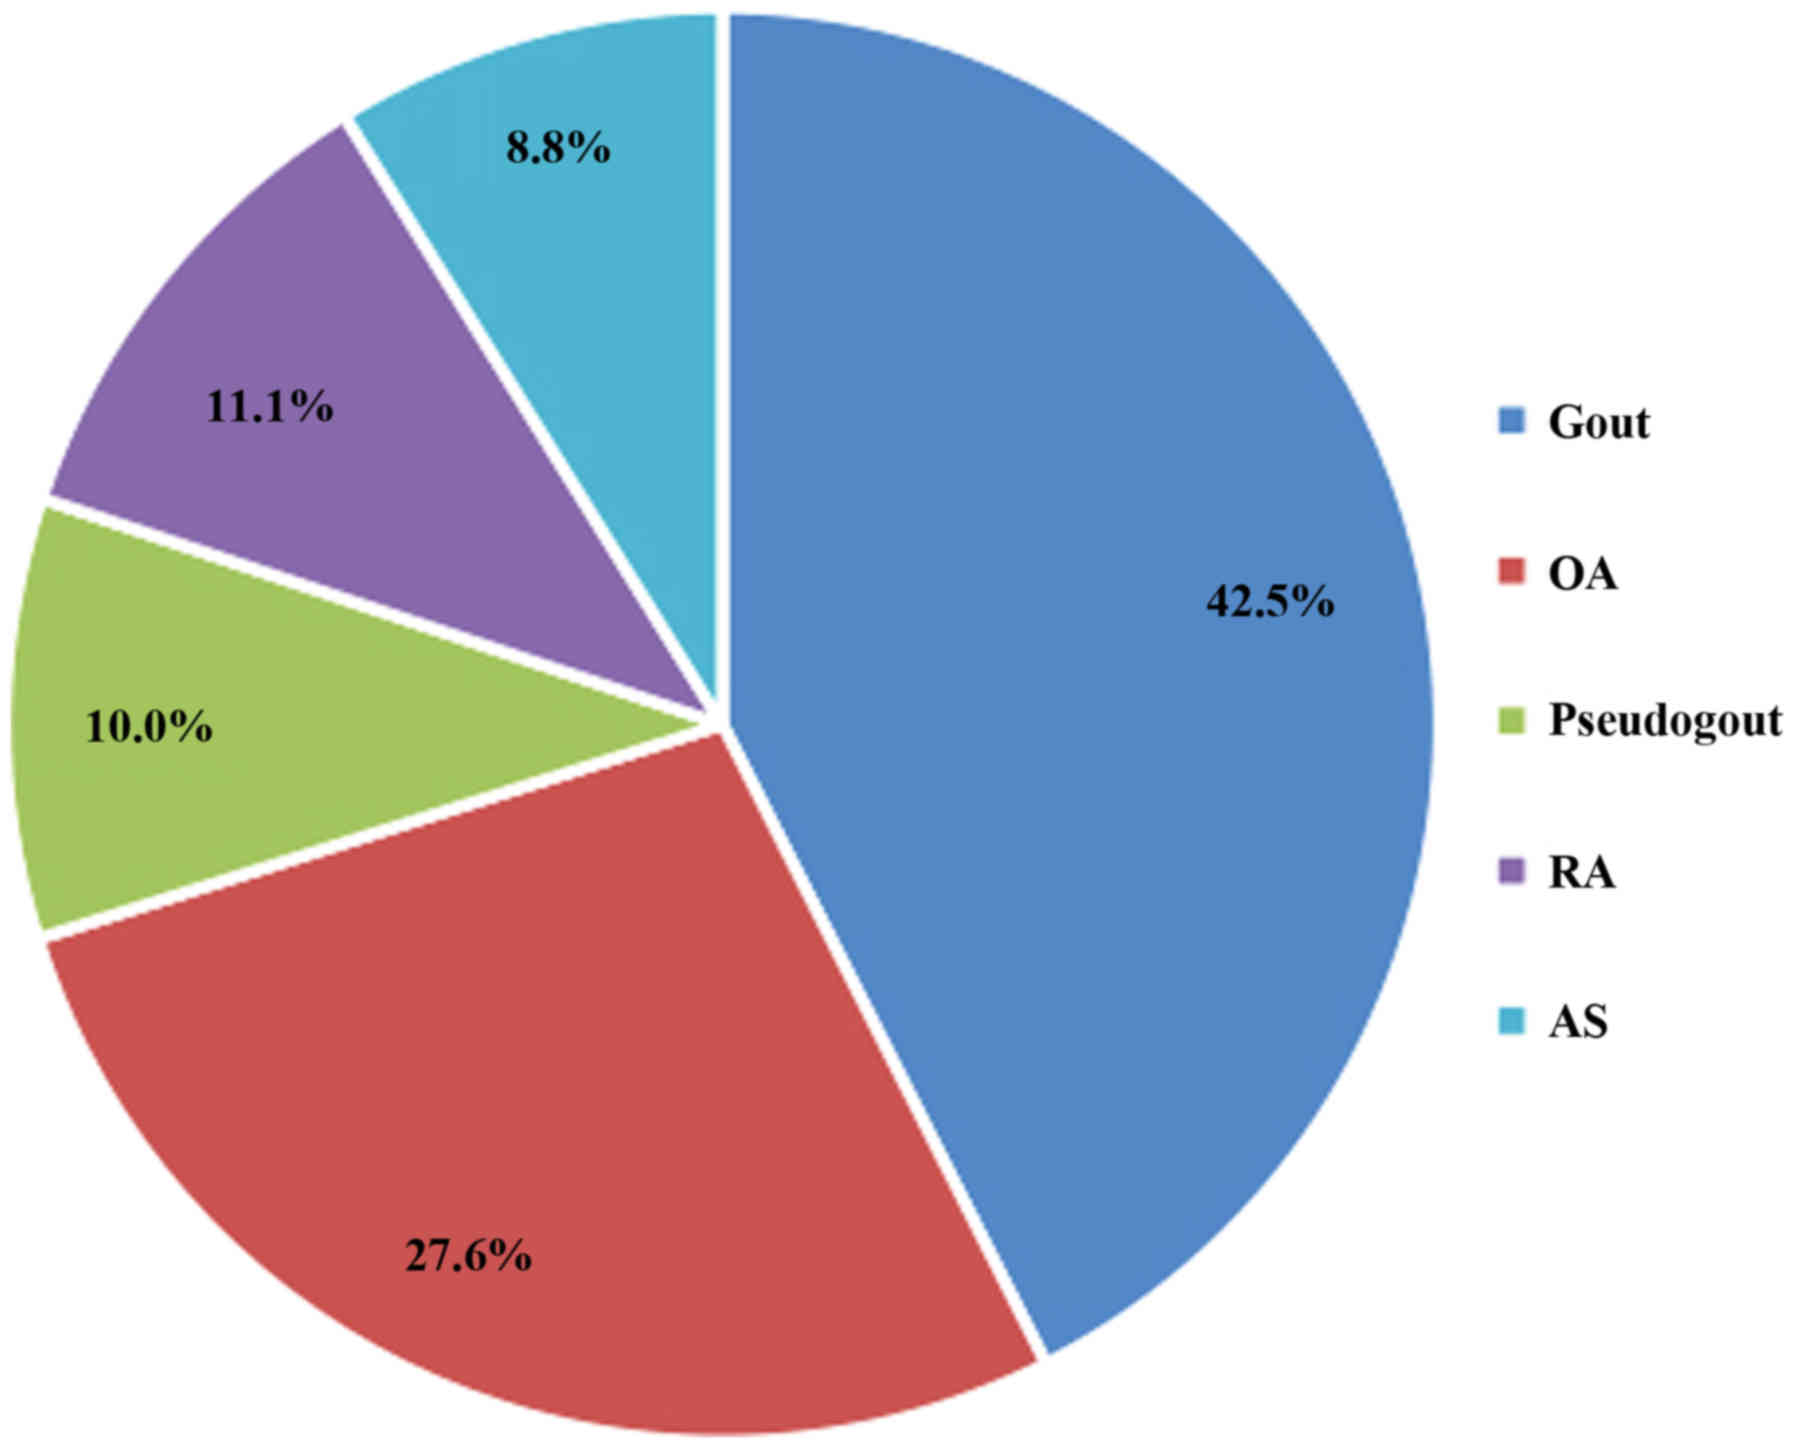
A total of 181 patients who presented with acute
joint pain and/or swelling were included. The mean age of patients
was 51.5±9.6 years, and 79% were males. The overall male: female
ratio was 3.7:1. Gout was diagnosed in 77 (42.5%) of patients. The
frequencies of other diagnoses are presented in Fig. 1.
The differences in age, gender, and SF and serum
urate levels of patients with each diagnosis are presented in
Table I.
 | Table I.Comparison of urate levels between
groups. |
Table I.
Comparison of urate levels between
groups.
|
| Diagnosis |
|---|
|
|
|
|---|
| Variable | Gout (n=77) | OA (n=50) | Pseudogout
(n=18) | RA (n=20) | AS (n=16) | P-value |
|---|
| Age, years | 49.0±10.0 | 54.6±9.8 | 50.9±8.6 | 53.0±10.2 | 51.9±3.8 |
|
| Serum UA | 6.2±0.8 |
6.3±0.7 |
5.8±0.8a | 6.7±0.5a |
6.0±0.9 |
0.019 |
| Synovial UA |
6.6±0.8bc |
6.1±0.9 |
5.7±0.9b | 6.3±0.9 |
5.5±0.9c | <0.001 |
| Synovial fluid to
serum UA ratio | 1.1±0.1 |
1.0±0.1 |
1.0±0.1 | 0.9±0.1 |
0.9±0.1 | <0.001 |
| SF pH | 7.4±0.0 |
7.4±0.1 |
7.4±0.0 | 7.4±0.0 |
7.4±0.0 |
0.800 |
| SF total cell | 9,300 | 3,000 | 10,200 | 8,500 | 6,700 |
0.720 |
| count/cumm, median
(range) | (1,000–18,000) | (800–10,000) | (2,000–22,000) | (3,000–30,000) | (2,700–16,000) |
|
| SF gram stain | All negative | All negative | All negative | All negative | All negative | – |
SSR
The SF UA level was significantly higher in patients
with gout when compared with that in patients with pseudogout
(P=0.001) or AS (P<0.001; Table
I). SSR was significantly higher in gout patients than in
patients with OA (P<0.001), pseudogout (P=0.013), RA
(P<0.001) or AS (P<0.001; Table
II). When comparing SSR between groups excluding gout, no
significant differences were determined (Table II). Serum UA level did not differ
significantly between the groups except between RA and pseudogout
(P=0.015; Table I).
| Table II.Comparison of SSR between different
study groups. |
Table II.
Comparison of SSR between different
study groups.
| Diagnosis (SSR) |
| P-value |
|---|
| Gout (1.06±0.07) | OA (0.96±0.08) | <0.001 |
|
| Pseudogout
(0.98±0.09) |
0.013 |
|
| RA (0.94±0.11) | <0.001 |
|
| AS (0.92±0.14) | <0.001 |
| OA (0.96±0.08) | Pseudogout
(0.98±0.09) |
1.000 |
|
| RA (0.94±0.11) |
1.000 |
|
| AS (0.92±0.14) |
1.000 |
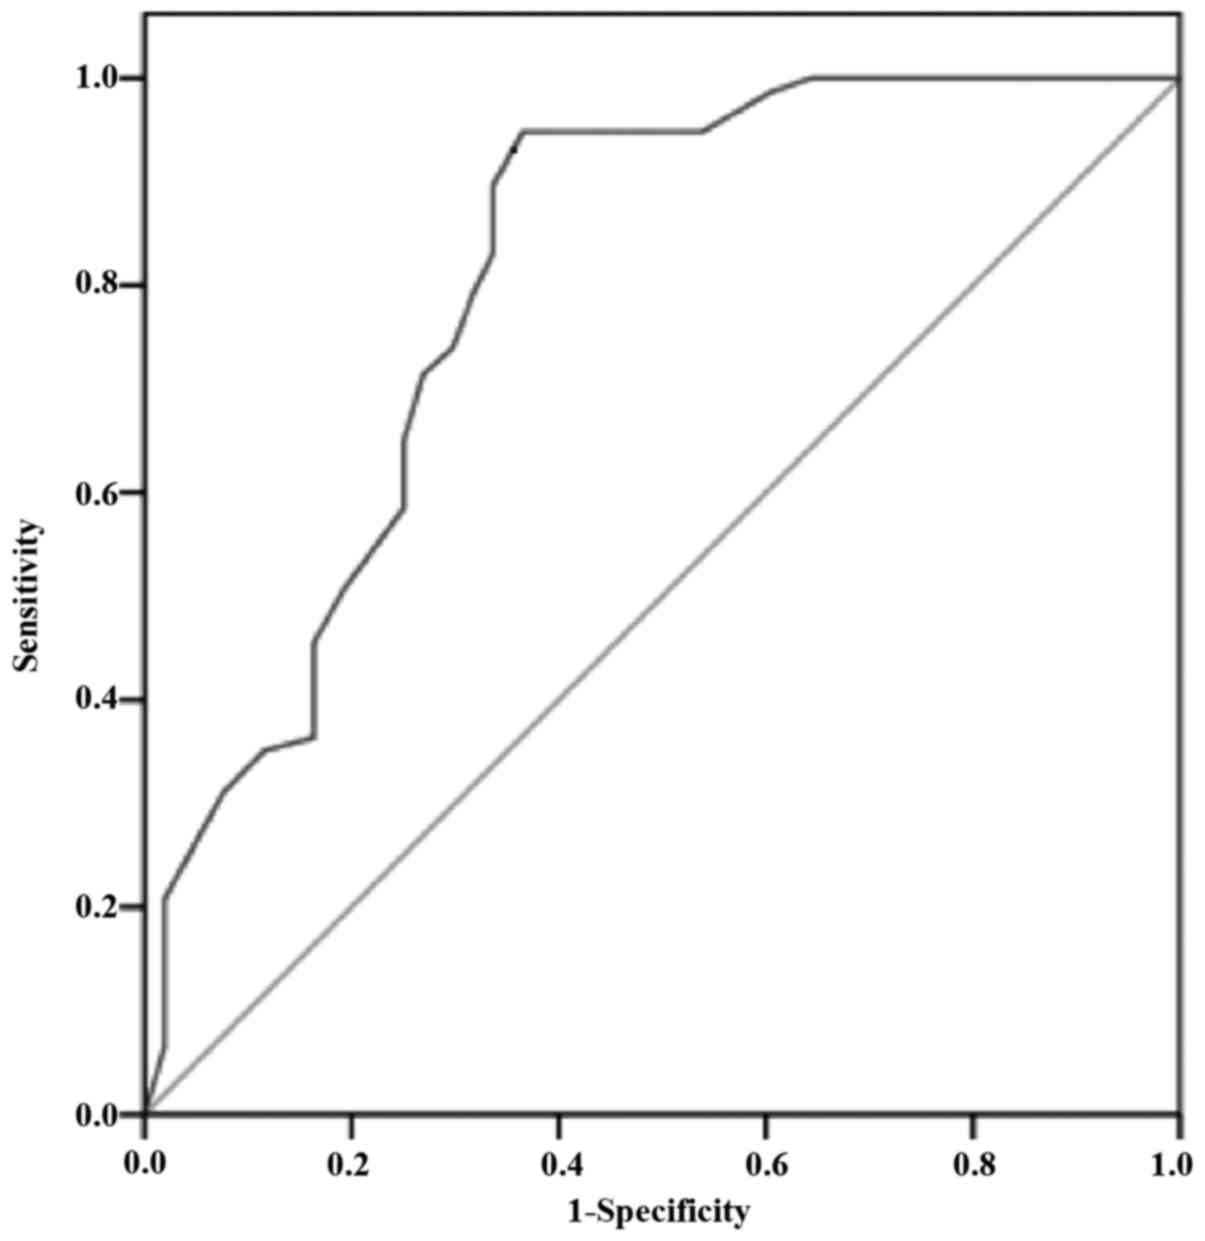
A ROC curve was plotted for SSR (Fig. 2). An SSR of ≥1.01 was associated with
the highest sensitivity and specificity, at 89.6 and 66.3%,
respectively, for diagnosis of gout. The area under the curve was
0.82. The higher the value of SSR above 1.01, the greater the
specificity for diagnosis of gout.
Discussion
SF may be considered as a dialysate of blood plasma
(25). As small molecules including
urate pass freely through the double barrier of the synovial
membrane into SF, the concentration of most non-electrolytes and
micromolecules in SF is similar to that of plasma (26,27) except
for the few macromolecules that are secreted by the synovial
membrane and surrounding tissues (28). Most non-electrolytes diffuse freely
between serum and SF, while electrolytes follow the Gibbs-Donnan
equilibrium. UA is filtered from plasma to SF, and the normal SF
urate level is equal to or slightly lower than the serum levels
(29). There are different hypotheses
regarding the distribution of urate in serum and SF. According to
Beutler et al (30), the
concentration of UA in SF is identical to that in the blood.
However, previous study has demonstrated that SF urate levels were
higher than serum levels in patients with acute gouty attack
(31). During the acute attack of
gout, approximately 40% of patients may be normouricemic which may
be attributed to various factors including long-term excessive
alcohol intake, diuretic therapy, obesity, release of IL-6 and use
of urate lowering therapy, among others (32). Thus, the current study selected the
ratio of SF urate to serum urate as a measure to verify higher UA
concentration in the SF of patients with gout.
In the present study, the percentage of patients
with gout was higher in comparison with those of other inflammatory
and non-inflammatory arthritides. This may be because of the
criteria of acute onset joint pain and/or swelling. This may also
explain the higher percentage of male patients. It was identified
that an SSR of ≥1.01 was significantly associated with diagnosis of
gout determined through MSU crystal examination by polarizing
microscopy. Values <1.01 were associated with non-gout effusions
including those of pseudogout or OA cases. These findings are
consistent with the hypothesis that a higher level of UA in SF may
in part mediate gout onset. However, there are multiple factors
that may be involved in gout onset, including pH (MSU crystal
solubility increases with increasing pH to a maximum at pH 7.7 at
37°C), osmolality, and serum-SF gradients of calcium, phosphorus,
albumin and globulin (32).
A study in 1965 observed a similar finding of higher
SF urate level in patients with gout when compared with those with
knee swelling due to other causes (31). However, their data was limited to 27
patients and lacked calculation of the predictive ratio for
diagnosis of gout. The present study elaborated on this by
obtaining more samples, and determined the predictive value of SSR
to be ≥1.01 with 89.6% sensitivity.
Consistent with the findings of the current study,
Wangkaew et al (33)
demonstrated that SF urate and SSR were significantly different in
patients with gout compared within other types of arthritis.
However, in their study, the serum UA levels were also higher in
gout patients. By contrast the present data indicated that serum UA
as an independent marker may not be reliable for identification of
gouty arthritis.
Beutler et al (30) reported that SF urate levels tended to
reflect serum levels in patients with gout and non-inflammatory
arthropathies but not with inflammatory joint disorders. The
results of their study did not explain the higher level of SFUA in
non-inflammatory arthritis, and contradict the present data. This
may be due to the small sample size in their study and selection
differences of the study population. Nonetheless, the results of
the current study may aid to clarify the relationship between
synovial and serum UA levels in gout and non-gout populations in a
larger group of patients. The results also indicate a cutoff value
for SSR in predicting gout as a cause of joint pain and swelling
when the gold standard test for diagnosis is not available.
Notably, the higher the SSR value, the more specific it was
indicated to be for identifying gout-associated effusion. An
external validation of the data with larger groups is now required
for confirmation of these findings.
In conclusion, though identification of MSU crystals
by polarized microscopy is the gold standard method for the
diagnosis of gout, some laboratories and diagnostic centers lack
this facility. It also requires a qualified and experienced
technician. In this context, measurement of SF urate level may be
used as an alternative method, as it is inexpensive, does not
require special training or equipment and may be performed in
regions where technologically advanced laboratories and equipment
may not be available. It may also be effective in differentiating
gout effusions from others when there is diagnostic uncertainty.
Thus, measurement of SF urate level may be used as an alternative
test for diagnosis of gout when polarized microscopy is not
available.
Acknowledgements
The authors are thankful to Dr Renu Shrestha
(Consultant Pathologist, NCRD, Ratopul, Kathmandu, Nepal) and Mr.
Ravi Prajapati (Senior Technician, NCRD) for their technical
assistance.
Funding
No funding was received.
Availability of data and materials
The datasets used and/or analyzed during the current
study are available from the corresponding author on reasonable
request.
Authors' contributions
BV conceived the study and was responsible for data
analysis and drafting of the manuscript. MB was responsible for
data collection and reviewing the literature. SN was responsible
for data analysis and drafting of the manuscript. All authors read
and approved the final version.
Ethics approval and consent to
participate
The study protocol was approved by the ethical
review board of the NCRD. Informed written consent was obtained
from all participants prior to enrollment.
Consent for publication
Consent for publication of relevant data was
obtained from patients following anonymization of personal
information.
Competing interests
The authors declare that they have no competing
interests.
References
|
1
|
So A: Gout in the spotlight. Arthritis Res
Ther. 10:1122008. View
Article : Google Scholar : PubMed/NCBI
|
|
2
|
Martinon F and Glimcher LH: Gout: New
insights into an old disease. J Clin Invest. 116:2073–2075. 2006.
View Article : Google Scholar : PubMed/NCBI
|
|
3
|
Currie WJ: The gout patient in general
practice. Rheumatol Rehabil. 17:205–217. 1978. View Article : Google Scholar : PubMed/NCBI
|
|
4
|
Campion EW, Glynn RJ and DeLabry LO:
Asymptomatic hyperuricemia. Risks and consequences in the Normative
Aging Study. Am J Med. 82:421–426. 1987. View Article : Google Scholar : PubMed/NCBI
|
|
5
|
Choi HK, Mount DB and Reginato AM:
American College of Physicians; American Physiological Society:
Pathogenesis of gout. Ann Intern Med. 143:499–516. 2005. View Article : Google Scholar : PubMed/NCBI
|
|
6
|
McCarty DJ Jr, Phelps P and Pyenson J:
Crystal-induced inflammation in canine joints. I. An experimental
model with quantification of the host response. J Exp Med.
124:99–114. 1966. View Article : Google Scholar : PubMed/NCBI
|
|
7
|
Kuo CF, Grainge MJ, Zhang W and Doherty M:
Global epidemiology of gout: Prevalence, incidence and risk
factors. Nat Rev Rheumatol. 11:649–662. 2015. View Article : Google Scholar : PubMed/NCBI
|
|
8
|
Chopra A, Patil J, Billempelly V, Relwani
J and Tandle HS: WHO-ILAR COPCORD Study. WHO International League
of Associations from Rheumatology Community Oriented Program from
Control of Rheumatic Diseases: Prevalence of rheumatic diseases in
a rural population in western India: A WHO-ILAR COPCORD Study. J
Assoc Physicians India. 49:240–246. 2001.PubMed/NCBI
|
|
9
|
Haq SA, Darmawan J, Islam MN, Uddin MZ,
Das BB, Rahman F, Chowdhury MA, Alam MN, Mahmud TA, Chowdhury MR,
et al: Prevalence of rheumatic diseases and associated outcomes in
rural and urban communities in Bangladesh: A COPCORD study. J
Rheumatol. 32:348–353. 2005.PubMed/NCBI
|
|
10
|
Farooqi A and Gibson T: Prevalence of the
major rheumatic disorders in the adult population of north
Pakistan. Br J Rheumatol. 37:491–495. 1998. View Article : Google Scholar : PubMed/NCBI
|
|
11
|
Ragab G, Elshahaly M and Bardin T: Gout:
An old disease in new perspective - A review. J Adv Res. 8:495–511.
2017. View Article : Google Scholar : PubMed/NCBI
|
|
12
|
Hainer BL, Matheson E and Wilkes RT:
Diagnosis, treatment, and prevention of gout. Am Fam Physician.
90:831–836. 2014.PubMed/NCBI
|
|
13
|
Beutler A and Schumacher HR Jr: Gout and
‘pseudogout’. When are arthritic symptoms caused by crystal
deposition? Postgrad Med. 95:103–106, 109, 113–116 passim. 1994.
View Article : Google Scholar
|
|
14
|
Schlesinger N: Diagnosis of gout. Minerva
Med. 98:759–767. 2007.PubMed/NCBI
|
|
15
|
Wallace SL, Robinson H, Masi AT, Decker
JL, McCarty DJ and Yü TF: Preliminary criteria for the
classification of the acute arthritis of primary gout. Arthritis
Rheum. 20:895–900. 1977. View Article : Google Scholar : PubMed/NCBI
|
|
16
|
Chen LX and Schumacher HR: Current trends
in crystal identification. Curr Opin Rheumatol. 18:171–173. 2006.
View Article : Google Scholar : PubMed/NCBI
|
|
17
|
Tsutani H, Yoshio N and Ueda T:
Interleukin 6 reduces serum urate concentrations. J Rheumatol.
27:5542000.PubMed/NCBI
|
|
18
|
Barr WG: Uric AcidClinical Methods: The
History, Physical, and Laboratory Examinations. Walker HK, Hall WD
and Hurst JW: 3rd edition. Butterworths, Boston: 1990
|
|
19
|
Neogi T, Jansen TL, Dalbeth N, Fransen J,
Schumacher HR, Berendsen D, Brown M, Choi H, Edwards NL, Janssens
HJ, et al: 2015 Gout classification criteria: An American College
of Rheumatology/European League Against Rheumatism collaborative
initiative. Ann Rheum Dis. 74:1789–1798. 2015. View Article : Google Scholar : PubMed/NCBI
|
|
20
|
Aletaha D, Neogi T, Silman AJ, Funovits J,
Felson DT, Bingham CO III, Birnbaum NS, Burmester GR, Bykerk VP,
Cohen MD, et al: 2010 Rheumatoid arthritis classification criteria:
An American College of Rheumatology/European League Against
Rheumatism collaborative initiative. Arthritis Rheum. 62:2569–2581.
2010. View Article : Google Scholar : PubMed/NCBI
|
|
21
|
Rudwaleit M, van der Heijde D, Landewé R,
Akkoc N, Brandt J, Chou CT, Dougados M, Huang F, Gu J, Kirazli Y,
et al: The Assessment of SpondyloArthritis International Society
classification criteria for peripheral spondyloarthritis and for
spondyloarthritis in general. Ann Rheum Dis. 70:25–31. 2011.
View Article : Google Scholar : PubMed/NCBI
|
|
22
|
van der Linden S, Valkenburg HA and Cats
A: Evaluation of diagnostic criteria for ankylosing spondylitis. A
proposal for modification of the New York criteria. Arthritis
Rheum. 27:361–368. 1984. View Article : Google Scholar : PubMed/NCBI
|
|
23
|
Montagna P, Brizzolara R, Ferrone C,
Cutolo M, Paolino S and Cimmino MA: A method for counting
monosodium urate crystals in synovial fluid. Reumatismo. 67:29–32.
2015. View Article : Google Scholar : PubMed/NCBI
|
|
24
|
Brannan SR and Jerrard DA: Synovial fluid
analysis. J Emerg Med. 30:331–339. 2006. View Article : Google Scholar : PubMed/NCBI
|
|
25
|
Gatter RA and Schumacher HR: A Practical
Handbook of Joint Fluid Analysis. 2nd edition. Lea & Febiger;
Philadelphia, PA: 1991
|
|
26
|
Schmid K and MacNair MB: Characterization
of the proteins of certain postmortem human synovial fluids. J Clin
Invest. 37:708–718. 1958. View Article : Google Scholar : PubMed/NCBI
|
|
27
|
Schmid K and MacNair MB: Characterization
of the proteins of human synovial fluid in certain disease states.
J Clin Invest. 35:814–824. 1956. View Article : Google Scholar : PubMed/NCBI
|
|
28
|
Ruiz-Romero C, Calamia V, Carreira V,
Mateos J, Fernández P and Blanco FJ: Strategies to optimize
two-dimensional gel electrophoresis analysis of the human joint
proteome. Talanta. 80:1552–1560. 2010. View Article : Google Scholar : PubMed/NCBI
|
|
29
|
Ropes MW, Bennett GA and Bauer W: The
Origin and Nature of Normal Synovial Fluid. J Clin Invest.
18:351–372. 1939. View Article : Google Scholar : PubMed/NCBI
|
|
30
|
Beutler AM, Keenan GF, Soloway S, Norden
D, Luchi M and Schumacher HR Jr: Soluble urate in sera and synovial
fluids from patients with different joint disorders. Clin Exp
Rheumatol. 14:249–254. 1996.PubMed/NCBI
|
|
31
|
Reeves B: Significance of joint fluid uric
acid levels in gout. Ann Rheum Dis. 24:569–571. 1965. View Article : Google Scholar : PubMed/NCBI
|
|
32
|
Rozin AP, Braun-Moscovici Y and
Balbir-Gurman A: Serum-synovial gradient data of normouricemic
patients with history of gout and acute knee effusion. Clin
Rheumatol. 25:886–888. 2006. View Article : Google Scholar : PubMed/NCBI
|
|
33
|
Wangkaew S, Kasitanon N, Hongsongkiat S,
Tanasombat C, Sukittawut W and Louthrenoo W: A comparative study of
serum and synovial fluid levels of uric acid between patients with
gout and other arthritides. J Med Assoc Thai. 97:679–685.
2014.PubMed/NCBI
|