Introduction
Previous studies have suggested that ethanol is a
fermentation product of intestinal microflora (1–3).
Additionally, it has been reported that ethanol is produced from
glucose or fructooligosaccharides (FOS) by several intestinal
bacteria, including Bifidobacterium, Lactobacillus fermentum
and Weissella confusa (4).
However, the extent to which these bacteria are responsible for
ethanol production is unknown. Furthermore, there is a lack of
studies on the effects of dietary factors, such as prebiotics, on
intestinal ethanol production in animals without ethanol
consumption. Consumption of prebiotics including FOS and inulin has
been reported to enhance the intestinal fermentation process by
elevating levels of probiotics including Bifidobacterium and
Lactobacillus (5). It has been
reported that addition of FOS to culture medium stimulates in
vitro growth of Bifidobacterium (6,7). Dietary
FOS is resistant to digestion and is metabolised by the microflora
in the large intestine into short-chain fatty acids (SCFAs).
Increasing data suggest that prebiotics may prevent several chronic
diseases, including colon cancer, inflammatory bowel disease,
alcoholic steatohepatitis and diabetes, by elevating probiotic and
SCFA levels (8,9).
A high intake of ethanol is harmful due to increased
risk of several diseases including coronary heart disease, brain
diseases and colon cancer (10).
Conversely, it has been suggested that low ethanol intake is
associated with lower risk of such diseases (10,11).
Therefore, it is of interest to elucidate the modulation of
intestinal ethanol production by dietary factors. Considering the
previous findings, the present study hypothesised that FOS intake
may elevate ethanol production by the intestinal microflora.
Indeed, the beneficial effects of dietary prebiotics on obese
phenotype, impaired gut permeability, cardiac function and
hyperlipidemia are particularly prominent in animals on a high-fat
(HF) diet (12,13). Therefore, in the current study, the
effect of FOS intake on intestinal ethanol levels in rats fed on a
HF diet was investigated.
Materials and methods
Animals and diets
A total of 16 male, specific pathogen-free
Sprague-Dawley rats (3 weeks old) were purchased from Hiroshima
Laboratory Animal Centre (Hiroshima, Japan) and maintained
according to the Guide for the Care and Use of Laboratory Animals
of Hiroshima University (Hiroshima, Japan). The study was approved
by the Research Ethics Committee of Hiroshima University (approval
no.: C15-12). The rats were individually housed in an
air-conditioned room at 23–24°C under a 12-h light/dark cycle
(lights on from 08:00 a.m. to 8:00 p.m. Following acclimatization
with a non-purified commercial rodent diet (MF diet for rat and
mouse; Oriental Yeast Co., Ltd., Tokyo, Japan) for 3 days, the rats
(mean body weight, 68.3±0.5 g) were randomly assigned to one of two
groups (n=8 rats per group) based on experimental diet. The
compositions of the experimental HF diets with and without FOS
supplementation are summarised in Table
I. In these diets, the 30% beef tallow and 10% FOS were in
accordance with previous studies (14,15). The
rats were randomly assigned to one of the two diets supplemented
with or without 10% FOS (w/w; Wako Pure Chemical Industries, Ltd.,
Osaka, Japan). Equal quantities of the experimental diets were
incorporated daily into food cups at 17:00 (9, 10, 12, 14 and 15 g
on days 1, 2–4, 5–7, 8–12 and 13–14, respectively) to prevent
differences in food intake. Food intake was determined from the
food consumed each day until the next day's food was served. The
weight of spilled food was recorded daily and appropriately
incorporated into calculations of food intake. At the end of the
feeding period, the rats were sacrificed by decapitation following
brief exposure to 3–4% isoflurane gas (Wako Pure Chemical
Industries, Ltd., Osaka, Japan) mixed with air in an anesthesia
chamber. A total of 8 ml blood was collected from the neck, and
serum was separated by centrifugation at 2,000 × g for 20 min at
4°C and stored at −80°C. The intestinal digesta was immediately
isolated, weighed and stored at −80°C until the subsequent analyses
of ethanol, organic acid and beneficial bacteria.
 | Table I.Composition of the experimental
diets. |
Table I.
Composition of the experimental
diets.
|
| Proportion of diet
(%) |
|---|
|
|
|
|---|
| Material | Control | 10% FOS |
|---|
| Beef
tallowa | 30.0 | 30.0 |
| Caseinb | 20.0 | 20.0 |
|
L-Cystinea | 0.3 | 0.3 |
| Vitamin
mixturec | 1.0 | 1.0 |
| Mineral
mixturec | 3.5 | 3.5 |
|
Cellulosec | 5.0 | 5.0 |
|
Sucrosea | 20.0 | 20.0 |
| Corn
starchc | 20.2 | 10.2 |
| FOSd | − | 10.0 |
Cecum and serum ethanol
To determine ethanol levels by gas chromatography,
100 mg of the intestinal digesta and 100 µl serum were transferred
into individual ice-cold 0.6 N perchloric acid solutions (PCA). The
cecum PCA solution was homogenized on ice (Polytron RT-MR2100;
Kinematica AG, Littau-Luzern, Switzerland), and the serum PCA
solution was mixed for 10 sec on a vortex-mixer (17). The extracted samples were centrifuged
at 10,000 × g at 4°C for 5 min, and the supernatant was stored as
1.0 ml samples collected in 20 ml glass vials at −80°C until
measurement. 1-Propanol at a final concentration of 100 ppm was
included as internal standard prior to analysis. A
gas-chromatograph (GC-2014; Shimadzu Corporation, Kyoto, Japan)
equipped with a flame ionization detector was used for analysis. A
headspace autosampler (HT2000H; ALPHA M.O.S. Japan K.K., Tokyo,
Japan) was used to load the analyses. DB-WAX capillary columns (1.0
µm thickness, 30 m length, 0.53 mm internal diameter) from Agilent
Technologies Japan, Ltd. (Tokyo, Japan) were applied. Samples were
incubated for 30 min at 65°C in the head-space autosampler. Samples
(0.5 ml) were injected into the column at a rate of 1 ml/min with
the injector maintained at 200°C and detector at 250°C. An initial
temperature of 40°C was maintained for 1 min and then the column
oven temperature was increased from 40 to 80°C at a rate of 8°C/min
and then maintained at 80°C for 1 min. The column oven temperature
was increased from 20 to 180°C at a rate of 20°C/min and then
maintained at 180°C for 4 min. The flow rate of the carrier gas
(N2) was 1.0 ml/min (split ratio 10:1). Standard curves
were linear across four different concentrations (0.00, 3.25, 6.50
and 13.00 mmol/l) of ethanol (R2>0.99), and used for
the assay of ethanol levels in the samples.
Cecum microflora
For the analysis of intestinal microflora, bacterial
genomic DNA was isolated from the cecum digesta using an
UltraClean™ Fecal DNA extraction kit (MO BIO Laboratories; Qiagen,
Inc., Valencia, CA, USA) according to the manufacturer's
instructions. The purified DNA was eluted in 100 µl elution buffer
(5 mM Tris-HCl, pH 8.5), and the quality and quantity of DNA were
determined by measuring the absorbance at 260 and 280 nm using a
NanoDrop ND-1000 spectrophotometer (NanoDrop Technologies; Thermo
Fisher Scientific, Inc., Wilmington, DE, USA). Samples were stored
at −20°C. Real-time quantitative polymerase chain reaction (qPCR)
was performed to investigate the variation in the total number of
bacteria, including of Bifidobacterium spp. and
Lactobacillus spp. The 16S rRNA primers for
Bifidobacterium spp. and Lactobacillus spp. used for
qPCR have been described previously (14). The total volume of reagent mixture for
each PCR was 20 µl [4.4 µl distilled water, 10 µl Master mix
(Takara Bio, Inc., Otsu, Japan), 2 µl Plus solution (Takara Bio,
Inc., Otsu, Japan), 0.8 µl of each forward and reverse primer and 2
µl DNA]. The reaction conditions were as follows: 95°C for 30 sec,
followed by 40 cycles at 95°C for 5 sec, 55°C for 15 sec and 72°C
for 30 sec. The fluorescent products were detected at the last step
of each cycle. Melting curve analysis was performed following
amplification to distinguish the targeted PCR product from the
non-targeted PCR products. Data were analysed using the second
derivative maximum method of the StepOneTM Real-time PCR software
version 2.3 (Applied Biosystems; Thermo Fisher Scientific, Inc.).
The copy numbers of Bifidobacterium spp. and
Lactobacillus spp./µl were determined for the standard
plasmid solution of these bacteria [(cut standard plasmid mixture
ng/µl) × (molecules bp/1.0 × 109 ng) × (1/660 DNA length
bp/plasmid)=plasmid copies/µl] (14).
Real-time qPCR products were run as five 10-fold serial dilutions
of each standard mixture to compare the threshold cycle number with
the copy number of the target sequence and to generate standard
curves for the quantification of unknown samples. Typically,
standard curves were linear across five orders of magnitude
(R2>0.98).
Cecum SCFAs
Cecum SCFAs were measured according to an internal
standard method using high-performance liquid chromatography (HPLC;
L-2130; Hitachi, Ltd., Tokyo, Japan) equipped with an Aminex
HPX-87H ion exclusion column (7.8 mm internal diameter × 30 cm;
Bio-Rad, Laboratories, Hercules, CA, USA) (18). Briefly, 500 mg cecum digesta was
homogenised in 5 ml 50 mmol/l H2SO4
containing 10 mmol/l 2,2-dimethyl butyric acid as an internal
standard and subsequently centrifuged at 17,000 × g at 2°C for 20
min. The supernatant was ultrafiltered, and the filtrate was
applied to the HPLC column.
Statistical analysis
Data are expressed as the mean ± standard error of
the mean. Data were analyzed by Student's t-test after statistical
outliers were removed using the Smirnov-Grubbs rejection test. In
addition, association of cecum ethanol levels with cecum
Bifidobacterium and SCFA levels was assessed using Spearman
rank correlation analysis. The data analysis was performed using
Excel Statistics 2010 for Windows (Microsoft Corporation, Redmond,
WA, USA). For all tests, P<0.05 was considered to indicate
statistical significance.
Results
Food intake and body weight
Dietary manipulation had no significant effect on
total food intake over 14 days or on final body weight (P>0.05;
Table II).
| Table II.Effects of dietary FOS on the copy
numbers of beneficial bacteria and levels of SCFAs in the cecum
digesta of rats. |
Table II.
Effects of dietary FOS on the copy
numbers of beneficial bacteria and levels of SCFAs in the cecum
digesta of rats.
|
| Dietary group |
|---|
|
|
|
|---|
| Variable | Control | 10% FOS |
|---|
| Final body weight,
g | 198.1±1.9 | 193.9±3.2 |
| Total food intake
over 14 days, g | 225.0±0.0 | 225.0±0.0 |
| Bacteria (numbers/g
digesta) |
|
Bifidobacterium spp.
(×108) | 1.4±0.5 |
5.9±1.8a* |
|
Lactobacillus spp.
(×109) | 11.5±3.1 | 7.5±4.7 |
| Bacteria
(numbers/total digesta) |
|
Bifidobacterium spp.
(×108) | 1.3±0.3 |
31.6±9.6a* |
|
Lactobacillus spp.
(×1010) | 1.5±0.3 | 3.5±2.3 |
| SCFAs (µmol/g
digesta) |
|
Succinate | 36.2±7.3* |
14.8±5.5a** |
|
Lactate | 15.2±4.7* |
35.8±4.6b |
|
Acetate | 66.3±6.9 |
24.4±6.2b |
|
Propionate | 20.1±1.7 |
33.7±4.9a |
|
n-Butyrate | 15.5±1.8 |
22.3±2.1a |
| Total
SCFAs | 127.2±16.9** | 123.0±13.5** |
| SCFAs (µmol/total
digesta) |
|
Succinate | 49.0±11.2* | 73.1±23.9** |
|
Lactate | 19.3±4.7* |
195.2±29.4b |
|
Acetate | 86.0±7.5 | 119.7±23.7 |
|
Propionate | 26.3±1.9 |
189.7±34.6b |
|
n-Butyrate | 20.3±2.1 |
119.7±11.5b |
| Total
SCFAs | 164.7±19.4** |
656.2±66.5b** |
Intestinal and serum ethanol
levels
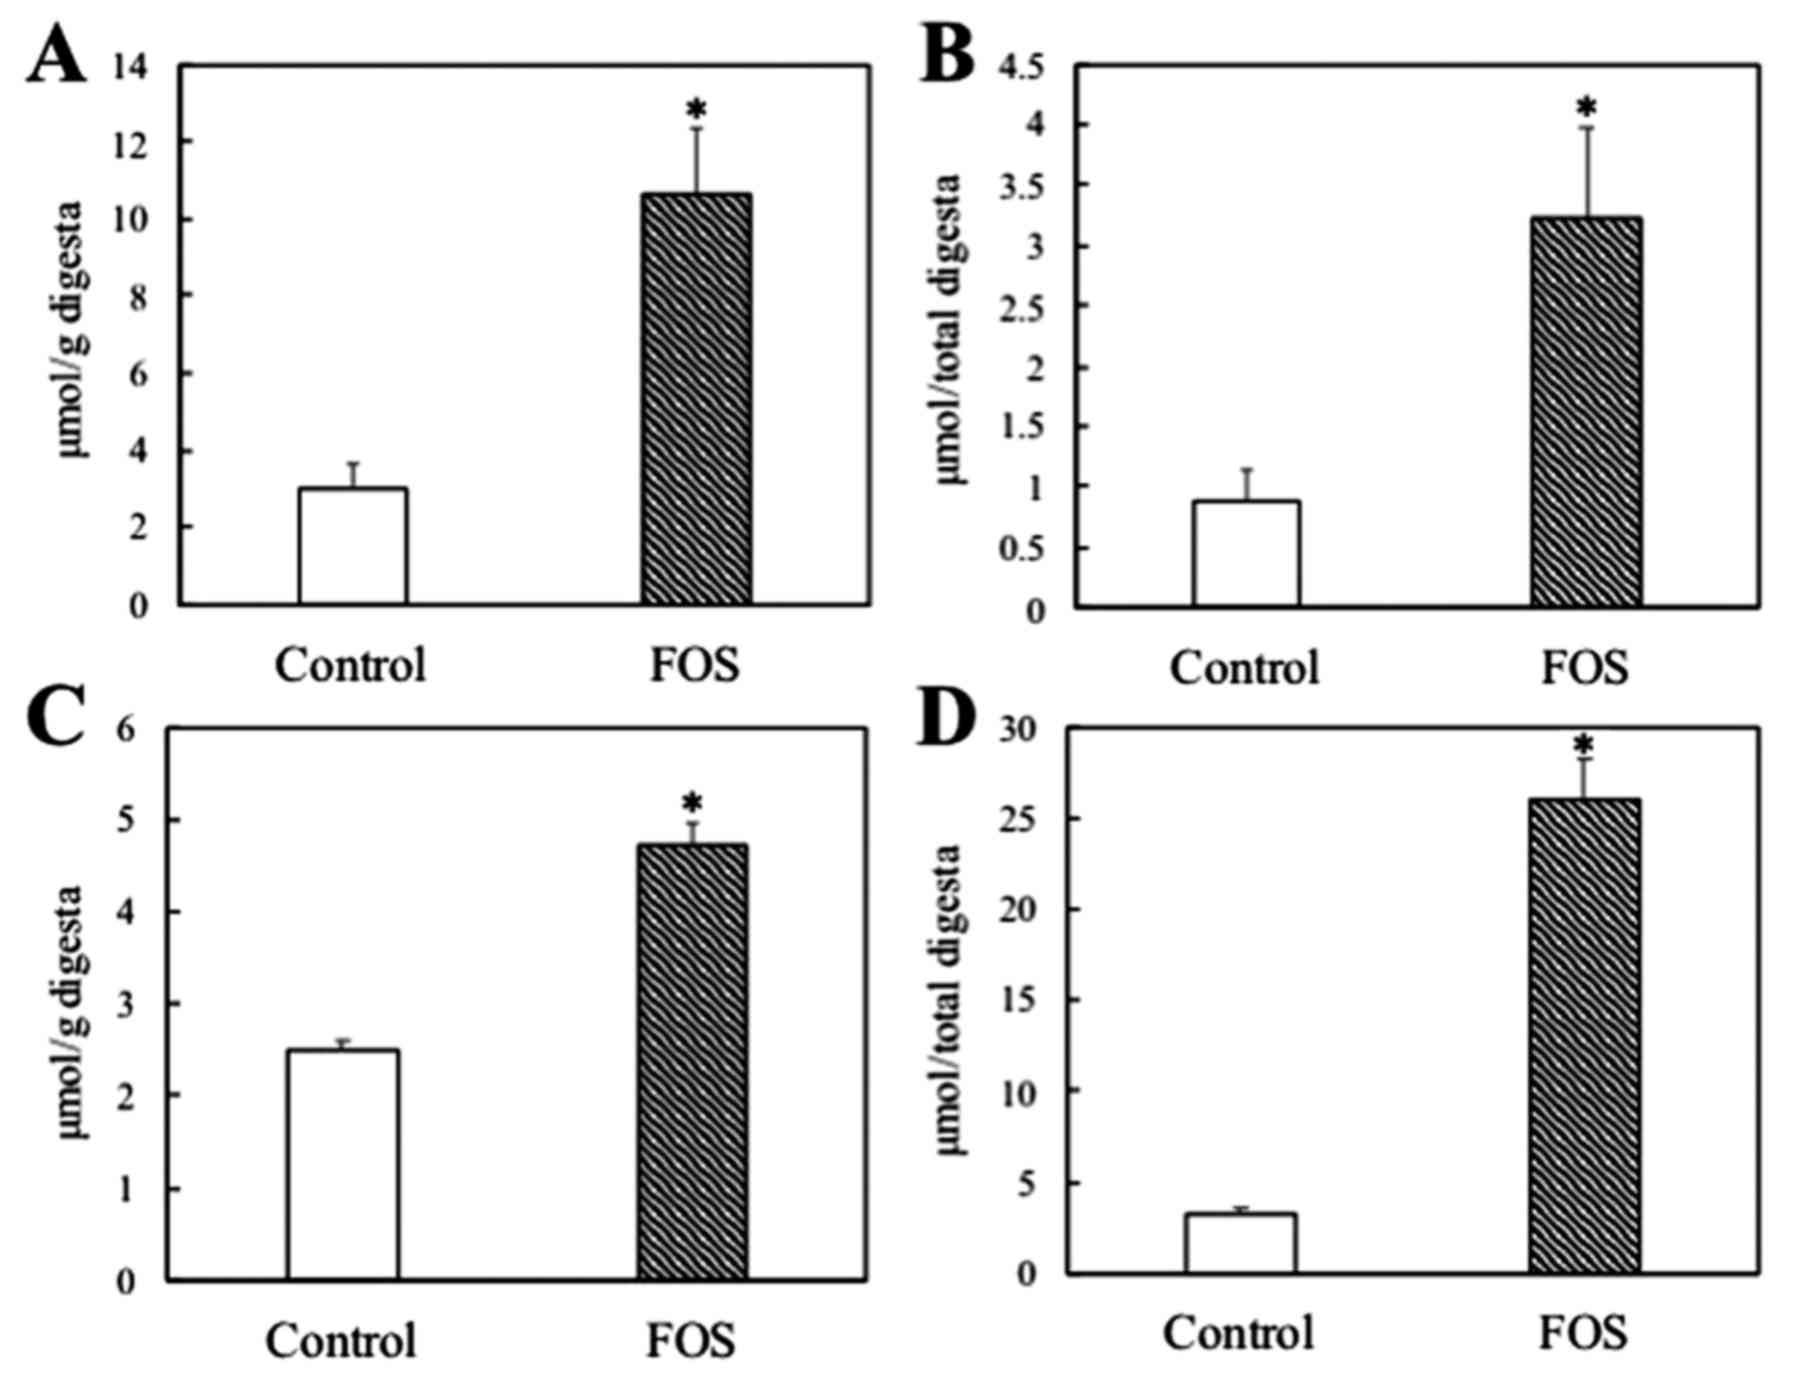
The weights of the ileum digesta were unaffected by
FOS intake (control vs. FOS: 0.30±0.02 vs. 0.26±0.05 g; P>0.05).
Ethanol levels per gram of ileum digesta were significantly
increased 3.5-fold by FOS intake (P<0.01; Fig. 1A). In the total ileum digesta, FOS
intake significantly increased ethanol levels by 3.6-fold
(P<0.01; Fig. 1B). The weights of
the cecum digesta were markedly increased 4.2-fold by FOS intake
(control vs. FOS: 1.33±0.06 vs. 5.54±0.48 g; P<0.01). The
ethanol levels per gram of cecum digesta were significantly
increased 1.9-fold by FOS intake (P<0.01; Fig. 1C). In the total cecum digesta, ethanol
levels were markedly increased by FOS intake by 7.9-fold
(P<0.01; Fig. 1D). Serum ethanol
levels were marginally but significantly increased by FOS intake
(control vs. FOS: 2.63±0.05 vs. 2.84±0.07 mM; P<0.05).
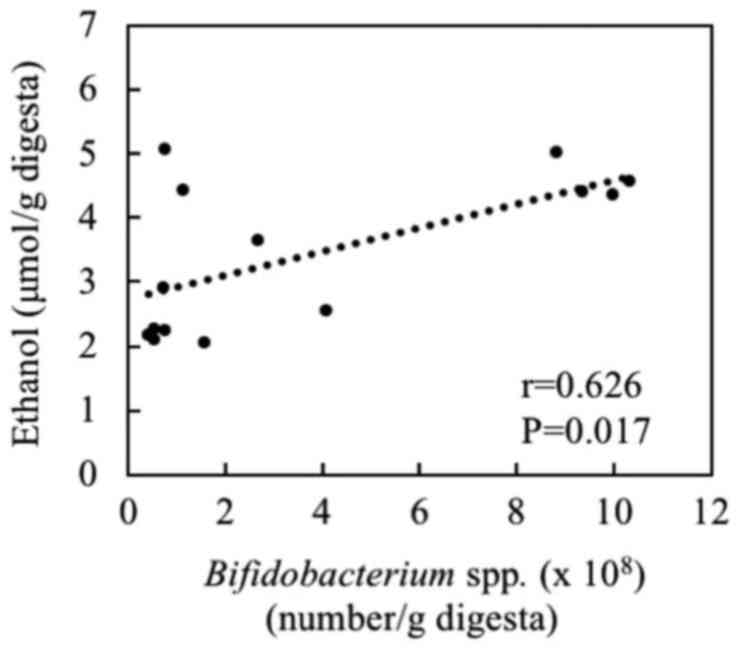
Cecum bacteria and SCFAs
Compared with the control group, the copy numbers of
Bifidobacterium per gram of cecum digesta were markedly
increased 4.2-fold in the FOS group (P<0.05; Table II). However, the numbers of
Lactobacillus per gram of cecum digesta were unaffected
(P>0.05). The numbers of Bifidobacterium were positively
correlated with ethanol level per gram of cecum digesta (r=0.626,
P=0.017; Fig. 2).
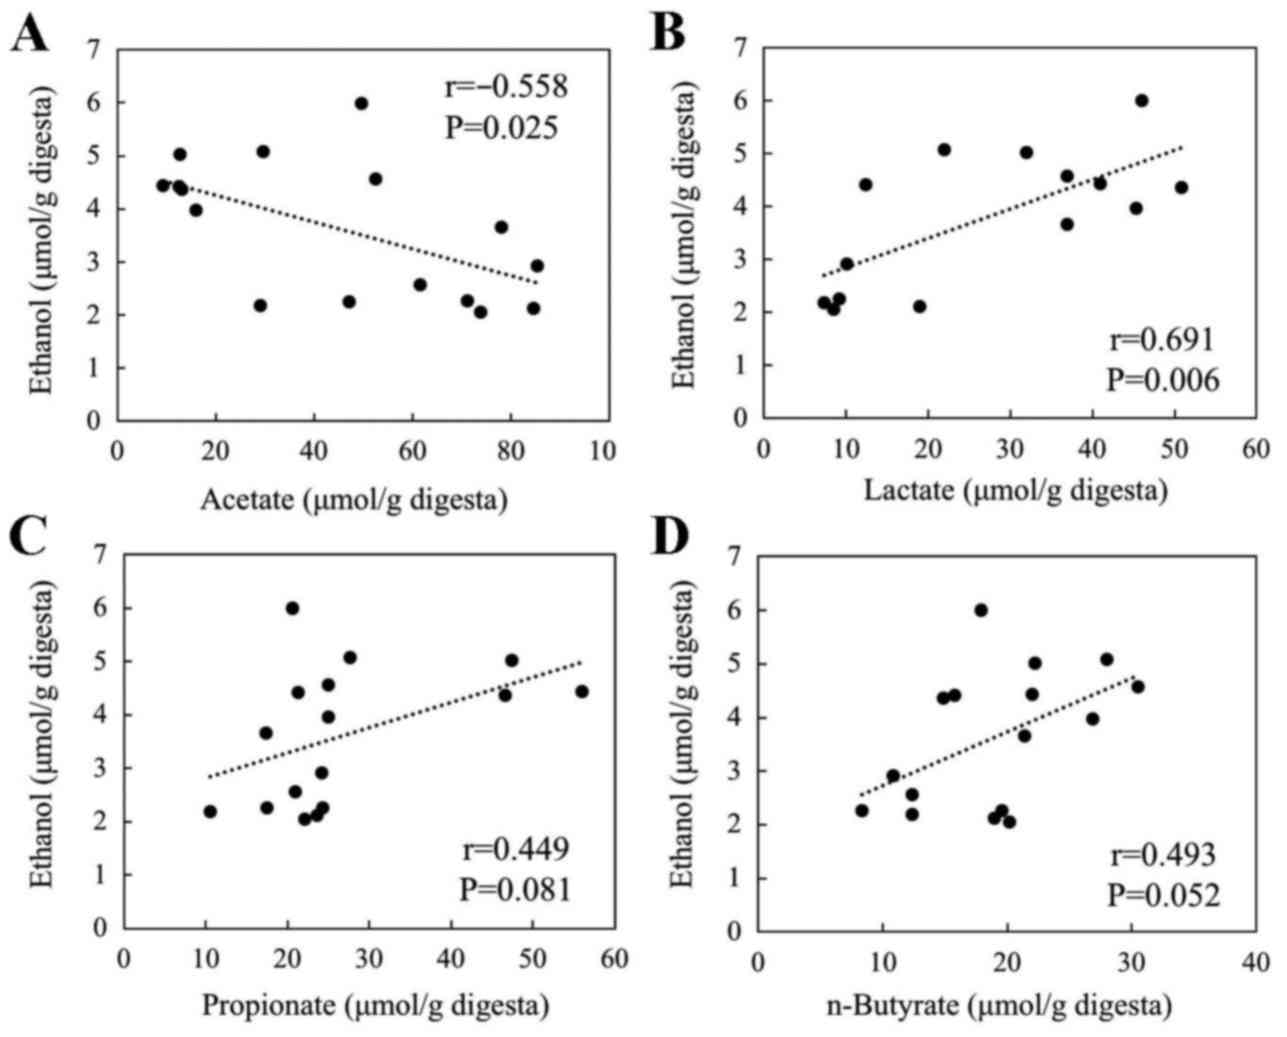
Succinate and acetate levels per gram of cecum
digesta were decreased by FOS intake (2.5- and 2.7-fold decrease,
respectively; P<0.05; Table II).
By contrast, FOS intake significantly increased lactate, propionate
and n-butyrate levels per gram of cecum digesta (2.4-, 1.7- and
1.4-fold, respectively; P<0.05; Table
II). In the total cecum digesta, the levels of lactate,
propionate, n-butyrate and total SCFAs were markedly increased by
the FOS diet (10.3-, 7.3-, 6.0- and 4.0-fold, respectively,
P<0.01). The ethanol levels per gram of cecum digesta were
negatively correlated with acetate levels (r=−0.558, P=0.025;
Fig. 3A) and positively correlated
with lactate levels (r=0.691, P=0.006; Fig. 3B). However, ethanol levels were not
significantly correlated with the level of propionate (r=0.449,
P=0.081; Fig. 3C) or butyrate
(r=0.493, P=0.052; Fig. 3D).
Discussion
The present study demonstrated, to the best of our
knowledge for the first time, that FOS intake significantly
increased ethanol levels in the intestinal digesta of rats without
direct consumption of ethanol. The results further indicated that
the cecum levels of ethanol were associated with
Bifidobacterium numbers. Previous in vitro studies
have indicated that ethanol is produced by Bifidobacterium
from glucose or FOS (2,3). Other in vitro studies have
suggested that the addition of FOS stimulates the growth of
Bifidobacterium (6,7). Therefore, the increase in intestinal
ethanol levels may, at least in part, be mediated by an increased
abundance of Bifidobacterium bacteria in the intestines of
rats fed FOS. However, a previous study suggested ethanol is
degraded to acetate by intestinal bacteria such as
Bifidobacterium and Lactobacillus (19). Taken together, it may be hypothesized
that Bididobacterium serves a role in the degradation of
ethanol in rats following consumption of ethanol, while
Bifidobacterium may stimulate the production of ethanol in
rats lacking consumption of ethanol. Since the abundance of cecum
Lactobacillus was unaffected by FOS in the current study,
the possibility of the involvement of Lactobacillus in the
mechanisms underlying the increase in intestinal ethanol was
negated. At present, the possibilities of higher production and/or
lower degradation of ethanol by other intestinal bacteria in rats
fed FOS remains to be examined. A recent metagenome study
demonstrated that FOS intake increased or decreased the abundance
of a variety of bacteria in addition to Bifidobacterium in
rats (20). Accordingly, further
in vitro study is necessary to investigate if each of the
intestinal bacteria present can produce or degrade ethanol.
Bifidobacterium is established to be a
producer of lactate and ethanol (2,3). The
current study also identified a significant positive correlation
between the cecum levels of ethanol and lactate. It has been
suggested that lactate is produced from pyruvate and that ethanol
is produced from acetyl-CoA, a metabolite of pyruvate, in
Bifidobacterium (2,3). Therefore, higher production of lactate
may be associated with a higher production of ethanol. Further
studies should be conducted to elucidate the underlying mechanisms
of higher production of ethanol following elevated FOS intake.
High ethanol intake is well established to cause
toxic effects and increase the risk of several diseases, including
liver disease, coronary heart diseases and cancer (21). However, previous studies have
suggested that low or moderate ethanol intake is associated with a
lower risk of developing diseases including coronary heart disease,
brain diseases and cancers (10,11).
Previous experimental studies by our group have also suggested
beneficial effects of a low ethanol dose on liver function and
aging in rodents (22,23). Therefore, further studies are
necessary to investigate whether increased ethanol levels in rats
fed FOS are equivalent to the toxic or beneficial levels reported
in animals, and to determine the overall ethanol production rate by
intestinal microflora in rats fed FOS. In this regard, a study by
Zhong et al (24) reported
that rats administered a Lieber-DeCarli liquid diet mixed with 5%
(w/v) ethanol for 8 weeks exhibited an elevation in cecum ethanol
levels from 2–3 to 20–30 µmol/g digesta. The increased intestinal
ethanol levels were associated with fatty liver disease pathology
and reduced intestinal barrier function (24). Their results imply that increased
levels of cecum ethanol (>20 µmol per gram of digesta) in rats
fed ethanol may be harmful for the host. A more recent study using
Caco-2 cells monolayers as an in vitro tight junction model
indicated that the addition of 6% (v/v, 1 mmol/ml) ethanol to the
culture medium decreased intestinal cell barrier function, although
cell viability and lactate dehydrogenase release (cytotoxicity)
were unaffected (25). The current
study identified the production of 4–5 µmol ethanol per gram of
cecum digesta in rats fed FOS. Thus, the levels of ethanol in
FOS-fed rats appear to be lower than the harmful levels of ethanol
reported (24,25). Further study is necessary to
investigate whether the increased ethanol levels in the cecum of
rats fed FOS are close to the beneficial levels in those
administered low-dose ethanol in our previous studies (22,23).
In conclusion, the current study demonstrated that
dietary FOS increased ethanol levels in the intestinal digesta of
rats fed a HF diet. The results imply that FOS intake has an impact
on intestinal health by increasing ethanol levels. The findings
also indicate the importance of dietary prebiotics as an
environmental factor in alcohol-use disorders and may provide novel
insight into the link between prebiotics and diseases related to
alcohol consumption.
Acknowledgements
This study was presented as part of an abstract at
the 17th Global Dieticians and Nutritionists Annual Meeting October
3 2017 in Kuala Lumpur, Malaysia and published under Masahiro
Yamaguchi et al in J Nutr Food Sci 7: 6, 2017.
Funding
The current study was financially supported by the
HIRAKU consortium, Hiroshima University.
Availability of data and materials
The analyzed data sets generated during the study
are available from the correspondence author on reasonable
request.
Authors' contributions
MY, YY and NK contributed to the study design, MY,
YY, MA and YO acquired the data. MY and TK analyzed and interpreted
the data. MY and NK wrote the manuscript and approved the contents
of the manuscript. The final version of the manuscript has been
read and approved by all authors.
Ethics approval and consent to
participate
The study protocol was approved by the institutional
ethics committee of Hiroshima University (approval no: C15-12).
Consent for publication
Not applicable.
Competing interests
The authors declare that they have no competing
interests.
Glossary
Abbreviations
Abbreviations:
|
FOS
|
fructooligosaccharides
|
|
SCFAs
|
short-chain fatty acids
|
|
HF
|
high-fat
|
|
qPCR
|
quantitative polymerase chain
reaction
|
|
HPLC
|
high-performance liquid
chromatography
|
References
|
1
|
Cope K, Risby T and Diehl AM: Increased
gastrointestinal ethanol production in obese mice: Implications for
fatty liver disease pathogenesis. Gastroenterology. 119:1340–1347.
2000. View Article : Google Scholar : PubMed/NCBI
|
|
2
|
van der Meulen R, Adriany T, Verbrugghe K
and De Vuyst L: Kinetic analysis of bifidobacterial metabolism
reveals a minor role for succinic acid in the regeneration of NAD+
through its growth-associated production. Appl Environ Microbiol.
72:5204–5210. 2006. View Article : Google Scholar : PubMed/NCBI
|
|
3
|
Rivière A, Selak M, Lantin D, Leroy F and
De Vuyst L: Bifidobacteria and butyrate producing colon bacteria:
Importance and strategies for their stimulation in the human gut.
Front Microbiol. 7:979–990. 2016. View Article : Google Scholar : PubMed/NCBI
|
|
4
|
Elshaghabee FM, Bockelmann W, Meske D, de
Vrese M, Walte HG, Schrezenmeir J and Heller KJ: Ethanol production
by selected intestinal microorganisms and lactic acid bacteria
growing under different nutritional conditions. Front Microbiol.
7:47–59. 2016. View Article : Google Scholar : PubMed/NCBI
|
|
5
|
Barona M, Roy D and Vuillemard JC:
Biochemical characteristics of fermented milk produced by mixed
cultures of lactic starters and bifidobacteria. Lait. 80:465–478.
2000. View Article : Google Scholar
|
|
6
|
Sharp R, Fishbain S and Macfarlane GT:
Effect of short-chain carbohydrates on human intestinal
bifidobacteria and Escherichia coli in vitro. J Med Microbiol.
50:152–160. 2001. View Article : Google Scholar : PubMed/NCBI
|
|
7
|
Mao B, Li D, Zhao J, Liu X, Gu Z, Chen YQ,
Zhang H and Chen W: In vitro fermentation of fructooligosaccharides
with human gut bacteria. Food Funct. 6:947–954. 2015. View Article : Google Scholar : PubMed/NCBI
|
|
8
|
Cummings JH, Macfarlane GT and Englyst HN:
Prebiotic digestion and fermentation. Am J Clin Nutr. 73:415S–420S.
2001. View Article : Google Scholar : PubMed/NCBI
|
|
9
|
Pandey KR, Naik SR and Vakil BV:
Probiotics, prebiotics and synbiotics- a review. J Food Sci
Technol. 52:7577–7587. 2015. View Article : Google Scholar : PubMed/NCBI
|
|
10
|
Fekjaer HO: Alcohol - a universal
preventive agent? A critical analysis. Addiction. 108:2051–2057.
2013. View Article : Google Scholar : PubMed/NCBI
|
|
11
|
Muñoz G, Urrutia JC, Burgos CF, Silva V,
Aguilar F, Sama M, Yeh HH, Opazo C and Aguayo LG: Low
concentrations of ethanol protect against synaptotoxicity induced
by Aβ in hippocampal neurons. Neurobiol Aging. 36:845–856. 2015.
View Article : Google Scholar : PubMed/NCBI
|
|
12
|
Hamilton MK, Ronveaux CC, Rust BM, Newman
JW, Hawley M, Barile D, Mills DA and Raybould HE: Prebiotic milk
oligosaccharides prevent development of obese phenotype, impairment
of gut permeability, and microbial dysbiosis in high fat-fed mice.
Am J Physiol Gastrointest Liver Physiol. 312:G474–G487. 2017.
View Article : Google Scholar : PubMed/NCBI
|
|
13
|
Tunapong W, Apaijai N, Yasom S, Tanajak P,
Wanchai K, Chunchai T, Kerdphoo S, Eaimworawuthikul S, Thiennimitr
P, Pongchaidecha A, et al: Chronic treatment with prebiotics,
probiotics and synbiotics attenuated cardiac dysfunction by
improving cardiac mitochondrial dysfunction in male obese insulin
resistant rats. Eur J Nutr. 57:2091–2104. 2018. View Article : Google Scholar : PubMed/NCBI
|
|
14
|
Yang Y, Iwamoto A, Kumrungsee T, Okazaki
Y, Kuroda M, Yamaguchi S and Kato N: Consumption of an acid
protease derived from Aspergillus oryzae causes bifidogenic effect
in rats. Nutr Res. 44:60–66. 2017. View Article : Google Scholar : PubMed/NCBI
|
|
15
|
Coudray C, Tressol JC, Gueux E and
Rayssiguier Y: Effects of inulin-type fructans of different chain
length and type of branching on intestinal absorption and balance
of calcium and magnesium in rats. Eur J Nutr. 42:91–98. 2003.
View Article : Google Scholar : PubMed/NCBI
|
|
16
|
Reeves PG, Nielsen FH and Fahey GC Jr:
AIN-93 purified diets for laboratory rodents: Final report of the
American Institute of Nutrition ad hoc writing committee on the
reformulation of the AIN-76A rodent diet. J Nutr. 123:1939–1951.
1993. View Article : Google Scholar : PubMed/NCBI
|
|
17
|
Heit C, Eriksson P, Thompson DC,
Charkoftaki G, Fritz KS and Vasiliou V: Quantification of Neural
Ethanol and Acetaldehyde Using Headspace GC-MS. Alcohol Clin Exp
Res. 40:1825–1831. 2016. View Article : Google Scholar : PubMed/NCBI
|
|
18
|
Okazaki Y, Tomotake H, Tsujimoto K, Sasaki
M and Kato N: Consumption of a resistant protein, sericin, elevates
fecal immunoglobulin A, mucins, and cecal organic acids in rats fed
a high-fat diet. J Nutr. 141:1975–1981. 2011. View Article : Google Scholar : PubMed/NCBI
|
|
19
|
Nosova T, Jousimies-Somer H, Jokelainen K,
Heine R and Salaspuro M: Acetaldehyde production and metabolism by
human indigenous and probiotic Lactobacillus and Bifidobacterium
strains. Alcohol Alcohol. 35:561–568. 2000. View Article : Google Scholar : PubMed/NCBI
|
|
20
|
Liu J, Kandasamy S, Zhang J, Kirby CW,
Karakach T, Hafting J, Critchley AT, Evans F and Prithiviraj B and
Prithiviraj B: Prebiotic effects of diet supplemented with the
cultivated red seaweed Chondrus crispus or with
fructo-oligo-saccharide on host immunity, colonic microbiota and
gut microbial metabolites. BMC Complement Altern Med. 15:2792015.
View Article : Google Scholar : PubMed/NCBI
|
|
21
|
Rehm J, Gmel GE Sr, Gmel G, Hasan OSM,
Imtiaz S, Popova S, Probst C, Roerecke M, Room R, Samokhvalov AV,
et al: The relationship between different dimensions of alcohol use
and the burden of disease-an update. Addiction. 112:968–1001. 2017.
View Article : Google Scholar : PubMed/NCBI
|
|
22
|
Osaki A, Okazaki Y, Kimoto A, Izu H and
Kato N: Beneficial effect of a low dose of ethanol on liver
function and serum urate in rats fed a high-fat diet. J Nutr Sci
Vitaminol (Tokyo). 60:408–412. 2014. View Article : Google Scholar : PubMed/NCBI
|
|
23
|
Kimoto A, Izu H, Fu C, Suidasari S and
Kato N: Effects of low dose of ethanol on the senescence score,
brain function and gene expression in senescence-accelerated mice 8
(SAMP8). Exp Ther Med. 14:1433–1440. 2017. View Article : Google Scholar : PubMed/NCBI
|
|
24
|
Zhong W, Li Q, Zhang W, Sun Q, Sun X and
Zhou Z: Modulation of Intestinal Barrier and Bacterial Endotoxin
Production Contributes to the Beneficial Effect of Nicotinic Acid
on Alcohol-Induced Endotoxemia and Hepatic Inflammation in Rats.
Biomolecules. 5:2643–2658. 2015. View Article : Google Scholar : PubMed/NCBI
|
|
25
|
Chopyk DM, Kumar P, Raeman R, Liu Y, Smith
T and Anania FA: Dysregulation of junctional adhesion molecule-A
contributes to ethanol-induced barrier disruption in intestinal
epithelial cell monolayers. Physiol Rep. 5:e135412017. View Article : Google Scholar
|