Introduction
Rapid eye movement (REM) sleep is important for the
development and maturation of animal nervous systems and is
associated with thermoregulation and autonomic nervous functions
(1). Cerebral oxygen consumption is
significantly higher during the REM sleep period, as compared with
the strong physical and mental activity states; and cerebral
protein synthesis also significantly increases during REM sleep
(2). Therefore, REM sleep has an
important role in advanced cerebral functions, including learning,
memory and emotion, and is the predominant form of recovery for the
human body (3,4). However, an increasing number of
individuals are suffering from sleep deprivation of varying degrees
(5). Previous studies have
demonstrated that REM sleep deprivation severely affects cognitive
abilities, including learning, memory, logical reasoning,
mathematical operations and decision-making, which are damaged to
varying extents (6,7). The pathological mechanisms underlying
this damage have yet to be fully elucidated.
The sleep-waking cycle is controlled by the two
major systems of waking neurons and sleep-promoting neurons.
Sleep-promoting neurons are predominantly composed of
γ-aminobutyric acid (GABA) neurons, whereas waking neurons are more
diverse (8). Waking neurons comprise
various neuronal systems, using numerous neurotransmitters
including glutamic acid (Glu), noradrenaline, dopamine,
5-hydroxytryptamine, histamine and acetyl choline (9). The hypocretin (Hcrt) system is
correlated with the characterized waking neuron and sleep-promoting
neuron systems (10–12). The hypothalamus also has an important
role in the regulation of the sleep-waking cycle. Perifornical
nucleus (PeF) Hcrt neurons receive intensive GABA fiber projection
from the preoptic region, indicating that the Hcrt nervous system
is associated with the GABA nervous system in the hypothalamus
(13–15).
In the present study, normal adult male rats were
used to establish models of REM sleep deprivation in order to
observe the effect of REM sleep deprivation and revival sleep (RS)
of varying degrees on the cognitive functions (CF) of the rats. The
following parameters were assessed: Number and morphology of Hcrt
neurons; Fos expression levels in the lateral hypothalamic area
(LH) of the hypothalamus; GABA content; and the expression of
GABAA receptor α1 subunit in the
hypothalamus. The present study aimed to investigate the effect of
REM sleep deprivation on the activity of the hypothalamic Hcrt
nervous system and GABA nervous system, as well as the interaction
between the two neuron systems and their association with the
diminished CF arising from REM sleep deprivation via cerebral
stereotaxic surgery and intervention with a PeF micro-dialysis
GABAA receptor antagonist, gabazine, and GABA re-uptake
inhibitor, tiagabine.
Materials and methods
Experimental animals and groups
A total of 180 male Sprague-Dawley rats, aged 14–16
years and weighing 250–280 g, were purchased from Nanjing Better
Biotechnology Co., Ltd. (Nanjing, China). All rats were housed in a
controlled temperature (22°C) and under a 12-h light/dark cycle
with ad libitum access to food and water. The rats were
randomly divided into control (n=60) and REM sleep deprivation
(n=120) groups. The control group was subdivided into blank control
(CC) and environmental control (TC) groups (n=30 rats/group), and
the REM sleep deprivation group was subdivided into the
non-operative control (nonOP), sham operation control (Sham),
gabazine (SR) and tiagabine groups (n=30 rats/group). Each group
was evaluated at five points in time: Sleep deprived for 1 day (SD
1 day), SD 3 day, SD 5 day, sleep recovery 6 h (RS 6 h) and RS 12
h. At total of 6 rats were evaluated at each time point. Following
weighing, the rats were maintained in the same cage. The present
study was approved by the Ethics Committee of Inner Mongolia
Medical University (Hohhot, China).
Reagents and instruments
Gabazine and tiagabine were purchased from
Sigma-Aldrich (St. Louis, MO, USA), and gentian violet solution was
obtained from Sinopharm Chemical Reagent Co., Ltd. (Shanghai,
China). Rabbit anti-Hcrt A polyclonal antibody (cat. no. BA1676)
mouse anti-c-Fos monoclonal antibody (cat. no. BM1820), rabbit
anti-GABAARαl polyclonal antibody (cat. no. BA0873), fluorescein
isothiocyanate (FITC)-conjugated goat anti-rabbit immunoglobulin
(Ig) G (cat. no. BA1105), cyanine (Cy)3-conjugated goat anti-rabbit
IgG (cat. no. BA1032) and horseradish peroxidase (HRP)-conjugated
goat anti-mouse IgG (cat. no. BA1051) were purchased from Boster
Wuhan Biological Engineering, Co., Ltd. (Wuhan, China). A Universal
Morris Water Maze was obtained from Shanghai Jiliang Software
Technology Co., Ltd. (Shanghai, China), and the small-scale animal
cerebral stereotaxic apparatus was purchased from Stoelting Co.
(Wood Dale, IL, USA). The Multiskan MK3 Microplate Reader was
purchased from Thermo Fisher Scientific, Inc. (Waltham, MA, USA),
the electrophoresis apparatus from Beijing Liuyi Instrument Factory
(Beijing, China), and the Nikon E600 fluorescence microscope from
Nikon Corporation (Tokyo, Japan). The QWin Plus image analysis
system and VT1200 S tissue slicer were obtained from Leica
Microsystems GmbH (Wetzlar, Germany), Photoshop 7.0 software was
from Microsoft Corporation (Redmond, WA, USA), and Image-Pro Plus
software 7.0 was from Media Cybernetics, Inc. (Rockville, MD, USA).
The Varian ProStar 230 high performance liquid chromatography
(HPLC) equipment and the 9075 Fluorescence Detector were obtained
from Varian Medical Systems, Inc. (Palo Alto, CA, USA), and Star
50c software was from Samsung (Seoul, South Korea). Artificial
cerebrospinal fluid (aCSF) was prepared in the laboratory,
according to a previous study (16).
Establishment of REM sleep deprivation
rat models
Based on the rat localization map outlined by
Paxinos and Watson (17), PeF was
selected in the rats of the Sham, gabazine and tiagabine groups. A
hole (diameter, 1.0 mm) was drilled and a stainless steel sleeve
was vertically implanted once the cerebrospinal fluid had
outflowed. A modified multiple platform REM sleep deprivation
method was used to establish a REM sleep deprivation model, as
previously described (18). Rats
were awoken by nutation or water immersion in order to prevent the
rats from entering the REM sleep period, thus leading to REM sleep
deprivation. The muscle tone of the rats decreased when they
entered the REM sleep period. Rats stayed on the platform for 1
week (1 h daily) prior to the experiment. Subsequently, the Morris
water maze test was used to determine alterations in the CF of the
rats, as assessed by the escape latencies and space exploratory
behavior, following REM sleep deprivation for varying durations and
sleep recovery.
Micro-dialysis administration
Micro-dialysis administration was performed on the
rats in the Sham, SR, and tiagabine groups during REM sleep
deprivation at 8:00–10:00 a.m. each morning (19). Injection was performed slowly at a
speed of 1 µl/30 sec. The rats in the Sham group were injected with
1 µl aCSF, whereas 0.2 µM/µl gabazine and 0.5 µM/µl tiagabine were
dissolved in 1 µl aCSF and injected into the rats in the gabazine
and tiagabine groups, respectively. The hypothalamic PeF region was
observed in CSF extraction to assess the effects of the gabazine
GABAA receptor antagonist and tiagabine GABA re-uptake
inhibitor.
Immunofluorescence staining to assess
c-Fos expression in the LH Hcrt neurons of rats
Complete hypothalamus brain tissue was harvested
from between the optic chiasma and mammillary body posterior, which
was cut vertically and coronally (20,21).
Brain tissue was cut into 20 µm-thick coronal serial sections using
a VT1200 S tissue slicer. There were three groups of tissue
sections and the sections from each group were stored in separate
specimen boxes. The tissue sections were incubated at room
temperature for 24 h with rabbit anti-Hcrt A (1:200) and mouse
anti-c-Fos (1:4,000) monoclonal antibodies. Following washing three
times for 5 min each with PBS, the tissue sections were incubated
at room temperature for 4 h with FITC-conjugated goat anti-rabbit
IgG (1:200), Cy3-conjugated goat anti-rabbit IgG (1:200) and
HRP-conjugated goat anti-mouse IgG (1:100). For visualization of
the HRP-conjugated secondary antibody, the tissue sections were
incubated with 3,3-diaminobenzidine (cat. no. P0203; DAB
Horseradish Peroxidase Color Development kit; Beyotime Institute of
Biotechnology, Haimen, China). In the blank control group, normal
rabbit and goat serum were used as substitutes. Control tissue
sections were taken and the steps were completed as before.
Staining was evaluated by observation with a Nikon E600
fluorescence microscope. Images were captured and analyzed using
the QWin Plus image analysis system.
Determination of GABA and Glu content
in the hypothalamus of the rats
The hypothalamus was harvested and cut into sections
(22,23). A total of 10 mg hypothalamus tissue
was weighed and centrifuged at 5,000 × g at 0°C for 15 min. The
supernatant was dissolved in the aCSF at a concentration of 1.0
mmol/l and refrigerated. The solution was diluted to 10X and 100X
with aCSF prior to use. Varian Prostar 230 HPLC, Star 9075
fluorescence detector and Star software were used for gradient
control and chromatographic data treatment and determination of the
content of GABA and Glu in the hypothalamus. A calibration curve
was plotted with standard concentration vs. peak area. Specimen
concentrations were calculated using the external standard
method.
Immunofluorescence detection of
GABAARα1 σ-subunit expression in the hypothalamus of
rats
The third group of tissue sections were incubated at
room temperature for 24 h with rabbit anti-GABAARαl antibody
(1:200), as previously described (24). The tissue sections were subsequently
incubated at room temperature for 4 h with Cy3-conjugated goat
anti-rabbit IgG antibody (1:200). Normal rabbit and goat serum
served as the negative control and the subsequent steps were
completed as before. The tissue sections were observed under a
low-power microscope (Olympus CX23; Olympus Corporation, Tokyo,
Japan) to determine the positive expression region. Five fields
were selected under a high-power microscope (XTJ-4400; Wuzhou New
Found Instrument, Co., Ltd., Wuzhou, China) and an Image Pro Plus
7.0 software was used to analyze the images. The integrated optical
density (IOD) was measured on the yellow portion of the image.
Statistical treatment
SPSS 17.5 statistical software (SPSS, Inc., Chicago,
IL, USA) was used to perform the statistical analyses. Data were
expressed as the mean ± standard error of the mean. Self-control
data prior to and following REM sleep deprivation at each time
point in each group were subjected to a t-test of randomized
matched pair design data mean. The Levene's test was used to assess
homogeneity of variance. Single factor multilevel variance analysis
was used to analyze comparisons at various time points in each
group. Inter-group comparisons at various time points were assessed
via multi-factor variance analysis. P<0.05 was considered to
indicate a statistically significant difference.
Results
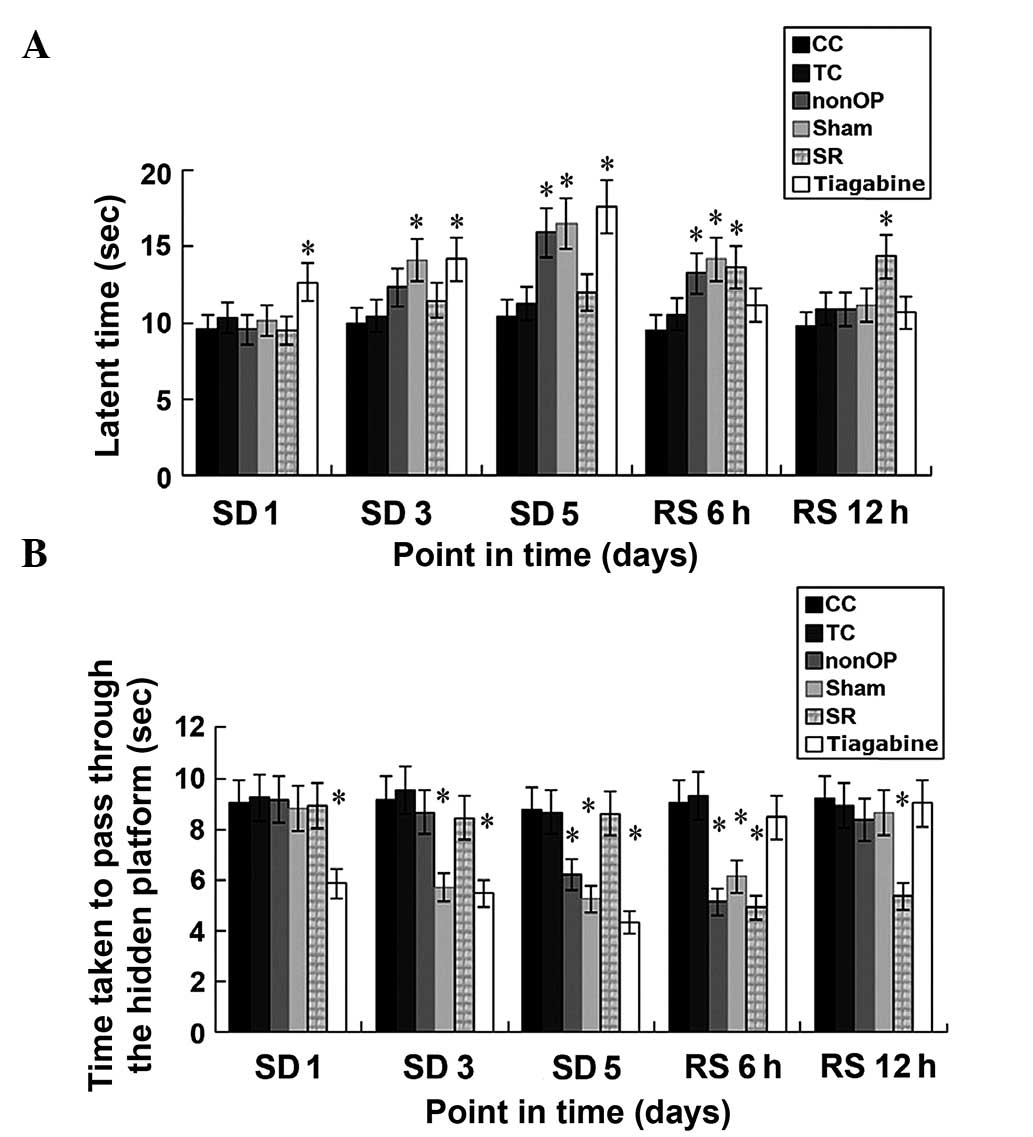
Cognitive behavior
Based on the comparison between the nonOP group and
Sham group, and the CC group and TC group, the CF at three points
in time, SD 3 day, SD 5 day and RS 6 h diminished significantly
(P<0.05); however no significant difference in CF was detected
at SD 1 day and RS 12 h. The CF of the rats in the SR group were
significantly diminished at SD 1 day, SD 3 day, and SD 5 day
(P<0.05), whereas no significant difference in CF was detected
at RS 6 h and RS 12 h, as compared with the CC and TC groups.
Furthermore, no significant difference in CF was detected in the
rats in the tiagabine group at SD 1 day, SD 3 day and SD 5 day, as
compared with the CC and TC groups; although CF were significantly
diminished at SD 1 day and RS 12 h (P<0.05; Tables I and II; Fig.
1).
 | Table I.Escape latencies prior to and
following REM sleep deprivation (n=6 rats/group). |
Table I.
Escape latencies prior to and
following REM sleep deprivation (n=6 rats/group).
| Time | CC | TC | nonOP | ShamOP | Gabazine | Tiagabine |
|---|
| SD 1 day |
9.34±1.31 |
9.14±1.91 |
9.14±1.83 |
9.23±1.06 |
9.26±1.52 |
12.54±2.42a,b |
| SD 3 day |
9.78±1.71 |
10.07±2.02 |
12.16±2.27a,b |
14.23±1.69a,b |
11.27±2.07 |
14.28±2.47a,b |
| SD 5 day |
10.04±2.07 |
11.01±2.01 |
15.52±3.32a,b |
16.20±2.53a,b |
12.17±2.01 |
17.47±3.25a,b |
| RS 6 h |
9.28±1.21 |
10.12±1.74 |
13.03±1.52a,b |
14.22±2.47a,b |
13.46±2.65a,b |
11.26±2.13 |
| RS 12 h |
9.26±1.77 |
10.14±2.23 |
10.27±1.41 |
11.26±1.78 |
14.24±2.65a,b |
10.42±2.27 |
| Table II.Space exploration behavior prior to
and following REM sleep deprivation (n=6 rats/group). |
Table II.
Space exploration behavior prior to
and following REM sleep deprivation (n=6 rats/group).
| Time | CC | TC | nonOP | ShamOP | Gabazine | Tiagabine |
|---|
| SD 1 day |
8.59±1.62 |
8.72±1.63 |
8.45±1.56 |
8.54±1.32 |
8.72±1.56 |
5.59±2.01a,b |
| SD 3 day |
9.32±1.40 |
9.24±1.75 |
6.67±1.21a,b |
5.77±2.33a,b |
8.01±1.47 |
5.39±2.29a,b |
| SD 5 day |
7.74±1.55 |
8.41±1.67 |
5.36±1.56a,b |
5.42±1.32a,b |
8.26±2.36 |
4.13±1.14a,b |
| RS 6 h |
9.25±1.63 |
8.75±1.75 |
6.36±1.32a,b |
6.26±2.06a,b |
4.65±1.59a,b |
7.26±2.21 |
| RS 12 h |
9.28±1.63 |
8.71±2.23 |
7.45±1.56 |
7.59±2.47 |
5.47±1.98a,b |
7.37±2.12 |
Immunofluorescence staining for c-Fos
expression in LH Hcrt neurons of rats
No significant differences in the number of
Fos-positive, Hcrt-positive and Fos-Hcrt double-positive
(F+&H+) cells were detected in the
lateral region of the hypothalamus of rats in the TC and CC groups
at various time points. The number of
F+&H+ cells was significantly increased
in the nonOP, Sham and tiagabine groups at SD 1 day, as compared
with the CC and TC groups (P<0.05). The number of the Fos
positive cells in the tiagabine group was also significantly
increased, as compared with the CC and TC groups (P<0.05).
However, no significant differences in the number of Fos positive
cells was detected in various groups, as compared with the CC group
and TC group. The number of the Fos-positive and
F+&H+ cells in the nonOP, Sham and
tiagabine groups at SD 3 day and SD 5 day was significantly
increased, as compared with the CC and TC groups (P<0.05).
However, no significant differences in the number of Fos-positive
and F+&H+ cells were detected in the
gabazine group, as compared with the CC and TC groups. No
significant difference in the number of Fos positive cells and
F+&H+ cells were detected at RS 6 h and
RS 12 h in the nonOP, Sham and tiagabine groups, as compared with
the CC and TC groups. However, the number of the Fos-positive cells
and F+&H+ cells in the gabazine group was
significantly increased, as compared with the CC and TC groups
(P<0.05; Table III, Figs. 2 and 3).
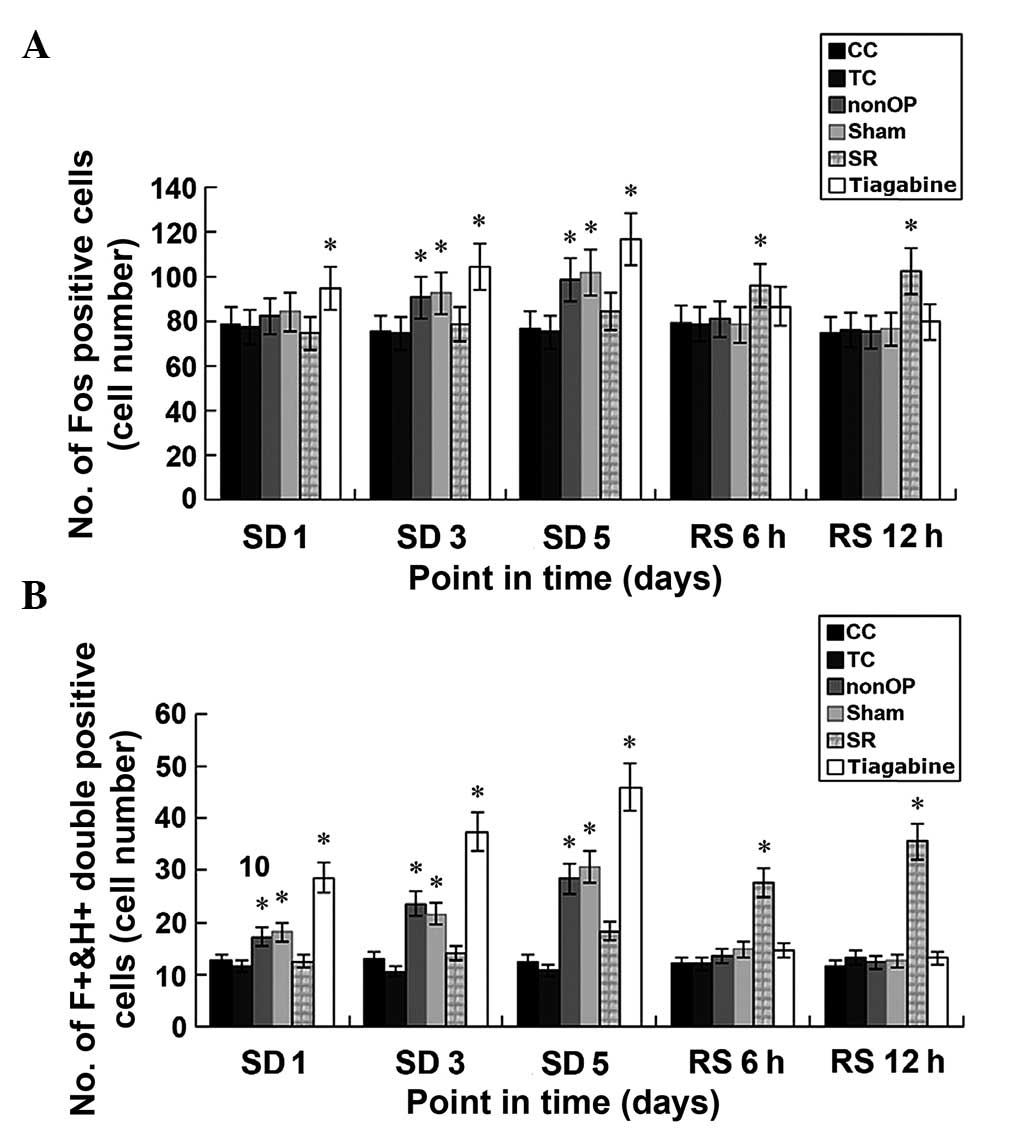 | Figure 2.(A) Number of Fos-positive cells among
and within groups in the lateral region of the hypothalamus of
rats. (B) F+&H+cells among and within
groups in the lateral region of the hypothalamus of rats among and
within groups. *P<0.05, vs. the CC and TC groups. REM, rapid eye
movement; CC, blank control; TC, environmental control; nonOP,
non-operative control; Sham, sham operation control; SD, sleep
deprived; RS, sleep recovery; SR, gabazine;
F+&H+, Fos-hypocretin double
positive. |
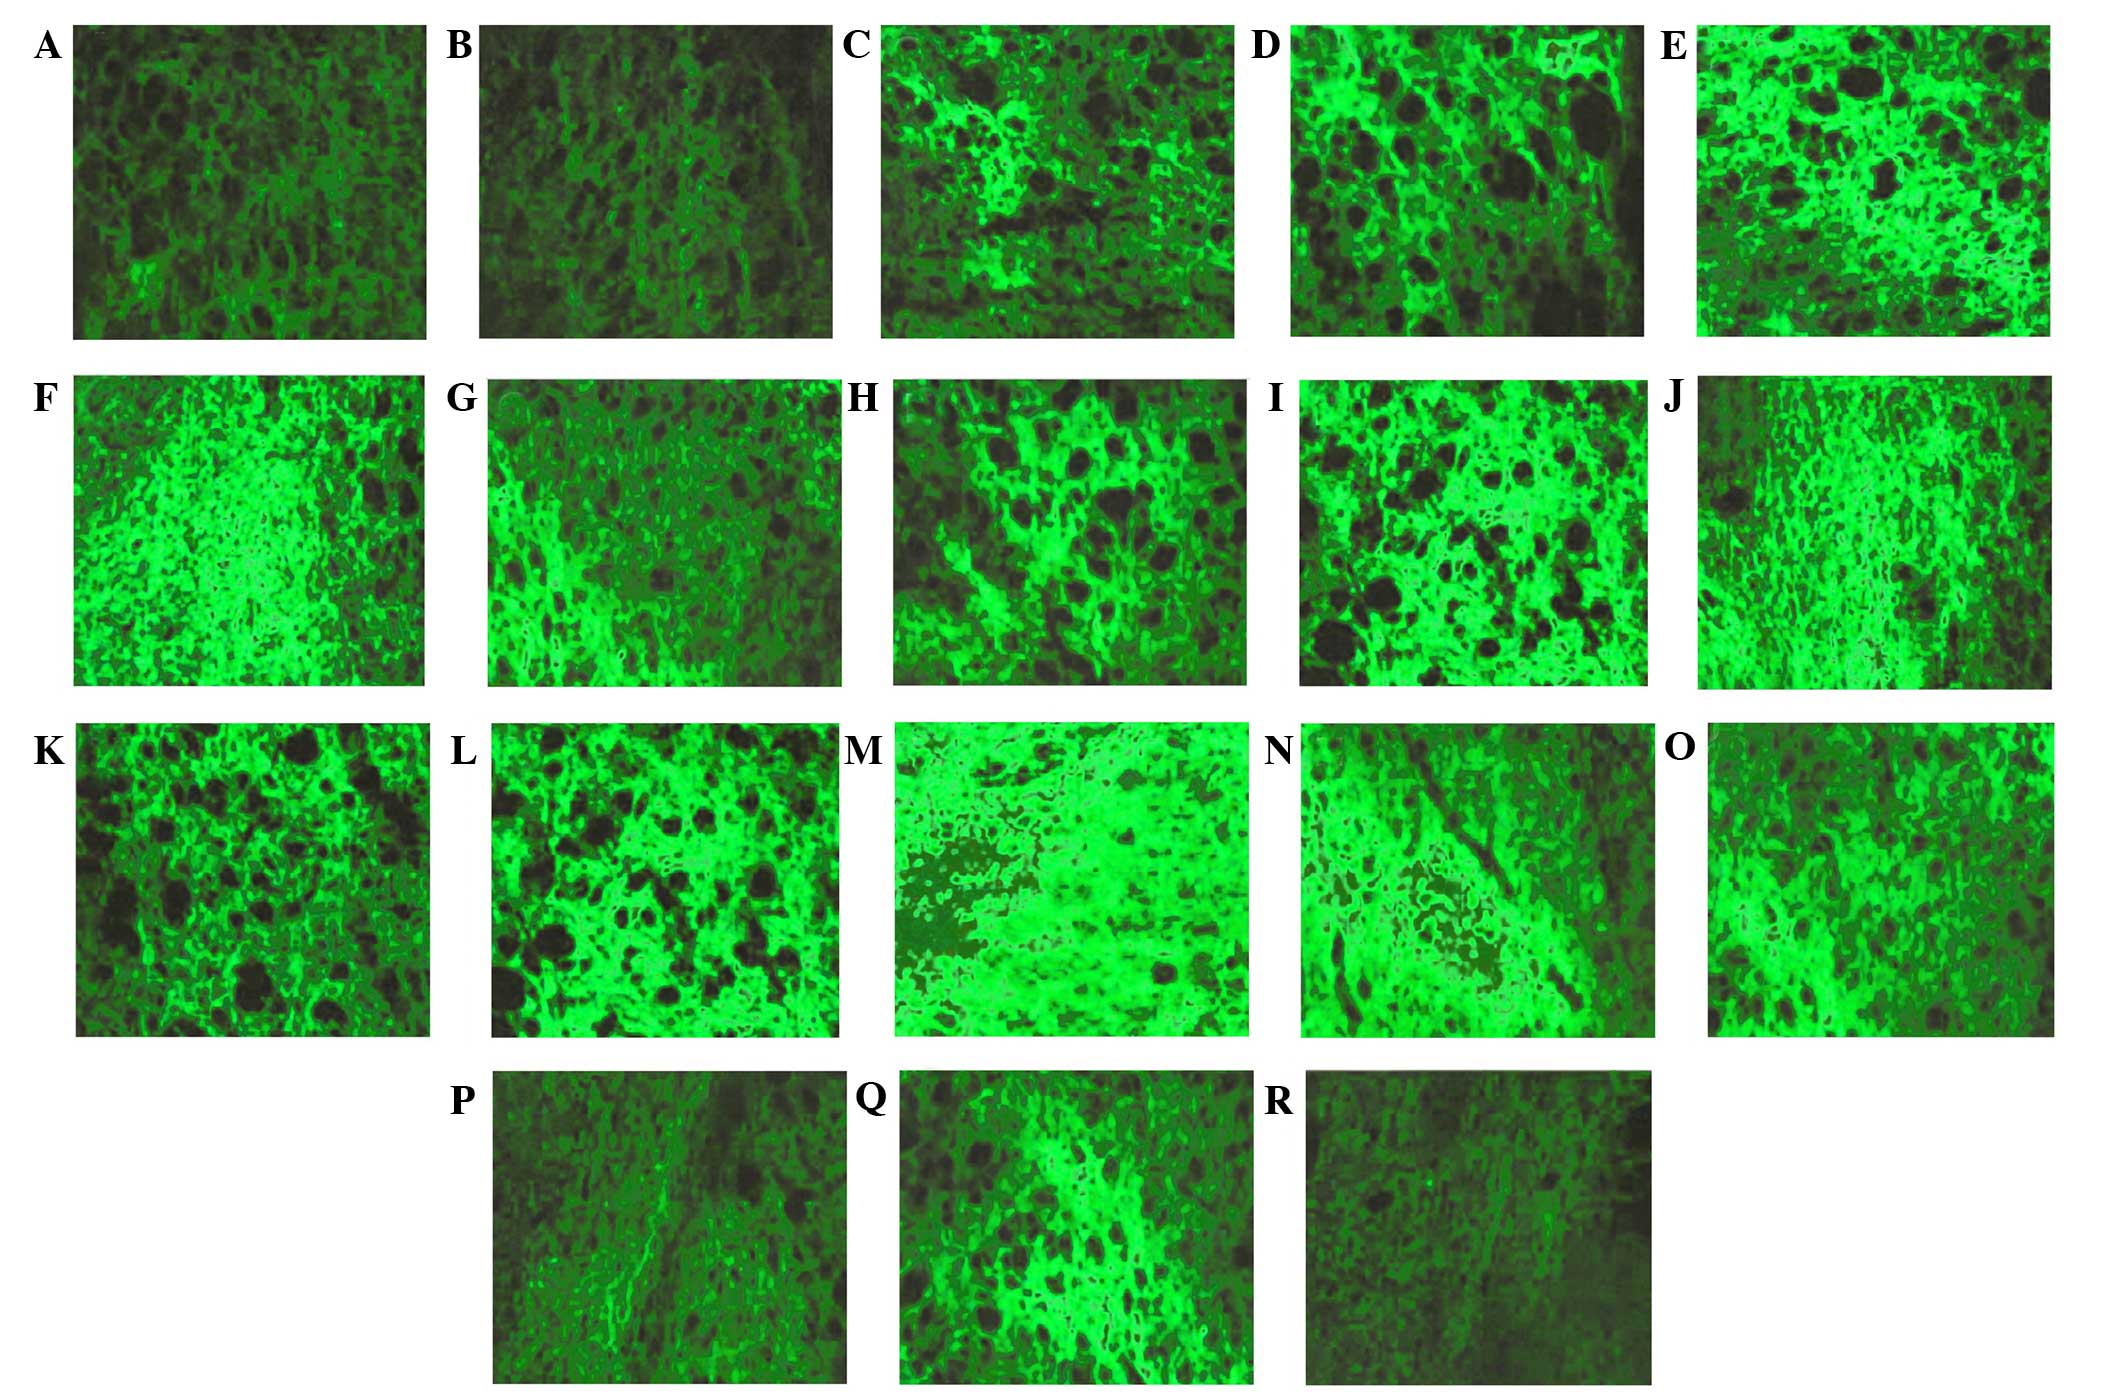
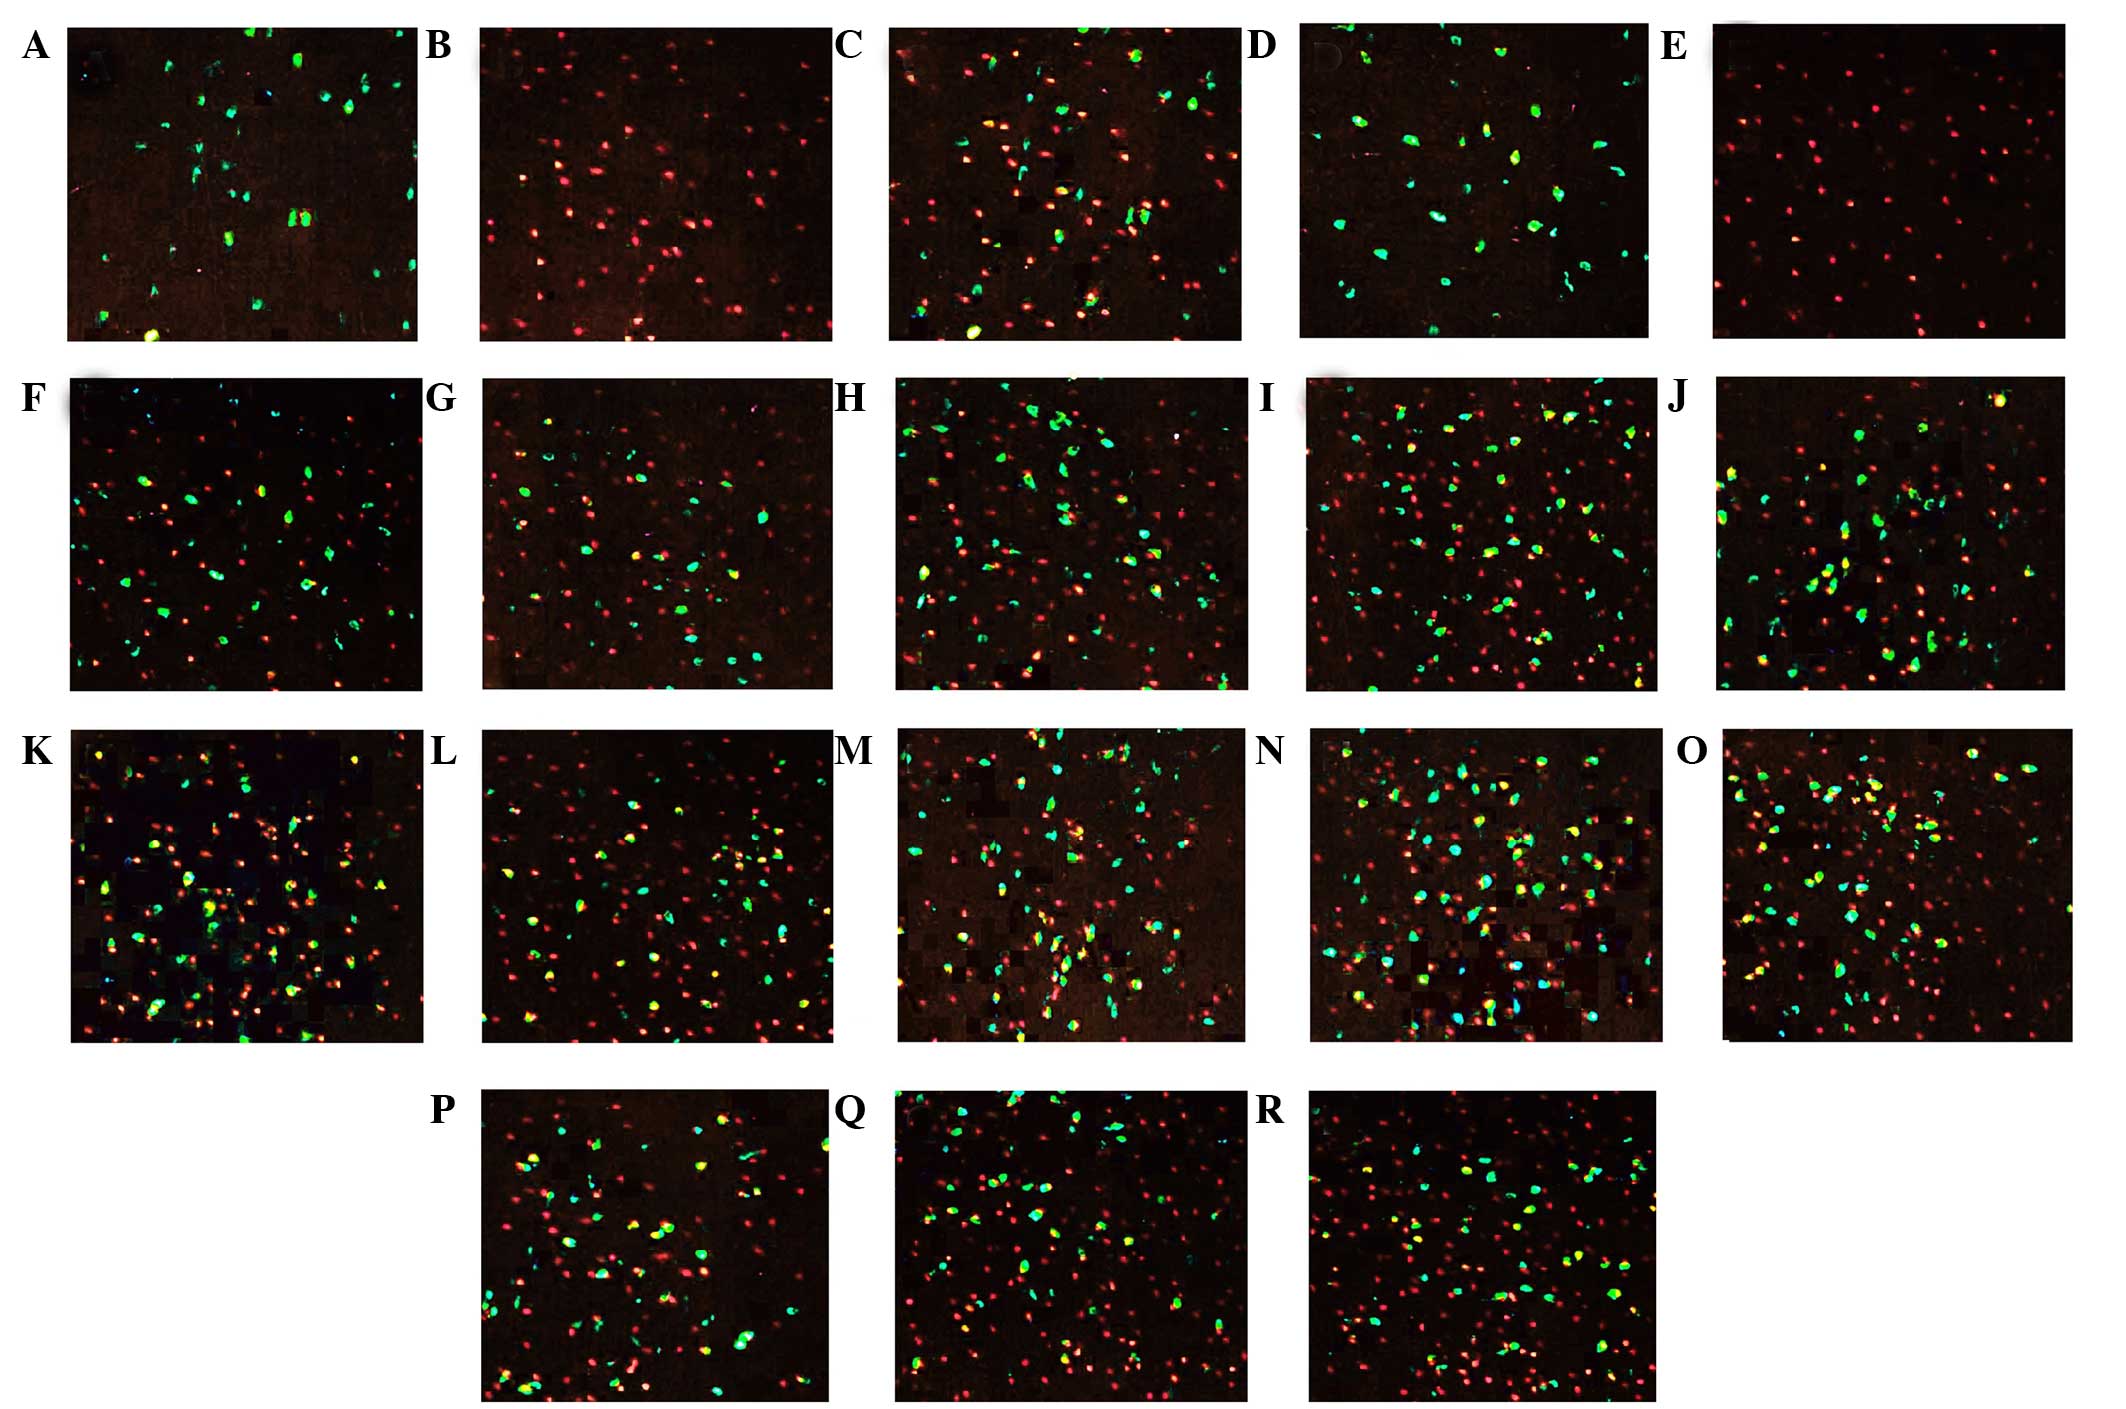 | Figure 3.Immunofluorescent staining for lateral
Hcrt neurons and Fos in the hypothalamus of rats. Green
fluorescence represents fluorescein-stained Hcrt neurons, whereas
red fluorescence represents cyanine3-stained Fos (magnification,
×20). (A) Hcrt neurons, (B) Fos and (C) Hcrt neurons and Fos double
staining at SD 5 day in the CC group; (D) Hcrt neurons, (E) Fos and
(F) Hcrt neurons and Fos double staining at SD 5 day in the TC
group. Hcrt neurons and Fos double staining at (G) SD 1 day, (H) SD
3 day and (I) SD 5 day in the nonOP group. Hcrt neurons and Fos
double staining at (J) SD 1 day, (K) SD 2 day and (L) SD 5 day in
the Sham group. Hcrt neurons and Fos double staining at (M) SD 5
day, (N) RS 6 h and (O) RS 12 h in the gabazine group. (P) Hcrt
neurons and Fos double staining at SD 1 day, (Q) SD 3 day and (R)
SD 5 day in the tiagabine group. Hcrt, hypocretin; SD, sleep
deprived; RS, sleep recovery; CC, blank control; TC, environmental
control; nonOP, non-operative control; Sham, sham operation
control. |
| Table III.Number of Fos-positive, Hcrt-positive
and Fos-Hcrt double positive cells
(F+&H+) in the lateral region of the
hypothalamus of rats during rapid eye movement sleep deprivation
and recovery (n=6 rats/group). |
Table III.
Number of Fos-positive, Hcrt-positive
and Fos-Hcrt double positive cells
(F+&H+) in the lateral region of the
hypothalamus of rats during rapid eye movement sleep deprivation
and recovery (n=6 rats/group).
|
| CC | TC | nonOP |
|---|
|
|
|
|
|
|---|
| Time |
Fos+ |
Hcrt+ |
F+&H+ |
Fos+ |
Hcrt+ |
F+&H+ |
Fos+ |
Hcrt+ |
F+&H+ |
|---|
| SD 1 day |
76.4±5.9 |
65.5±6.1 |
11.5±1.5 |
75.5±5.9 |
63.5±4.7 |
9.3±1.5 |
80.4±5.1 |
62.5±5.2 |
15.5±5.0a |
| SD 3 day |
73.2±3.1 |
64.2±4.9 |
12.2±1.6 |
72.3±6.8 |
61.4±4.2 |
8.4±1.3 |
87.6±8.3a |
63.4±5.9 |
21.2±7.4a |
| SD 5 day |
74.5±4.8 |
61.9±5.2 |
11.4±1.9 |
73.6±4.5 |
62.1±3.9 |
9.0±1.9 |
95.7±10.4a |
61.8±5.1 |
26.3±5.9a |
| RS 6 h |
77.4±5.6 |
63.1±4.8 |
11.2±1.7 |
76.3±5.2 |
64.5±4.8 |
10.1±2.1 |
78.5±6.3 |
64.4±4.9 |
11.8±1.8 |
| RS 12 h |
72.1±6.4 |
62.0±3.9 |
10.8±1.3 |
74.4±5.1 |
65.4±5.2 |
11.6±1.8 |
72.8±8.8 |
63.1±5.3 |
10.3±2.1 |
|
|
|
| ShamOP | Gabazine | Tiagabine |
|
|
|
|
|
| Time |
Fos+ |
Hcrt+ |
F+&H+ |
Fos+ |
Hcrt+ |
F+&H+ |
Fos+ |
Hcrt+ |
F+&H+ |
|
| SD 1 day |
83.1±5.2 |
61.5±5.1 |
16.3±4.4a |
73.1±4.5 |
64.5±6.3 |
10.9±1.5 |
96.9±7.9a |
65.9±6.1 |
30.9±6.1a |
| SD 3 day |
90.2±8.3a |
60.6±3.3 |
20.1±6.5a |
76.4±5.3 |
65.5±6.8 |
12.1±1.8 |
106.2±12.2a |
67.8±6.9 |
39.7±13.3a |
| SD 5 day |
99.1±8.9a |
62.1±4.8 |
29.0±7.0a |
88.5±5.0 |
60.8±5.7 |
16.5±2.9a |
118.2±14.8a |
72.6±5.3 |
47.5±14.6a |
| RS 6 h |
75.2±4.3 |
64.0±5.9 |
12.8±5.2 |
100.9±7.6a |
59.6±6.2 |
25.7±11.6a |
88.3±10.1 |
61.3±6.1 |
12.3±3.2 |
| RS 12 h |
74.0±3.9 |
61.5±3.8 |
10.9±2.6 |
113.1±9.9a |
62.7±5.9 |
33.6±5.9a |
81.9±6.9 |
63.9±8.3 |
11.7±3.0 |
GABA and Glu content in the
hypothalamus of rats
No significant differences in GABA and Glu content
was detected in the hypothalamus of rats in the TC and CC groups at
various time points. Furthermore, no significant differences in Glu
content were detected between the various time points in all
groups. GABA content was significantly increased in the nonOP, Sham
and gabazine groups at SD 1 day, SD 3 day, SD 5 day and RS 6 h, as
compared with the CC and TC groups (P<0.05). GABA content in the
gabazine group at RS 12 h was significantly increased, as compared
with the CC and TC groups (P<0.05). No significant differences
in GABA were detected in the remaining five groups, as compared
with the CC and TC groups. Minor alterations in GABA content were
detected in the tiagabine group prior to REM sleep deprivation and
following sleep recovery. No significant differences in GABA
content was detected at the five time points in the tiagabine
group, as compared with the same time point in the CC and TC groups
(Table IV; Fig. 4A).
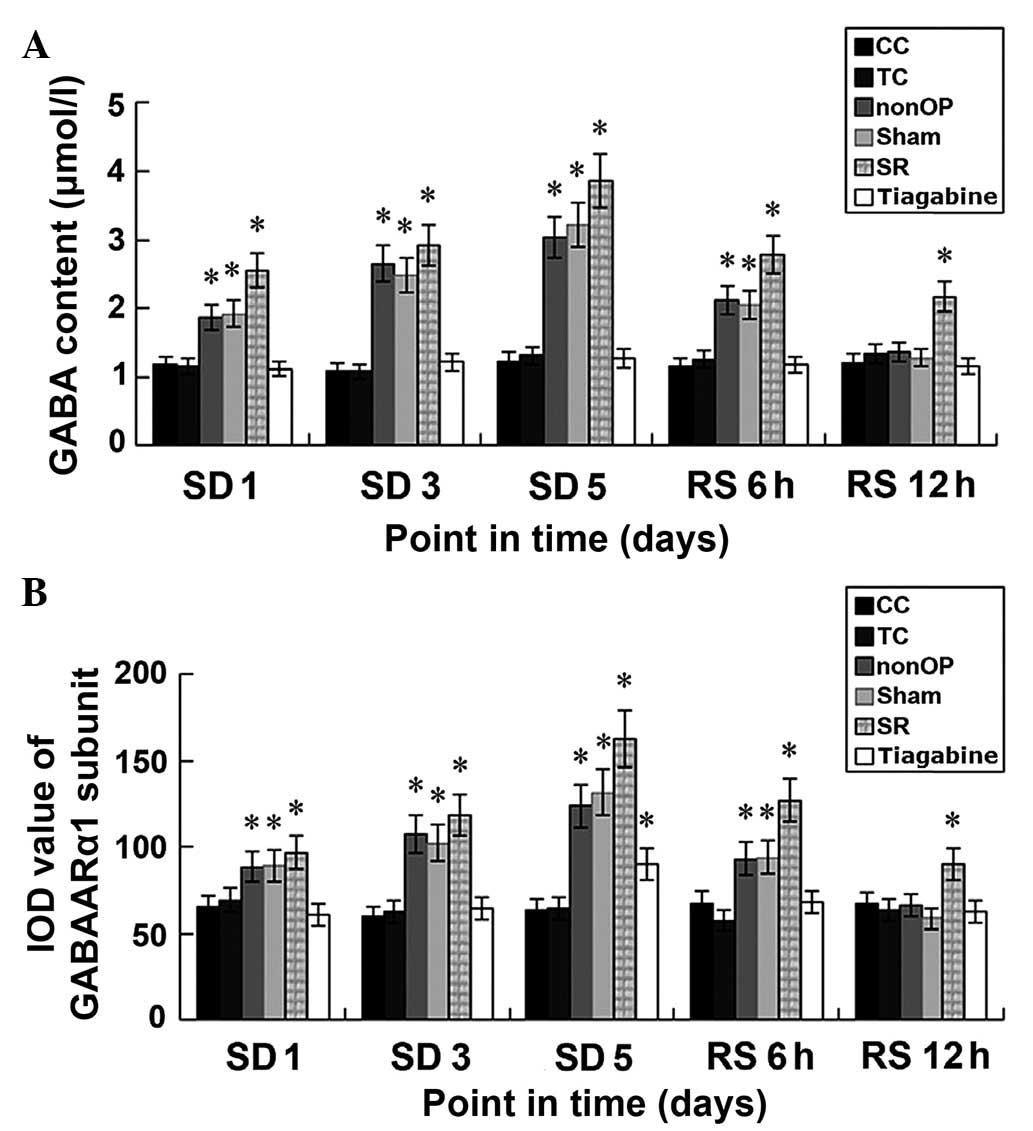 | Figure 4.(A) GABA content in the hypothalamus
of REM sleep-deprived rats among and within groups. (B) IOD of the
GABAARα1σ subunits of the hypothalamus of the REM
sleep-deprived rats. *P<0.05, vs. the CC and TC groups at the
same time point. GABA, γ-aminobutyric acid; REM, rapid eye
movement; IOD, integrated optical density; CC, blank control; TC,
environmental control; nonOP, non-operative control; Sham, sham
operation control; SD, sleep deprived; RS, sleep recovery; SR,
SR-95531. |
| Table IV.GABA and Glu content (µmol/l) in the
hypothalamus of REM sleep-deprived rats in the various groups (n=6
rats/group). |
Table IV.
GABA and Glu content (µmol/l) in the
hypothalamus of REM sleep-deprived rats in the various groups (n=6
rats/group).
|
| CC | TC | nonOP | ShamOP | Gabazine | Tiagabine |
|---|
|
|
|
|
|
|
|
|
|---|
| Time | Glu | GABA | Glu | GABA | Glu | GABA | Glu | GABA | Glu | GABA | Glu | GABA |
|---|
| SD 1 day |
4.45±0.66 |
1.07±0.19 |
4.62±0.54 |
1.05±0.19 |
4.17±0.36 |
1.78±0.38a |
4.40±0.33 |
1.81±0.39a |
4.62±0.58 |
2.43±0.50a |
4.52±0.49 |
1.01±0.21 |
| SD 3 day |
4.12±0.47 |
0.98±0.15 |
4.34±0.33 |
0.96±0.11 |
4.36±0.29 |
2.54±0.79a |
4.24±0.29 |
2.39±0.56a |
4.36±0.40 |
2.80±0.69a |
4.31±0.29 |
1.13±0.29 |
| SD 5 day |
4.54±0.63 |
1.14±0.30 |
4.41±0.49 |
1.20±0.27 |
4.40±0.32 |
2.93±0.85a |
4.35±0.30 |
3.12±0.80a |
4.55±0.41 |
3.71±1.11a |
4.47±0.41 |
1.15±0.39 |
| RS 6 h |
4.75±0.68 |
1.03±0.21 |
4.59±0.40 |
1.16±0.25 |
4.59±0.48 |
2.01±0.52a |
4.63±0.48 |
1.97±0.50a |
4.49±0.33 |
2.65±0.78a |
4.63±0.25 |
1.07±0.25 |
| RS 12 h |
4.30±0.53 |
1.11±0.20 |
4.50±0.43 |
1.22±0.29 |
4.43±0.39 |
1.29±0.29 |
4.56±0.39 |
1.19±0.21 |
4.11±0.45 |
2.04±0.72a |
4.35±0.38 |
1.08±0.18 |
Immunofluorescence detection of
GABAARα1 σ-subunit expression in the hypothalamus of
rats
Fluorescence microscopy demonstrated that the
Cy3-stained GABAARα1 σ-subunits were densely distributed in the
whole hypothalamus region and cavities of various sizes were formed
at few sites. The immunofluorescence of the tissue sections at SD 1
day, SD 3 day, SD 5 day and RS 6 h in the nonOP, Sham and gabazine
groups was significantly increased, as compared with the remaining
time points in the remaining groups. Immunofluorescence peaked at
SD 5 day in the gabazine group. For the assessment of the GABAARα1
σ-subunit immunofluorescence IOD, only the result at SD 5 day in
the tiagabine group was higher compared with the CC and TC groups
(P>0.05). No significant differences in the IOD values of the
GABAARα1 positive regions within the hypothalamus were detected
between the TC and CC groups at various time points. IOD values of
the GABAARα1-positive regions were significantly increased in
nonOP, Sham and gabazine groups at SD 1 day, SD 3 day, SD 5 day and
RS 6 h, as compared with the CC and TC groups (P<0.05). At SD 5
day, the IOD value of the GABAARα1 positive regions in the
tiagabine group was significantly higher, as compared with the CC
and TC groups (P<0.05). The IOD value of the GABAARα1 positive
regions at RS 12 h in the gabazine group was still significantly
increased, as compared with the CC and TC groups at only SD 5 day
(P<0.05). No statistical differences in IOD values were detected
between the remaining five groups and the CC and TC groups at the
RS 12 h (Table V; Figs. 4B and 5).
 | Figure 5.Cyanine3 immunofluorescent staining
for GABAARα1σ subunits of the hypothalamus of the REM
sleep-deprived rats (magnification, ×20). SD 5 day in the (A) CC
and (B) TC groups. (C) SD 1 day, (D) SD 3 day, (E) SD 5 day and (F)
RS 6 h in the nonOP group. (G) SD 1 day, (H) SD 3 day, (I) SD 5 day
and (J) RS 6 h in the Sham group. (K) SD 1 day, (L) SD 3 day, (M)
SD 5 day, (N) RS 6 h and (O) RS 12 h in the gabazine group. (P) SD
3 day, (Q) SD 5 day and (R) RS 6 h in the NO-711 group. GABA,
γ-aminobutyric acid; REM, rapid eye movement; Hcrt, hypocretin; SD,
sleep deprived; RS, sleep recovery; CC, blank control; TC,
environmental control; nonOP, non-operative control; Sham, sham
operation control. |
| Table V.Immunofluorescence integrated optical
densities of GABAARα1 sigma subunits in the hypothalamus
of rapid eye movement sleep-deprived rats among and within
groups. |
Table V.
Immunofluorescence integrated optical
densities of GABAARα1 sigma subunits in the hypothalamus
of rapid eye movement sleep-deprived rats among and within
groups.
| Time | CC | TC | nonOP | Sham | Gabazine | Tiagabine |
|---|
| SD 1 day |
63.69±18.16 |
66.22±19.30 |
86.31±21.57a |
90.32±19.87a |
98.65±29.54a |
58.66±20.89 |
| SD 3 day |
56.59±16.38 |
60.58±20.22 |
105.49±43.29a |
100.26±32.16a |
120.55±39.98a |
62.54±25.24 |
| SD 5 day |
61.83±18.23 |
62.61±14.29 |
119.68±33.58a |
129.51±42.35a |
170.46±51.39a |
88.38±26.33a |
| RS 6 h |
65.63±19.21 |
55.29±18.38 |
90.19±39.82a |
92.11±33.48a |
131.44±44.24a |
66.21±24.61 |
| RS 12 h |
64.16±17.12 |
61.52±19.11 |
64.21±20.19 |
56.85±20.17 |
92.58±34.98a |
60.28±19.29 |
Discussion
To date, various behavioristic methods have been
used to investigate learning and memory. The Morris water maze is a
universally-accepted objective method for evaluating behavior
(25). Rodents are more similar to
humans than other animals in sleep physiology (26); therefore rodents are the most
suitable for medical research and male rats were selected as the
subjects in the present study. Previous studies have determined
that rats may succumb to REM sleep deprivation after 6–7 days
(27,28). Therefore, in order to avoid data loss
due to mortality, the maximum duration of REM sleep deprivation was
5 days in the present study. As it is difficult to distinguish the
alterations in CF and other indices, including c-Fos expression,
GABA and Glu content, induced by REM sleep deprivation over a short
period of time (29,30), five points in time (SD 1 day, SD 3
day, SD 5 day, RS 6 h, and RS 12 h) were selected for
observation.
Comparing the alterations in CF among and within
groups demonstrated that the overall variation CF trend in the
tiagabine group was consistent with the nonOP and Sham groups,
although the degrees of alteration were different. At SD 1 day in
the tiagabine group, rats exhibited significantly diminished CF, as
compared with the CC and TC groups; whereas no differences were
detected between the nonOP and Sham groups and the latter two
groups. Rats in the tiagabine group exhibited diminished CF at SD 1
day, SD 3 day and SD 5 day, as compared with the nonOP and Sham
groups. Furthermore, the CF of rats at RS 6 h in the tiagabine
group exhibited improved recovery, as compared with the nonOP and
Sham groups; however, there was no significant difference at RS 12
h among these three groups. These results indicated that the GABA
re-uptake inhibitor exacerbated the decline of CF in the rats
during REM sleep deprivation, whereas it accelerates the
improvement of CF following sleep recovery. This is consistent with
previous studies which have demonstrated that GABA pharmacological
agents can be used to effectively intervene with the alterations in
CF during REM sleep deprivation and recovery in rats (31,32).
The number of F+&H+cells
in the lateral region of the hypothalamus of the rats in the nonOP
group following REM sleep deprivation at SD 1 day, SD 3 day and SD
5 day was significantly increased, as compared with the CC and TC
groups. The total number of Fos-positive cells at SD 3 day and SD 5
day was significantly increased, as compared with the CC group and
TC group. Single-factor multi-level variance analysis at the
various time points in each group indicated that the increase in
the number of F+&H+ cells was positively
correlated with the duration of REM sleep deprivation. No
significant differences were detected in the number of Fos-positive
and F+&H+ cells at RS 6 h and RS 12
h.
Tiagabine and gabazine have diametrically opposite
effects on the number of Fos-positive and
F+&H+ cells (33). Therefore, this suggests that the GABA
nerve system may also participate in the regulation of increased
Hcrt nerve system activity arising from REM sleep deprivation.
In the present study, GABA content and
GABAARα1 expression in the hypothalamus significantly
increased among normal rats following REM sleep deprivation in the
nonOP group. The degree of this increase was positively correlated
with the duration of REM sleep deprivation and, although it
returned back to normal following sleep recovery, remained higher
than the CC and TC groups. No differences between the CC and TC
groups were detected at RS 12 h. This increase in GABA content and
GABAARα1 expression indicated that the GABA nerve system
strengthens. Therefore suggesting that REM sleep deprivation is
capable of strengthening the role of the GABA nerve system in the
hypothalamus.
In the present study, the degree of increase was
positively correlated with the duration of REM sleep deprivation.
However, it was demonstrated that this alteration returns to normal
at RS 12 h. During REM sleep deprivation and recovery, the GABA
nerve system has its own regulation mechanism, which is a
protective physiological process (34). The role of the GABA nerve system is
positively correlated with the damage to the CF; therefore a
stronger role of the GABA nerve system will induce more severe
damage to CF (35). Furthermore, the
activity of the Hcrt nerve system is positively correlated with the
GABA nerve system, as one regulates the other (36).
In conclusion, in terms of the decline of CF in rats
induced by REM sleep deprivation, the GABA nerve system is not an
ideal therapeutic target for the treatment of insomnia, whereas the
Hcrt nerve system may hold greater potential as a therapeutic
target.
Acknowledgements
The present study was funded by the following
projects: The Nature Science Foundation of Inner Mongolia
Autonomous Region (grant no. 2013MS1224); the National Natural
Science Foundation of China (grant nos. 81260571, 81560801 and
81550047); the Public Health Project of the State Administration of
Traditional Chinese Medicine (grant no. gjzyyglj11aglnzd); the
Inner Mongolia Autonomous Region Mongolian Medicine Cooperative
Innovation Project; and the Inner Mongolia Autonomous Region
“Prairie excellence” Project.
References
|
1
|
Kanda T, Tsujino N, Kuramoto E, Koyama Y,
Susaki EA, Chikahisa S and Funato H: Sleep as a biological problem:
An overview of frontiers in sleep research. J Physiol Sci. 66:1–13.
2016. View Article : Google Scholar : PubMed/NCBI
|
|
2
|
Khadra MA, McConnell K, VanDyke R, Somers
V, Fenchel M, Quadri S, Jefferies J, Cohen AP, Rutter M and Amin R:
Determinants of regional cerebral oxygenation in children with
sleep-disordered breathing. Am J Respir Crit Care Med. 178:870–875.
2008. View Article : Google Scholar : PubMed/NCBI
|
|
3
|
McDevitt EA, Rowe KM, Brady M, Duggan KA
and Mednick SC: The benefit of offline sleep and wake for novel
object recognition. Exp Brain Res. 232:1487–1496. 2014. View Article : Google Scholar : PubMed/NCBI
|
|
4
|
Spoormaker VI, Gvozdanovic GA, Sämann PG
and Czisch M: Ventromedial prefrontal cortex activity and rapid eye
movement sleep are associated with subsequent fear expression in
human subjects. Exp Brain Res. 232:1547–1554. 2014. View Article : Google Scholar : PubMed/NCBI
|
|
5
|
Schmitt K, Holsboer-Trachsler E and Eckert
A: BDNF in sleep, insomnia, and sleep deprivation. Ann Med.
48:42–51. 2016. View Article : Google Scholar : PubMed/NCBI
|
|
6
|
McCarley RW: Neurobiology of REM and NREM
sleep. Sleep Med. 8:302–330. 2007. View Article : Google Scholar : PubMed/NCBI
|
|
7
|
Reilly T and Piercy M: The effect of
partial sleep deprivation on weight-lifting performance.
Ergonomics. 37:107–115. 1994. View Article : Google Scholar : PubMed/NCBI
|
|
8
|
Vazquez-DeRose J, Schwartz MD, Nguyen AT,
Warrier DR, Gulati S, Mathew TK, Neylan TC and Kilduff TS:
Hypocretin/orexin antagonism enhances sleep-related adenosine and
GABA neurotransmission in rat basal forebrain. Brain Struct Funct.
221:923–940. 2016. View Article : Google Scholar : PubMed/NCBI
|
|
9
|
Sack RL, Auckley D, Auger RR, Carskadon
MA, Wright KP, Vitiello MV and Zhdanova IV: Circadian rhythm sleep
disorders: Part I, basic principles, shift work and jet lag
disorders. An American Academy of Sleep Medicine review. Sleep.
30:1460–1483. 2007.PubMed/NCBI
|
|
10
|
Mileykovskiy BY, Kiyashchenko LI and
Siegel JM: Behavioral correlates of activity in identified
Hypocretin/orexin neurons. Neuron. 46:787–798. 2005. View Article : Google Scholar : PubMed/NCBI
|
|
11
|
Sakurai T, Nagata R, Yamanaka A, Kawamura
H, Tsujino N, Muraki Y, Kageyama H, Kunita S, Takahashi S, Goto K,
et al: Input of orexin/Hypoeretin neurons revealed by a genetically
encoded tracer in mice. Neuron. 46:297–308. 2005. View Article : Google Scholar : PubMed/NCBI
|
|
12
|
Yoshida K, McCormack S, España RA, Crocker
A and Scammell TE: Afferents to the orexin neurons of the rat
brain. J Comp Neurol. 494:845–861. 2006. View Article : Google Scholar : PubMed/NCBI
|
|
13
|
Black SW, Morairty SR, Fisher SP, Chen TM,
Warrier DR and Kilduff TS: Almorexant promotes sleep and
exacerbates cataplexy in a murine model of narcolepsy. Sleep.
36:325–336. 2013.PubMed/NCBI
|
|
14
|
Yang L, Zou B, Xiong X, Pascual C, Xie J,
Malik A, Xie J, Sakurai T and Xie XS: Hypocretin/orexin neurons
contribute to hippocampus-dependent social memory and synaptic
plasticity in mice. J Neurosci. 33:5275–5284. 2013. View Article : Google Scholar : PubMed/NCBI
|
|
15
|
Kwon Jeong J, Dae Kim J and Diano S:
Ghrelin regulates hypothalamic prolyl carboxypeptidase expression
in mice. Mol Metab. 2:23–30. 2013. View Article : Google Scholar : PubMed/NCBI
|
|
16
|
Pan G, Li Y, Geng HY, Yang JM, Li KX and
Li XM: Preserving GABAergic interneurons in acute brain slices of
mice using the N-methyl-D-glucamine-based artificial cerebrospinal
fluid method. Neurosci Bull. 31:265–270. 2015. View Article : Google Scholar : PubMed/NCBI
|
|
17
|
Figini M, Zucca I, Aquino D, Pennacchio P,
Nava S, Di Marzio A, Preti MG, Baselli G, Spreafico R and Frassoni
C: In vivo DTI tractography of the rat brain: An atlas of the main
tracts in Paxinos space with histological comparison. Magn Reson
Imaging. 33:296–303. 2015. View Article : Google Scholar : PubMed/NCBI
|
|
18
|
Cohen HB and Dement WC: Sleep: Changes in
threshold to electrocon-vulsive shock in rats after deprivation of
‘paradoxical’ phase. Science. 150:1318–1319. 1965. View Article : Google Scholar : PubMed/NCBI
|
|
19
|
Jiang J, Liu F, Fang W and Liu Y: Effect
of artificial cerebrospinal fluid lavage time on the edema of
traumatic brain injury. Zhong Nan Da Xue Xue Bao Yi Xue Ban.
38:510–516. 2013.(In Chinese). PubMed/NCBI
|
|
20
|
Ting CH, Huang HN, Huang TC, Wu CJ and
Chen JY: The mechanisms by which pardaxin, a natural cationic
antimicrobial peptide, targets the endoplasmic reticulum and
induces c-FOS. Biomaterials. 35:3627–3640. 2014. View Article : Google Scholar : PubMed/NCBI
|
|
21
|
Shehab S, D'souza C, Ljubisavljevic M and
Redgrave P: High-frequency electrical stimulation of the
subthalamic nucleus excites target structures in a model using
c-fos immunohistochemistry. Neuroscience. 270:212–225. 2014.
View Article : Google Scholar : PubMed/NCBI
|
|
22
|
Deng Y, Wang W, Yu P, Xi Z, Xu L, Li X and
He N: Comparison of taurine, GABA, Glu, and Asp as scavengers of
malondialdehyde in vitro and in vivo. Nanoscale Res Lett.
8:1902013. View Article : Google Scholar : PubMed/NCBI
|
|
23
|
Fievisohn EM, Sajja VS, Vandevord PJ and
Hardy WN: Evaluation of impact-induced traumatic brain injury in
the Göttingen minipig using two input modes. Traffic Inj Prev.
15(Suppl 1): S81–S87. 2014. View Article : Google Scholar : PubMed/NCBI
|
|
24
|
Ganji SK, An Z, Banerjee A, Madan A,
Hulsey KM and Choi C: Measurement of regional variation of GABA in
the human brain by optimized point-resolved spectroscopy at 7 T in
vivo. NMR Biomed. 27:1167–1175. 2014. View
Article : Google Scholar : PubMed/NCBI
|
|
25
|
Liu C, Liu X and Liu S: Bifurcation
analysis of a Morris-Lecar neuron model. Biol Cybern. 108:75–84.
2014. View Article : Google Scholar : PubMed/NCBI
|
|
26
|
Perentos N, Martins AQ, Watson TC, Bartsch
U, Mitchell NL, Palmer DN, Jones MW and Morton AJ: Translational
neurophysiology in sheep: Measuring sleep and neurological
dysfunction in CLN5 Batten disease affected sheep. Brain.
138:862–874. 2015. View Article : Google Scholar : PubMed/NCBI
|
|
27
|
Corsi-Cabrera M, Sifuentes-Ortega R,
Rosales-Lagarde A, Rojas-Ramos OA and Del Río-Portilla Y: Enhanced
synchronization of gamma activity between frontal lobes during REM
sleep as a function of REM sleep deprivation in man. Exp Brain Res.
232:1497–1508. 2014. View Article : Google Scholar : PubMed/NCBI
|
|
28
|
Sansa G, Falup-Pecurariu C, Salamero M,
Iranzo A and Santamaria J: Non-random temporal distribution of
sleep onset REM periods in the MSLT in narcolepsy. J Neurol Sci.
341:136–138. 2014. View Article : Google Scholar : PubMed/NCBI
|
|
29
|
Descamps A, Rousset C, Dugua H, Debilly G,
Delagrange P and Cespuglio R: Agomelatine restores a physiological
response to stress in the aged rat. Neurosci Lett. 566:257–262.
2014. View Article : Google Scholar : PubMed/NCBI
|
|
30
|
Kutbay Özçelik H, Akkoyunlu ME, Bostanlı
P, Bayram M, Atahan E, Sezer M, Karaköse F and Kart L: The
frequency and properties of REM related obstructive sleep apnea
among the patients with mild related obstructive sleep apnea.
Tuberk Toraks. 61:283–287. 2013.(In Turkish). View Article : Google Scholar : PubMed/NCBI
|
|
31
|
Oruna-Concha MJ, Methven L, Blumenthal H,
Young C and Mottram DS: Differences in glutamic acid and
5′-ribonucleotide contents between flesh and pulp of tomatoes and
the relationship with umami taste. J Agric Food Chem. 55:5776–5780.
2007. View Article : Google Scholar : PubMed/NCBI
|
|
32
|
Lee S, Yoon BE, Berglund K, Oh SJ, Park H,
Shin HS, Augustine GJ and Lee CJ: Channel-mediated tonic GABA
release from glia. Science. 330:790–796. 2010. View Article : Google Scholar : PubMed/NCBI
|
|
33
|
Llado-Pelfort L, Santana N, Ghisi V,
Artigas F and Celada P: 5-HT1A receptor agonists enhance pyramidal
cell firing in prefrontal cortex through a preferential action on
GABA interneurons. Cereb Cortex. 22:1487–1497. 2012. View Article : Google Scholar : PubMed/NCBI
|
|
34
|
Iyer SR: Sleep and type 2 diabetes
mellitus- clinical implications. J Assoc Physicians India.
60:42–47. 2012.PubMed/NCBI
|
|
35
|
Wei H, Koivisto A, Saarnilehto M, Chapman
H, Kuokkanen K, Hao B, Huang JL, Wang YX and Pertovaara A: Spinal
transient receptor potential ankyrin 1 channel contributes to
central pain hypersensitivity in various pathophysiological
conditions in the rat. Pain. 152:582–591. 2011. View Article : Google Scholar : PubMed/NCBI
|
|
36
|
Ciriello J, Caverson MM and Li Z: Effects
of hypocretin and norepinephrine interaction in bed nucleus of the
stria terminalis on arterial pressure. Neuroscience. 255:278–291.
2013. View Article : Google Scholar : PubMed/NCBI
|