Introduction
Low-dose codeine phosphate is a widely used sedative
for the management of cough and pain (1). However, to the best of our knowledge,
there is a limited number of previous studies directly
demonstrating the effects of codeine phosphate on brain metabolism
and function in humans (2,3). In addition, the exact mechanisms of
action of codeine phosphate on the brain remain unclear. Therefore,
a number of side effects occurring following codeine phosphate
administration, such as drug dependency and withdrawal, are not
well understood (4,5).
Magnetic resonance spectroscopy (MRS) and
resting-state functional magnetic resonance imaging (fMRI) can be
used to investigate the effects of codeine phosphate in the brain
(6). MRS enables a noninvasive
assessment of the brain and other organs to identify chemical
changes in a given region of interest (7). Furthermore, an accurate quantitative
analysis of brain metabolites is possible using Linear Combination
of Model (LCModel) software (http://www.s-provencher.com/pages/lcmodel.shtml)
(8). MRS combined with LCModel has
been widely used for the assessment of brain tumors, mental
disorders and drug analysis (9–11).
Resting-state fMRI is an intricate method that is
able to identify the function of different brain regions in a given
status or without external stimulation (12). In addition, resting-state fMRI can be
performed without the requirement of an overt task or external
input; therefore, the results are reliable and the external factor
effects are reduced (13,14). Compared with traditional fMRI,
resting-state fMRI can be analyzed with regard to the amplitude of
low-frequency fluctuation (ALFF), regional homogeneity (ReHo) and
functional connectivity (15).
Furthermore, previous studies have used resting-state fMRI to
identify the impact of drugs, primarily strong and illicit opioid
drugs, on the brain (16,17).
To the best of our knowledge, fMRI studies of
codeine phosphate, which is a weak opioid drug, have not been
previously reported. Functional and metabolic alterations in the
frontal lobe are the primary causes of strong and illicit opioid
drug side effects (18,19). Furthermore, the functions of the
human brain hemispheres are different. Advanced functions,
including speaking, reading, writing, calculating, recognizing
amongst others are administrated by one side of the brain
hemisphere. This side of brain hemisphere is called the advantage
hemisphere. Handedness is an external symbol to judge on which side
is the advantage hemisphere of brain.
The present study aims to investigate the metabolite
and functional data affected by the normal doses of codeine
phosphate that are obtained from the experiments conducted. This
data will provide accurate and reasonable background information
for future studies on codeine addiction. Furthermore, it is
significant to study the effect on the frontal lobe because it is
the part of the brain that is responsible for thinking, drug
craving and for our emotions. Previous opioid dependence studies
reveal that a change in emotions and a thirst for drugs were
associated with a change in the function of the frontal lobe
(20). In the present study, MRS and
resting-state fMRI were used to detect the functional and metabolic
alterations in the frontal lobe of healthy volunteers following the
administration of a single, low-dose of codeine phosphate.
Materials and methods
Participants
A total of 20 right-handed subjects (10 males and 10
females) were included in the present study. The subjects were
healthy and were recruited as volunteers by our research laboratory
between June 2013 and June 2014. All subjects met the following
inclusion criteria: i) Right-handed subjects with a mean age of
22±2 years; ii) absence of neurological illness, which was assessed
by a neurologist and confirmed by conventional brain MRI; iii) no
history of psychiatric illness (Mini-Mental State Examination and
Montreal Cognitive Assessment test scores, which were assessed by a
psychiatrist, must be ≥27; 21); and iv) no history of drug or
alcohol dependence, and no drug or alcohol intake within the
previous 2 months. The MRI is recorded by GE Signa HDx 1.5T MR
scanner (GE Healthcare Life Sciences, Little Chalfont, UK).
Individuals with neurological, psychiatric or
organic diseases were excluded. Additional exclusion criteria were
as follows: i) A past or current history of central nervous system
damage caused by other diseases; or ii) severe medical illness.
The present study was approved by the Ethics
Committee of the Shantou University Medical College (Shantou,
China). All subjects provided written informed consent prior to
study participation.
Data acquisition
Codeine phosphate (Qinghai Pharmaceutical Group Co.,
Ltd., Xining, China) has been previously reported to require 1 h to
reach the peak plasma drug concentration in the brain (4). Thus, data from healthy participants
were collected before and 1 h after oral administration of codeine
phosphate (1.0 mg/kg). A Signa HDx 1.5T MRI scanner (GE Healthcare
Life Sciences) was used for data acquisition. An echo-planar
imaging (EPI) sequence was used for resting-state fMRI with the
following conditions: Repetition time (TR), 2000 ms; echo time
(TE), 25 ms; flip angle, 90°; number of slices, 39; and field of
view, 192 mm.
Proton (1H) MRS involved the use of a
point resolved spectroscopy sequence (also known as PRESS) with the
following conditions: TE/TR, 35/1500 ms; total scan number, 128;
volume of interest, 2 cm3; full wave at half maximum,
<10; and water suppression, <98%. The voxels were placed in
the symmetrical frontal lobe.
Data processing
The resting-state fMRI data were processed using the
Regional Saturation Technique (REST; (http://restfmri.net/forum/REST_V 1.8) (22), Data Processing Assistant for
Resting-state fMRI (DPARSF) (23)
and Statistical Parameter Mapping 8 (SPM8) (24). The preprocessing steps with the
DPARSF toolkit (DPARSF (http://www.restfmri.net/forum/DPARSF) were performed
as previously described (25), and
included slice timing, realignment and normalization. The first 10
volumes were discarded to ensure stable magnetization and to allow
subjects to adapt to the scanning environment. The slice timing
involved the number of slices (30 slices), slice order (2, 4, 6,
and so on, up to 30 slices) and reference slice (30). Head motion correction was processed
using the realign function, and spatial normalization was performed
using EPI templates. In addition, a band-pass filter (0.01–0.08 Hz)
was applied to remove physiological and high-frequency noise. The
effects of the processing maps were investigated using SPM8
(http://www.fil.ion.ucl.ac.uk/spm/software/spm8/)
(26). The processing maps refer to
the magnetic resonance images following the removal of
physiological and high frequency noise correction.
The values for ALFF and ReHo were calculated using
REST. In the calculation of the ALFF, the data initially underwent
smoothing automatically using the REST software to suppress noise
and effects that resulted from residual differences in functional
and gyral anatomy. The ALFF map was normalized to the global mean
ALFF for each subject.
The ReHo was evaluated using Kendall's coefficient
concordance (KCC), as previously described (27). The ReHo maps were generated by
assigning a value for each voxel that corresponded to the KCC of
its time series with the nearest 26 neighboring voxels. The ReHo
maps were standardized based on the subject's mean KCC. A 4 mm full
width at half maximum Gaussian function was used to smooth the
images to reduce the noise and residual differences.
The MRS data were analyzed using LCModel (28). The processing included Fourier
transformation and noise filtering, and zero-fill and baseline
correction. The metabolite concentrations were then measured. In
brief, the original magnetic resonance spectroscopy data were input
into the LCmodel software. The software contains a basis set in
which there are various metabolite spectral lines of the brain
collected under different parameters in vitro. These
spectral lines contain metabolite concentration and chemical shift
information. According to the internal basis set, the software
automatically matches and compares with the inputted original
spectroscopy line. Finally, the software computes the metabolite
concentrations. The features of the LCmodel software is highly
automatic, without too much human intervention.
Statistical analysis
The MRS data were analyzed using SPSS version 17.0
(SPSS, Inc., Chicago, IL, USA). The metabolite levels were compared
with the normal levels using paired t-tests. The ReHo and ALFF maps
were compared using paired t-tests with the ‘Statistical Analysis’
module in REST. A P-value of <0.05 combined with a cluster size
of >25 voxels was considered to indicate a statistically
significant difference. All within-group statistical maps of ReHo
and ALFF were superimposed on the anatomical template (Ch2.nii) for
presentation purposes (29).
Results
fMRI results
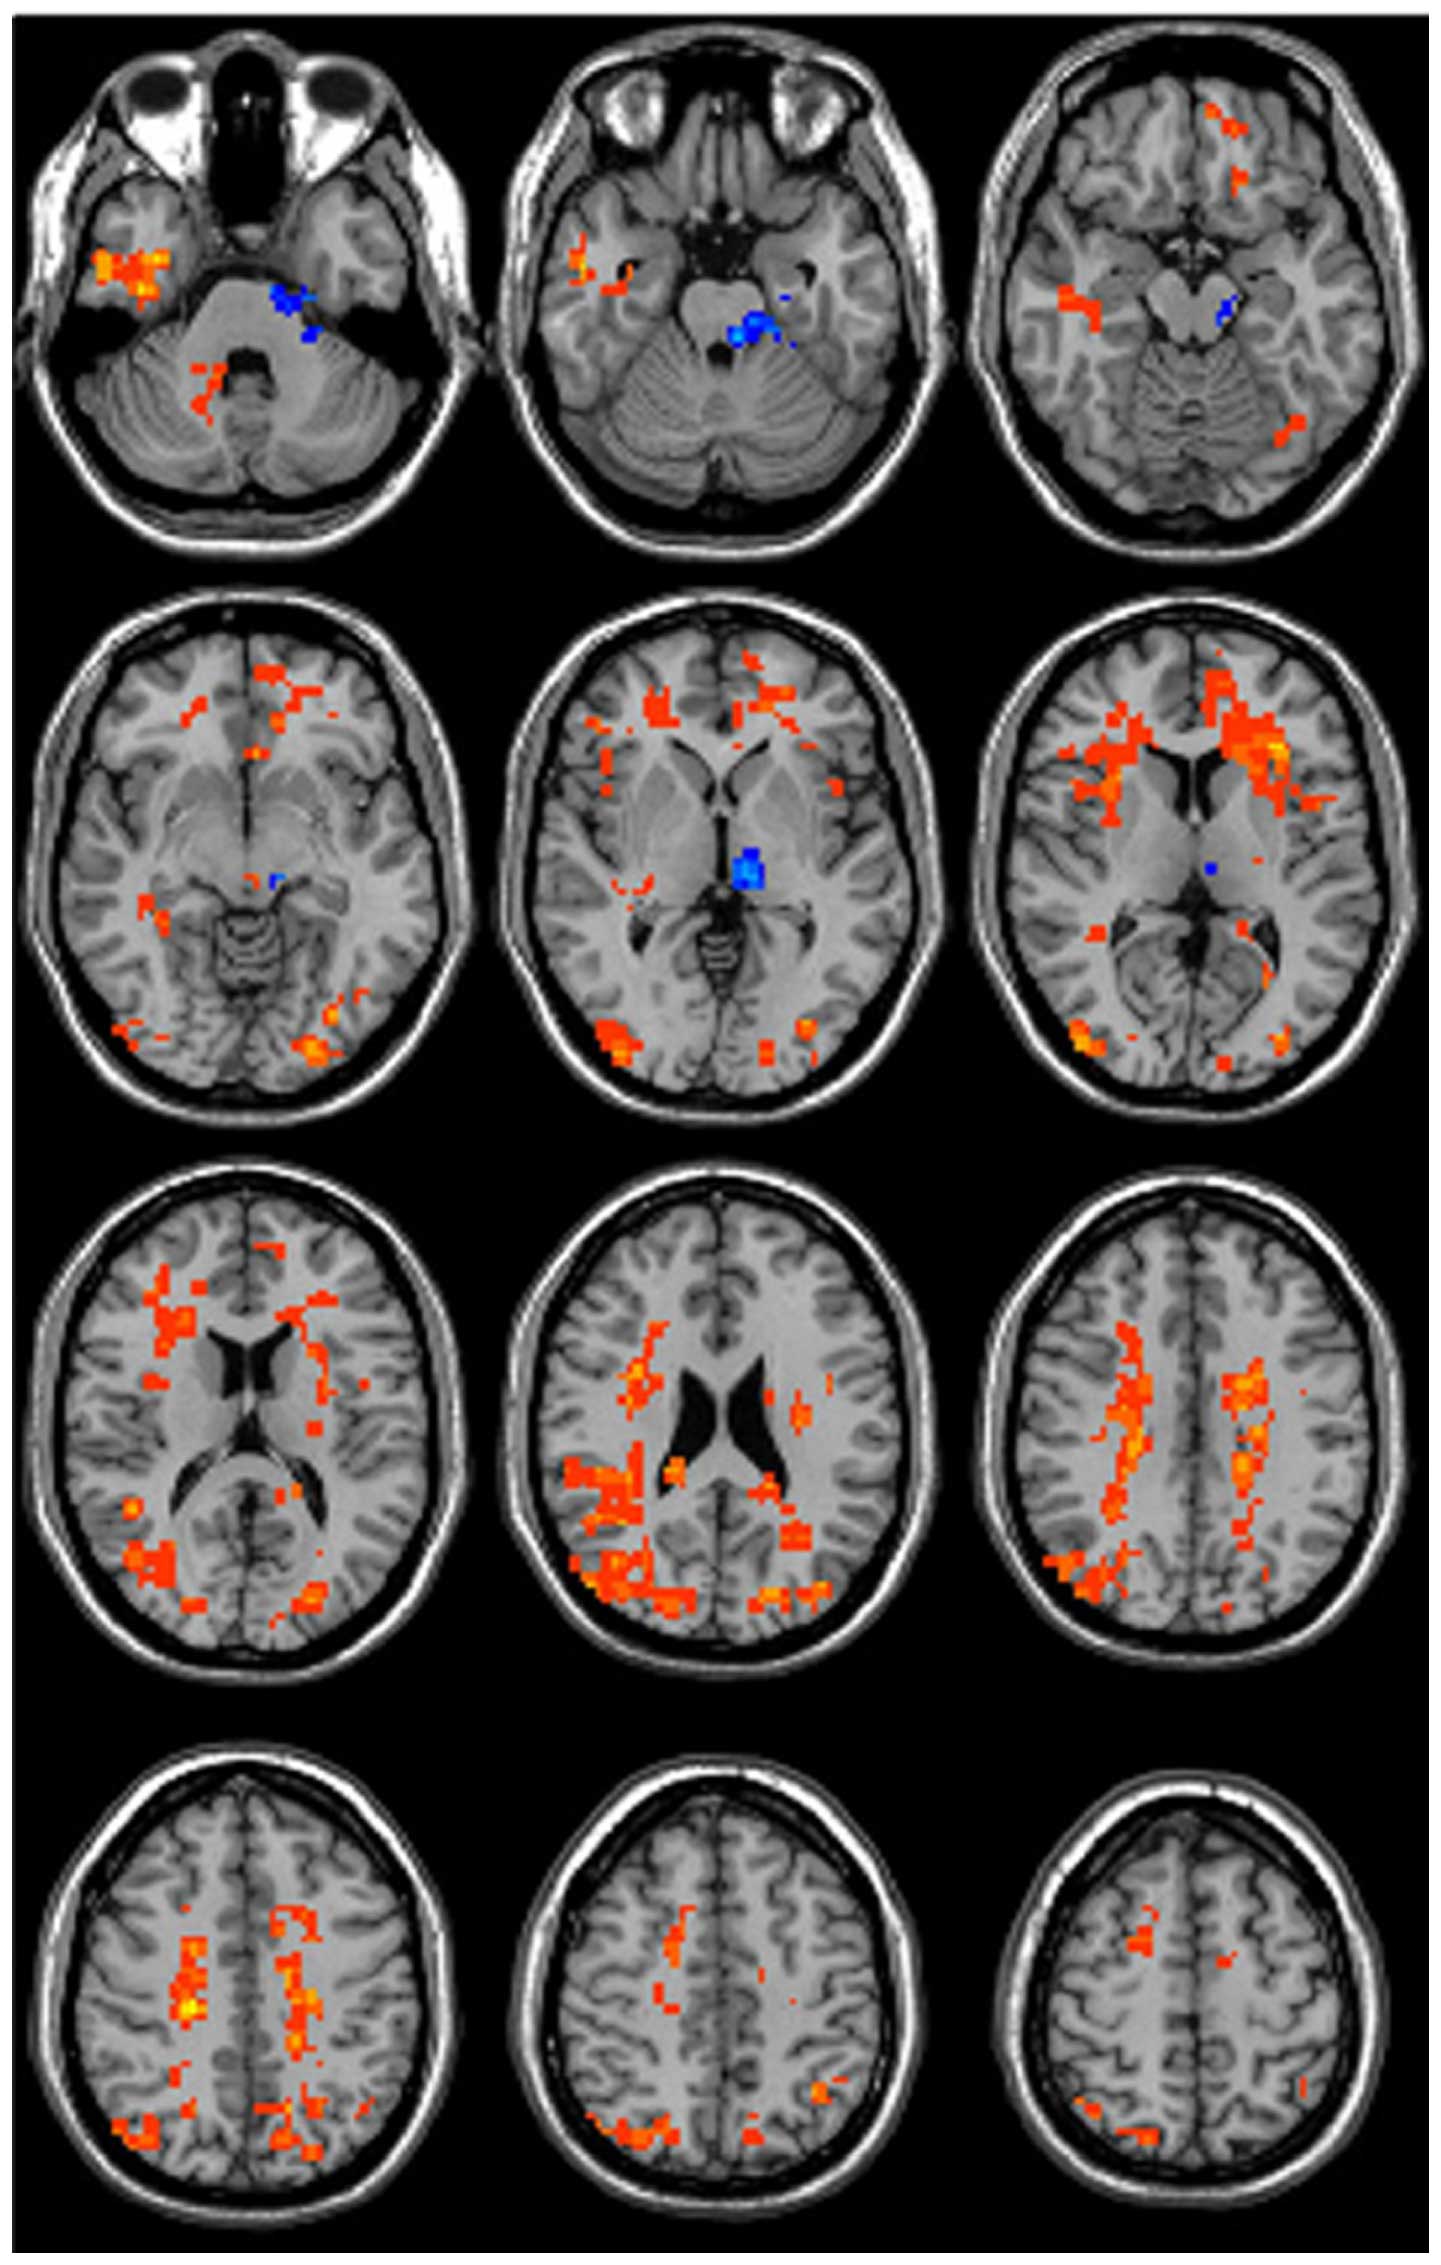
At 1 h after codeine phosphate administration, the
ALFF values were significantly altered in various brain regions
(Fig. 1; Table I). These regions predominately
included the sensorimotor system, limbic system, reward system and
corona radiata. The ALFF values increased in the right frontal lobe
white matter, right parietal white matter, right superior parietal
lobule, right inferior frontal gyrus, right limbic lobe, right
insula, right ceneus, right parahippocampal gyrus, right cerebellum
crus 2, left parietal white matter, left frontal lobe white matter,
left superior parietal lobule, left superior frontal gyrus, left
cingulate, left insula, left ceneus, left thalamus, left cerebral
peduncle and left pons. The ALFF values decreased in the left
thalamus but did not change in the globus pallidus.
 | Table I.Peak MNI coordinates of clusters for
the amplitude of low-frequency fluctuation. |
Table I.
Peak MNI coordinates of clusters for
the amplitude of low-frequency fluctuation.
|
| MNI
coordinates |
|
|
|---|
|
|
|
|
|
|---|
| Brain region | X | Y | Z | t-value | Cluster size |
|---|
| Right frontal lobe
white matter | 23 | 30 | 13 | 2.73 |
|
| Right parietal
white matter | −21 | −24 | 39 | 4.79 | 1,108 |
| Left parietal white
matter | −21 | −21 | 36 | 4.22 |
|
| Left frontal lobe
white matter | −22 | 33 | 13 | 2.24 | 1,481 |
| Left superior
parietal lobule | −36 | −58 | 49 | 3.21 | 93 |
| Left superior
frontal gyrus | −12 | 57 | 39 | 3.46 | 47 |
| Left cingulate | −7 | 45 | 9 | 2.52 | 99 |
| Left insula | −39 | 11 | 8 | 2.36 | 63 |
| Left ceneus | −33 | −85 | 9 | 3.45 | 196 |
| Left thalamus | −8 | −20 | −1 | −4.03 | 96 |
| Left cerebral
peduncle | −11 | −21 | −16 | −2.01 | 107 |
| Left pons | −15 | −25 | −26 | −2.08 | 101 |
| Right superior
parietal lobule | 31 | −71 | 49 | 2.74 | 46 |
| Right inferior
frontal gyrus | 47 | 38 | −1 | 2.65 | 104 |
| Right limbic
lobe | 42 | −30 | −27 | 3.38 | 85 |
| Right insula | 42 | 11 | 8 | 2.28 | 89 |
| Right ceneus | 45 | −81 | 9 | 3.05 | 321 |
| Right
parahippocampal gyrus | 54 | −1 | −22 | 3.26 | 119 |
| Right cerebellum
crus 2 | 18 | −93 | −33 | 3.58 | 35 |
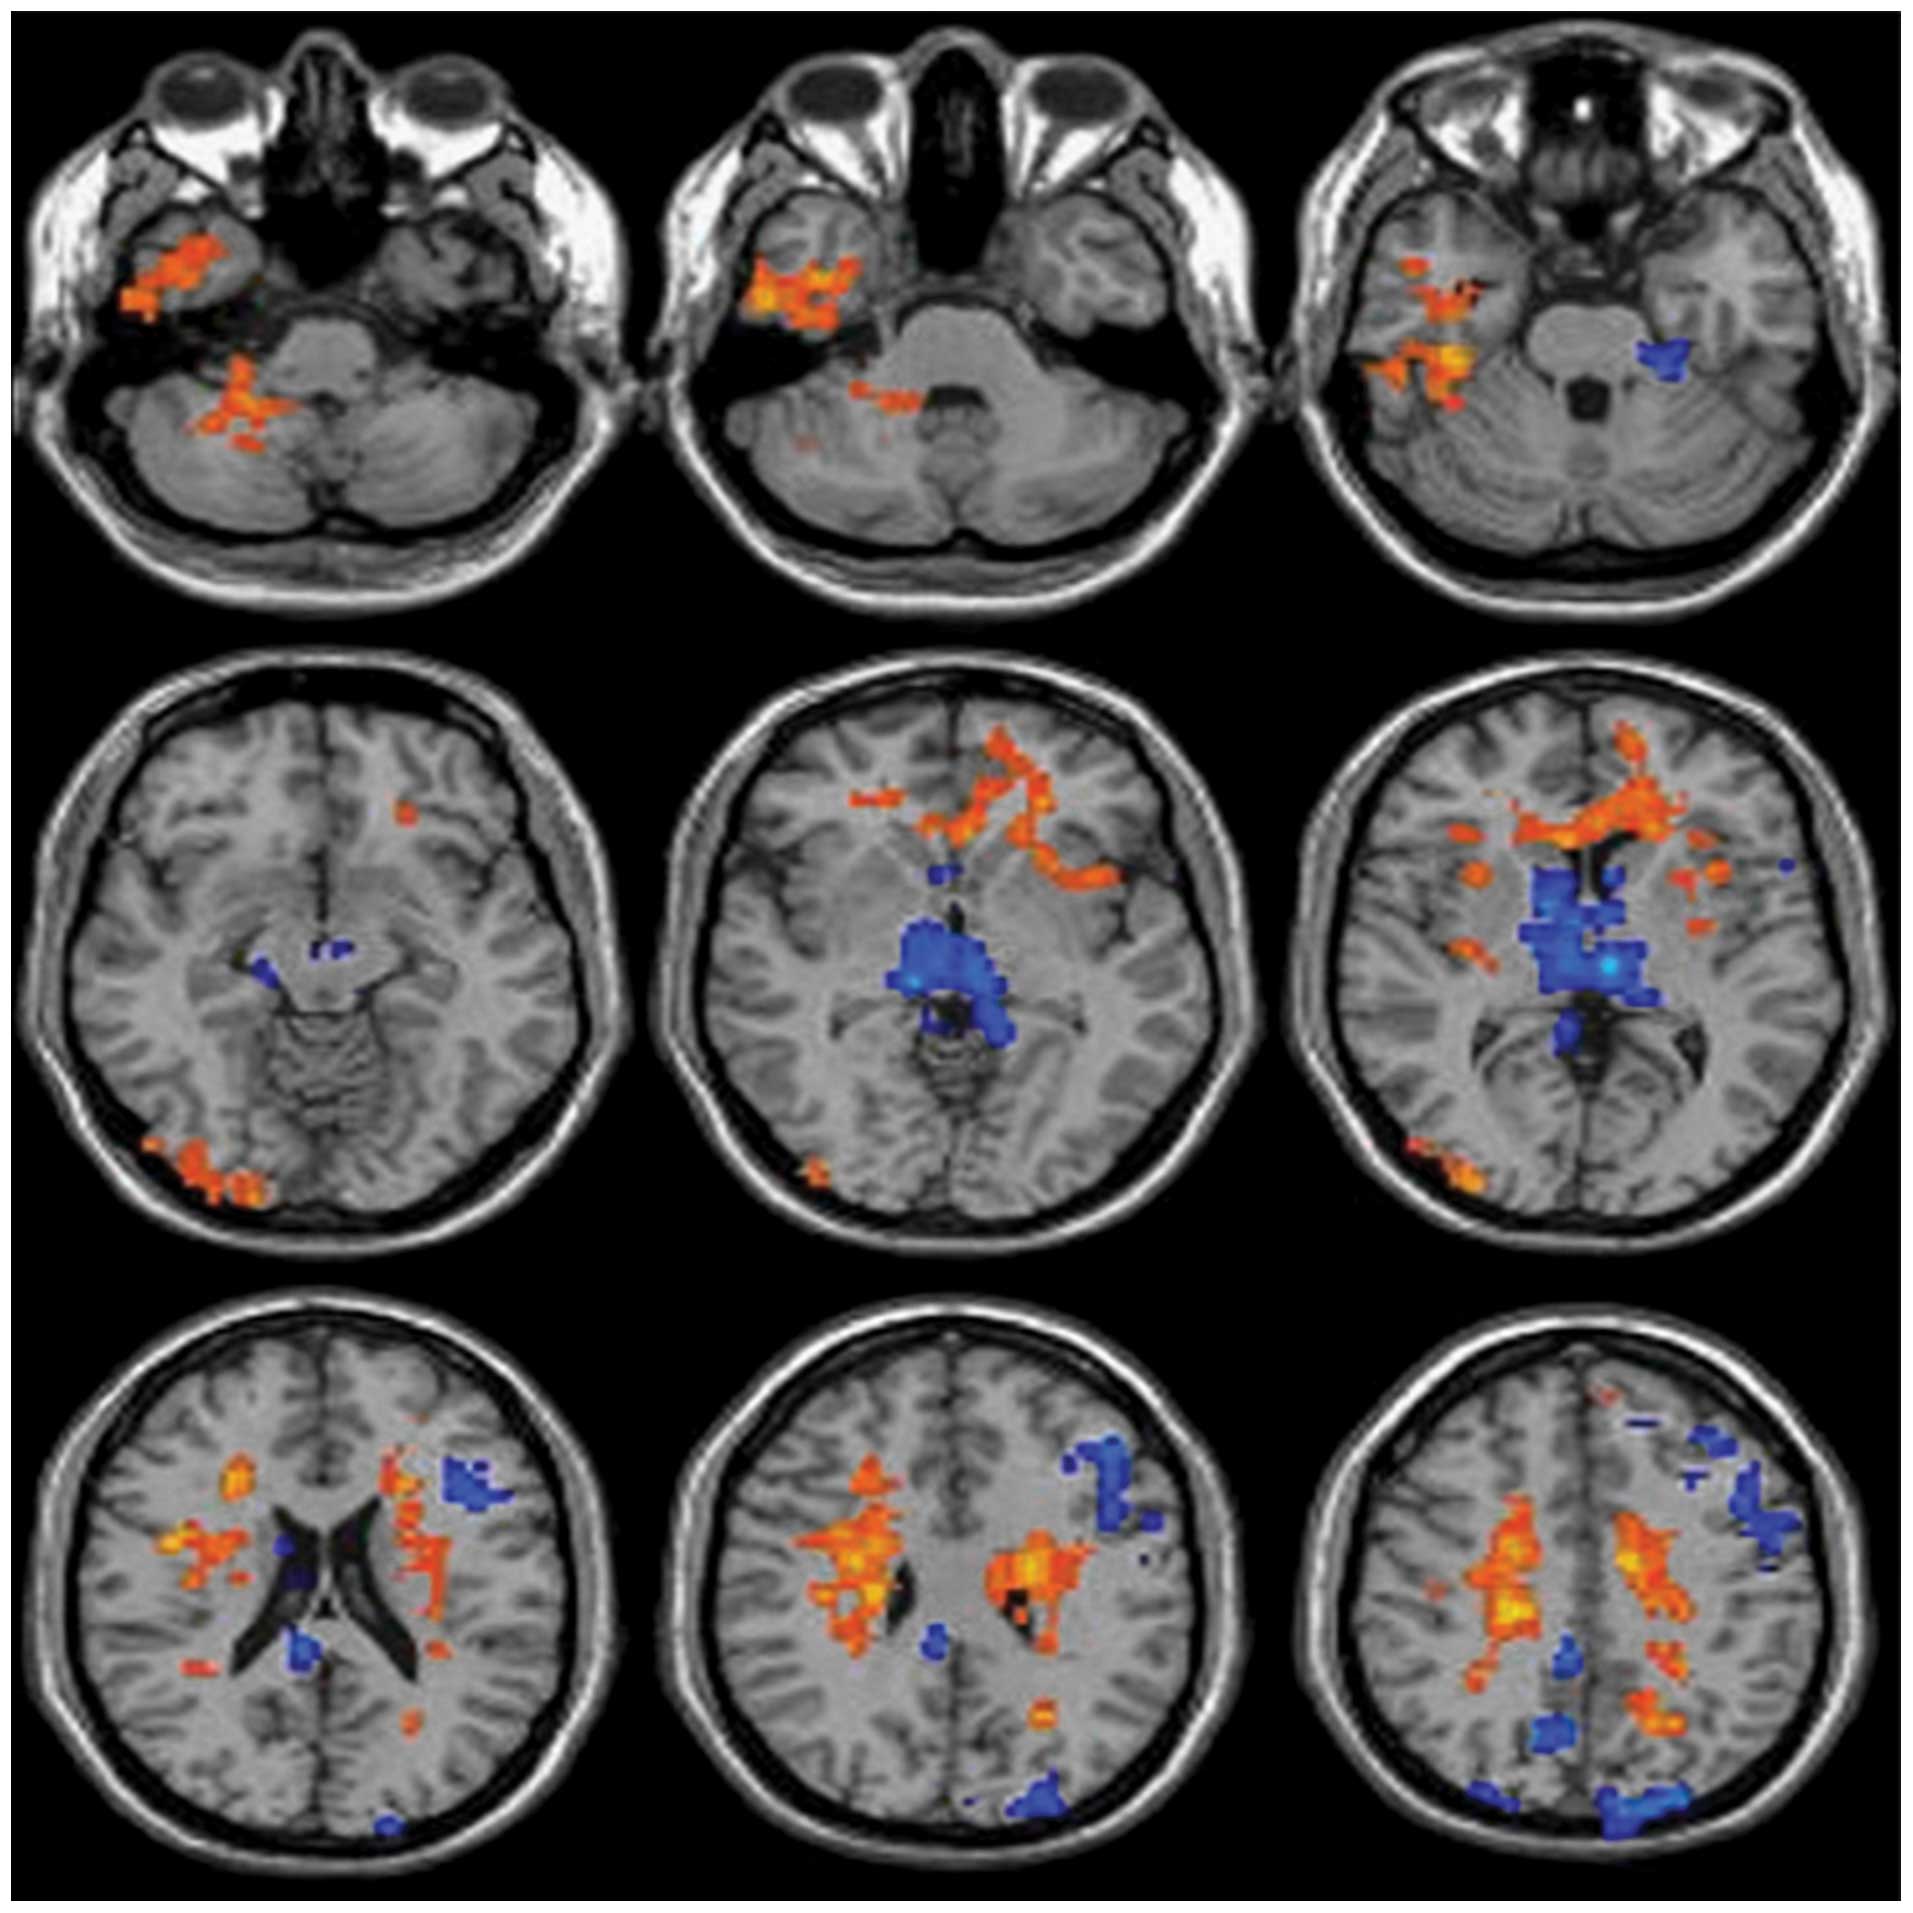
The ReHo values were also altered in various brain
areas (Fig. 2; Table II). These regions primarily included
the bilateral corona radiata, genu of the corpus callosum, left
frontal lobe, right temporal lobe, bilateral parietal lobe, right
cerebellum and thalamus. The ReHo values increased mainly in left
corona radiate, right corona radiate, Genu of corpus callosum, Left
insular lobe, Left putamen, Right insular lobe, right lateral
occipitotemporal gyrus, right parahippocampal gyrus, right middle
cerebral peduncle, right inferior temporal gyrus and right
cerebellum posterior lobe. The ReHo values declined in left
precentral gyrus, left cuneus, left middle frontal gyrus, left
inferior frontal gyrus, left thalamus, left cerebral peduncle,
right precuneus, right cingulated gyrus and right thalamus
(Fig. 2; Table II).
| Table II.Peak MNI coordinates of clusters for
regional homogeneity. |
Table II.
Peak MNI coordinates of clusters for
regional homogeneity.
|
| MNI
coordinates |
|
|
|---|
|
|
|
|
|
|---|
| Brain region | X | Y | Z | t-value | Cluster size |
|---|
| Left corona
radiata | −21 | −21 | 36 | 4.22 | 1,163 |
| Right corona
radiata | 21 | −24 | 39 | 4.79 | 679 |
| Genu of corpus
callosum | −1 | 34 |
4 | 3.32 | 118 |
| Left precentral
gyrus | −45 | −16 | 49 | −4.09 | 105 |
| Left cuneus | −25 | −89 | 29 | −3.59 | 168 |
| Left middle frontal
gyrus | −44 | 13 | 36 | −3.73 | 100 |
| Left inferior
frontal gyrus | −45 | 27 | 27 | −5.74 | 112 |
| Left insular
lobe | −40 | 13 |
4 | 3.01 | 80 |
| Left thalamus | −6 | −18 |
3 | −7.06 | 126 |
| Left putamen | −28 | 10 |
2 | 2.32 | 93 |
| Left cerebral
peduncle | −8 | −27 | −20 | −3.36 | 96 |
| Right
precuneus | 12 | −73 | 37 | −2.74 | 94 |
| Right cingulated
gyrus |
5 | −39 | 40 | −5.27 | 84 |
| Right lateral
occipitotemporal gyrus | 51 |
3 | −24 | 7.24 | 79 |
| Right
parahippocampal gyrus | 41 | −12 | −29 | 5.00 | 200 |
| Right thalamus |
9 | −18 |
3 | −7.07 | 98 |
| Right middle
cerebral peduncle | 19 | −43 | −39 | 4.71 | 105 |
| Right inferior
temporal gyrus | 50 | −33 | −22 | 3.02 | 80 |
| Right cerebellum
posterior lobe | 21 | −42 | −39 | 6.11 | 81 |
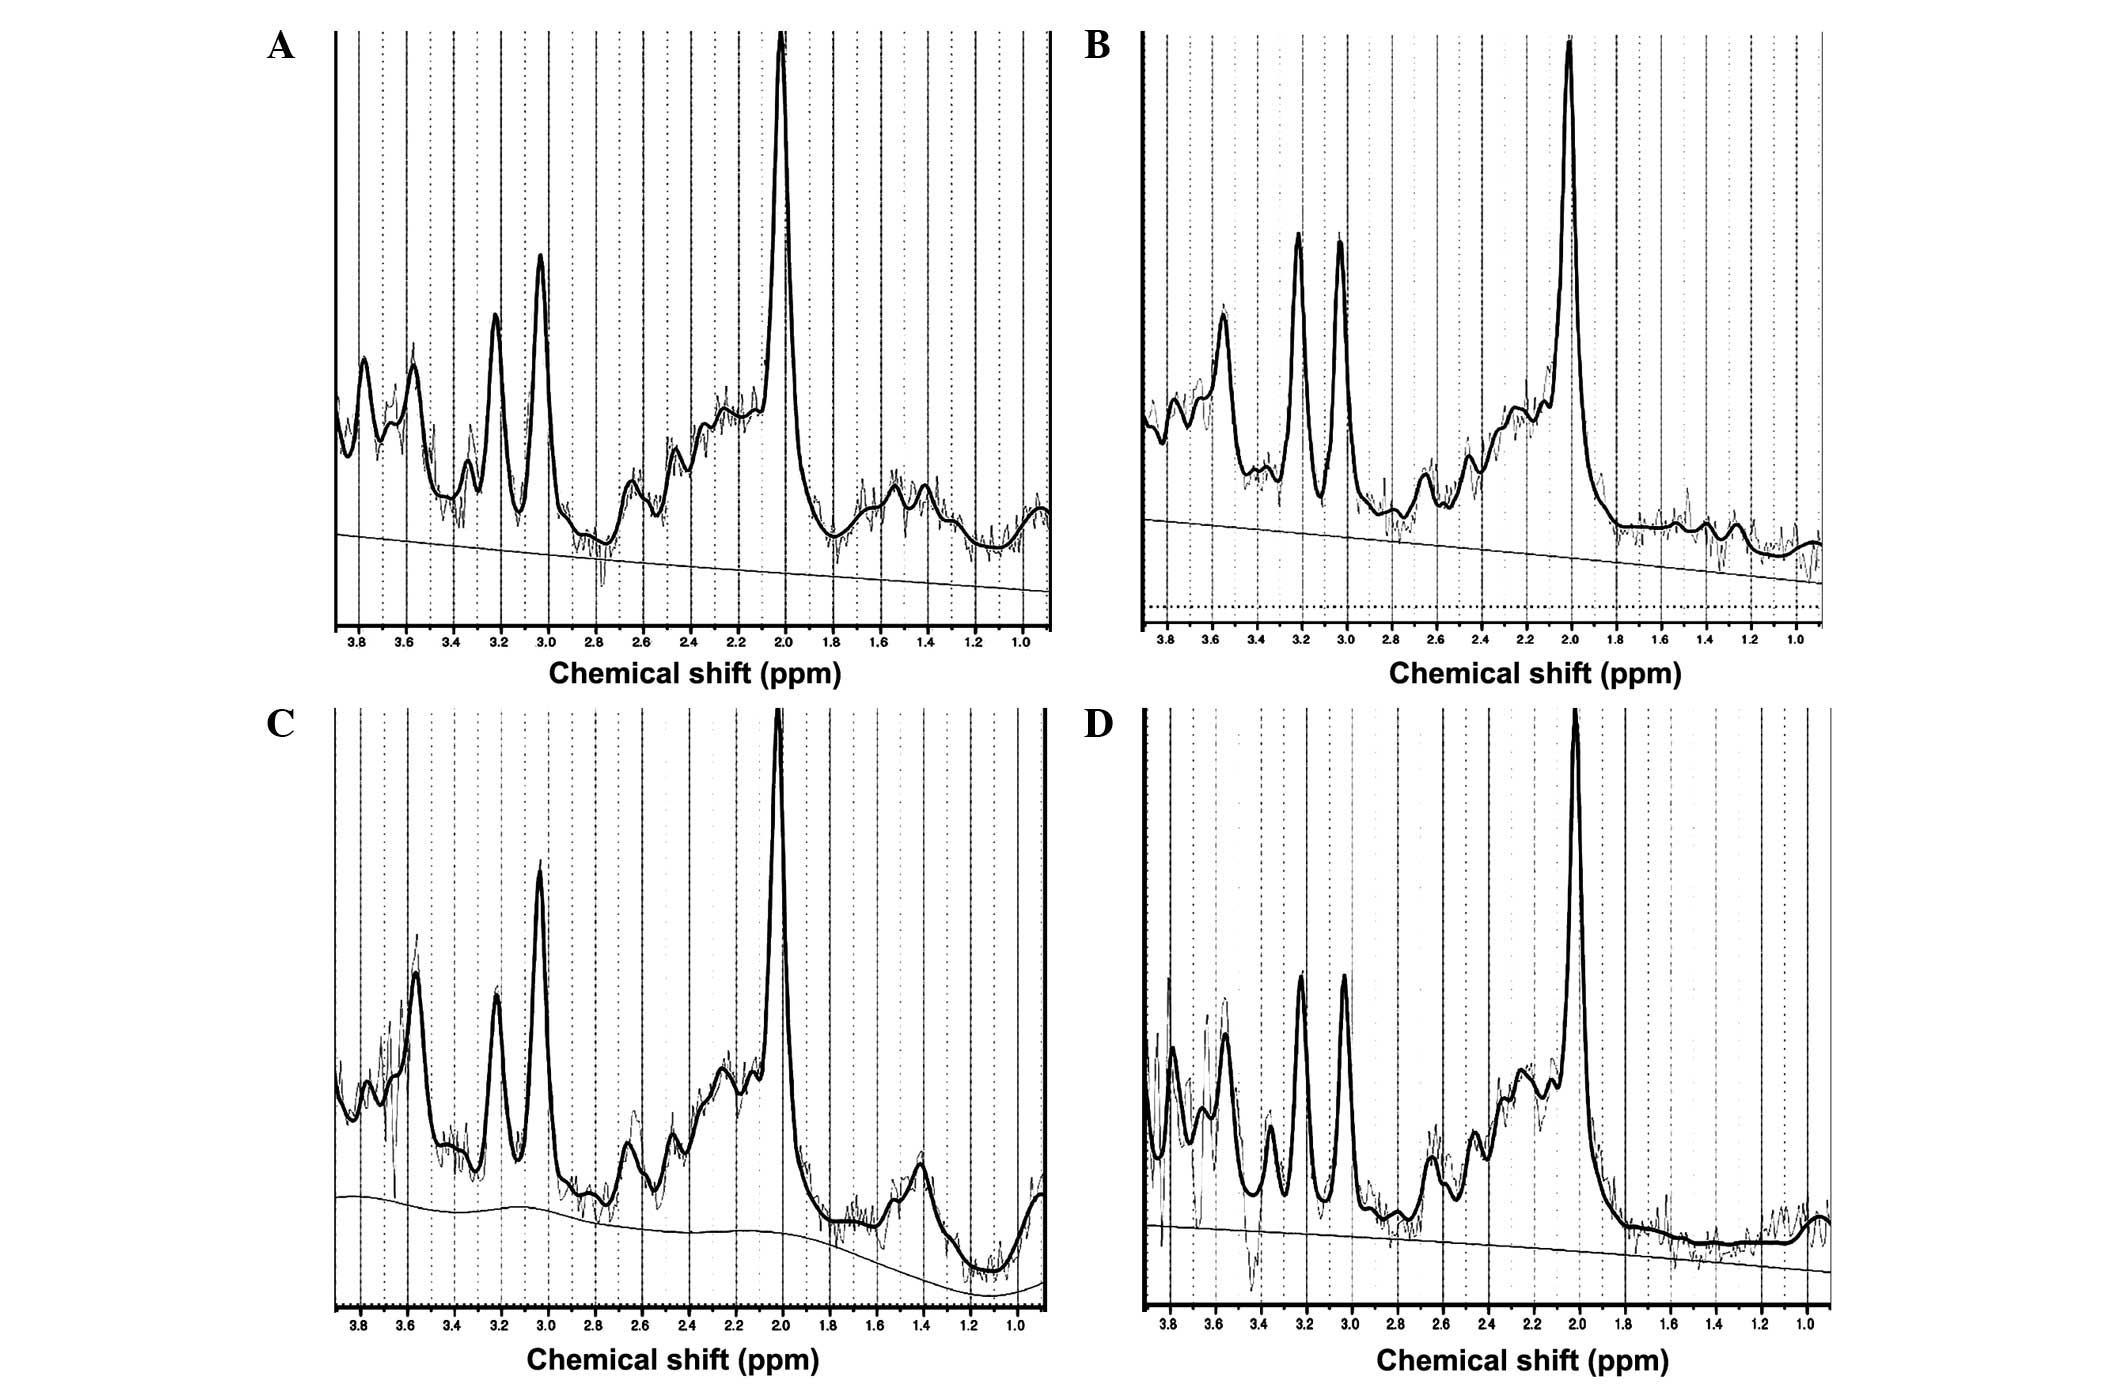
1H-MRS results
The high-quality 1H-MRS data, which are
presented in Fig. 3A–D, indicated
that the metabolite peaks were located as follows: N-acetyl
aspartate (2.0 ppm), creatinine (3.03 ppm), choline (3.2 ppm),
inositol (3.56 ppm) and glutamic acid (2.1 ppm). There results
coincide with those previously reported in the literature (30). The choline content was significantly
increased in the right and left frontal lobes following oral
codeine phosphate administration (P=0.02 and P=0.03, respectively;
Tables III and IV). By contrast, the inositol content was
significantly decreased in the left frontal lobe (P=0.02; Table IV). However, the glutamic acid
content did not change significantly in the frontal lobes following
codeine phosphate administration. Compared with before
administering codeine phosphate, the concentrations of NAA and Cr
in the both frontal lobe had no statistical significance.
| Table III.Concentrations of metabolites in the
right frontal lobe prior to and following treatment with codeine
phosphate. |
Table III.
Concentrations of metabolites in the
right frontal lobe prior to and following treatment with codeine
phosphate.
|
| Metabolite
concentration (mmol/l) |
|
|
|---|
|
|
|
|
|
|---|
| Metabolite | Prior to
administration | Following
administration | t-value | P-value |
|---|
| Creatinine | 4.90±0.71 | 5.14±0.99 | −0.82 | 0.42 |
| Glutamic acid | 4.44±0.39 | 3.03±0.38 | 0.90 | 0.37 |
| Inositol | 4.96±0.35 | 4.54±0.25 | 0.95 | 0.35 |
| N-acetyl
aspartate | 6.95±1.46 | 7.33±0.85 | −0.91 | 0.38 |
| Choline | 1.34±0.11 | 1.75±0.13 | −2.61 | 0.02 |
| Table IV.Concentrations of metabolites in the
left frontal lobe prior to and following treatment with codeine
phosphate. |
Table IV.
Concentrations of metabolites in the
left frontal lobe prior to and following treatment with codeine
phosphate.
|
| Metabolite
concentration (mmol/l) |
|
|
|---|
|
|
|
|
|
|---|
| Metabolite | Prior to
administration | Following
administration | t-value | P-value |
|---|
| Creatinine | 5.39±0.42 | 4.96±0.21 | 0.91 | 0.37 |
| Glutamic acid | 3.76±0.31 | 4.31±0.46 | −0.32 | 0.75 |
| Inositol | 5.13±0.33 | 4.14±0.18 | 2.63 | 0.02 |
| N-acetyl
aspartate | 7.46±0.91 | 7.41±0.66 | 0.07 | 0.95 |
| Choline | 1.19±0.08 | 1.44±0.06 | −2.41 | 0.03 |
In the present study, the ALFF and ReHo values of
different brain regions following administration of a single, low
dose of codeine phosphate in healthy volunteers were detected by
R-S fMRI. The ALFF values decreased in the left thalamus but the
ALFF values in the globus pallidus did not change. Moreover, the
metabolic changes in the two sides of the frontal lobe were
identified by 1H MRS, particularly the concentration
changes in inositol, choline and glutamic acid contents.
Discussion
ALFF is defined as the total power of low-frequency
oscillations between 0.01 and 0.1 Hz (31). It is a marker for differences between
individuals or brain dysfunction (32). In the present study, the ALFF values
were altered in different brain areas 1 h after a single, low-dose,
oral administration of codeine phosphate in healthy volunteers;
these regions included the sensorimotor system, limbic system,
connection between hemispheres and reward system. Opioid receptors
exist in these areas and are activated when codeine binds to them;
thus, the neuronal cell functional status and structure change
accordingly (33).
In a previous opioid addiction study, thalamic
functions were decreased and were an area of investigation. The
data of the present study indicated that the ALFF values decreased
in the left thalamus after a single, low-dose, oral administration
of codeine phosphate. Declined ALFF values of the left thalamus had
always been seen as an important indicator for opioid addiction
(34). However, based on the results
of the present study this decline is believed to be a side effect
of opioid drugs that extend beyond the effects associated with drug
dependence. However, the ALFF values in the globus pallidus did not
change in the present study. A decrease in the ALFF values of the
globus pallidus has previously been suggested as a marker for
opioid addiction (35). Thus, these
findings indicate that a single, low-dose administration of codeine
phosphate does not impact the ALFF value in the globus pallidus.
Compared with other chronic opioid drug administration, the ALFF
value in globus pallidus was changed (36). These findings are of potential
significance for future studies regarding codeine phosphate
dependence, since the ALFF values in the globus pallidus may
represent a marker that has the potential to differentiate between
the effects of acute and chronic codeine phosphate intake. However,
the specific point at which the ALFF values in the globus pallidus
change as a result of the transition to codeine phosphate addiction
requires further investigation.
ReHo is a voxel-based measurement of brain activity
that does not require an a priori definition of regions of
interest and can provide information regarding the local activity
of regions throughout the brain (37). ReHo values reflect the similarity of
time consistency between a voxel and its neighboring voxel
(38). Increased ReHo values
indicate that regional brain activity is more synchronized. The
synchronization of brain regions is responsible for the regulation
of brain processing and the organization of information in space
and time (39). In the current
study, brain regions with high ReHo values indicated an increased
capacity of relevant brain regions to manage information.
Furthermore, brain regions with low ReHo values indicated that
these brain areas were weaker in handling information. Regardless
of ALFF or ReHo applications, the present study identified a small
alteration in cerebrospinal fluid that appeared to be
inconsequential; however, cerebrospinal fluid presented low
frequency oscillations and a similar circulating consistency, which
has been previously reported (40).
The results in the current study identified that
inositol content decreased in the left frontal lobe following a
single, low-dose administration of codeine phosphate, which may be
associated with functional alterations in brain voxels. Typically,
the metabolites of the voxel exchange with external brain areas
increase due to increased blood flow and blood velocity. In
addition, an increased choline content in the two frontal lobes was
identified following codeine phosphate administration (41,42).
Choline is a constituent of cell membranes and reflects membrane
turnover, while it is also a precursor of acetylcholine and
phosphatidylcholine (43); thus, it
is involved in membrane status, memory, cognition and mood. In the
present study, the ALFF increased in voxels that exhibited
metabolite changes in the frontal lobe. The ALFF-enhanced brain
regions exhibit increased excitability and metabolism; therefore,
the increase in choline content may explain the increase in the
ALFF signal in the frontal lobe (44).
The glutamic acid content was unchanged in the
frontal lobe in the current study. Thus, a single, low-dose
administration of codeine phosphate did not affect the glutamate
metabolite level in the frontal lobe, as identified using
1H-MRS. Glutamic acid can function as an excitotoxin,
which may cause nerve-cell injury in a variety of neurological
disorders, including drug addiction (45). Strong and illicit opium drug
dependence can cause glutamate concentration changes in the frontal
cortex (46–48). Thus, the results in the present study
are significant for future studies regarding codeine phosphate
dependence, since they indicate that a single, low-dose
administration of codeine phosphate induces different effects on
brain glutamate concentrations in the frontal cortex when compared
with the findings from more chronic administrations (49–51).
Therefore, glutamate metabolites in the frontal cortex may
represent a potential marker for the estimation of weak opium drug
dependence.
In conclusion, the results of the current study
indicated that the ALFF and ReHo values changed in different brain
regions, and the content of various metabolites changed in the
frontal lobe following low-dose codeine phosphate administration in
healthy volunteers. These results clearly indicate that codeine
phosphate affects brain function and metabolism. Furthermore, these
techniques may be used in future studies to examine more specific
mechanisms of codeine phosphate addiction.
Acknowledgements
The present study was supported by the key program
of the National Natural Science Foundation of China (grant nos.
81471730 and 81371612) and the Natural Science Foundation of
Guangdong Province (grant no. S2013010013867).
References
|
1
|
Ammon S, Marx C, Behrens C, Hofmann U,
Mürdter T, Griese EU and Mikus G: Diclofenac does not interact with
codeine metabolism in vivo: A study in healthy volunteers. BMC Clin
Pharmacol. 27:2:22002.
|
|
2
|
Licata SC and Renshaw PF: Neurochemistry
of drug action: insights from proton magnetic resonance
spectroscopic imaging and their relevance to addiction. Ann N Y
Acad Sci. 1187:148–171. 2010. View Article : Google Scholar : PubMed/NCBI
|
|
3
|
Magalhaes AC: Functional magnetic
resonance and spectroscopy in drug and substance abuse. Top Magn
Reson Imaging. 16:247–251. 2005. View Article : Google Scholar : PubMed/NCBI
|
|
4
|
Paterson JR, Talwar DK, Watson ID and
Stewart MJ: Codeine abuse from co-codaprin. Lancet. 335:2241990.
View Article : Google Scholar : PubMed/NCBI
|
|
5
|
Hall WD and Mattick RP: Clinical update:
Codeine maintenance in opioid dependence. Lancet. 370:550–552.
2007. View Article : Google Scholar : PubMed/NCBI
|
|
6
|
Cao Z, Lin PY, Shen ZW, Xiao YY and Wu RH:
7.0 T high-resolution 1H-MR spectroscopy of metabolic changes
induced by chronic codeine phosphate in rat hippocampus.
Neuroreport. 26:735–739. 2015.PubMed/NCBI
|
|
7
|
Jansen JF, Backes WH, Nicolay K and Kooi
ME: 1H MR spectroscopy of the brain: Absolute quantification of
metabolites. Radiology. 240:318–332. 2006. View Article : Google Scholar : PubMed/NCBI
|
|
8
|
Schaller B, Xin L, Cudalbu C and Gruetter
R: Quantification of the neurochemical profile using simulated
macromolecule resonances at 3 T. NMR Biomed. 26:593–599. 2013.
View Article : Google Scholar : PubMed/NCBI
|
|
9
|
Raschke F, Fuster-Garcia E, Opstad KS and
Howe FA: Classification of single-voxel 1H spectra of brain tumours
using LCModel. NMR Biomed. 25:322–331. 2012. View Article : Google Scholar : PubMed/NCBI
|
|
10
|
Liemburg E, Sibeijn-Kuiper A, Bais L,
Pijnenborg G, Knegtering H, van der Velde J, Opmeer E, de Vos A,
Dlabac-De Lange J, Wunderink L and Aleman A: Prefrontal NAA and Glx
levels in different stages of psychotic disorders: A 3T (1)H-MRS
study. Sci Rep. 6:218732016. View Article : Google Scholar : PubMed/NCBI
|
|
11
|
Westman E, Spenger C, Oberg J, Reyer H,
Pahnke J and Wahlund LO: In vivo 1H-magnetic resonance spectroscopy
can detect metabolic changes in APP/PS1 mice after donepezil
treatment. BMC Neurosci. 10:332009. View Article : Google Scholar : PubMed/NCBI
|
|
12
|
Quinque EM, Karger S, Arélin K, Schroeter
ML, Kratzsch J and Villringer A: Structural and functional MRI
study of the brain, cognition and mood in long-term adequately
treated Hashimoto's thyroiditis. Psychoneuroendocrinology.
42:188–198. 2014. View Article : Google Scholar : PubMed/NCBI
|
|
13
|
Chou YH, Panych LP, Dickey CC, Petrella JR
and Chen NK: Investigation of long-term reproducibility of
intrinsic connectivity network mapping: A resting-state fMRI study.
AJNR Am J Neuroradiol. 33:833–838. 2012. View Article : Google Scholar : PubMed/NCBI
|
|
14
|
Fox MD and Greicius M: Clinical
applications of resting state functional connectivity. Front Syst
Neurosci. 4:192010.PubMed/NCBI
|
|
15
|
Rosazza C and Minati L: Resting-state
brain networks: Literature review and clinical applications. Neurol
Sci. 32:773–785. 2011. View Article : Google Scholar : PubMed/NCBI
|
|
16
|
Ma N, Liu Y, Li N, Wang CX, Zhang H, Jiang
XF, Xu HS, Fu XM, Hu X and Zhang DR: Addiction related alteration
in resting-state brain connectivity. Neuroimage. 49:738–744. 2010.
View Article : Google Scholar : PubMed/NCBI
|
|
17
|
Liu J, Qin W, Yuan K, Li J, Wang W, Li Q,
Wang Y, Sun J, von Deneen KM, Liu Y and Tian J: Interaction between
dysfunctional connectivity at rest and heroin cues-induced brain
responses in male abstinent heroin-dependent individuals. PLoS One.
6:e230982011. View Article : Google Scholar : PubMed/NCBI
|
|
18
|
Peregud DI, Yakovlev AA, Stepanichev MY,
Onufriev MV, Panchenko LF and Gulyaeva NV: Content of mRNA for NMDA
glutamate receptor subunits in the frontal cortex and striatum of
rats after morphine withdrawal is related to the degree of
abstinence. Bull Exp Biol Med. 153:835–838. 2012.(In English,
Russian). View Article : Google Scholar : PubMed/NCBI
|
|
19
|
Raungrut P, Uchaipichat V, Elliot DJ,
Janchawee B, Somogyi AA and Miners JO: In vitro-in vivo
extrapolation predicts drug-drug interactions arising from
inhibition of codeine glucuronidation by dextropropoxyphene,
fluconazole, ketoconazole and methadone in humans. J Pharmacol Exp
Ther. 334:609–618. 2010. View Article : Google Scholar : PubMed/NCBI
|
|
20
|
George O and Koob GF: Individual
differences in prefrontal cortex function and the transition from
drug use to drug dependence. Neurosci Biobehav Rev. 35:232–247.
2010. View Article : Google Scholar : PubMed/NCBI
|
|
21
|
Llamas-Velasco S, Llorente-Ayuso L,
Contador I and Bermejo-Pareja F: Spanish versions of the Minimental
State Examination (MMSE). Questions for their use in clinical
practice Rev Neurol. 61:363–371. 2015.PubMed/NCBI
|
|
22
|
Yuan J, Blumen HM, Verghese J and Holtzer
R: Functional connectivity associated with gait velocity during
walking and walking-while-talking in aging: a resting-state fMRI
study. Hum Brain Mapp. 36:1484–1493. 2015. View Article : Google Scholar : PubMed/NCBI
|
|
23
|
Gao Y, Liao L and Blok BF: A resting-state
functional MRI study on central control of storage: brain response
provoked by strong desire to void. Int Urol Nephrol. 47:927–935.
2015. View Article : Google Scholar : PubMed/NCBI
|
|
24
|
Lee YB, Lee J, Tak S, Lee K, Na DL, Seo
SW, Jeong Y and Ye JC: Alzheimer's Disease Neuroimaging Initiative:
Sparse SPM: Group sparse-dictionary learning in SPM framework for
resting-state functional connectivity MRI analysis. Neuroimage.
125:1032–1045. 2016. View Article : Google Scholar : PubMed/NCBI
|
|
25
|
Chao-Gan Y and Yu-Feng Z: DPARSF: A MATLAB
toolbox for ‘Pipeline’ data analysis of resting-state fMRI. Front
Syst Neurosci. 4:132010.PubMed/NCBI
|
|
26
|
Clayton GM and Devasia S: Iterative
image-based modeling and control for higher scanning probe
microscope performance. Rev Sci Instrum. 78:0837042007. View Article : Google Scholar : PubMed/NCBI
|
|
27
|
Zhao L, Liu J, Dong X, Peng Y, Yuan K, Wu
F, Sun J, Gong Q, Qin W and Liang F: Alterations in regional
homogeneity assessed by fMRI in patients with migraine without aura
stratified by disease duration. J Headache Pain. 14:852013.
View Article : Google Scholar : PubMed/NCBI
|
|
28
|
Cao Z, Ye BD, Shen ZW, Cheng XF, Yang ZX,
Liu YY, Wu RH, Geng K and Xiao YY: 2D-1H proton magnetic resonance
spectroscopic imaging study on brain metabolite alterations in
patients with diabetic hypertension. Mol Med Rep. 11:4232–4238.
2015.PubMed/NCBI
|
|
29
|
Palanca BJ, Mitra A, Larson-Prior L,
Snyder AZ, Avidan MS and Raichle ME: Resting-state functional
magnetic resonance imaging correlates of sevoflurane-induced
unconsciousness. Anesthesiology. 12:346–356. 2015. View Article : Google Scholar
|
|
30
|
Shen ZW, Cao Z, You KZ, Yang ZX, Xiao YY,
Cheng XF, Chen YW and Wu RH: Quantification of choline
concentration following liver cell apoptosis using 1H magnetic
resonance spectroscopy. World J Gastroenterol. 18:1130–1136. 2012.
View Article : Google Scholar : PubMed/NCBI
|
|
31
|
Ni L, Liu R, Yin Z, Zhao H, Nedelska Z,
Hort J, Zhou F, Wu W, Zhang X, Li M, Yu H, Zhu B, Xu Y and Zhang B:
Aberrant spontaneous brain activity in patients with mild cognitive
impairment and concomitant lacunar infarction: A resting-state
functional MRI study. J Alzheimers Dis. 50:1243–1254. 2016.
View Article : Google Scholar : PubMed/NCBI
|
|
32
|
Zou QH, Zhu CZ, Yang Y, Zuo XN, Long XY,
Cao QJ, Wang YF and Zang YF: An improved approach to detection of
amplitude of low-frequency fluctuation (ALFF) for resting-state
fMRI: Fractional ALFF. J Neurosci Methods. 172:137–141. 2008.
View Article : Google Scholar : PubMed/NCBI
|
|
33
|
Jiang GH, Qiu YW, Zhang XL, Han LJ, Lv XF,
Li LM, Lin CL, Zhuo FZ, Hu SY and Tian JZ: Amplitude low-frequency
oscillation abnormalities in the heroin users: A resting state fMRI
study. Neuroimage. 57:149–154. 2011. View Article : Google Scholar : PubMed/NCBI
|
|
34
|
Denier N, Schmidt A, Gerber H, Vogel M,
Huber CG, Lang UE, Riecher-Rossler A, Wiesbeck GA, Radue EW, Walter
M and Borgwardt S: Abnormal functional integration of thalamic low
frequency oscillation in the BOLD signal after acute heroin
treatment. Hum Brain Mapp. 36:5287–5300. 2015. View Article : Google Scholar : PubMed/NCBI
|
|
35
|
Muskens JB, Schellekens AF, de Leeuw FE,
Tendolkar I and Hepark S: Damage in the dorsal striatum alleviates
addictive behavior. Gen Hosp Psychiatry. 34:702.e9–702.e116. 2012.
View Article : Google Scholar
|
|
36
|
Chu LF, Lin JC, Clemenson A, Encisco E,
Sun J, Hoang D, Alva H, Erlendson M, Clark JD and Younger JW: Acute
opioid withdrawal is associated with increased neural activity in
reward-processing centers in healthy men: A functional magnetic
resonance imaging study. Drug Alcohol Depend. 153:314–322. 2015.
View Article : Google Scholar : PubMed/NCBI
|
|
37
|
Liang P, Liu Y, Jia X, Duan Y, Yu C, Qin
W, Dong H, Ye J and Li K: Regional homogeneity changes in patients
with neuromyelitis optica revealed by resting-state functional MRI.
Clin Neurophysiol. 122:121–127. 2011. View Article : Google Scholar : PubMed/NCBI
|
|
38
|
Neubauer AC and Fink A: Intelligence and
neural efficiency. Neurosci Biobehav Rev. 33:1004–1023. 2009.
View Article : Google Scholar : PubMed/NCBI
|
|
39
|
Strik C, Klose U, Erb M, Strik H and Grodd
W: Intracranial oscillations of cerebrospinal fluid and blood
flows: Analysis with magnetic resonance imaging. J Magn Reson
Imaging. 15:251–258. 2002. View Article : Google Scholar : PubMed/NCBI
|
|
40
|
Castillo M, Kwock L and Mukherji SK:
Clinical applications of proton MR spectroscopy. AJNR Am J
Neuroradiol. 17:1–15. 1996.PubMed/NCBI
|
|
41
|
Feuerstein D, Takagaki M, Gramer M,
Manning A, Endepols H, Vollmar S, Yoshimine T, Strong AJ, Graf R
and Backes H: Detecting tissue deterioration after brain injury:
Regional blood flow level versus capacity to raise blood flow. J
Cereb Blood Flow Metab. 34:1117–1127. 2014. View Article : Google Scholar : PubMed/NCBI
|
|
42
|
Horita A, Carino MA and Chinn C: Codeine
produces a cholinergically mediated analeptic effect in rats and
rabbits. Pharmacol Biochem Behav. 3:115–118. 1988. View Article : Google Scholar
|
|
43
|
Yang ZX, Huo SS, Cheng XF, Xu ZF, Cao Z,
Zeng JX, Xiao YY, You KZ, Chen W, Liu YY and Wu RH: Quantitative
multivoxel proton MR spectroscopy study of brain metabolites in
patients with amnestic mild cognitive impairment: A pilot study.
Neuroradiology. 54:451–458. 2012. View Article : Google Scholar : PubMed/NCBI
|
|
44
|
Li Z, Zhu Y, Childress AR, Detre JA and
Wang Z: Relations between BOLD fMRI-derived resting brain activity
and cerebral blood flow. PLoS One. 7:e445562012. View Article : Google Scholar : PubMed/NCBI
|
|
45
|
Hermann D, Frischknecht U, Heinrich M,
Hoerst M, Vollmert C, Vollstädt-Klein S, Tunc-Skarka N, Kiefer F,
Mann K and Ende G: MR spectroscopy in opiate maintenance therapy:
Association of glutamate with the number of previous withdrawals in
the anterior cingulate cortex. Addict Biol. 17:659–667. 2012.
View Article : Google Scholar : PubMed/NCBI
|
|
46
|
Gao H, Xiang Y, Sun N, Zhu H, Wang Y, Liu
M, Ma Y and Lei H: Metabolic changes in rat prefrontal cortex and
hippocampus induced by chronic morphine treatment studied ex
vivo by high resolution 1H NMR spectroscopy.
Neurochem Int. 50:386–394. 2007. View Article : Google Scholar : PubMed/NCBI
|
|
47
|
Hermann D, Frischknecht U, Heinrich M,
Hoerst M, Vollmert C, Vollstädt-Klein S, Tunc-Skarka N, Kiefer F,
Mann K and Ende G: MR spectroscopy in opiate maintenance therapy:
Association of glutamate with the number of previous withdrawals in
the anterior cingulate cortex. Addict Biol. 17:659–667. 2012.
View Article : Google Scholar : PubMed/NCBI
|
|
48
|
Salehi M, Zargar A and Ramezani MA:
Effects of dextromethorphan on reducing methadone dosage in opium
addicts undergoing methadone maintenance therapy: A double blind
randomized clinical trial. J Res Med Sci. 16:1354–1360.
2011.PubMed/NCBI
|
|
49
|
Garzón J, Rodríguez-Muñoz M and
Sánchez-Blázquez P: Direct association of Mu-opioid and NMDA
glutamate receptors supports their cross-regulation: molecular
implications for opioid tolerance. Curr Drug Abuse Rev. 5:199–226.
2012. View Article : Google Scholar : PubMed/NCBI
|
|
50
|
Rao P, Yallapu MM, Sari Y, Fisher PB and
Kumar S: Designing novel nanoformulations targeting glutamate
transporter excitatory amino acid transporter 2: Implications in
treating drug addiction. J Pers Nanomed. 1:3–9. 2015.PubMed/NCBI
|
|
51
|
Krall AS and Christofk HR: Rethinking
glutamine addiction. Nat Cell Biol. 17:1515–1517. 2015. View Article : Google Scholar : PubMed/NCBI
|