Introduction
Idiopathic epiretinal membranes (ERMs) are macular
disorders frequently diagnosed in the elderly and have an incidence
of 2–20% (1). An ERM is a
semi-translucent, glial and fibrocellular proliferative membrane
(2). It usually develops on the
surface of the internal limiting membrane, particularly on the
macular surface, following partial or complete posterior vitreous
detachment. Idiopathic ERM formation is a primary disease, rather
than a disease secondary to trauma, inflammation, surgery,
photocoagulation or cryotherapy.
Contraction or shrinkage of proliferative membranes
may create irregular folds in the membrane itself, and exert
anteroposterior and/or tangential tractional forces on the retina
and retinal vasculature. The anteroposterior force produces
vertical traction and increases retinal thickness; the tangential
force drags the superficial retinal layers away from their original
position, causing deformation and displacement of the retina. ERMs
also alter the morphology, location and permeability of the retinal
vasculature. Morphological abnormalities include the straightening
and/or curling of retinal blood vessels and the irregularity and
shrinkage of the foveal avascular zone (FAZ). Several studies have
demonstrated that retinal vessels and the retina itself may become
displaced due to the tractional forces caused by the ERM (3,4).
Fundus fluorescein angiography (FFA) is one of the
optimal methods used to observe retinal vascular morphology and the
degree of vascular leakage. Due to the almost transparent nature of
the proliferative membrane, FFA allows clear observation of the
deformed retinal vasculature under the ERM and occasionally, the
straightening, displacement and contraction of the FAZ. Alterations
in macular structure, primarily in macular thickness and
vasculature, cause visual problems in patients with ERMs (4,5).
Although the effects of macular structural alteration on visual
function have been investigated using ocular coherence topography
(OCT), few studies have documented the effects of retinal
vasculature alteration (6–9). Furthermore, to the best of our
knowledge, there have been no studies discussing the potential
impact of retinal vascular changes on retinal structure and visual
function. Advancements in FFA technology may allow the reliable
measurement of vascular changes and facilitate future studies into
these issues. The present study therefore aimed to determine the
pathophysiological mechanisms underlying the formation and evolving
severity of ERMs. FFA measured the area of macular vascular
leakage, grade of retinal vascular distortion and contraction of
the FAZ. FFA imaging results were correlated with OCT measurements
and visual functions.
Patients and methods
Patients
Patients were recruited from outpatient clinics at
Beijing Tongren Hospital (Beijing, China). The inclusion criteria
included patients with a diagnosis of symptomatic idiopathic ERMs
in one eye using OCT and an ophthalmoscope. Patients were excluded
if they had secondary ERMs, ERMs with lamellar or full-thickness
macular holes, systemic or ocular conditions that may affect the
macular anatomy and the results of the FFA, including cystoid
macular edema, bleeding and fluorescein pooling.
A total of 40 adults with ERM were enrolled in the
current study and 80 eyes were studied between September 2013 and
March 2014 at Beijing Tongren Hospital. Informed consent was
obtained from all participants and the current study was approved
by the Ethics Committee at Beijing Tongren Hospital.
Measurements of visual acuity and
metamorphopsia
All recruited patients underwent a comprehensive
ophthalmic examination. Best-corrected visual acuity (BCVA) of the
affected eyes was measured at a distance of 4 m using the Early
Treatment Diabetic Retinopathy Study (ETDRS) eye chart (Precision
Vision, Woodstock, IL, USA) and quantified as the logarithmically
transformed score of the minimal angle of resolution (logMAR). The
ETDRS chart included logMAR labels for each letter size andscring
was performed by giving equal credit (0.02 logMAR units) for each
extra letter read correctly (10).
Metamorphopsia was determined using M-charts (Inami
& Co., Ltd., Tokyo, Japan), which consist of 19 dotted lines
with dot intervals of between 0.2 (fine) and 2.0 (coarse) visual
angles. If patients recognized one of the dotted lines as straight,
its visual angle between dots was considered to be their
metamorphopsia score (11). As dot
intervals were changed from fine to coarse, a decrease in the
severity of metamorphopsia was noted. The examination distance for
every patient was 30 cm with the best refractive correction. Each
patient underwent three tests with the vertical and horizontal
M-charts and the average of the three scores was recorded (12).
Measurements of retinal vascular
leakage, distortion and FAZ by FFA
FFAs were performed on all affected eyes using the
Heidelberg Retina Angiograph (Heidelberg Engineering, Ltd.,
Heidelberg, Germany), according to the manufacturer's protocol. A
blinded examiner analyzed the angiograms to determine the area of
retinal vascular leakage, as defined by hyper-fluorescence on the
angiogram visible 10 min after fluorescein injection. The examiner
also graded the distortion of macular vasculature and the
contraction of the FAZ during the venous phase.
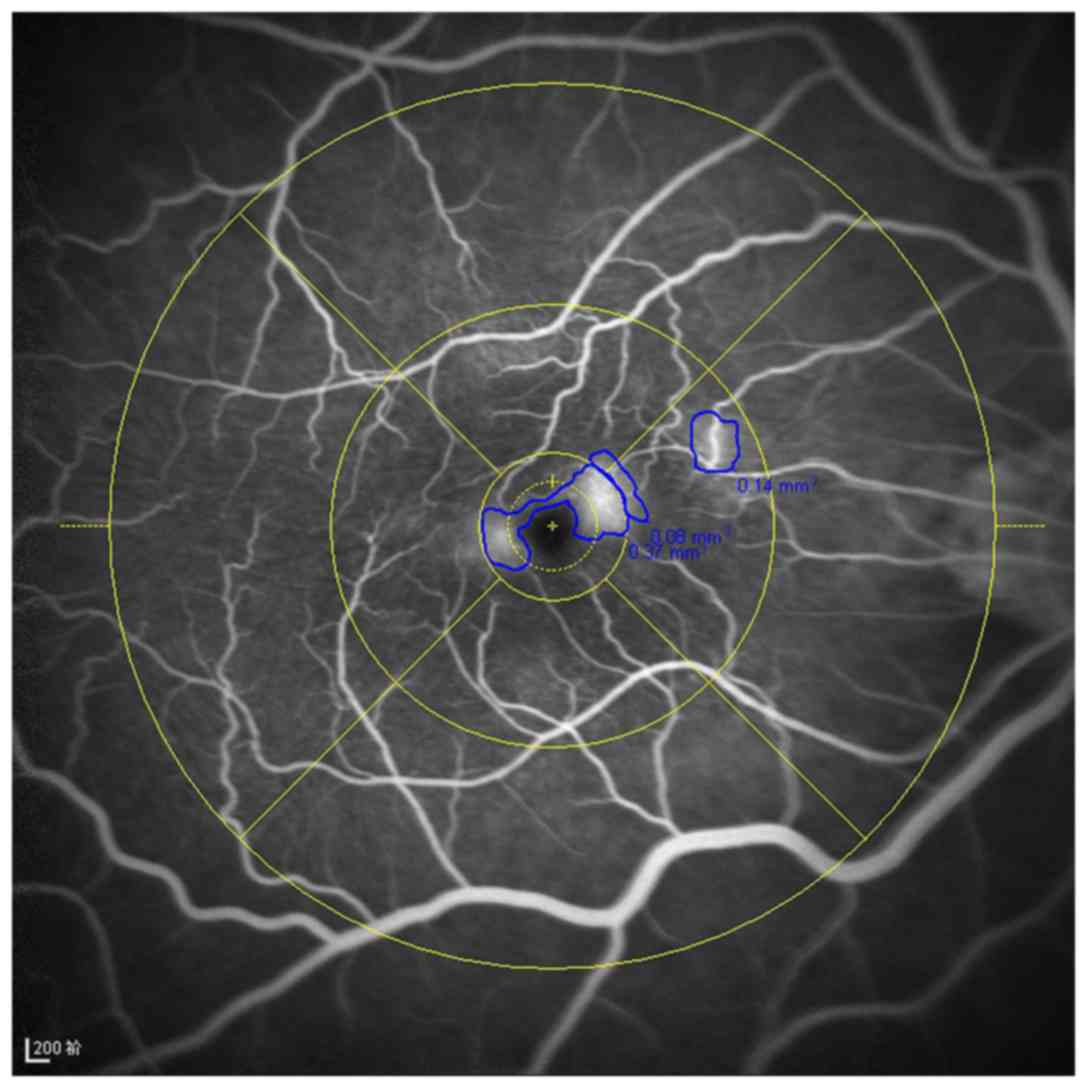
Leakages in the FFA images were quantified by
manually outlining the leakage area within the ETDRS grid
(diameter, 6 mm; Fig. 1), then
computing the total area of the leakage into the software built
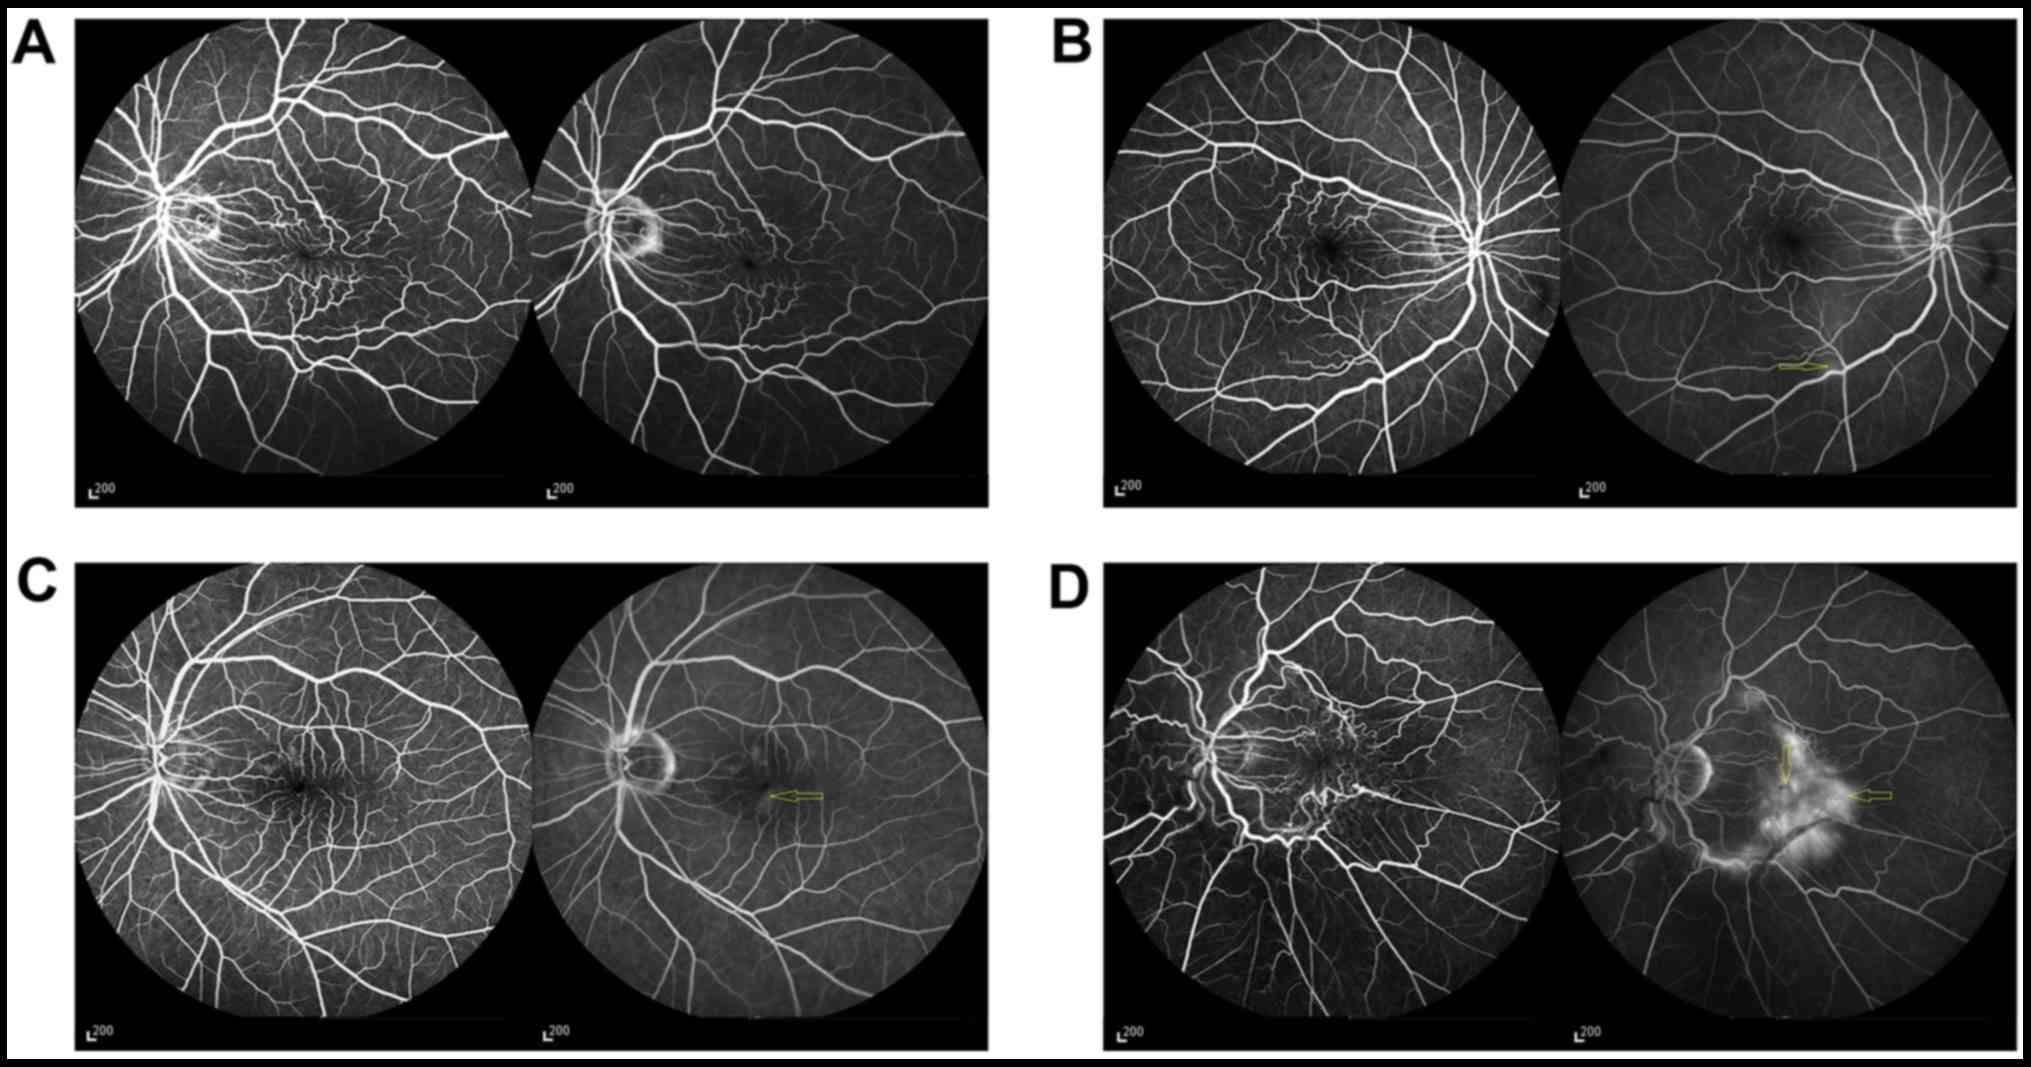
into the Heidelberg Retinal Angiograph. Macular leakage was graded
on a scale of 1–4 (1, no leakage; 2, vascular leakage outside the
central 1 mm area and no leakage inside it; 3, vascular leakage
within the central 1 mm area but no leakage outside of it; and 4,
vascular leakage inside and outside of the central 1 mm area),
based on the method described by Maguire et al (9) (Fig.
2).
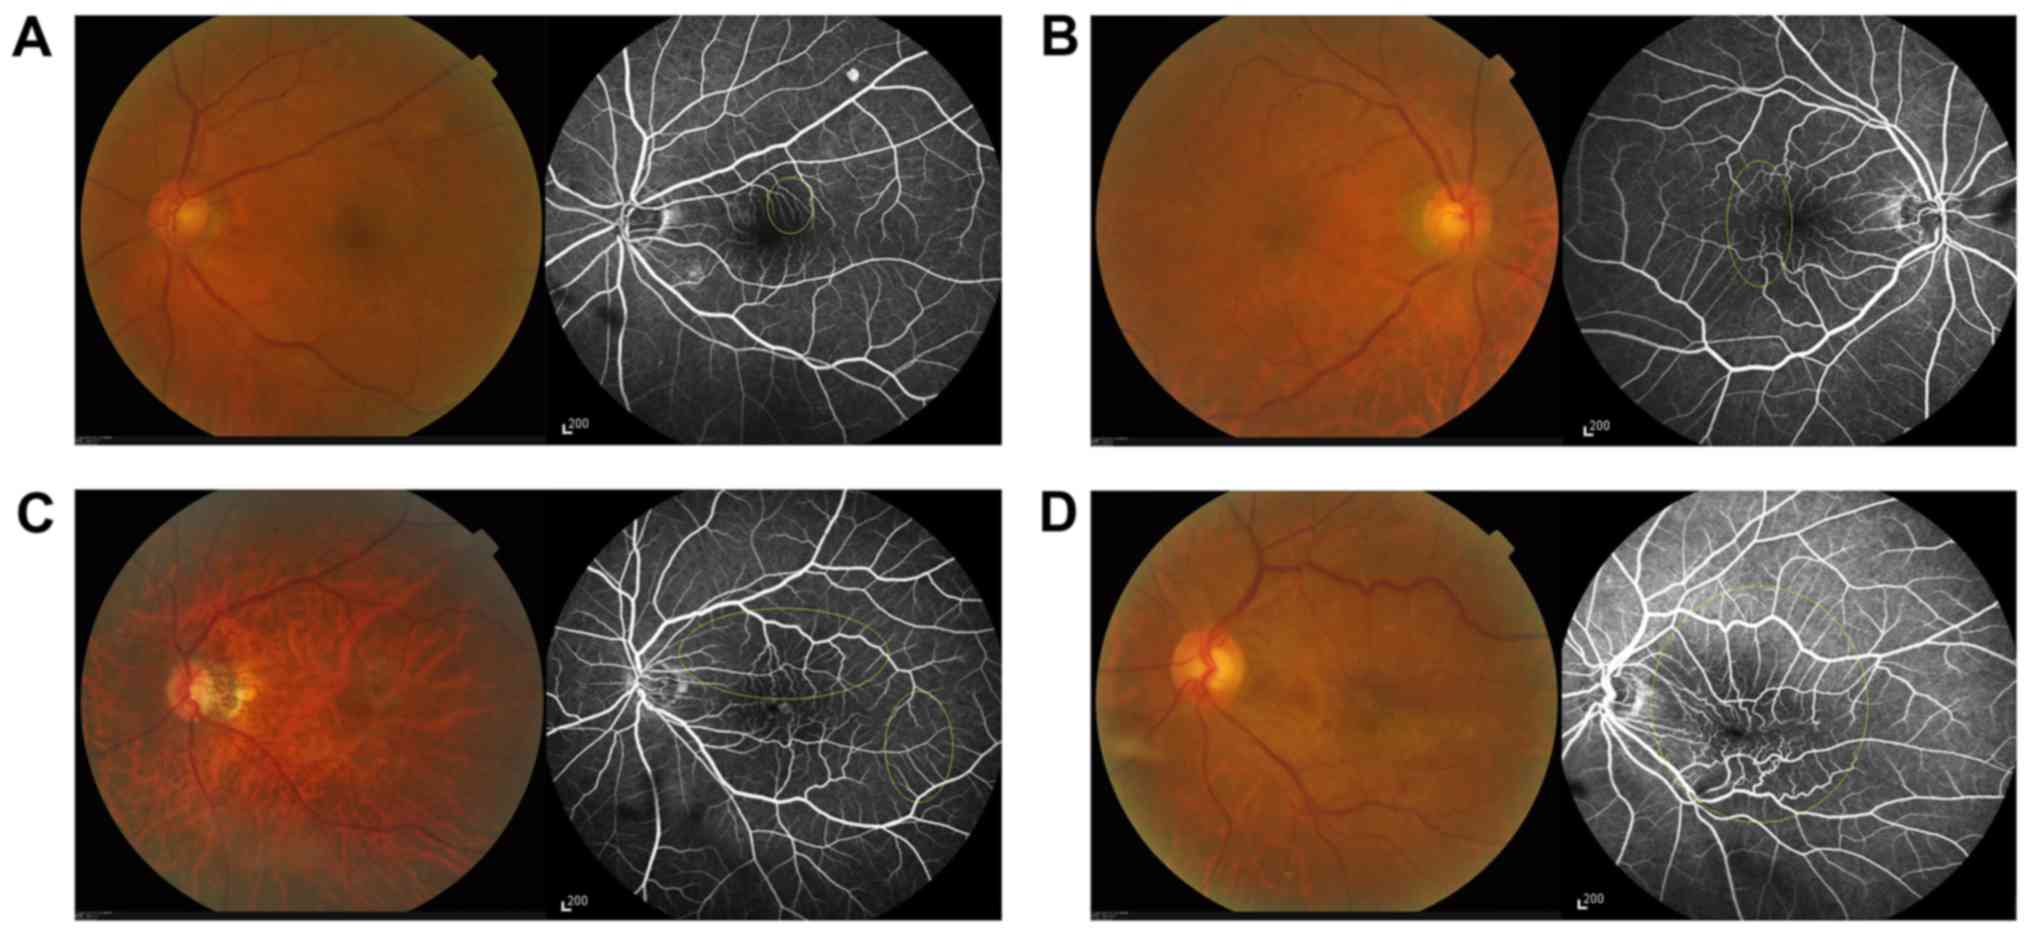
Retinal vascular distortion (Fig. 3) was graded on a scale of 0–4 based
on Maguire et al method (9);
0, no evidence of vascular straightening or distortion; 1,
straightening and/or distortion within one 90° quadrant relative to
the fovea; 2, straightening and/or distortion involving two
quadrants; 3, vascular straightening and/or distortion involving
three quadrants; and 4, straightening and/or distortion involving
all four quadrants). Straightening also included loss of normal
vascular tortuosity.
Minimum diameters of FAZ were measured on the
affected and fellow eyes by manually drawing the borderline of the
FAZ and measuring their diameters using a digital scale. To control
for individual variability in FAZ measurements, the ratio of the
FAZ in the ERM eye to the FAZ in the fellow eye was calculated. The
calculated ratio indicated the degree of contraction of the central
zone and the surrounding capillary network.
OCT measurements of macular thickness
and volume
Macular thickness and volume were measured using
Cirrus HD-October 5000 (Carl Zeiss AG, Oberkochen, Germany),
according to the manufacturer's protocol. The scanning pattern was
based on the fast macular map (resolution, 200×200), which measures
retinal thickness from the surface of the internal limiting
membrane to Bruch's membrane. Mean thickness of the macular areas
within the ETDRS grid were measured. The central macular thickness
(CMT) was defined as the thickness of the central zone (diameter, 1
mm). The inner ring was defined as the circular area surrounding
the CMT (width, 1 mm). The outer ring was defined as the circular
area surrounding the inner ring (width, 1.5 mm). Thickness readings
of the four quadrants for each ring were taken and the mean of
macular thickness was calculated for the inner and outer rings. The
total macular volume was measured and recorded by OCT. For all
clinical examinations, examiners were not told the results of the
angiogram analysis.
Statistical analysis
BCVA results are presented as logMAR scores. OCT
results are presented as the value of thickness and volume. FFA
results are presented as the value of leakage area and grading of
vascular image. Pearson's correlation analysis was used to
determine the association among the size of leakage area, the ratio
of FAZ diameters, and mean macular thickness and volume. Since
there were heterogeneous distributions for the grading of vascular
distortion (K-S test, z=8.6; P=0.035) and macular leakage (K-S
test, z=31.0; P=0.0001), the non-parametric Spearman correlation
was used to analyze the association between grading of vascular
distortion and other factors, including BCVA, M-chart scores, OCT
measurements and FFA findings. P<0.05 was considered to indicate
a statistically significant difference for two-tailed tests of
calculated correlational coefficients. All statistical analysis was
performed using SPSS V.24 (IBM Corp., Armonk, NY, USA).
Results
Symptomatic primary ERMs are more
likely to be severe and affect elderly patients
The mean age of the recruited patients was 62.3±8.2
years old (range, 33–78 years), demonstrating that it is primarily
the elderly population that is affected by ERMs (data not shown).
Of the 40 patients, 77.5% were female and 47.5% possessed an ERM in
their right eyes. The mean duration of symptoms was 12.4±13.3
months (range, 1–60 months).
The results of FFA demonstrated that vascular
distortion and leakage were severe (grade ≥3) in the majority of
patients (Table I). Table I also details the severity of the
measurements in the patients by grading the values. The results of
BCVA, M-chart and OCT were moderate in the majority of
patients.
 | Table I.Summary of visual function and imaging
results of patients. |
Table I.
Summary of visual function and imaging
results of patients.
| A, Distribution of
results of visual function |
|---|
|
|---|
| Visual function |
|
| Frequency |
| % |
|---|
| BCVA, logMAR score
(Snellen score, feet) |
|
|
|
|
|
|
logMAR≤0.3 (≤20/40) |
|
| 11 |
| 27.5 |
|
0.3<logMAR<0.7
(20/40-20/100) |
|
| 23 |
| 57.5 |
|
logMAR≥0.7 (≥20/100) |
|
| 6 |
| 15 |
| M-chart total
scores |
|
|
|
|
|
|
0≤score≤1.0 |
|
| 14 |
| 35 |
|
1.1≤score≤3.0 |
|
| 19 |
| 47.5 |
|
3.1≤score≤4.4 |
|
| 7 |
| 17.5 |
|
| B, Distribution of
OCT measurements |
|
| OCT
measurements |
|
| Frequency |
| % |
|
| CMT, µm |
|
|
|
|
|
|
CMT≤400 |
|
| 5 |
| 12.5 |
|
400<CMT<600 |
|
| 31 |
| 77.5 |
|
CMT≥600 |
|
| 4 |
| 10 |
| MV,
mm3 |
|
|
|
|
|
|
MV≤11 |
|
| 6 |
| 15 |
|
11<MV<14 |
|
| 27 |
| 67.5 |
|
MV≥14 |
|
| 7 |
| 17.5 |
|
| C, Quantified
outcomes of FFA |
|
| FFA
outcomes |
| Mean | SD |
| Range |
|
| Area of leakage,
mm2 |
| 5.61 | 8.90 |
| 0–44.85 |
| FAZ ratio |
| 0.42 | 0.20 |
| 0.14–0.94 |
|
| D, Grading
results of vascular image |
|
|
| Subjective
grading |
|
|
|
| Vascular image
grade | 0 | 1 | 2 | 3 | 4 |
|
| Distortion, % | 0 | 10 | 17.5 | 35 | 37.5 |
| Leakage, % | – | 12.5 | 7.5 | 27.5 | 52.5 |
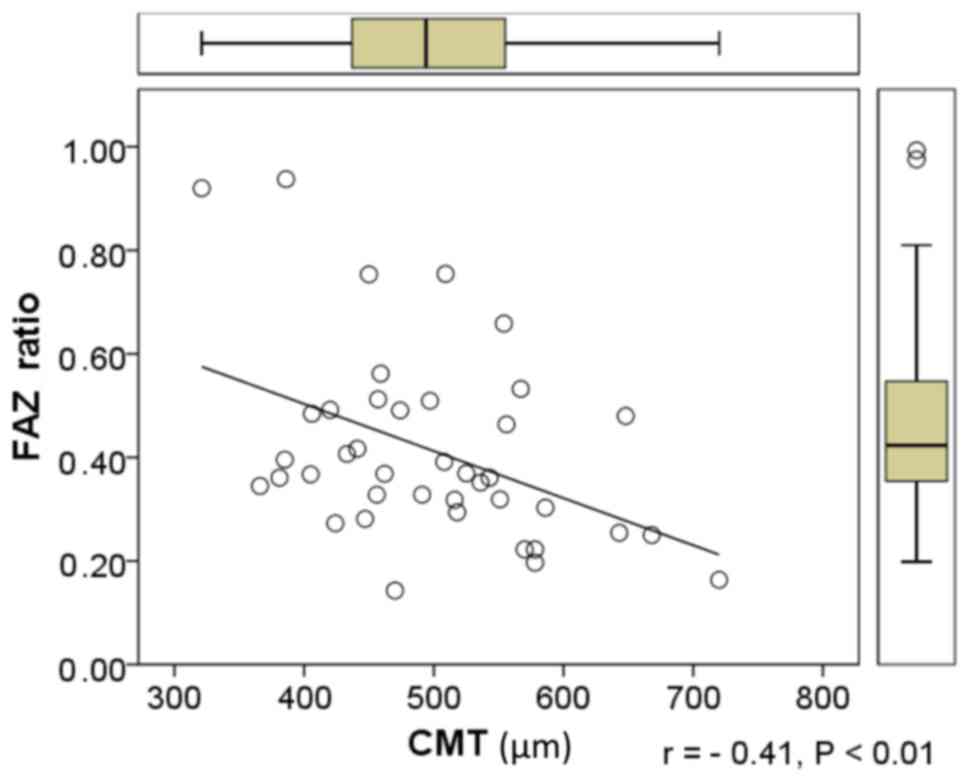
Vascular leakage and distortion
increase with macular thickness and volume, whereas the FAZ ratio
decreases as the CMT increases
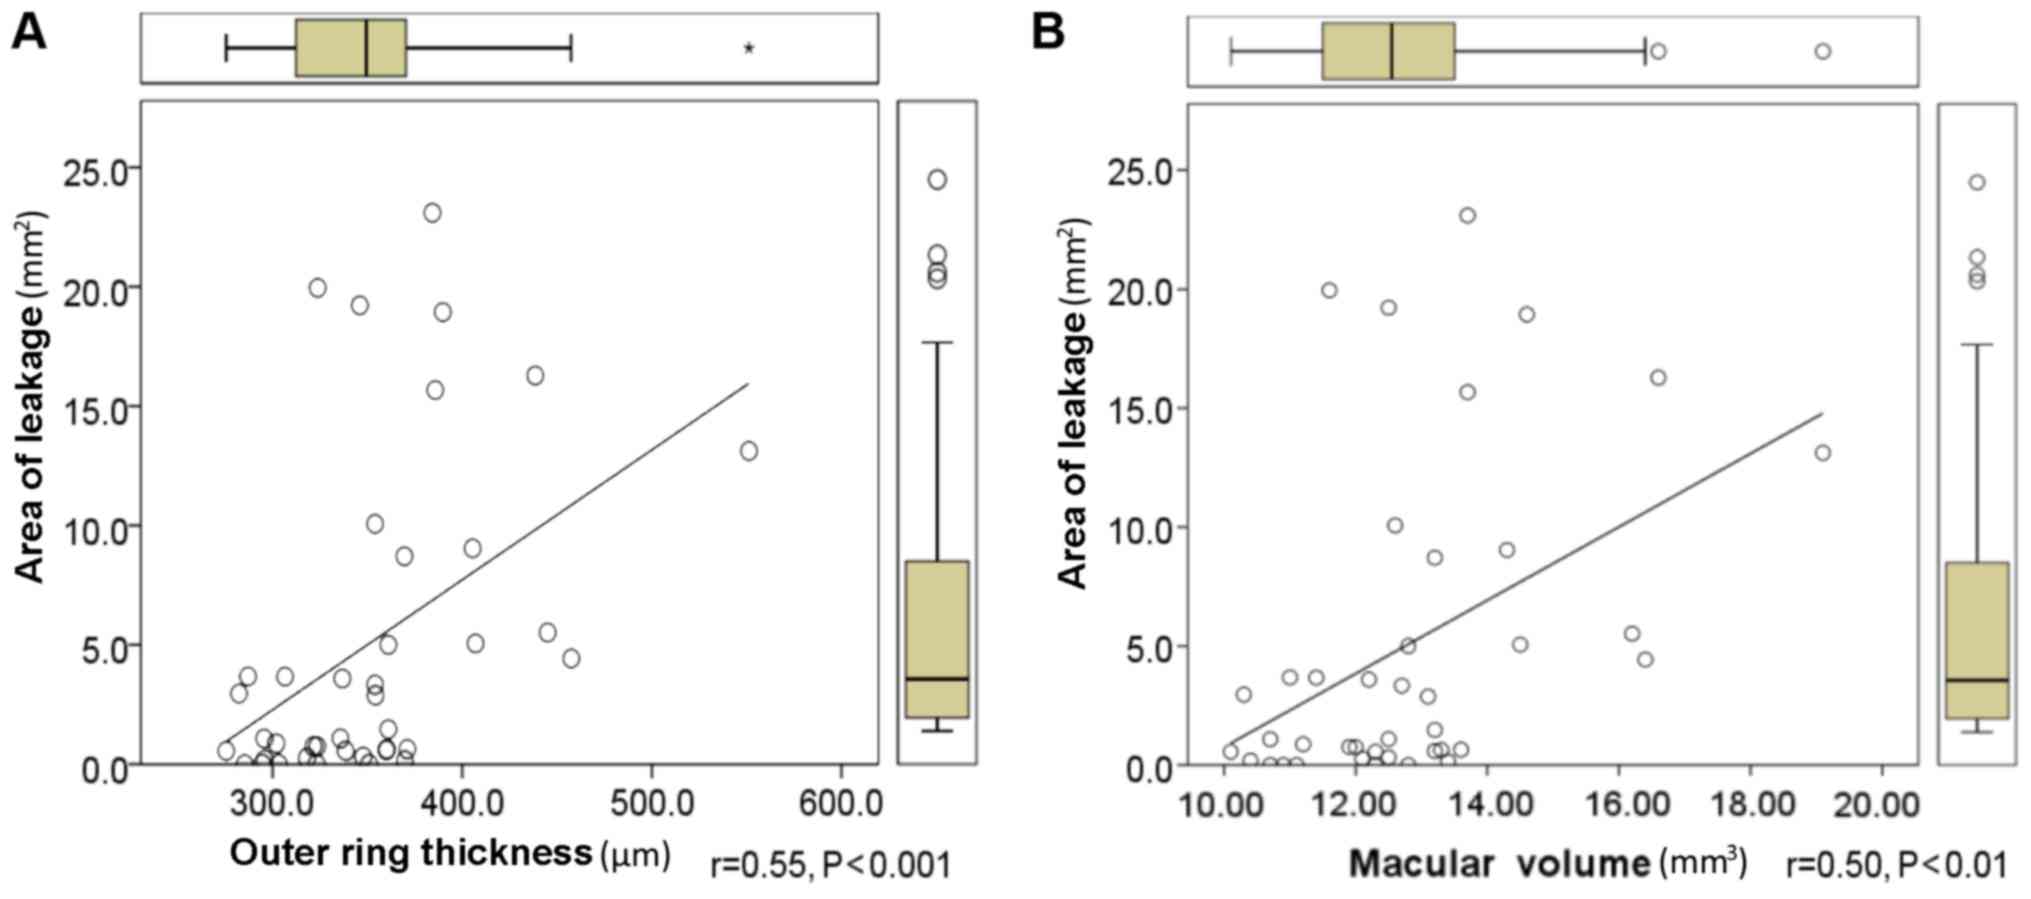
Table II presents
the association between OCT and FFA measurements. The macular
leakage area was positively correlated with the thickness of the
outer ring in the ETDRS grid (Fig.
4A) and the macular volume obtained with OCT (Fig. 4B). No correlation was identified
among the macular leakage area and CMT or inner ring thickness.
However, a negative correlation between the ratio of FAZ diameters
and CMT was identified (Fig. 5).
| Table II.Associations between OCT and FFA
measurements. |
Table II.
Associations between OCT and FFA
measurements.
|
| Thickness |
|
|---|
|
|
|
|
|---|
|
| Central zone | Inner ring | Outer ring | Macular volume |
|---|
| Area of
leakage | 0.26 | 0.30 | 0.55c | 0.50b |
| FAZ ratio | −0.41b | −0.30 | −0.12 | −0.16 |
| Vascular
distortion | 0.62c | 0.59c | 0.47b | 0.53c |
| Vascular
leakage | 0.29 | 0.32a | 0.50b | 0.45b |
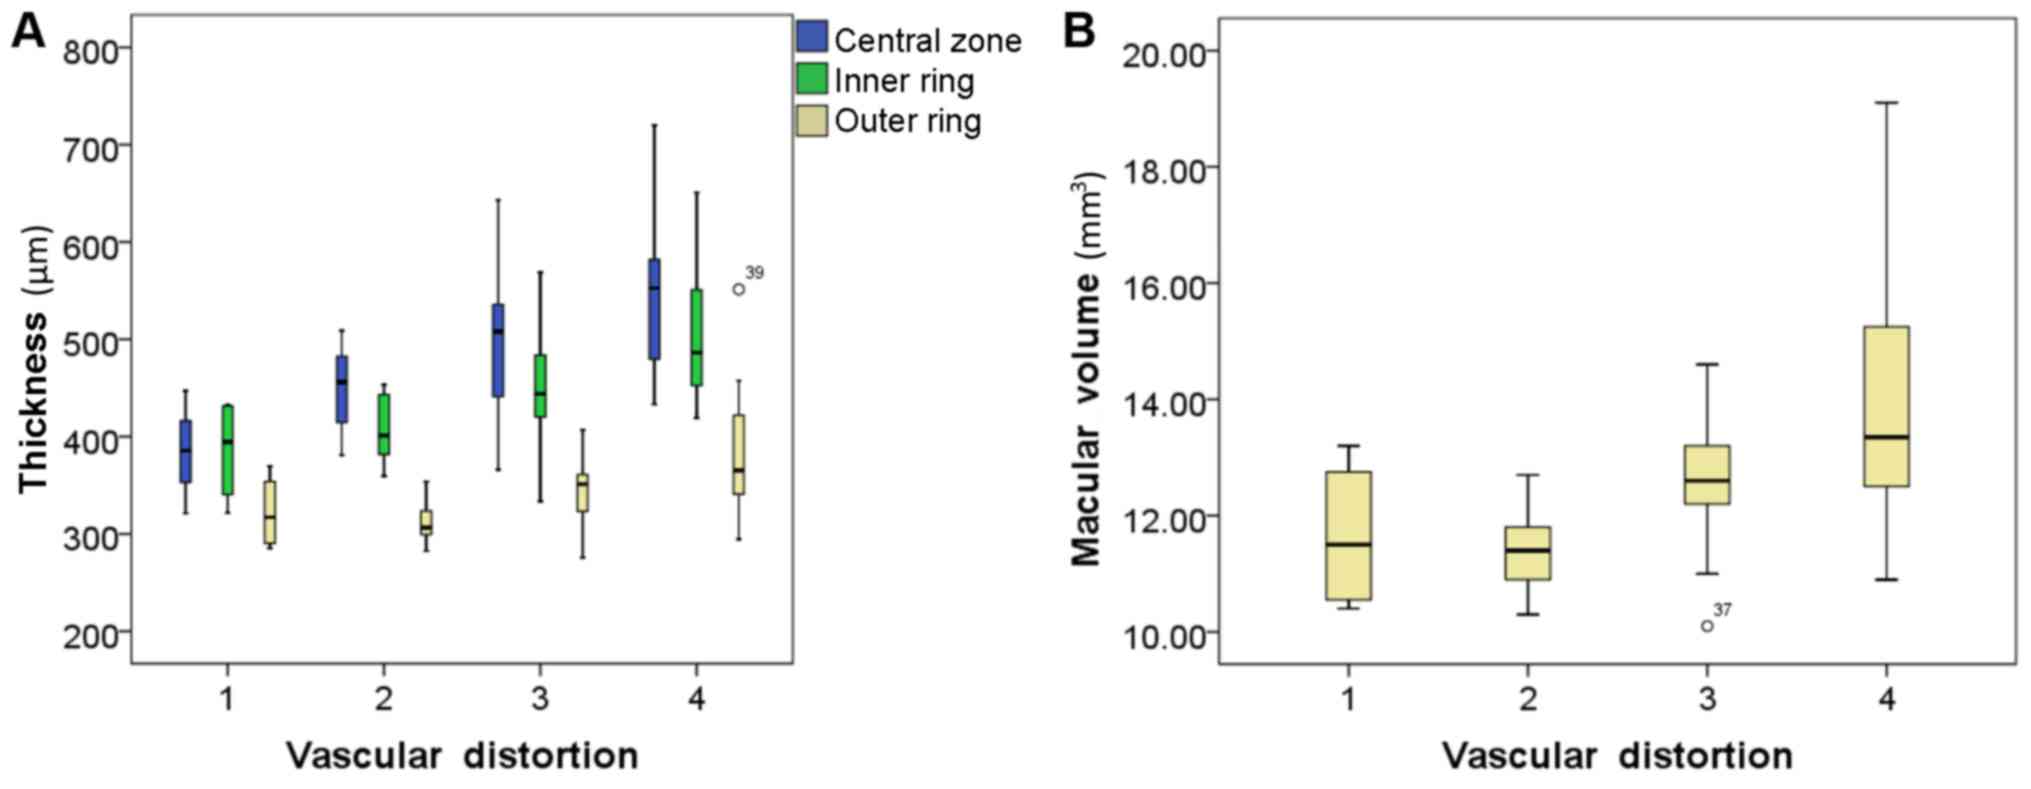
Table II also
identified positive correlations among the grade of vascular
distortion, and the thickness of the macular sections (the central
zone, inner ring and outer ring; Fig.
6A) and the macular volume (Fig.
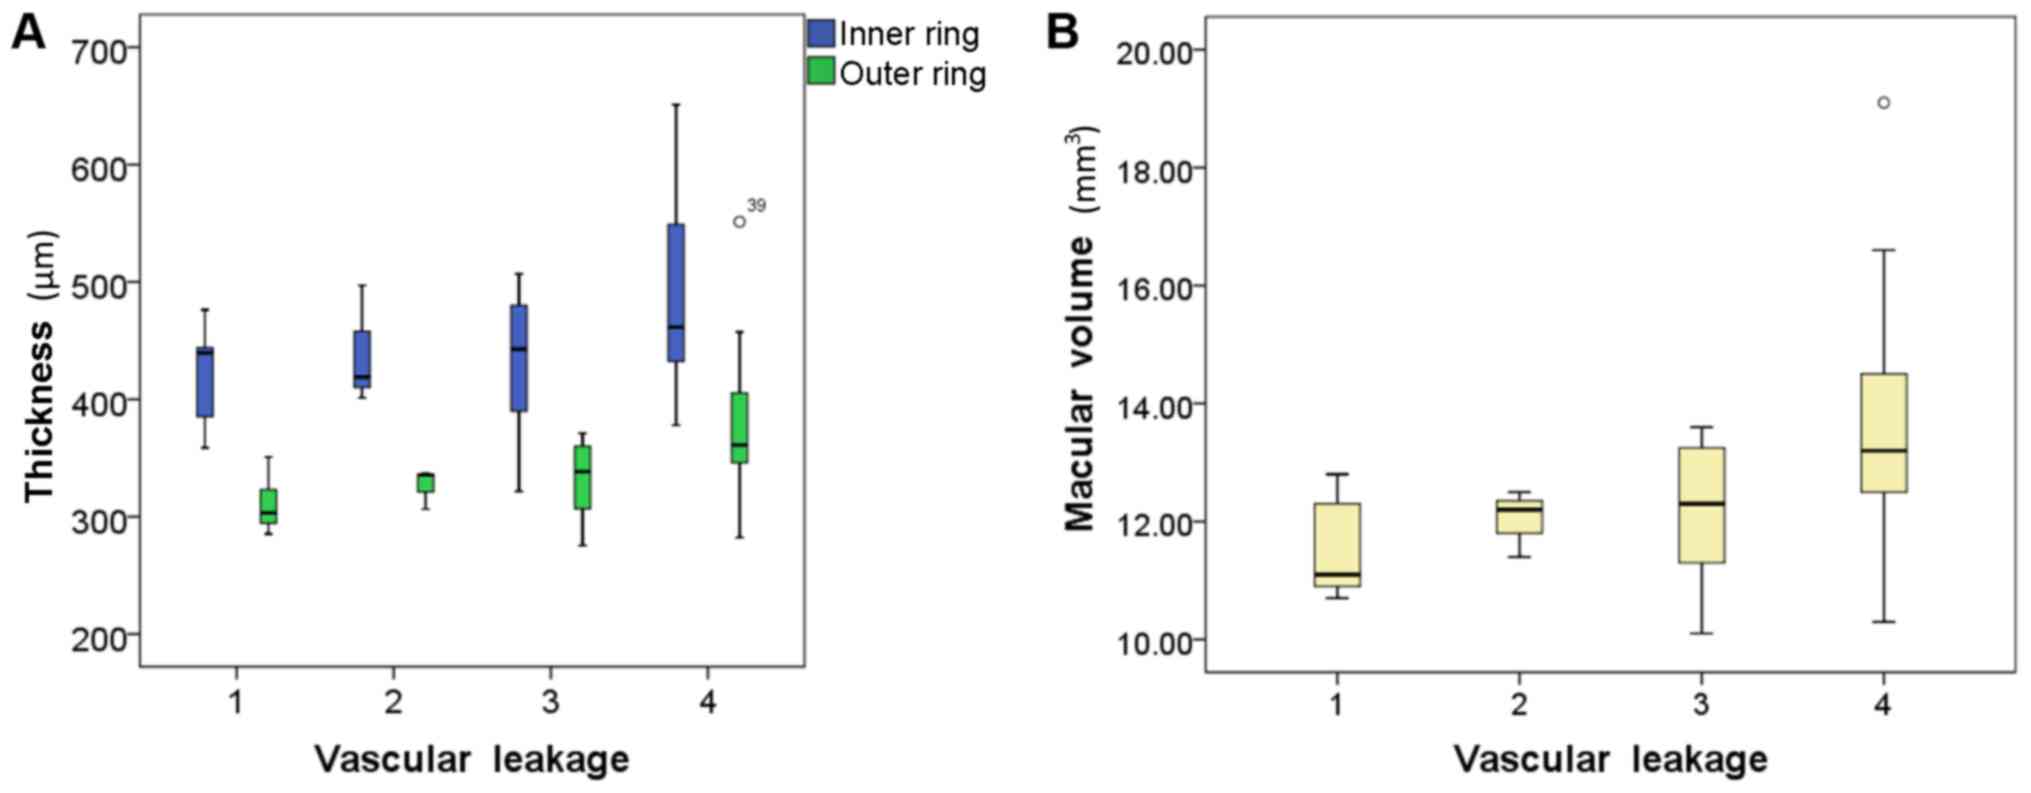
6B). Positive correlations were also identified among the grade
of macular leakage, and the macular volume (Fig. 7A) and thicknesses of the inner and
outer rings (Fig. 7B), but not the
CMT.
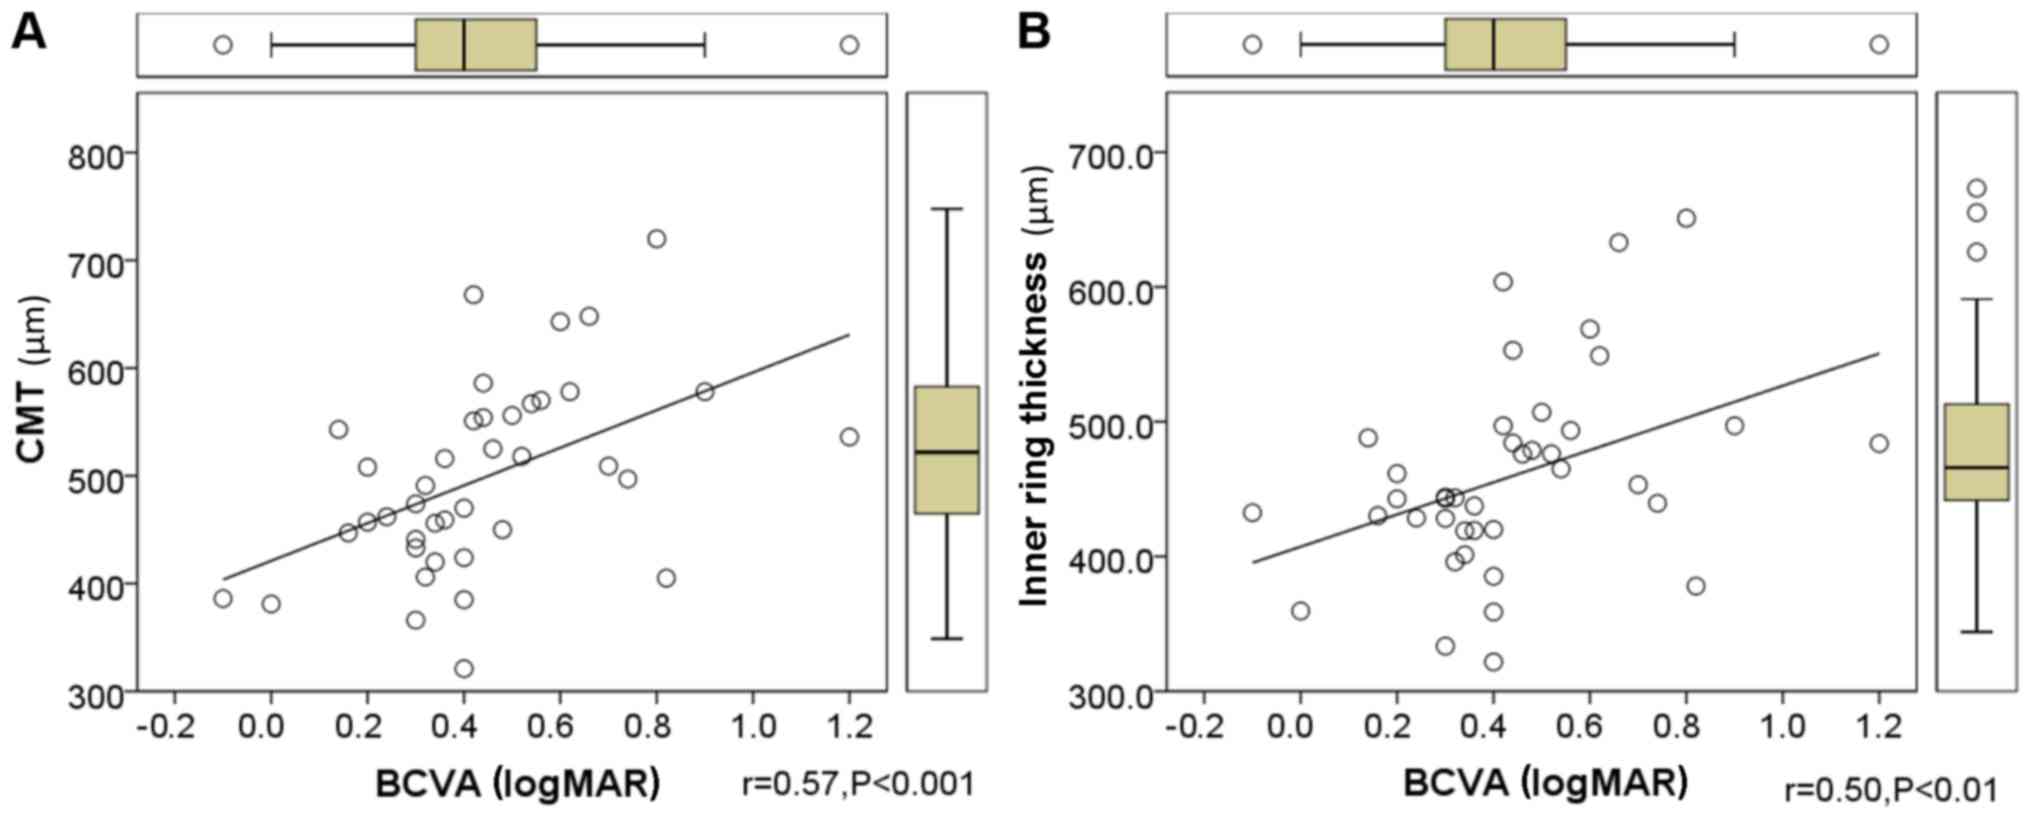
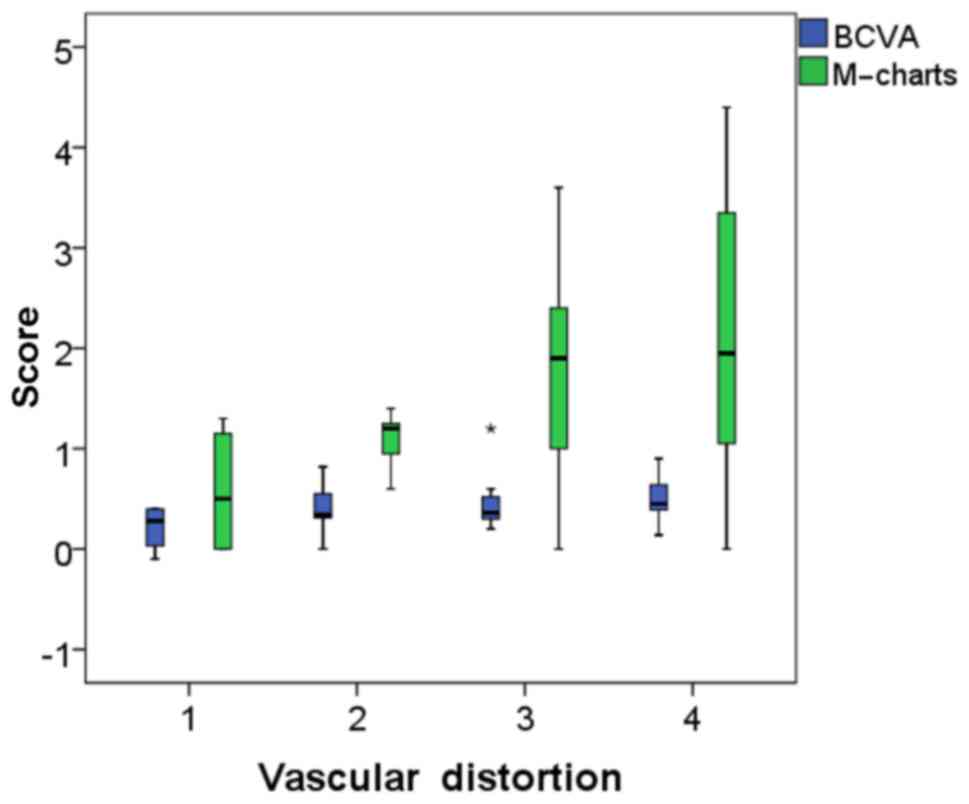
Vascular distortions positively
correlate with worsening metamorphopsia and visual acuity, which
also worsens with centralized thickening of the macula
The correlations between visual functions (BCVA,
M-charts score and symptom duration) and OCT/FFA outcomes were
analyzed by Spearman's correlation. Table III demonstrated that positive
correlations were identified among BCVA and the CMT (Fig. 8A), the thickness of inner ring
(Fig. 8B) and the grade of vascular
distortion. A positive correlation was identified between the total
M-chart score and the grade of vascular distortion (Fig. 9). However, no correlation was
identified between symptom duration and imaging results (Table III). In addition, no correlation
was identified between vascular distortion and leakage (data not
shown).
| Table III.Associations between imaging
techniques and visual functions. |
Table III.
Associations between imaging
techniques and visual functions.
|
| OCT |
|
|
|
|---|
|
|
|
|
|
|
|---|
|
| Thickness |
| FFA |
|---|
|
|
|
|
|
|---|
|
| Central zone | Inner circle | Outer circle | Macular volume | Area of
leakage | FAZ ratio | Vascular
distortion |
|---|
|
|
| BCVA | 0.57c | 0.50b | 0.14 | 0.24 | 0.09 | −0.21 | 0.33a |
| M-chart | 0.30 | 0.30 | 0.11 | 0.15 | −0.06 | 0.03 | 0.42b |
| Symptom
duration | −0.06 | −0.12 | −0.22 | −0.21 | −0.12 | −0.17 | −0.21 |
Discussions
The present study analyzed changes in the retinal
vasculature of patients with ERM and identified a clear correlation
between the degree of certain vascular changes based on FFA results
and the thickening of the macular retina based on OCT measurements.
Specifically, the area and degree of macular leakage was positively
correlated with the thickness of the outer ring and the macular
volume. In addition, the thickening of the inner and outer rings
was positively correlated with the degree of vascular leakage and
distortion. It was indicated that the thickness of the central zone
was affected by factors other than increased vascular leakage. To
the best of our knowledge, the present study is the first known
attempt to investigate the vascular changes of the macula using FFA
and determine whether these changes were correlated with
alterations in visual functions.
Tractional forces caused by the ERM consist of the
anteroposterior force, which thickens the fovea by shifting it
towards the center of the vitreous and the tangential force, which
thickens the fovea by shifting the peripheral retinal tissue
towards the center of the macula. The present study identified a
negative correlation between the CMT and the ratio of FAZ
diameters. A smaller ratio of FAZ diameters may have reflected a
greater tangential contraction towards the fovea in the affected
eye compared with the fellow eye. The tangential traction force may
have caused thickening of the central zone. However, no significant
correlation was identified among the ratio of FAZ diameters and the
thickness of the inner and outer rings or total macular volume,
suggesting that tangential traction primarily affects the CMT.
Tangential traction causes thickening of the fovea
and shrinking of the macula, contributing to retinal vascular
distortion, which reflects the degree of the twisting and/or
straightening of the retinal vessels. Retinal vascular distortion
was graded using a semi-quantitative system that does not take into
account the distance from the fovea and the severity of vascular
distortion. The vascular distortion grade was positively correlated
with the thickness of the central zone, inner and outer rings, and
macular volume. This suggests that the tangential force from the
ERM increases macular thickness and distorts retinal
vasculature.
Anteroposterior and tangential forces on the retina
may alter vascular permeability (11), and consequently contribute to an
increase in macular volume. In the present study, the increase in
macular volume in patients with ERM was positively correlated with
the extent of macular leakage. The contribution of increased
vascular permeability to the CMT was not deemed to be significant,
suggesting that vascular leakage has a limited effect on the
central zone compared with the forces of traction caused by
proliferative membrane contraction. A possible explanation for this
is that the leakage of the retinal vasculature is affected by
factors other than vascular distortion, including inflammation and
the proliferative membrane itself (13). Visual acuity was determined as BCVA
in the present study and was positively correlated with the
thickness of the central zone and inner ring. However, no
correlations were identified among BCVA and outer ring thickness
and macular volume. These results were consistent with those of
previous studies (14–19). Additionally, the BCVA results were
positively correlated with the grade of vascular distortion. The
results of the present study were in accordance with those of a
previous study by Gass (20), which
stated that the loss of BCVA in eyes with ERMs was associated with
distortion of the retina. It is important to note that visual
acuity and metamorphopsia are subjective perceptual measurements,
which may be affected by a number of factors in addition to the
variables measured in the current study (21–23).
The results of FFA in the present study revealed
that the degree of metamorphopsia was correlated with the grade of
vascular distortion. These results are consistent with the results
of a study by Arimura et al (24), which demonstrated that metamorphopsia
scores measured by the M-charts were positively correlated with
retinal contraction due to ERMs. However, it is important to note
that vascular distortion is just one factor affecting the degree of
metamorphopsia. Other contributing factors, including the disorder
of arrangement and edema of inner nuclear layer (25,26),
were not investigated in the present study.
OCT measures the exact retinal thickness in
different macular regions and the whole macular volume. In the
present study, a positive correlation between CMT, inner ring
macular thickness and BCVA was determined, indicating that a
thicker centralized area worsens visual acuity. These results are
in accordance with those of previous studies (17,19).
However, there was no correlation between the OCT results and the
severity of metamorphopsia. OCT does not directly identify the
vascular changes that occur as a result of ERMs, including vascular
leakage and distortion.
FFA is a commonly used tool in retinal vascular
disease and macular edema diagnosis, as it identifies the severity
of vascular leakage and distortion. In the present study, the
association between the semi-quantitative variables of macular
vascular changes and visual functions were analyzed. The grading of
vascular distortion was positively correlated with BCVA logMAR and
M-chart scores, demonstrating that changes to the macular
vasculature are important in visual functions, particularly in
metamorphopsia. This feature of FFA compensates for the limitations
of OCT. The combination of OCT and FFA may be important as it may
improve understanding of the pathophysiology and evaluation of
visual functions in patients with ERM.
In conclusion, FFA may be an effective method of
examining the vascular changes that occur in patients with ERMs.
The identification of the correlation between FFA findings, OCT
measurements and visual functions may improve understanding of the
pathophysiological mechanisms underlying ERM development. FFA may
be used to investigate the factors affecting the anatomical and
functional prognosis of patients with ERM and estimate the severity
of ERM development. FFA may also be adopted to determine the
indication and timing of ERM surgery for the best prognosis, by
comparing the severity of change in affected eyes prior to and
following surgery.
References
|
1
|
Pearlstone AD: The incidence of idiopathic
preretinal macular gliosis. Ann Ophthalmol. 17:378–380.
1985.PubMed/NCBI
|
|
2
|
Michels RG: A clinical and histopathologic
study of epiretinal membranes affecting the macula and removed by
vitreous surgery. Trans Am Ophthalmol Soc. 80:580–656.
1982.PubMed/NCBI
|
|
3
|
Schmitz-Valckenberg S, Holz FG, Bird AC
and Spaide RF: Fundus autofluorescence imaging: Review and
perspectives. Retina. 28:385–409. 2008. View Article : Google Scholar : PubMed/NCBI
|
|
4
|
Dell'omo R, Cifariello F, Dell'omo E, De
Lena A, Di Iorio R, Filippelli M and Costagliola C: Influence of
retinal vessel printings on metamorphopsia and retinal
architectural abnormalities in eyes with idiopathic macular
epiretinal membrane. Invest Ophthalmol Vis Sci. 54:7803–7811. 2013.
View Article : Google Scholar : PubMed/NCBI
|
|
5
|
Niwa T, Terasaki H, Kondo M, Piao CH,
Suzuki T and Miyake Y: Function and morphology of macula before and
after removal of idiopathic epiretinal membrane. Invest Ophthalmol
Vis Sci. 44:1652–1656. 2003. View Article : Google Scholar : PubMed/NCBI
|
|
6
|
Weinberger D, Stiebel-Kalish H, Priel E,
Barash D, Axer-Siegel R and Yassur Y: Digital red-free photography
for the evaluation of retinal blood vessel displacement in
epiretinal membrane. Ophthalmology. 106:1380–1383. 1999. View Article : Google Scholar : PubMed/NCBI
|
|
7
|
Klein BR, Hiner CJ, Glaser BM, Murphy RP,
Sjaarda RN and Thompson JT: Fundus photographic and fluorescein
angiographic characteristics of pseudoholes of the macula in eyes
with epiretinal membranes. Ophthalmology. 102:768–774. 1995.
View Article : Google Scholar : PubMed/NCBI
|
|
8
|
Kadonosono K, Itoh N, Nomura E and Ohno S:
Capillary blood flow velocity in patients with idiopathic
epiretinal membranes. Retina. 19:536–539. 1999. View Article : Google Scholar : PubMed/NCBI
|
|
9
|
Maguire AM, Margherio RR and Dmuchowski C:
Preoperative fluorescein angiographic features of surgically
removed idiopathic epiretinal membranes. Retina. 14:411–416. 1994.
View Article : Google Scholar : PubMed/NCBI
|
|
10
|
Bailey IL and Lovie-Kitchin JE: Vision
acuity testing. From the laboratory to the clinic. Vision Res.
90:2–9. 2013. View Article : Google Scholar : PubMed/NCBI
|
|
11
|
Matsumoto C, Arimura E, Okuyama S, Takada
S, Hashimoto S and Shimomura Y: Quantification of metamorphopsia in
patients with epiretinal membranes. Invest Ophthalmol Vis Sci.
44:4012–4016. 2003. View Article : Google Scholar : PubMed/NCBI
|
|
12
|
Arimura E, Matsumoto C, Nomoto H,
Hashimoto S, Takada S, Okuyama S and Shimomura Y: Correlations
between M-CHARTS and PHP findings and subjective perception of
metamorphopsia in patients with macular diseases. Invest Ophthalmol
Vis Sci. 52:128–135. 2011. View Article : Google Scholar : PubMed/NCBI
|
|
13
|
Zhao F, Gandorfer A, Haritoglou C, Scheler
R, Schaumberger MM, Kampik A and Schumann RG: Epiretinal cell
proliferation in macular pucker and vitreomacular traction
syndrome: Analysis of flat-mounted internal limiting membrane
specimens. Retina. 33:77–88. 2013. View Article : Google Scholar : PubMed/NCBI
|
|
14
|
Wilkins JR, Puliafito CA, Hee MR, Duker
JS, Reichel E, Coker JG, Schuman JS, Swanson EA and Fujimoto JG:
Characterization of epiretinal membranes using optical coherence
tomography. Ophthalmology. 103:2142–2151. 1996. View Article : Google Scholar : PubMed/NCBI
|
|
15
|
Massin P, Allouch C, Haouchine B, Metge F,
Paques M, Tangui L, Erginay A and Gaudric A: Optical coherence
tomography of idiopathic macular epiretinal membranes before and
after surgery. Am J Ophthalmol. 130:732–739. 2000. View Article : Google Scholar : PubMed/NCBI
|
|
16
|
Arichika S, Hangai M and Yoshimura N:
Correlation between thickening of the inner and outer retina and
visual acuity in patients with epiretinal membrane. Retina.
30:503–508. 2010. View Article : Google Scholar : PubMed/NCBI
|
|
17
|
Michalewski J, Michalewska Z, Cisiecki S
and Nawrocki J: Morphologically functional correlations of macular
pathology connected with epiretinal membrane formation in spectral
optical coherence tomography (SOCT). Graefes Arch Clin Exp
Ophthalmol. 245:1623–1631. 2007. View Article : Google Scholar : PubMed/NCBI
|
|
18
|
Theodossiadis PG, Grigoropoulos VG,
Kyriaki T, Emfietzoglou J, Vergados J, Nikolaidis P and
Theodossiadis GP: Evolution of idiopathic epiretinal membrane
studied by optical coherence tomography. Eur J Ophthalmol.
18:980–988. 2008.PubMed/NCBI
|
|
19
|
Pilli S, Lim P, Zawadzki RJ, Choi SS,
Werner JS and Park SS: Fourier-domain optical coherence tomography
of eyes with idiopathic epiretinal membrane: Correlation between
macular morphology and visual function. Eye (Lond). 25:775–783.
2011. View Article : Google Scholar : PubMed/NCBI
|
|
20
|
Gass JDM: Stereoscopic Atlas Of Macular
Diseases: Diagnosis And Treatment. 3rd edition. CV Mosby, St.
Louis, MO: 1997
|
|
21
|
Falkner-Radler CI, Glittenberg C, Hagen S,
Benesch T and Binder S: Spectral-domain optical coherence
tomography for monitoring epiretinal membrane surgery.
Ophthalmology. 117:798–805. 2010. View Article : Google Scholar : PubMed/NCBI
|
|
22
|
Inoue M, Morita S, Watanabe Y, Kaneko T,
Yamane S, Kobayashi S, Arakawa A and Kadonosono K: Inner
segment/outer segment junction assessed by spectral-domain optical
coherence tomography in patients with idiopathic epiretinal
membrane. Am J Ophthalmol. 150:834–839. 2010. View Article : Google Scholar : PubMed/NCBI
|
|
23
|
Shiono A, Kogo J, Klose G, Takeda H, Ueno
H, Tokuda N, Inoue J, Matsuzawa A, Kayama N, Ueno S and Takagi H:
Photoreceptor outer segment length: A prognostic factor for
idiopathic epiretinal membrane surgery. Ophthalmology. 120:788–794.
2013. View Article : Google Scholar : PubMed/NCBI
|
|
24
|
Arimura E, Matsumoto C, Okuyama S, Takada
S, Hashimoto S and Shimomura Y: Retinal contraction and
metamorphopsia scores in eyes with idiopathic epiretinal membrane.
Invest Ophthalmol Vis Sci. 46:2961–2966. 2005. View Article : Google Scholar : PubMed/NCBI
|
|
25
|
Okamoto F, Sugiura Y, Okamoto Y, Hiraoka T
and Oshika T: Associations between metamorphopsia and foveal
microstructure in patients with epiretinal membrane. Invest
Ophthalmol Vis Sci. 53:6770–6775. 2012. View Article : Google Scholar : PubMed/NCBI
|
|
26
|
Watanabe A, Arimoto S and Nishi O:
Correlation between metamorphopsia and epiretinal membrane optical
coherence tomography findings. Ophthalmology. 116:1788–1793. 2009.
View Article : Google Scholar : PubMed/NCBI
|