Introduction
Non-alcoholic fatty liver diseases (NAFLD) encompass
a spectrum of liver abnormalities, ranging from simple steatosis to
steatohepatitis (non-alcoholic steatohepatitis; NASH) and fibrosis
that may progress to cirrhosis and possibly hepatocarcinoma. NAFLD
is often associated with insulin resistance, obesity, diabetes
mellitus, hyperlipidemia, visceral adiposity and other
cardiometabolic alterations (1).
During the pathogenesis of NAFLD, a crosstalk occurs
between the liver and peripheral tissues such as the adipose
tissue, skeletal muscle, and pancreas (2). Adipose tissue plays a pivotal role in
the pathogenesis of NAFLD and the progression to steatohepatitis
(3).
Day and James suggested the ‘two-hit-theory’ to
provide a pathophysiological rationale to the progression of liver
damage associated with NAFLD (4).
The ‘first hit’ is excessive hepatocytes triglyceride (TGs)
accumulation which may result from insulin resistance (IR)
(5). The presumed factors initiating
second hits are suggested to be oxidative stress and subsequent
lipid peroxidation, pro-inflammatory cytokines [principally tumor
necrosis factor (TNF)-α], and dysregulation of adipocytokines
derived from adipose (6).
Hepatocytes accumulation of reactive oxygen species
(ROS); oxidative stress, could be responsible for further
progression from steatosis to steatohepatitis and fibrosis.
ROS-triggered lipid peroxidation of serum or mitochondrial
membranes causes cell necrosis or induces apoptosis (7). The glutathione (GSH) system is the main
cell redox regulator which represents the single largest source of
reducing equivalents in the cell and accounts for approximately 90%
of all cellular reducing equivalents. Therefore, the depletion of
GSH could significantly affect the overall redox potential of the
cell (8).
Nuclear erythroid factor 2 like 2 (Nrf2) is the
master regulator of the antioxidant response to oxidative stresses.
Nrf2 binds to its Antioxidant Response Element sequences (ARE;
5′-NTGAG/CNNNGC-3′) in its targets genes (9), thereby activating their transcription.
Nrf2 activation represses the expression of the enzymes involved in
fatty acids biosynthesis and uptake (10). It was documented that deletion of
Nrf2 gene result in the accelerated induction of NAFLD and its
progression to steatohepatitis (11)
while Nrf2 activation attenuates the progression of NAFLD (12).
Despite an increasing understanding of the
mechanisms of NAFLD pathogenesis, there are no drugs approved for
it. Current treatments are directed towards improving the metabolic
parameters which contribute to disease pathogenesis, such as weight
loss and exercise, reducing IR and improving diabetic control.
Therapy currently undergoing evaluation is the
honeybee (Apis mellifera) venom. Bee venom (BV) is known to
be a very complex mixture of active peptides that includes
melittin, phospholipase A2, apamin, adolapin and mast
cell-degranulating peptide (13).
Experimental studies on the biological activities of BV showed its
anti-inflammatory and anticancer effects (14).
To our knowledge, there is no experimental or
clinical data about the use of BV for the treatment of NAFLD. So,
the present study is designed to evaluate the effect of BV
treatment of NAFLD and interested in the change occurs in
histological manifestations, glucose and lipid homeostasis,
adipocytokines, redox status, oxidative stress and antioxidant
enzyme systems.
Materials and methods
Animals
Fifty healthy male Wistar rats (weight,
100–120 g) were obtained from animal house facility at the Medical
Research Institute. All rats were housed five per cage under
controlled laboratory conditions and provided with commercial diet
and tap water ad libitum. They were allowed one week
acclimatization period before the initiation of the experiments.
All persons involved in the study had completed animal care use and
training. Experimental procedures, animal handling, sampling, and
scarification followed the Guide for the Care and Use of Laboratory
Animals, 8th edition (National Research Council, 2011) and were
approved by ‘Research Ethical Committee’ of the Medical research
institute, Alexandria University (Alexandria, Egypt). All efforts
were made to minimize the rats suffering during the experimental
period.
Experimental design
Induction of NAFL in rats using
high-fat diet (HFD)
In the present study, high fat-diet was used to
induce NAFLD in rats according to the model proposed by
Sene-Fiorese et al (15). The
HFD consisted of commercial rat chow, peanuts, milk chocolate, and
sweet biscuits in a proportion of 3:2:2:1. It was prepared by
grinding well the commercial rat chow plus peanuts, and sweet
biscuits. Then all the components of the HFD were blended in hot
milk chocolate and left to cool and solidify. Rats were given the
high fat diet daily for 14 weeks.
Experimental groups
Besides the normal control group (n=10, Group I),
the NAFL rats (Group II) were randomly allocated into 4 subgroups
(n=10 each) and were kept on the same HFD till the end of the
experimental period. Of which, group IIA represented the untreated
NAFL animals (receiving saline), while those in groups IIB, IIC,
and IID were treated day by day by subcutaneous injection with BV
(VACSERA, Egypt) in a dose of 0.01, 0.05 and 0.1 mg/kg,
respectively.
The animals were killed by cervical dislocation on
the next day following the last injection and 10 h fasting blood
samples were collected by cardiac puncture and centrifuged (800 ×
g, at 4°C for 20 min) to separate the sera, which were used to
assess the serum parameters. Also, liver of the rats was collected
for biochemical and histological analysis to detect the progression
of NAFLD.
Determination of serum parameters
The fasting serum glucose, AST, and ALT were
assessed using Randox colorimetric reagent kits (Randox
Laboratories, Dublin, Republic of Ireland) and insulin by an ELISA
kit (Abnova, Jhongli, Taiwan). For lipid profile, the serum levels
of TGs and total cholesterol (TC) were determined using Boehringer
colorimetric kits (Mannheim, Germany), while HDL-C was determined
according to the method described by Lopes-Virella et al
(16); one aliquot of the serum was
mixed with the precipitating reagent phosphotungstic acid and
magnesium chloride then the cholesterol content was evaluated in
the clear supernatant using the Boehringer kit. Finally, LDL-C was
calculated according to the Friedewald equation: TC-(HDL-C+1/5 TGs)
(17)
The homeostasis model assessment index for insulin
resistance (HOMA-IR) was determined using the following formula:
HOMA-IR=[fasting glucose (mmol/l) × fasting insulin (µU/ml)]/22.5
(18)
The serum levels of TNF-α and adiponectin were
analyzed using a commercially available ELISA kit (Biosource
International, Camarillo, CA, USA).
Determination of liver parameters
Immediately after blood collection animals were
euthanized using deep diethyl ether anesthesia and their livers
were excised, homogenized, divided into aliquots and preserved at
−80°C until assay.
Assessment of tissue lipid
contents
Hepatic lipids were extracted according to the
method modified by Bligh and Dyer (19), where the chloroform layer, containing
all lipids, was utilized to assay TGs and TC, as mentioned
before.
Assessment of hepatic Nrf2
The Nrf2 activation and the ARE binding efficacy
were evaluated in the liver nuclear extracts using a Trans AM Nrf2
kit (Active Motif, Carlsbad, CA, USA). Aliquots of 10 µg protein of
the nuclear extract were incubated with immobilized
oligonucleotides containing the ARE consensus binding site
(5′-GTCACAGTACTCAGCAGAATCTG-3′) and the active form of Nrf2, that
binds to the oligonucleotides, was detected using an anti-Nrf2
primary antibody after treating with the HRP-conjugated secondary
antibody. Quantitative analysis of Nrf2 (µg/mg nuclear protein) was
performed by measuring the chromogen formed as a result of the
specific activity of the transcription factor in the nuclear
extracts using a plate reader at 450 nm (20).
Assessment of lipid peroxidation
The end products of lipid peroxidation were
determined as thiobarbituric acid reactive substance (TBARS) assay
(21). In this assay, the
malondialdehyde is heated with thiobarbituric acid (TBA) at low pH
to produce a pink chromogen with a maximum absorbance at 532
nm.
Assay of reduced GSH and glutathione
disulphide (GSSG)
GSH and GSSG were assayed using the method of
Griffith (22) which depends on the
oxidation of GSH by 5,5′-dithiobis-(2-nitrobenzoic acid) (DTNB) to
yield GSSG and 5-thio-2-nitrobenzoic acid (TNB). Oxidized GSSG is
reduced enzymatically by the action of glutathione reductase (GR)
and NADPH to regenerate GSH. The rate of TNB formation is monitored
at 412 nm and is proportional to the sum of GSH and GSSG present in
the sample.
Assay of GSH metabolizing enzymes
The activity of GR was assayed by the method of
Smith et al (23). Which
based on the reduction of DTNB by GSH produced by GR which results
in the release of TNB that monitored spectrophotometrically at 412
nm. One unit of the enzyme activity is defined as the amount of the
enzyme that catalyzes the formation of 1 µmol of TNB per
minute.
The activity of glutathione-S-transferase (GST) was
determined by the method of Habig et al (24). The GST catalyzed the conjugation of
GSH with 1-chloro-2,4-dinitrobenzene (CDNB) is measured
spectrophotometrically at 340 nm. One unite of the enzyme activity
is defined as the amount of enzyme that catalyzes the formation of
1 µmol S-conjugate per minute under the assay conditions.
The total glutathione peroxidase (GPx) activities
were determined by the method of Flohé and Günzler (25). This method is based on monitoring the
generation of GSH from GSSG by the action of GR and NADPH. Total
GPx (tGPx) activity was measured using cumene hydroperoxide as
substrate whereas Se-dependent GPx (sGPx) activity was measured
using H2O2 as substrate.
Non-selenium-dependant GPx (nsGPx) activity was calculated as the
difference between the total GPx and sGPx.
Histopathological study
Liver tissue specimens from each studied groups were
fixed in 10% neutral buffered formalin then washed in running
water, dehydrated in ascending series of ethyl alcohol, cleared in
xylem and embedded in paraffin wax. Section of 4 µm thick was cut
by microtome and stained with hematoxylin and eosin stain (H&E)
for histopathological investigations.
Statistical analysis
All data are presented as mean ± SD. A one-way
analysis of variance (ANOVA) was performed on each variable
followed by Tukey post-hoc test. The Kolmogorov-Smirnov test was
used to study the normal distribution of the studied parameters.
P<0.05 was considered to indicate a statistically significant
difference. All statistical analyses were performed using SPSS
statistical software version 18 (SPSS, Inc., Chicago, IL, USA).
Results
Liver function test
The untreated NAFL rats showed significantly higher
serum activities of ALT, AST, GGT and higher serum level of
bilirubin compared to control rats (Table I). NAFL rats treated with BV show
significantly lower levels of all function liver tests compared
untreated NAFL rats in dose dependent manner. However, the activity
of GGT and level of bilirubin were significantly lower in treated
rats compared to untreated NAFL rats, but their levels still higher
than control value (Table I).
 | Table I.Serum ALT, AST, GGT activities, and
total Bil in control rats and NAFL rats untreated and treated with
different doses of bee venom. |
Table I.
Serum ALT, AST, GGT activities, and
total Bil in control rats and NAFL rats untreated and treated with
different doses of bee venom.
|
|
| Group II
(NAFL) |
|---|
|
|
|
|
|---|
|
|
|
| Bee venom
treated |
|---|
|
|
|
|
|
|---|
| Parameter | Group I (control)
(n=10) | Untreated
(n=10) | 0.01 mg/kg
(n=10) | 0.05 mg/kg
(n=10) | 0.1 mg/kg
(n=10) |
|---|
| ALT (U/l) | 46.6±3.40 |
67.85±8.73a |
41.85±12.11b |
40.45±9.35b |
39.65±10.00b |
| AST (U/l) | 128.2±23.65 |
204.70±32.00a |
121.20±22.80b |
122.90±10.54b |
122.60±18.55b |
| GGT (U/l) | 13.3±2.00 |
51.50±3.60a |
43.60±10.38a |
38.90±14.19a,b |
36.90±6.51a,b |
| Bil (mg/dl) | 0.54±0.30 |
1.67±0.22a |
1.04±0.18a,b |
1.14±0.21a,b |
0.93±0.12a,b |
Glucose homeostasis parameters
The untreated NAFL rats showed significantly higher
serum level of fasting blood glucose and insulin compared to
control rats while the NAFL rats treated with BV showed the
significantly lower value of FBG and insulin compared to untreated
NAFL rats in dose dependent manner (Table II).
| Table II.Serum glucose homeostasis parameters,
lipid profile and hepatic trigycerides and cholesterol contents in
control rats and NAFL rats untreated and treated with different
doses of bee venom. |
Table II.
Serum glucose homeostasis parameters,
lipid profile and hepatic trigycerides and cholesterol contents in
control rats and NAFL rats untreated and treated with different
doses of bee venom.
|
|
| Group II
(NAFL) |
|---|
|
|
|
|
|---|
|
|
|
| Bee venom
treated |
|---|
|
|
|
|
|
|---|
| Parameter | Group I (Control)
(n=10) | Untreated
(n=10) | 0.01 mg/kg
(n=10) | 0.05 mg/kg
(n=10) | 0.1 mg/kg
(n=10) |
|---|
| FBG (mg/dl) | 74.6±11.94 |
116.80±8.57a |
71.90±9.55b |
72.20±13.59b |
67.20±7.55b |
| Insulin
(µIU/ml) | 3.60±1.34 |
12.20±0.61a |
9.96±1.50a,b |
10.68±1.51a,b |
9.92±0.34a,b |
| HOMA-IRI | 0.66±0.28 |
3.52±0.36a |
1.77±0.42a,b |
1.90±0.48a,b |
1.65±0.23a,b |
| TGs (mg/dl) | 35.6±8.49 |
57.90±13.30a | 45.30±7.12 | 42.20±15.08 |
38.80±17.74b |
| TC (mg/dl) | 147.2±27.67 |
174.60±24.64a |
129.0±13.33b |
128.50±11.27b |
125.50±21.70b |
| HDL-C (mg/dl) | 43.4±7.07 |
32.23±1.86a |
50.69±7.01b |
52.60±10.85b |
54.77±12.0a,b |
| LDL-C (mg/dl) | 96.6±29.42 |
130.8±26.17a |
69.3±15.77a,b |
67.5±15.69a,b |
63.0±12.12a,b |
| Hepatic TGs (mg/g
liver) | 33.9±8.56 |
124.1±14.25a |
80.6±8.69a,b |
69.5±12.19a,b |
56.3±8.06a,b |
| Hepatic TC (mg/g
liver) | 15.71±1.96 |
38.19±5.50a |
29.46±3.20a,b |
23.54±3.13a,b |
18.87±2.63a,b |
The insulin resistance index calculated by the HOMA
model (HOMA-IR) indicated that NAFL rats treated with BV showed the
significantly lower value of HOMA-IRI compared to untreated NAFL
rats in dose dependent manner (Table
II). Although the level of fasting insulin and HOMA-IRI were
significantly lower in the treated NAFL rats compared to untreated
NAFL rats, their levels were still higher in treated NAFL rats
compared to control rats (Table
II).
Lipid profile
The untreated NAFL rats showed significantly higher
level of TG, TC, and LDL-C, while showed significant lower level of
HDL-C (Table II). NAFL rats treated
with BV showed significantly lower levels of TG, TC and LDL-C
compared to untreated NAFL rats in dose dependent manner.
Furthermore, the level of HDL-C showed dose dependent increase in
NAFL rats treated with BV as the level of HDL-C level showed
significantly high level compared to untreated NAFL rats even with
the lowest dose and the treated NAFL rats had also higher HDL-C
level than control rat at BV doses of 0.05 and 0.1 mg/kg (Table II).
Hepatic lipid contents
The hepatic tissues of untreated NAFL rats showed
greatly elevated contents of TGs (by approximately 266%) and
cholesterol (by approximately 143%) compared to the hepatic tissues
of control rats. The NAFL rats treated with BV showed significant
downregulation of hepatic contents of TGs and cholesterol in a
dose-dependent manner. However, even with the highest dose used
(0.1 mg/kg) the hepatic contents of TGs and cholesterol still were
higher than control values by approximately 66 and 12.7%,
respectively (Table II).
Antioxidant parameters
GSH system
Serum and hepatic GSH system (tGSH,
GSH, GSSG and GSH/GSSG ratio)
The untreated NAFL rats showed significantly lower
serum levels of tGSH and GSH compared to control rats by
approximately 22.4 and 41.1%, respectively. While the hepatic
levels of tGSH and GSH of untreated NAFL rats showed more decline
by approximately 46.4 and 63.5%, respectively. In contrast, the
serum and hepatic levels of GSSG were significantly higher in NAFL
rats by approximately 120.5 and 171.4%, respectively, compared to
control rats. Consequently, the serum and hepatic GSH/GSSG ratio
was significantly lower in the NAFL rats by 73 and 86.4%,
respectively (Table III).
| Table III.The serum and hepatic levels of
glutathione system in control rats and NAFL rats untreated and
treated with different doses of bee venom. |
Table III.
The serum and hepatic levels of
glutathione system in control rats and NAFL rats untreated and
treated with different doses of bee venom.
|
|
| Group II
(NAFL) |
|---|
|
|
|
|
|---|
|
|
|
| Bee venom
treated |
|---|
|
|
|
|
|
|---|
| Parameter | Group I (control)
(n=10) | Untreated
(n=10) | 0.01 mg/kg
(n=10) | 0.05 mg/kg
(n=10) | 0.1 mg/kg
(n=10) |
|---|
| Serum tGSH
(µmol/l) | 83.61±5.34 |
64.84±8.71a |
65.09±10.57a |
69.65±16.09a |
69.37±7.37a |
| Serum GSH
(µmol/l) | 73.95±4.84 |
43.58±10.85a |
49.91±8.89a |
54.74±17.64a |
56.30±9.72a |
| Serum GSSG
(µmol/l) | 4.82±1.08 |
10.63±1.50a |
7.59±2.11a,b |
7.47±1.27a,b |
6.55±1.87b |
| Serum GSH/GSSG | 15.93±3.19 |
4.29±1.67a |
7.04±2.17a |
7.72±3.10a |
9.55±4.07a,b |
| Hepatic tGSH
(µmol/g liver) | 1.92±0.20 |
1.03±0.27a |
1.17±0.35a |
1.27±0.50a |
1.42±0.39a |
| Hepatic GSH (µmol/g
liver) | 1.78±0.27 |
0.65±0.30a |
0.89±0.35a |
1.08±0.46a |
1.14±0.41a,b |
| Hepatic GSSG
(µmol/g liver) | 0.07±0.01 |
0.19±0.04a |
0.15±0.07a |
0.14±0.04a |
0.14±0.05a |
| Hepatic
GSH/GSSG | 27.45±5.61 |
3.74±1.97a |
7.09±4.20a |
8.69±4.56a |
10.87±8.62a,b |
The NAFL rats treated with BV showed no significant
correction in the levels of serum and hepatic total GSH or serum
reduced GSH while they showed a dose-dependent increase in the
level of reduced hepatic GSH which becomes significant at the
highest dose of BV (0.1 mg/kg). While they showed a significant
dose-dependent decline in the serum level of oxidized glutathione
(GSSG). On the other hand, the hepatic level of GSSG showed no
significant changes in the NAFL rats treated with different doses
of BV (Table III).
Regarding GSH/GSSG ratio, only the NAFL rats treated
with the highest dose of BV (0.1 mg/kg) showed significantly higher
value than the untreated NAFL rats (Table III).
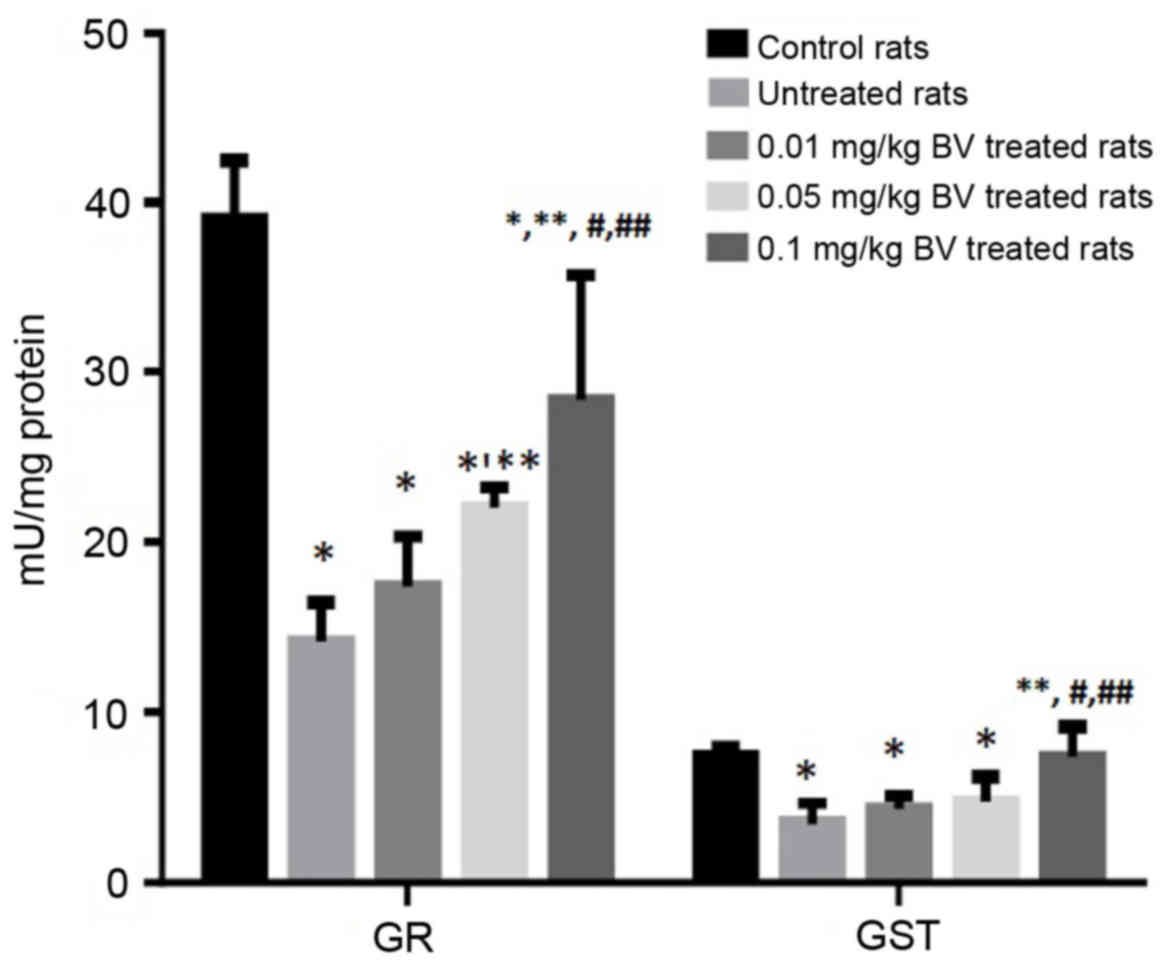
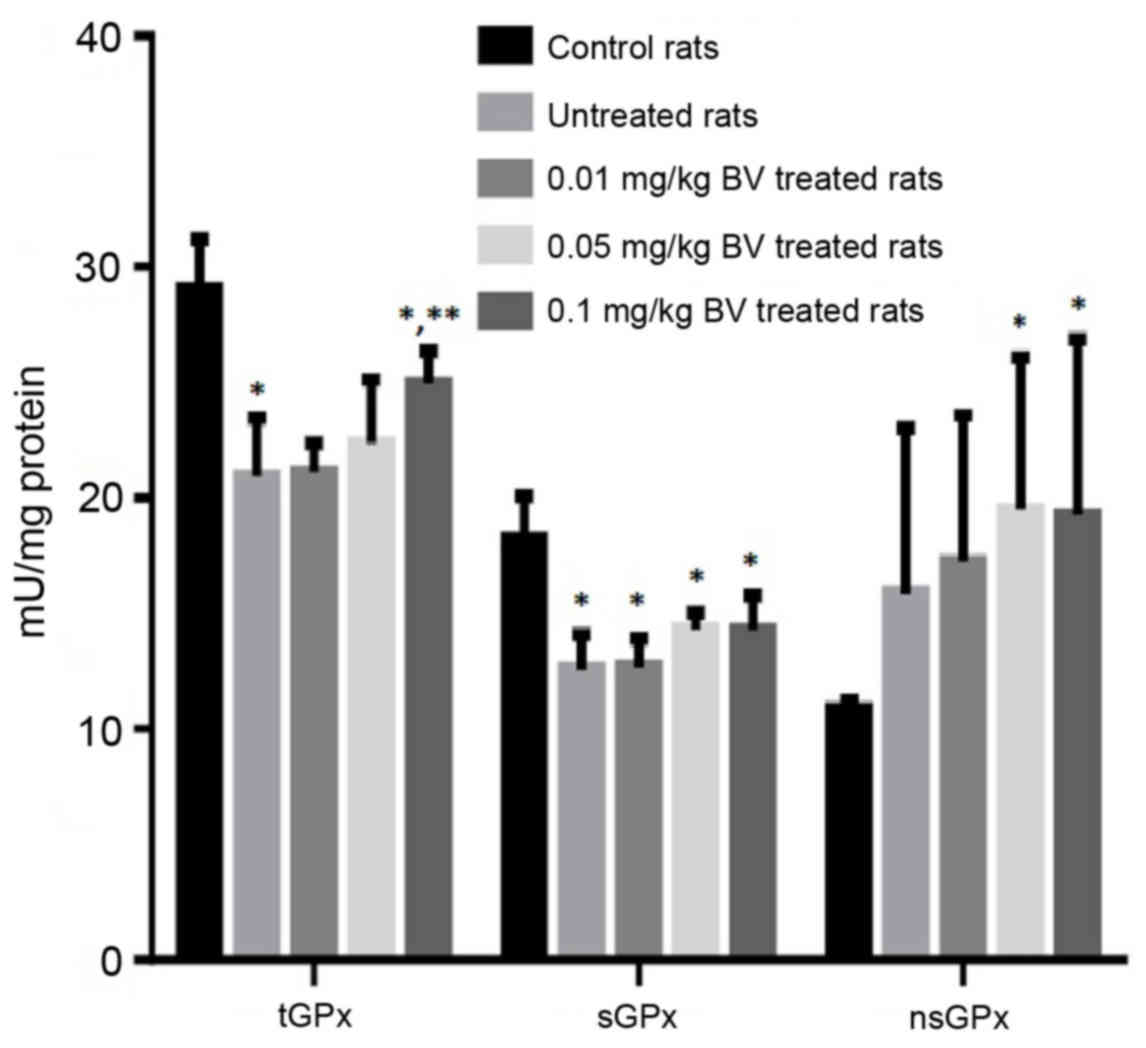
GSH metabolizing enzymes; GR, GST, and
GPxs (tGPx, sGPx and nsGPx)
The untreated NAFL rats showed significantly lower
activities of GR and GST compared to control rats by approximately
63.9 and 53.3%; respectively, while only the highest dose of BV
(0.1 mg/kg) was able to normalize GST activity (Fig. 1). Moreover, significantly lower
activities of tGPx and sGPx were noticed in untreated NAFL rats
compared to control rats by approximately 28 and 31%, respectively.
In contrast, the untreated NAFL rats showed a non-significant
increase in the activity of the nsGPx by approximately 46.3%
compared to control rats (Fig. 2).
The treatment of NAFL rats with BV cause significant elevation of
all GSH metabolizing enzymes (GR, GST, tGPx, sGPx and nsGPx) in a
dose-dependent manner (Figs. 2 and
3).
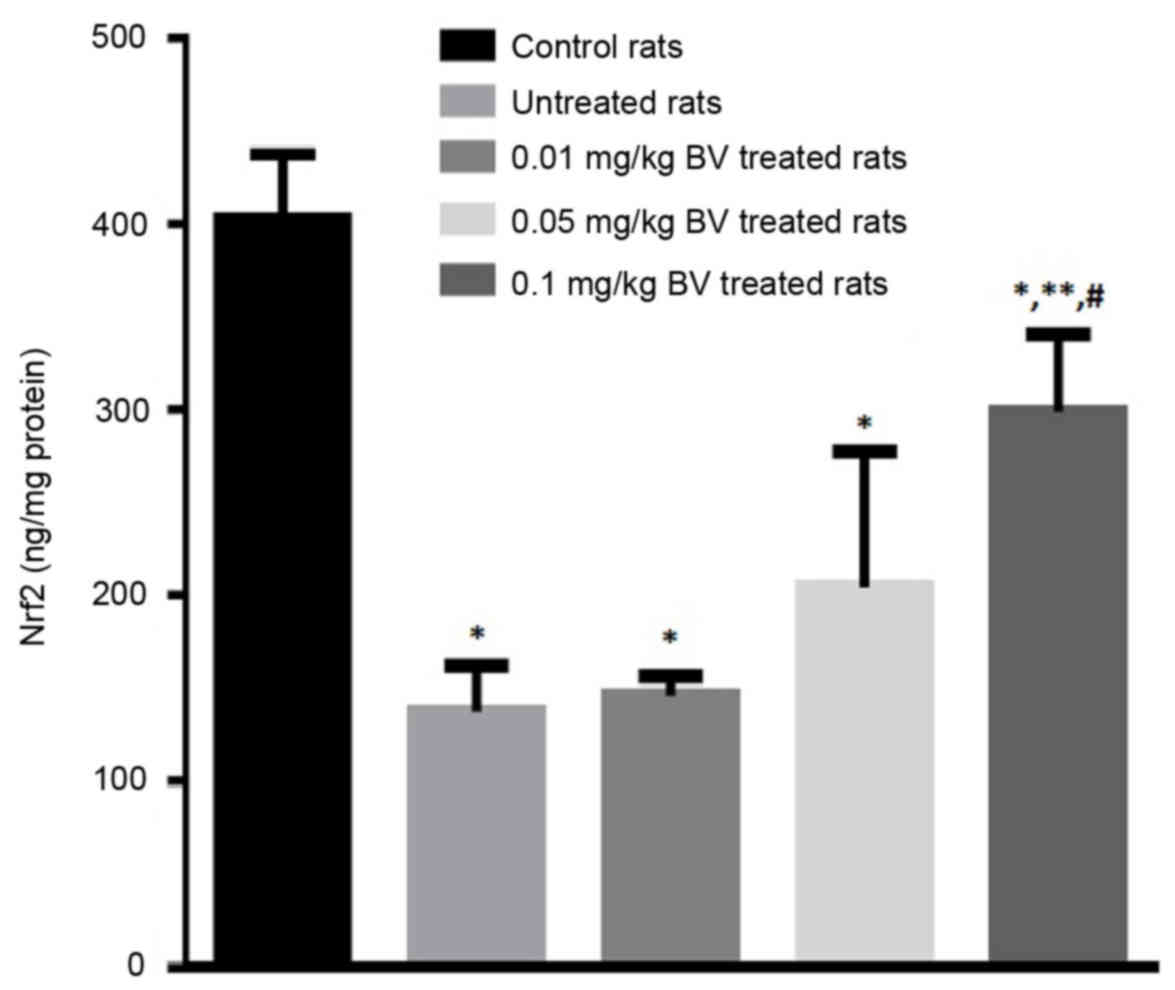
Hepatic nuclear erythroid related
factor 2 (Nrf2)
The hepatic level of Nrf2 greatly declined in the
untreated NAFL rats by approximately 65.8% compared to control
rats. The NAFL rats treated with BV showed a dose-dependent
elevation of Nrf2 compared to the untreated rats with the
significant elevation was observed at the highest dose (0.1 mg/kg)
however, the level still lower than control value (Fig. 3).
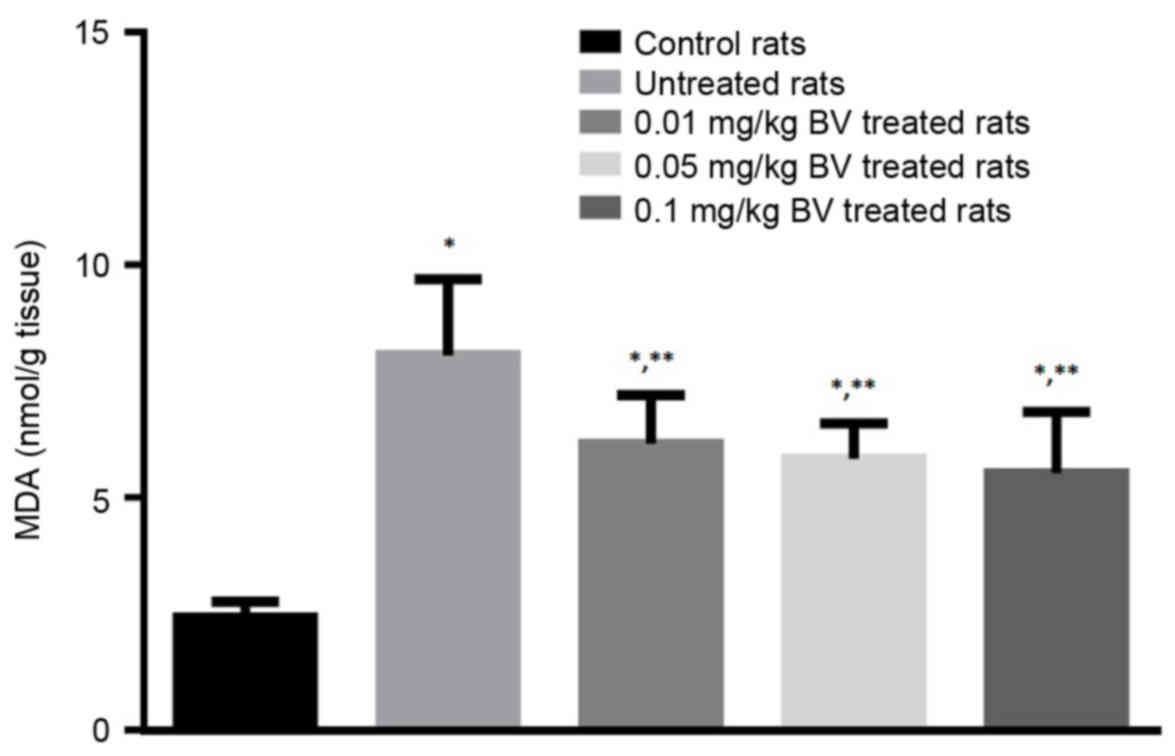
Lipid peroxidation index (MDA assayed
as TBARS)
The untreated NAFL rats showed great elevation in
the level of MDA by approximately 233% compared to control rats.
The NAFL rats treated with BV showed significantly lower levels of
MDA compared to untreated rats in a dose-dependent manner, however,
its level still higher than control value (Fig. 4).
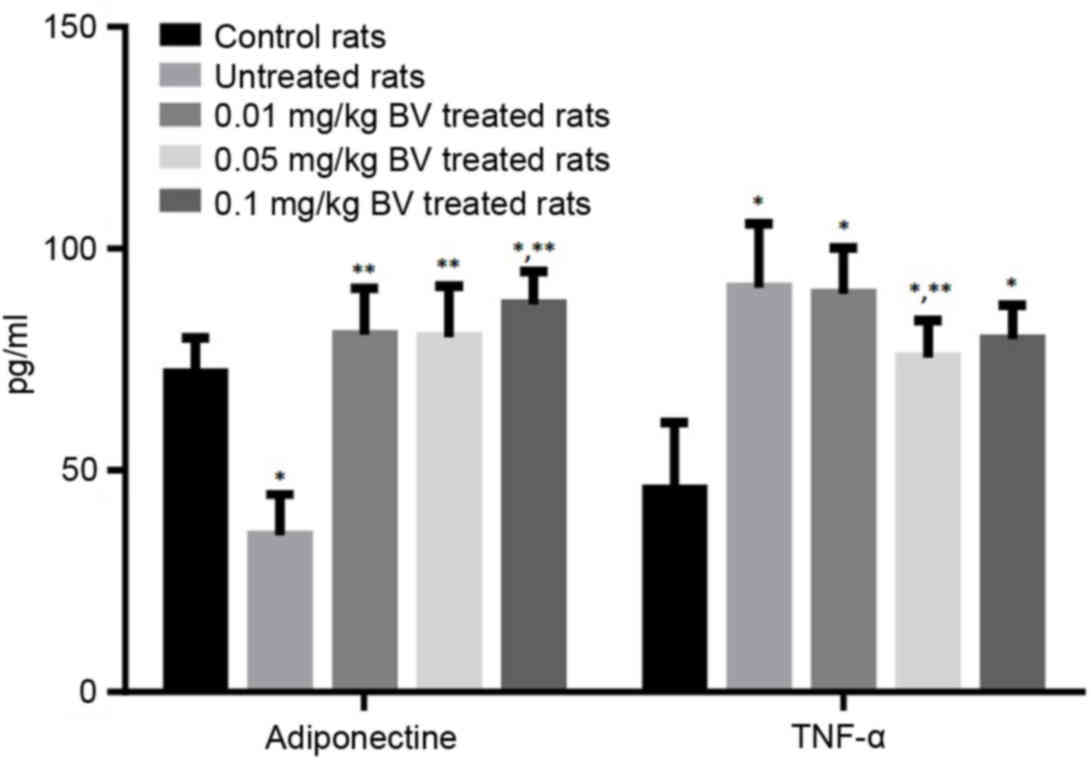
Adipocytokines levels
The untreated NAFL rats showed significantly lower
serum level of adiponectin by approximately half compared to the
control rats, while the untreated rats showed significantly higher
serum level of TNF-α by approximately 100% compared to the control
rats. The treatment of NAFL rats with BV at the dose of 0.01 and
0.05 mg/kg was responsible for the complete normalization of the
adiponectin level. On the other hand, the treatment of NAFL rats
with BV showed the slightly lower level of TNF-α compared to
untreated rats even with the highest dose (Fig. 5).
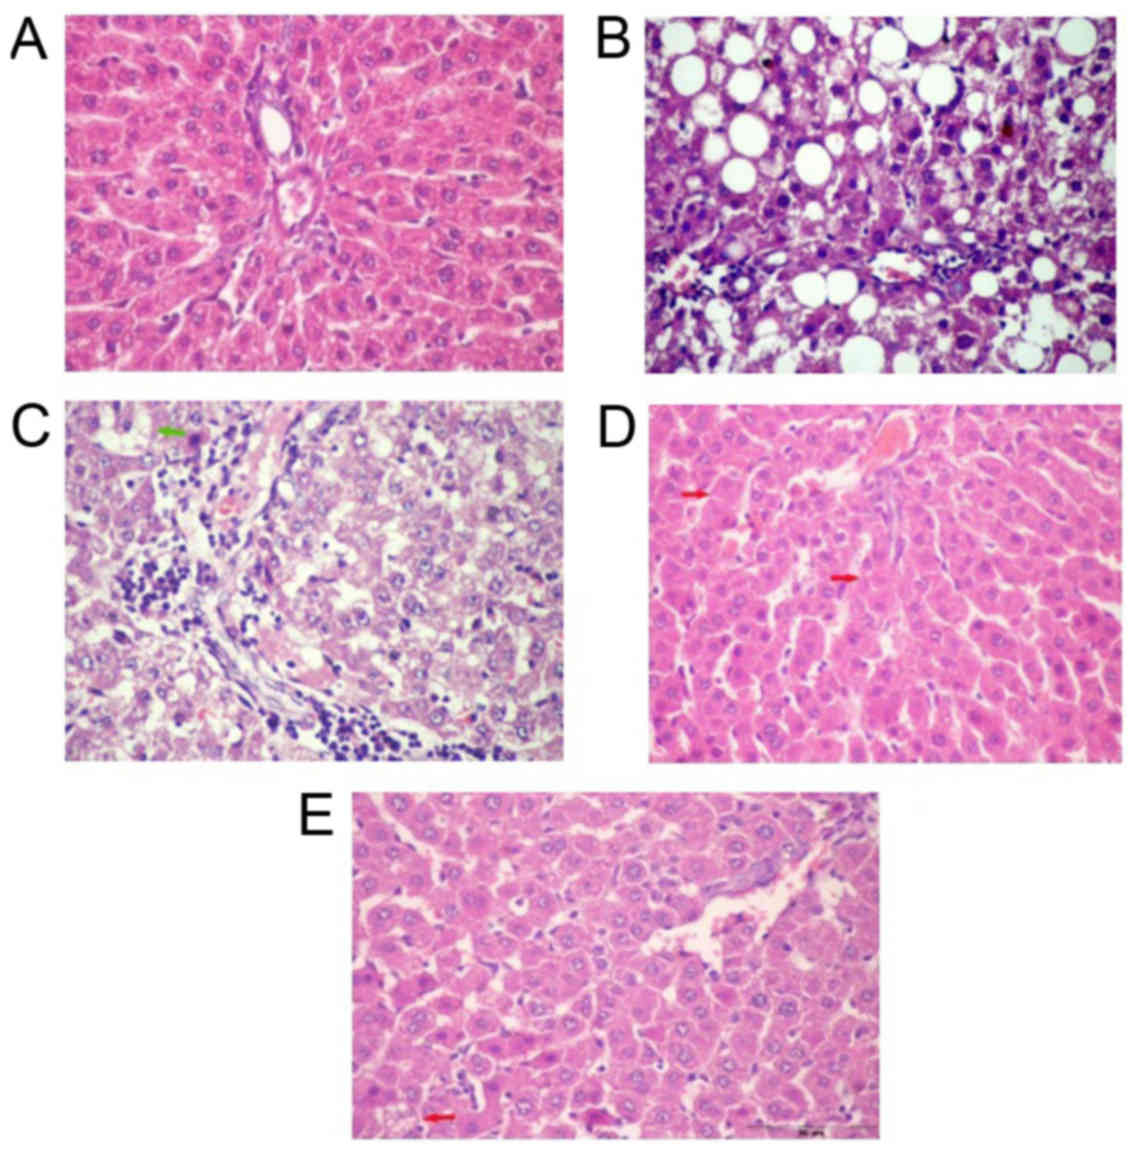
Histopathological examination
Liver sections of normal control rats showed normal
plates of hepatocytes radiating from the central vein. The majority
of hepatocytes are mononucleated and some hepatocytes are
binucleated (Fig. 6A). The liver
section of untreated NAFL rats showed zonal degeneration; congested
central and portal veins impacted with haemolysed blood, increased
inflammatory cellular infiltration in portal area, dilated
sinusoids, necrosis, micro and macrosteatosis (Fig. 6B). Liver sections of NAFL rat treated
with BV (0.01 mg/kg) showed decreased inflammatory cellular
infiltration in a portal area with congested portal vein and fatty
degeneration in some hepatocytes as compared with NAFL group
(Fig. 6C). The treatment with BV in
a dose of 0.05 mg/kg showed minimal congestion in central vein and
in sinusoids and increased eosinophilic stain in some hepatocytes
and a little number of fatty degeneration and apoptotic figures
(Fig. 6D). With the highest dose
(0.1 mg/kg), the liver sections showed normal sinusoids with
minimal inflammatory cellular infiltration compared to control
liver (Fig. 6E).
Discussion
The present study is designed to evaluate the effect
of BV treatment of NAFLD and interested in the change occurs in
histological manifestations, glucose and lipid homeostasis,
adipocytokines, redox status, oxidative stress and antioxidant
enzyme systems. NAFL rats demonstrated significant hepatic
accumulation of TGs, cholesterol. Also, the activities of serum
transaminases; AST, ALT, and GGT were significantly elevated. NAFL
rats showed higher bilirubin value. These abnormalities of liver
function tests indicated significant hepatocytes inflammation,
damage, and necrosis as confirmed in the histological results. At
the glucose homeostasis level, NAFL rats showed a significant
elevation in fasting blood glucose, insulin and HOMA-insulin
resistance index that indicated a state of insulin resistance which
represents the first hit for hepatic fat accumulation and steatosis
according to the two hit theory (4).
The disturbed glucose homeostasis parameters in NAFL
rats were associated with significant abnormalities in the lipid
profile parameters; serum levels of TGs, total cholesterol and
LDL-cholesterol were significantly higher while HDL-cholesterol was
lower compared to control rats. This condition is commonly referred
to as dyslipidemia (26). The
observed impairments in carbohydrate and lipid metabolism were
associated with a significant disruption in adipocytokine
production. The results indicated a significant reduction in the
serum level of adiponectin while the TNF-α level significantly
increased compared to control rats. The hypoadiponectinemia may be
a cause of obesity and adipose tissue-specific insulin resistance
(27). The action of TNF-α is
intimately related to the upregulation of intracellular generation
of ROS and then of oxidative stress (28,29).
Taken together, these findings indicate that TNF-α and adiponectin
are critical factors for. occurrence and progression of NAFLD/NASH.
Also, NAFL rats showed enhanced hepatic lipid peroxidation as
indicated by the higher level of malondialdehyde. Even in the basal
(low-fat) state, hepatocytes produce large amounts of ROS as
indicated by the detectable level of MDA in control rats (30). This large basal ROS formation is
further enhanced in steatotic livers (31). The insulin resistance, accumulation
of fats in hepatocytes, and induction of inflammatory cytokines may
participate in the induction of oxidative stress (32).
The present study indicated a significant decline in
the active nuclear Nrf2 in untreated NAFL rats. Nrf2 is a
transcription factor that is the master inducer of the endogenous
antioxidant response to endogenous and exogenous oxidative stress
(33). In support of the previous
hypothesis, the present study confirmed depletion of the serum and
hepatic total and reduced glutathione (GSH) and a decline in the
redox ratio (GSH/GSSG) in NAFL rats. These disturbances in GSH
system were associated with significant inhibition in the
activities of GSH metabolizing enzymes; GR and GST. Also, the
activities of total and sGPx were significantly inhibited in NAFL
rats.
Many of BV components are being also used in
experimental pharmacology (34).
From the results of the present study, it was clearly demonstrated
that BV treatment significantly improved hepatic function
parameters and hepatic TGs and cholesterol contents although a few
of these contents remained higher than normal control values. BV
effect on insulin level is mild which means that the BV enhances
insulin sensitivity in the peripheral tissues which manifested as
decreased HOMA-insulin resistance index in the NAFL rats treated
with BV. In line with these data, in alloxan-induced type 1
diabetes, the treatment with BV for 4 weeks resulted in significant
decline in the blood glucose level and increase in insulin level
(35). BV treatment also completely
normalized the lipid profile values of serum TG, total cholesterol,
LDL-C, and HDL-C. The effect was more prominent with cholesterol,
LDL-C, and HDL-C which were completely normalized even with the
lowest dose. In line with these results, many studies on different
health conditions support the lipotropic effect of BV treatments
(36).
These biochemical data were confirmed by the
histological findings. Histopathological examination of the liver
of NAFL rats treated with the lower dose of BV revealed normal
hepatocytes architecture with patent sinusoids. However, apoptotic
cells with steatosis were still recognized. Increasing the dose of
BV improved the impairment in the histological features to become
more or less similar to normal control rats with a minimal number
of steatotic figures with the highest dose. Moreover, BV treatment
of NAFL rats caused a dose-dependent decline in the level of TNF-α
in accordance with a study that documented that BV treatment
reduces TNF-α levels in mice (37).
Also, BV treatment showed a dose-dependent elevation of active
nuclear Nrf2 compared to the untreated rats while the significant
elevation was observed at the high dose. Nrf2 through the induction
of the different antioxidant systems may control-normalize- redox
state of the liver and the level of GSH which mediate the
ameliorating effects on the NAFL rats.
The best ameliorative effect of BV was observed at
the hepatic level of adiponectin (completely normalized even with
the lowest dose; 0.05 mg/kg) followed by Nrf2. These results lead
us to suggest that, mechanistically, BV therapeutic effects against
NAFL manifestations may be mediated through induction of
adiponectin; the powerful insulin-sensitizing hormone, which in
turn activates Nrf2 pathway through activation of AMPK. AMPK
pathway is important for activation of Nrf2 pathways and for the
efficient nuclear accumulation of Nrf2 protein as well to bind to
its response elements in the regulatory domains of the Nrf2 targets
(38), thereby activating their
transcription (39,40) and downregulate the expression of
TNF-α. Therefore, BV reduces the inflammation and the oxidative
stress and induce insulin sensitivity which in turn ameliorates
liver function parameters; ALT, AST, GGT and bilirubin levels and
normalizing the redox state of the liver and confirmed also by
histopathological examination that showed minimal hepatocytes
inflammation with normal hepatocytes architecture. The previous
conclusion is supported by the results of this study, which
indicated that NAFL rats treated with BV showed significantly lower
hepatic levels of MDA compared to untreated rats in a
dose-dependent manner. The antioxidant potential of BV had been
confirmed in different studies carried on different pathological
conditions (41,42).
The present study represents an advance in
biomedical science because it shows the antioxidant potential of BV
treatment and its normalization effect on adipocytokines that makes
it a tempting therapeutic agent for NAFLD.
Acknowledgements
Not applicable.
Funding
No funding was received.
Availability of data and materials
The datasets used and/or analyzed during the current
study are available from the corresponding author on reasonable
request.
Authors' contributions
MAK, MYH and MHH designed the study, wrote the
protocol, supervised the research, managed the literature searches,
and read and approved the final manuscript. AHK peformed the
histological part of the study, and ELZ, SEEA, AS and AHG carried
out the research work, performed the statistical analysis, and
wrote the first draft of the manuscript.
Ethics approval and consent to
participate
Experimental procedures, animal handling, sampling,
and scarification followed the Guide for the Care and Use of
Laboratory Animals, 8th edition (National Research Council, 2011)
and were approved by Research Ethical Committee of the Medical
Research Institute, Alexandria University. The current study
adheres to the ARRIVE Guidelines for reporting animal research and
a completed ARRIVE guidelines checklist is included in S1
Checklist.
Consent for publication
Not applicable.
Competing interests
The authors declare that they have no competing
interests.
References
|
1
|
Neuschwander-Tetri BA and Caldwell SH:
Nonalcoholic steatohepatitis: Summary of an AASLD single topic
conference. Hepatology. 37:1202–1219. 2003. View Article : Google Scholar : PubMed/NCBI
|
|
2
|
Musso G, Cassader M, De Michieli F, Rosina
F, Orlandi F and Gambino R: Nonalcoholic steatohepatitis versus
steatosis: Adipose tissue insulin resistance and dysfunctional
response to fat ingestion predict liver injury and altered glucose
and lipoprotein metabolism. Hepatology. 56:933–942. 2012.
View Article : Google Scholar : PubMed/NCBI
|
|
3
|
Halbleib M, Skurk T, de Luca C, von
Heimburg D and Hauner H: Tissue engineering of white adipose tissue
using hyaluronic acid-based scaffolds. I: In vitro differentiation
of human adipocyte precursor cells on scaffolds. Biomaterials.
24:3125–3132. 2003. View Article : Google Scholar : PubMed/NCBI
|
|
4
|
Day CP and James OF: Steatohepatitis: A
tale of two ‘hits’? Gastroenterology. 114:842–845. 1998. View Article : Google Scholar : PubMed/NCBI
|
|
5
|
Bugianesi E, Gastaldelli A, Vanni E,
Gambino R, Cassader M, Baldi S, Ponti V, Pagano G, Ferrannini E and
Rizzetto M: Insulin resistance in non-diabetic patients with
non-alcoholic fatty liver disease: Sites and mechanisms.
Diabetologia. 48:634–642. 2005. View Article : Google Scholar : PubMed/NCBI
|
|
6
|
Hui JM, Hodge A, Farrell GC, Kench JG,
Kriketos A and George J: Beyond insulin resistance in NASH:
TNF-alpha or adiponectin? Hepatology. 40:46–54. 2004. View Article : Google Scholar : PubMed/NCBI
|
|
7
|
Houstis N, Rosen ED and Lander ES:
Reactive oxygen species have a casual role in multiple forms of
insulin resistance. Nature. 440:944–948. 2006. View Article : Google Scholar : PubMed/NCBI
|
|
8
|
Franco R, Schoneveld OJ, Pappa A and
Panayiotidis MI: The central role of glutathione in the
pathophysiology of human diseases. Arch Physiol Biochem.
113:234–258. 2007. View Article : Google Scholar : PubMed/NCBI
|
|
9
|
Kwak MK, Wakabayashi N, Itoh K, Motohashi
H, Yamamoto M and Kensler TW: Modulation of gene expression by
cancer chemopreventive dithiolethiones through the Keap1-Nrf2
pathway. Identification of novel gene clusters for cell survival. J
Biol Chem. 278:8135–8145. 2003. View Article : Google Scholar : PubMed/NCBI
|
|
10
|
Yates MS, Tran QT, Dolan PM, Osburn WO,
Shin S, McCulloch CC, Silkworth JB, Taguchi K, Yamamoto M, Williams
CR, et al: Genetic versus chemoprotective activation of Nrf2
signaling: Overlapping yet distinct gene expression profiles
between Keap1 knockout and triterpenoid-treated mice.
Carcinogenesis. 30:1024–1031. 2009. View Article : Google Scholar : PubMed/NCBI
|
|
11
|
Sugimoto H, Okada K, Shoda J, Warabi E,
Ishige K, Ueda T, Taguchi K, Yanagawa T, Nakahara A, Hyodo I, et
al: Deletion of nuclear factor-E2-related factor-2 leads to rapid
onset and progression of nutritional steatohepatitis in mice. Am J
Physiol Gastrointest Liver Physiol. 298:G283–G294. 2010. View Article : Google Scholar : PubMed/NCBI
|
|
12
|
Zhang YK, Yeager RL, Tanaka Y and Klaassen
CD: Enhanced expression of Nrf2 in mice attenuates the fatty liver
produced by a methionine- and choline-deficient diet. Toxicol Appl
Pharmacol. 245:326–334. 2010. View Article : Google Scholar : PubMed/NCBI
|
|
13
|
Jang MH, Shin MC, Lim S, Han SM, Park HJ,
Shin I, Lee JS, Kim KA, Kim EH and Kim CJ: Bee venom induces
apoptosis and inhibits expression of cyclooxygenase-2 mRNA in human
lung cancer cell line NCI-H1299. J Pharmacol Sci. 91:95–104. 2003.
View Article : Google Scholar : PubMed/NCBI
|
|
14
|
Hong SJ, Rim GS, Yang HI, Yin CS, Koh HG,
Jang MH, Kim CJ, Choe BK and Chung JH: Bee venom induces apoptosis
through caspase-3 activation in synovial fibroblasts of patients
with rheumatoid arthritis. Toxicon. 46:39–45. 2005. View Article : Google Scholar : PubMed/NCBI
|
|
15
|
Sene-Fiorese M, Duarte FO, Scarmagnani FR,
Cheik NC, Manzoni MS, Nonaka KO, Rossi EA, de Oliveira Duarte AC
and Dâmaso AR: Efficiency of intermittent exercise on adiposity and
fatty liver in rats fed with high fat diet. Obesity (Silver
Spring). 16:2217–2222. 2008. View Article : Google Scholar : PubMed/NCBI
|
|
16
|
Lopes-Virella MF, Stone PG and Colwell JA:
Serum high density lipoprotein in diabetic patients. Diabetologia.
13:285–291. 1977. View Article : Google Scholar : PubMed/NCBI
|
|
17
|
Friedewald WT, Levy RI and Fredrickson DS:
Estimation of the concentration of low-density lipoprotein
cholesterol in plasma, without use of the preparative
ultracentrifuge. Clin Chem. 18:499–502. 1972.PubMed/NCBI
|
|
18
|
Caumo A, Perseghin G, Brunani A and Luzi
L: New insights on the simultaneous assessment of insulin
sensitivity and beta-cell function with the HOMA2 method. Diabetes
Care. 29:2733–2734. 2006. View Article : Google Scholar : PubMed/NCBI
|
|
19
|
Bligh EG and Dyer WJ: A rapid method of
total lipid extraction and purification. Can J Biochem Physiol.
37:911–917. 1959. View
Article : Google Scholar : PubMed/NCBI
|
|
20
|
Muthusamy VR, Kannan S, Sadhaasivam K,
Gounder SS, Davidson CJ, Boeheme C, Hoidal JR, Wang L and
Rajasekaran NS: Acute exercise stress activates Nrf2/ARE signaling
and promotes antioxidant mechanisms in the myocardium. Free Radic
Biol Med. 52:366–376. 2012. View Article : Google Scholar : PubMed/NCBI
|
|
21
|
Draper HH and Hadley M: Malondialdehyde
determination as index of lipid peroxidation. Methods Enzymol.
186:421–431. 1990. View Article : Google Scholar : PubMed/NCBI
|
|
22
|
Griffith OW: Determination of glutathione
and glutathione disulfide using glutathione reductase and
2-vinylpyridine. Anal Biochem. 106:207–212. 1980. View Article : Google Scholar : PubMed/NCBI
|
|
23
|
Smith IK, Vierheller TL and Thorne CA:
Assay of glutathione reductase in crude tissue homogenates using
5,5′-dithiobis(2-nitrobenzoic acid). Anal Biochem. 175:408–413.
1988. View Article : Google Scholar : PubMed/NCBI
|
|
24
|
Habig WH, Pabst MJ and Jakoby WB:
Glutathione S-transferase AA from rat liver. Arch Biochem Biophys.
175:710–716. 1976. View Article : Google Scholar : PubMed/NCBI
|
|
25
|
Flohé L and Günzler WA: Assays of
glutathione peroxidase. Methods Enzymol. 105:114–121. 1984.
View Article : Google Scholar : PubMed/NCBI
|
|
26
|
Tangvarasittichai S: Oxidative stress,
insulin resistance, dyslipidemia and type 2 diabetes mellitus.
World J Diabetes. 6:456–480. 2015. View Article : Google Scholar : PubMed/NCBI
|
|
27
|
Di Chiara T, Argano C, Corrao S, Scaglione
R and Licata G: Hypoadiponectinemia: A link between visceral
obesity and metabolic syndrome. J Nutr Metab. 2012:1752452012.
View Article : Google Scholar : PubMed/NCBI
|
|
28
|
Tilg H and Moschen AR: Adipocytokines:
Mediators linking adipose tissue, inflammation and immunity. Nat
Rev Immunol. 6:772–783. 2006. View
Article : Google Scholar : PubMed/NCBI
|
|
29
|
Tilg H and Hotamisligil GS: Nonalcoholic
fatty liver disease: Cytokine-adipokine interplay and regulation of
insulin resistance. Gastroenterology. 131:934–945. 2006. View Article : Google Scholar : PubMed/NCBI
|
|
30
|
Kono H, Rusyn I, Yin M, Gäbele E,
Yamashina S, Dikalova A, Kadiiska MB, Connor HD, Mason RP, Segal
BH, et al: NADPH oxidase-derived free radicals are key oxidants in
alcohol-induced liver disease. J Clin Invest. 106:867–872. 2000.
View Article : Google Scholar : PubMed/NCBI
|
|
31
|
Weltman MD, Farrell GC, Hall P,
Ingelman-Sundberg M and Liddle C: Hepatic cytochrome P450 2E1 is
increased in patients with nonalcoholic steatohepatitis.
Hepatology. 27:128–133. 1998. View Article : Google Scholar : PubMed/NCBI
|
|
32
|
Shoelson SE, Herrero L and Naaz A:
Obesity, inflammation, and insulin resistance. Gastroenterology.
132:2169–2180. 2007. View Article : Google Scholar : PubMed/NCBI
|
|
33
|
Kensler TW, Wakabayashi N and Biswal S:
Cell survival responses to environmental stresses via the
Keap1-Nrf2-ARE pathway. Annu Rev Pharmacol Toxicol. 47:89–116.
2007. View Article : Google Scholar : PubMed/NCBI
|
|
34
|
Lee JY, Kang SS, Kim JH, Bae CS and Choi
SH: Inhibitory effect of whole bee venom in adjuvant-induced
arthritis. In Vivo. 19:801–805. 2005.PubMed/NCBI
|
|
35
|
Mousavi SM, Imani S, Haghighi S, Mousavi
SE and Karimi A: Effect of Iranian honey bee (Apis
mellifera) venom on blood glucose and insulin in diabetic rats.
J Arthropod Borne Dis. 6:136–143. 2012.PubMed/NCBI
|
|
36
|
Behroozi J, Divsalar A and Saboury AA:
Honey bee venom decreases the complications of diabetes by
preventing hemoglobin glycation. J Molec Liquids. 199:371–375.
2014. View Article : Google Scholar
|
|
37
|
Yang EJ, Jiang JH, Lee SM, Yang SC, Hwang
HS, Lee MS and Choi SM: Bee venom attenuates neuroinflammatory
events and extends survival in amyotrophic lateral sclerosis
models. J Neuroinflammation. 7:692010. View Article : Google Scholar : PubMed/NCBI
|
|
38
|
Kwak MK, Wakabayashi N, Itoh K, Motohashi
H, Yamamoto M and Kensler TW: Modulation of gene expression by
cancer chemopreventive dithiolethiones through the Keap1-Nrf2
pathway. Identification of novel gene clusters for cell survival. J
Biol Chem. 278:8135–8145. 2003. View Article : Google Scholar : PubMed/NCBI
|
|
39
|
Mo C, Wang L, Zhang J, Numazawa S, Tang H,
Tang X, Han X, Li J, Yang M, Wang Z, et al: The crosstalk between
Nrf2 and AMPK signal pathways is important for the
anti-inflammatory effect of berberine in LPS-stimulated macrophages
and endotoxin-shocked mice. Antioxid Redox Signal. 20:574–588.
2014. View Article : Google Scholar : PubMed/NCBI
|
|
40
|
Joo MS, Kim WD, Lee KY, Kim JH, Koo JH and
Kim SG: AMPK facilitates nuclear accumulation of Nrf2 by
phosphorylating at serine 550. Mol Cell Biol. 36:1931–1942. 2016.
View Article : Google Scholar : PubMed/NCBI
|
|
41
|
Hwang DS, Kim SK and Bae H: Therapeutic
effects of bee venom on immunological and neurological diseases
review. Toxins (Basel). 7:2413–2421. 2015. View Article : Google Scholar : PubMed/NCBI
|
|
42
|
Ram SKM, Jayapal N, Nanaiah P, Aswal GS,
Ramnarayan BK and Taher SM: The therapeutic benefits of bee venom.
Int J Curr Microbiol App Sci. 3:377–381. 2014.
|