Introduction
Osteoporosis is a common skeletal disorder
characterized by a decrease in bone mass and density, which results
in an increased risk of fractures among the elderly (1). Women, especially postmenopausal women,
are more susceptible to osteoporosis comparad to other groups. Bone
mass and strength achieved at the end of the growth period is
defined as peak bone mass (PBM), which is a significant determinant
of osteoporosis (2,3). It is regarded that an increase of PBM
by one standard deviation would reduce the fracture risk by 50%
(4).
Peripheral blood monocytes can serve as early
precursors of osteoclasts (5–7). A
growing body of literature has explored that blood monocytes
deliver many kinds of factors for bone metabolism, such as
interleukin-1 and tumor necrosis factor-α (8). Osteoclasts in peripheral skeleton
(9) and the central skeleton come
from circulating monocytes (10).
Substantial research has focused on the effect of circulating
monocytes on pathogenesis of osteoporosis in young and middle aged
adults.
Research in systems biology has shown that variety
in the activity of gene network and frame structure play an
important role in the disease progression (11,12).
Network-based systems biology approaches have emerged as powerful
tools for analysis of molecular mechanisms of diseases (13–16). An
integrated network method was applied to predict conserved
regulators related to high and low viral pathogenicity, leading to
therapeutic targets for intervention (17). In addition, recent study confirmed
that signaling entropy computable from integrating a gene
expression profile with a protein-protein interaction network
(PPIN), correlate with phenotypic plasticity and is increased in
disease compared to normal controls (18). Based on information theory, entropy
opens new perspectives for gene inference methods and increases the
accuracy of PPINs (19). Jin et
al (20) compared the
IAV-induced inflammatory regulatory networks and normal cellular
networks by integrating the data from the highly pathogenic avian
H5N1 and the pandemic H1N1 with PPINs, and these findings provide
significant hypotheses for further exploring the molecular
mechanisms of infectious diseases and developing control
strategies.
To gain insights into the indicating effect of PBM
to osteoporosis, this study focused on characterizing the PBM
networks and identifying key genes by combining high-throughput
data and computational techniques. In PPINs, we searched for genes
functionally significant for PBM variation, which might were
related to circulating monocytes in human premenopausal subjects.
The findings are expected to provide effective insights for further
exploring the pathology mechanisms of osteoporosis and obtaining
better treatment strategies.
Materials and methods
Datasets and construction of
PPINs
One biological data set E-GEOD-7158 of osteoporosis
was derived from the Gene Expression Omnibus (GEO) database
(http://www.ncbi.nlm.nih.gov/geo/)
(3). There were 12 monocyte low PBM
samples and 11 high PBM samples in the total 23 samples. The
platform is A-AFFY-44-Affymetrix GeneChip Human Genome U133 Plus
2.0 (HG-U133 Plus 2.0). The Linear Models for Microarray Data
(LIMMA) was then used to preprocess data. After quantile data
normalization performed by robust multi-array average (RMA)
(21), 20,545 genes were
obtained.
The human PPIN was collected from the Retrieval of
Interacting Genes (STRING; version 9.0) (22). Only edges whose correlations are
greater than the threshold δ were chosen, and set at 0.8. A total
of 8,590 nodes and 53,975 protein-protein interaction (PPI) sets
remained. Then we constructed anosteoporosis PPI subnet after
getting intersection with expression profiles and the PPIN, which
contained 7,953 genes and 48,778 PPI sets.
Identification of modules and paired
comparison
Using the human subnet as a backbone, we infer a
re-weighted PPIN with expression and mutation profiles of monocyte
low PBM and high PBM in osteoporosis. Every side of the constructed
PPIN was assigned with absolute value of Spearman correlation
coefficient of every interaction according to gene expression
data.
Based on clique-merging, module-identification
algorithm was used to identify modules from PPINs (23–25). We
found all maximal cliques from low and high PBM PPIN, and the nodes
<4 or >20 were filtered out. Then 8,002 maximal cliques in
osteoporosis were obtained.
We identified the set C of all maximal cliques of
size at least k in the two groups using a fast depth-first search
with pruning-based algorithm (CLIQUES). Next, we calculated its
weighted interaction density score (C) as (equation 1):
score(C)=∑u∈C,v∈Cw(u,v)|C|·(|C|-1)
We ranked these cliques in descending order of their
score (C) (23). A predefined
overlap-threshold t0=0.5 was set to go through the list
repeatedly. The modules were gathered by merging highly overlapping
cliques. Accordingly, we captured the effect of differences in
interaction weights between monocyte low and high PBM group via the
weighted density-based ranking of cliques.
The set of disrupted or altered module pairs were
identified by modeling it as a maximum weight bipartite matching.
The module correlation density was calculated between low and high
PBM group as follows (equation 2):
dcc(Si)=∑p,qεSiPCC((p,q),N)(|Si|2)
Characterizing networks from network entropy.
Destination networks were constructed with modules of common genes
of monocyte low and high PBM groups.
Network entropy, one of metrics of the inflammatory
network, was detected in osteoporosis (20). The local network entropy of a node i,
denoted Si, is defined as (equation 3):
Si=-1logkj∑j∈N(i)pijlogpij
In which, kj is the degree of node j,
N(i) is the set of neighbor nodes of node i and pij
defines a stochastic probability matrix on the PBM network, which
is defined by (equation 4):
pij=|cij|∑k∈N(i)cik
cij is the PCC between protein i and
j.
The global entropy of destination networks, denoted
S, is defined as follows (equation 5):
S=∑i=1nCiSi
n is the total number of nodes in the destination
networks, and Ci is the degree centrality of node i,
which is defined by (equation 6):
Ci=kin-1
The differential network entropy, denoted
ΔSi, is defined as follows (equation 7):
ΔSi=SiI-SiN
SiI, SNi
is the local network entropy of node i in low and high PBM
networks.
Significance test
The non-parametric one-tailed Wilcoxon rank sum test
was explored to judge whether the distributions of the global
entropy of low and high PBM networks were significantly different
(20). We first permutated sample
labels and recalculated the global entropy of the low PBM network,
which was repeated L times. The significance level (P-value) of the
tests was calculated by {#l|SIl
≤SNo bs for l =l,…,L}/L.
SIl and SNo bs are the
global entropy of the low PBM network at the 1st time-point and of
the high PBM network before this test, respectively. A P-value
<0.05 was used to define significantly differential network in
this study.
Animals and modeling
A total of 60 female SD rats were purchased from
Hebei Medical University Animal Center. All rats were housed at
room temperature with 12 h light-dark cycle, and fed with normal
chow diet and free access to water. The rat ovariectomy experiment
was approved by the Ethics Committee of Hebei Cangzhou Central
Hospital, (Cangzhou, China).
After a week of feeding, all rats were randomly and
on average separated into 2 groups in which rats were
ovariectomized and sham operated at the age of 6 months. Three
months after surgery, bone mineral density examination was used to
verify if the model was successfully established. All rats in
ovariectomized and sham groups were euthanized via exposure to
gradually increasing concentrations of isoflurane and carbon
dioxide gas (30% gradual-fill chamber vol/min), blood was drawn
from the abdominal aorta of rats in each group after the blood
pressure and the right femur and then the right femur and third
lumbar spine were quickly removed. The number of animals used and
their suffering was minimized. Surface-attached soft tissue were
removed, eardrums, vertebral bows and other accessories were
retained. The obtained bone tissue was packaged by gauze soaked
with saline, and kept at −80°C in a refrigerator. Dual-energy X-ray
absorptiometry (Lunar-DPX-IQ; GE Medical Systems, Madison, WI, USA)
was used to detect bone density of right femur and third lumbar
vertebra.
Reverse transcription-quantitative PCR
(RT-qPCR)
Venous blood sample of models were collected and
total RNA was extract by TRIzol RNA kit (Invitrogen; Thermo Fisher
Scientific, Inc., Waltham, MA, USA) according to the manufacturer's
instructions. The concentration and purity of total RNA were
measured by ultraviolet spectrophotometer. Reverse transcription
into cDNA was then conducted by a reverse cDNA transcription kit
(Takara Bio, Inc., Otsu, Japan). SYBR Ex Script RT-PCR kit (Takara
Bio, Inc.) was used to detect the expression of target genes and
the primers used in this study is shown in Table I.
 | Table I.The primer sequences for the
amplification of target genes. |
Table I.
The primer sequences for the
amplification of target genes.
| Genes | Sequences |
|---|
| PSMD7 |
5′-ATGGCACCGGCTCCGGACAG-3′ |
|
|
5′-ATGACCAGCACTGGAGACAC-3′ |
| PSMC1 |
5′-TGCTGGTCCCAGAGTCCTTGT-3′ |
|
|
5′-GGGCTAGAGAACTGCTCCGAT-3′ |
| PSMA2 |
5′-GTCGGATCCACCGTCAGCATGTCTG-3′ |
|
|
5′-GTCCTCGAGTCACTGGATTGCAGC-3′ |
| PSMB1 |
5′-TTGCTGCAATGCTGTCTACC-3′ |
|
|
5′-CTCTTTGGTCACGATGCAGA-3′ |
| GAPDH |
5′-CAAGTTCTCCGCCGATGTGA-3′ |
|
|
5′-GAACACGCCTGTGCCCTCAA-3′ |
Statistical analysis
GraphPad Prism version 5 software (GraphPad
Software, Inc., La Jolla, CA, USA) was used for statistical
analyses. All data were shown as mean ± standard deviation (SD).
For experiments with two groups, t-test was performed. P<0.05
was considered to indicate a statistically significant difference.
Experiments were repeated with a minimum of 3 times for each
condition.
Results
Identification of modules
We used the expression profile data to construct
PPINs for the low and high PBM group, respectively. Based on
merging highly overlapping cliques, we captured the effect of
differences in interaction weights between monocyte low and high
PBM group via the weighted density-based ranking of cliques. After
the simplification of the modules, 19 modules in low PBM network
and 38 in high PBM network were obtained. Then module correlation
density was calculated to identify sets of disrupting or altering
module pairs between the two networks. A total of 66 modules were
identified by modeling it as a maximum weight bipartite
matching.
Characterizing differential networks
from network entropy
We constructed 32 destination networks with modules
divided from monocyte low and high PBM networks. The
characteristics of 32 networks are shown in Table II. The network entropy was ranged
from −3.09 to 0.87 and the max value of network entropy of PBM was
0.87 in network 11. Among them, network 11 was the only
significantly differential one with P-value of 0.047 (P<0.05).
Fig. 1 shows the differential PBM
network with 8 nodes and 28 edges. All genes belonged to precursors
of osteoclasts, which were related to calcium transport as well as
blood monocytes. It indicated that the network was a novel
therapeutic indicator for osteoporosis during the bone monocyte
processes.
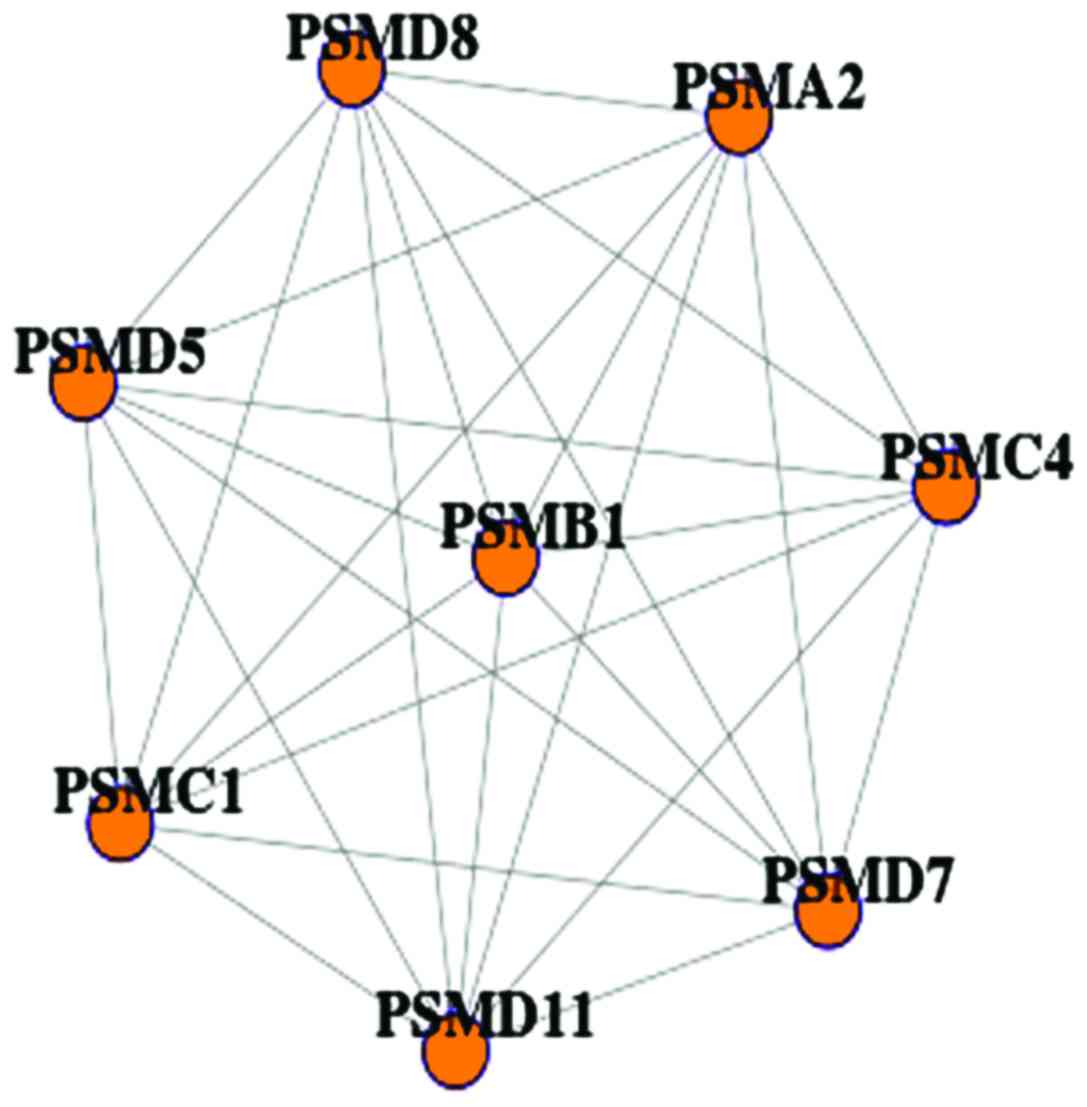 | Figure 1.The significantly differential
network divided from PBM PPI. The differential PBM network with 8
nodes and 28 edges, a total of 8 genes, PSMA2, PSMB1, PSMC1,
PSMC4, PSMD5, PSMD7, PSMD8 and PSMD11, were identified
in both monocyte low and high PBM networks. They belonged to
precursors of macropain, which were related to calcium transport as
well as blood monocytes. PBM, peak bone mass; PPI, protein-protein
interaction. |
| Table II.The characteristics of 32 destination
networks. |
Table II.
The characteristics of 32 destination
networks.
| No. | Network
entropy | P-value | No. | Network
entropy | P-value |
|---|
| 1 | 0.321978764 | 0.284 | 17 | 0.084248171 | 0.143 |
| 2 | −3.08756042 | 0.802 | 18 | −0.054693437 | 0.838 |
| 3 | −1.891414263 | 0.873 | 19 | −0.275293865 | 0.783 |
| 4 | −0.137286478 | 0.538 | 20 | 0.010982264 | 0.054 |
| 5 | −0.031619061 | 0.713 | 21 | −0.054693437 | 0.838 |
| 6 | −0.117506467 | 0.950 | 22 | −0.054693437 | 0.838 |
| 7 | −0.315852579 | 0.621 | 23 | 0.010982264 | 0.054 |
| 8 | −0.712615159 | 0.874 | 24 | −0.036448373 | 0.578 |
| 9 | −0.002127065 | 0.529 | 25 | −1.187984011 | 0.590 |
| 10 | −0.628285421 | 0.749 | 26 | −0.005631988 | 0.564 |
| 11 | 0.87169601 | 0.047 | 27 | −0.002146052 | 0.601 |
| 12 | 0.039361424 | 0.342 | 28 | 0.058539161 | 0.104 |
| 13 | 0.049041668 | 0.440 | 29 | 0.010982264 | 0.054 |
| 14 | −0.034142173 | 0.594 | 30 | −1.195662489 | 0.753 |
| 15 | −0.034142173 | 0.594 | 31 | −1.195662489 | 0.753 |
| 16 | −0.054693437 | 0.838 | 32 | 0.058539161 | 0.104 |
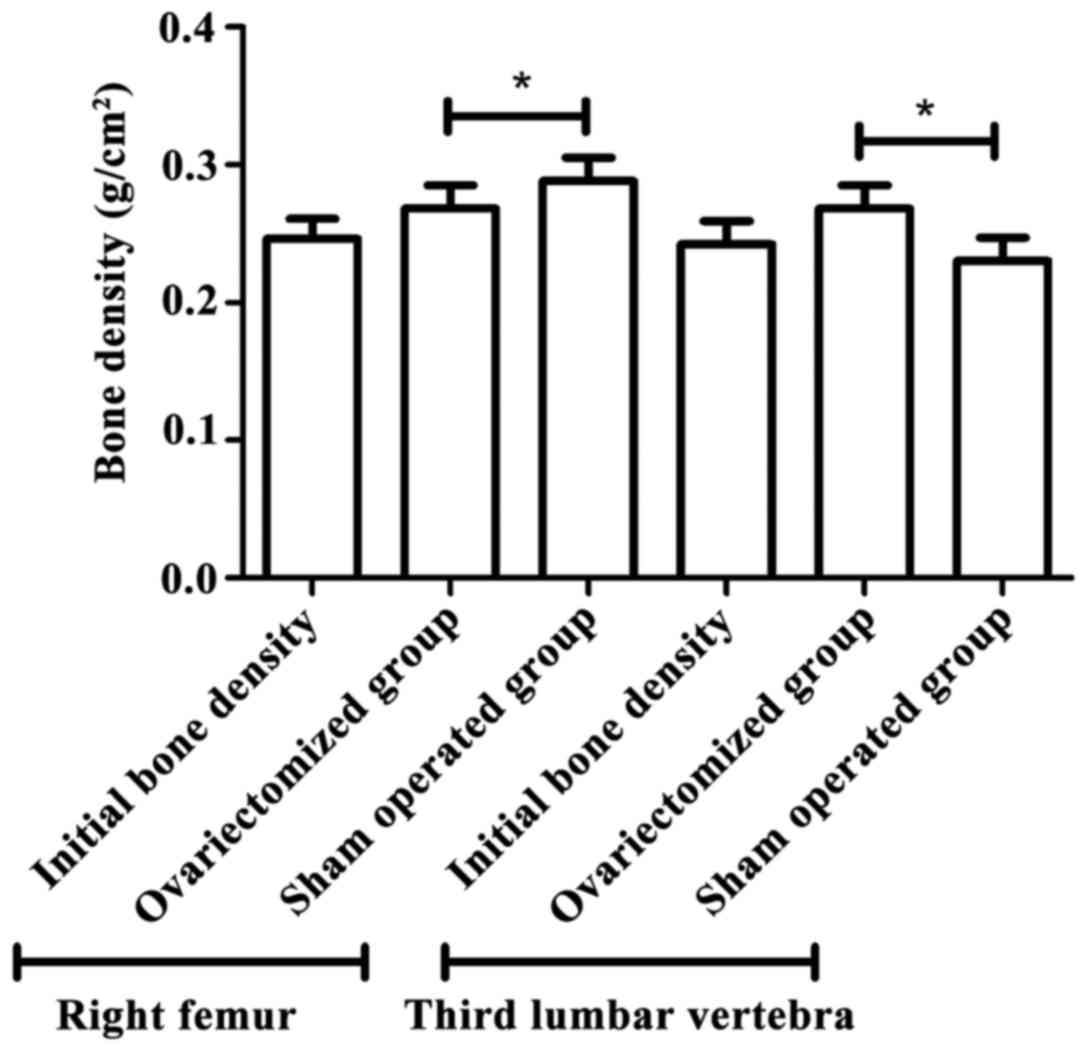
Bone density of osteoporosis
models
As shown in Fig. 2, 3
months after operation, bone density of right femur and third
lumbar vertebra in the osteoporosis group was significant lower
than that in the sham operated group (P<0.05). The result showed
that the model was successfully established.
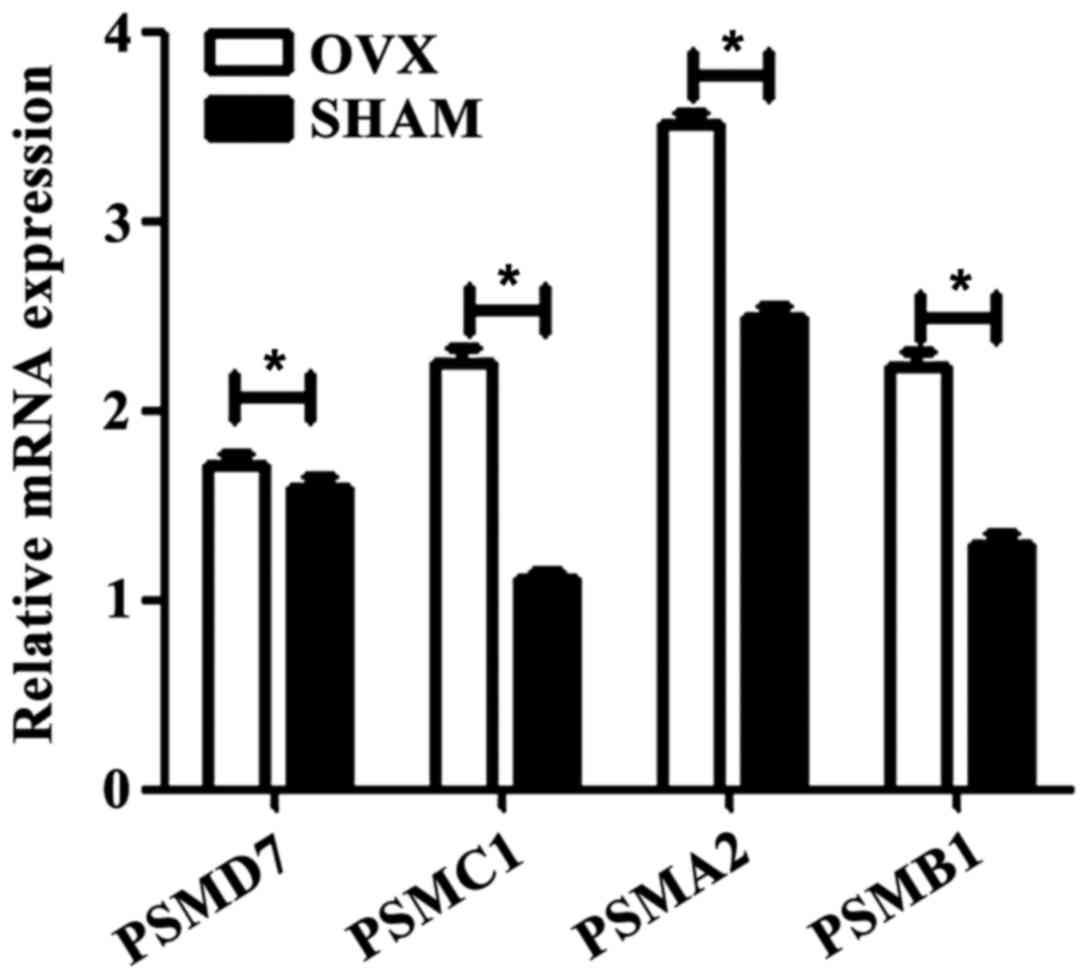
Expression of target genes in
osteoporosis models
The results of RT-qPCR showed that compared with
sham controls, the expression of target genes in osteoporosis was
obviously increased (Fig. 3). The
results indicated that these precursors of osteoclasts, such as
PSMD7, PSMC1, PSMA2 and PSMB1, are novel therapeutic
indicators for osteoporosis during the bone monocyte
progression.
Discussion
Recently genome-wide gene expression profiles and
PPIs hold the major promise to uncover the biological progression,
which are subsequently pivotal in getting across molecular
mechanisms of diseases (26). Based
on the landscape, functional network entropy can be readily
detected to facilitate the valuable application of PPIs on disease
research. Previous studies have revealed that increased entropy
appears to be a hallmark of cancer systems (27,28).
Thus we utilized the previous hypothesis that the network entropy
could discriminate the inflammatory network from the normal network
(20). The systematic calculation
and comparison were performed to test whether the network entropy
can also discriminate the low PBM network from high PBM network. By
applying a significance test for the difference in global network
entropy of low and high PBM networks, we found the global network
entropy of PBM networks is significantly differential (P<0.05).
The result claimed that the network entropy provided good
discrimination between low and high PBM networks. Moreover, this
method can serve as a significant foundation for further exploring
the molecular mechanisms of other diseases and developing control
strategies.
One unique advantage of the present method compared
with custom networks identifying analysis is that the entropy
performs better than other topological metrics of the network in
characterizing the inflammatory disease, which was detected by the
Network Analyzer plug-in in Cytoscape (20,29).
Thereby, the significantly different network we captured was more
valuable and promising in understanding molecular mechanisms of
diseases and reliable in therapeutic options.
Identifying key genes and modules from PPINs is of
great help for uncovering the biological functions of genes in
networks (30,31). In the present study, a total of 8
genes, PSMA2, PSMB1, PSMC1, PSMC4, PSMD5, PSMD7, PSMD8 and
PSMD11, were identified in both monocyte low and high PBM
networks. They belonged to precursors of macropain, which were
related to calcium transport as well as blood monocytes. In a
previous study, the surplus/PSMD5 was found to inhibit the assembly
and activity of 26S proteasome in human disease (32). Importantly, neuronal activity and
calcium/calmodulin-dependent protein kinase II could regulate the
expression of proteasome (33).
Intracellular calcium mobilization regulates the activity of 26S
proteasome during the metaphase-anaphase transition in meiotic cell
cycle (34). At the same time,
proteasome inhibitor lactacystin hinders the calcium homeostasis of
dopamine neurons (35). Similar
results were also obtained in this study, the results of RT-qPCR in
this study showed that compared with sham controls, the expression
of target genes in osteoporosis were obviously increased. In other
words, the method of network entropy could be used to detect
differential networks as indicator of disease. These 8 genes may
play important roles in controlling inflammation of the
osteoporosis. It suggested that the network is a novel therapeutic
indicator for osteoporosis during the bone monocyte progression.
These findings are helpful in disclosing the pathogenetic
mechanisms of osteoporosis.
Acknowledgements
Not applicable.
Funding
This study did not receive any specific grant from
funding agencies in the public, commercial, or not-for-profit
sectors.
Availability of data and materials
The datasets used and/or analyzed during the present
study are available from the corresponding author on reasonable
request.
Authors' contributions
GC and LM contributed to the conception and design
of the study. LM and HD contributed significantly to the
acquisition, analysis and interpretation of data. LM, HD and GC
performed the writing, review, and/or revision of this manuscript.
All authors have read and approved the final manuscript.
Ethics approval and consent to
participate
The rat ovariectomy experiment was approved by the
Ethics Committee of Hebei Cangzhou Central Hospital, (Cangzhou,
China).
Consent for publication
Not applicable.
Competing interests
The authors have no financial or personal
relationships with other people or organizations that could
inappropriately influence their work.
References
|
1
|
Czerwiński E, Badurski JE,
Marcinowska-Suchowierska E and Osieleniec J: Current understanding
of osteoporosis according to the position of the World Health
Organization (WHO) and International Osteoporosis Foundation. Ortop
Traumatol Rehabil. 9:337–356. 2007.PubMed/NCBI
|
|
2
|
Heaney RP, Abrams S, Dawson-Hughes B,
Looker A, Marcus R, Matkovic V and Weaver C: Peak bone mass.
Osteoporos Int. 11:985–1009. 2000. View Article : Google Scholar : PubMed/NCBI
|
|
3
|
Lei SF, Wu S, Li LM, Deng FY, Xiao SM,
Jiang C, Chen Y, Jiang H, Yang F, Tan LJ, et al: An in vivo
genome wide gene expression study of circulating monocytes
suggested GBP1, STAT1 and CXCL10 as novel risk genes for the
differentiation of peak bone mass. Bone. 44:1010–1014. 2009.
View Article : Google Scholar : PubMed/NCBI
|
|
4
|
Bonjour JP, Chevalley T, Ferrari S and
Rizzoli R: The importance and relevance of peak bone mass in the
prevalence of osteoporosis. Salud Publica Mex. 51 Suppl 1:S5–S17.
2009. View Article : Google Scholar : PubMed/NCBI
|
|
5
|
Udagawa N, Takahashi N, Akatsu T, Tanaka
H, Sasaki T, Nishihara T, Koga T, Martin TJ and Suda T: Origin of
osteoclasts: Mature monocytes and macrophages are capable of
differentiating into osteoclasts under a suitable microenvironment
prepared by bone marrow-derived stromal cells. Proc Natl Acad Sci
USA. 87:7260–7264. 1990. View Article : Google Scholar : PubMed/NCBI
|
|
6
|
Fujikawa Y, Quinn JM, Sabokbar A, McGee JO
and Athanasou NA: The human osteoclast precursor circulates in the
monocyte fraction. Endocrinology. 137:4058–4060. 1996. View Article : Google Scholar : PubMed/NCBI
|
|
7
|
Quinn JM, Neale S, Fujikawa Y, McGee JO
and Athanasou NA: Human osteoclast formation from blood monocytes,
peritoneal macrophages, and bone marrow cells. Calcif Tissue Int.
62:527–531. 1998. View Article : Google Scholar : PubMed/NCBI
|
|
8
|
Guasconi L, Chiapello LS and Masih DT:
Fasciola hepatica excretory-secretory products induce CD4+T
cell anergy via selective up-regulation of PD-L2 expression on
macrophages in a Dectin-1 dependent way. Immunobiology.
220:934–939. 2015. View Article : Google Scholar : PubMed/NCBI
|
|
9
|
Horton MA, Spragg JH, Bodary SC and
Helfrich MH: Recognition of cryptic sites in human and mouse
laminins by rat osteoclasts is mediated by beta 3 and beta 1
integrins. Bone. 15:639–646. 1994. View Article : Google Scholar : PubMed/NCBI
|
|
10
|
Parfitt AM: Osteonal and hemi-osteonal
remodeling: The spatial and temporal framework for signal traffic
in adult human bone. J Cell Biochem. 55:273–286. 1994. View Article : Google Scholar : PubMed/NCBI
|
|
11
|
Ma X, Gao L, Karamanlidis G, Gao P, Lee
CF, Garcia-Menendez L, Tian R and Tan K: Revealing pathway dynamics
in heart diseases by analyzing multiple differential networks. PLOS
Comput Biol. 11:e10043322015. View Article : Google Scholar : PubMed/NCBI
|
|
12
|
Mine KL, Shulzhenko N, Yambartsev A,
Rochman M, Sanson GF, Lando M, Varma S, Skinner J, Volfovsky N,
Deng T, et al: Gene network reconstruction reveals cell cycle and
antiviral genes as major drivers of cervical cancer. Nat Commun.
4:18062013. View Article : Google Scholar : PubMed/NCBI
|
|
13
|
Barabási AL, Gulbahce N and Loscalzo J:
Network medicine: A network-based approach to human disease. Nat
Rev Genet. 12:56–68. 2011. View Article : Google Scholar : PubMed/NCBI
|
|
14
|
Greenblum S, Turnbaugh PJ and Borenstein
E: Metagenomic systems biology of the human gut microbiome reveals
topological shifts associated with obesity and inflammatory bowel
disease. Proc Natl Acad Sci USA. 109:594–599. 2012. View Article : Google Scholar : PubMed/NCBI
|
|
15
|
Cho DY, Kim YA and Przytycka TM: Chapter
5: Network biology approach to complex diseases. PLOS Comput Biol.
8:e10028202012. View Article : Google Scholar : PubMed/NCBI
|
|
16
|
Scheffer M, Carpenter SR, Lenton TM,
Bascompte J, Brock W, Dakos V, van de Koppel J, van de Leemput IA,
Levin SA, van Nes EH, et al: Anticipating critical transitions.
Science. 338:344–348. 2012. View Article : Google Scholar : PubMed/NCBI
|
|
17
|
Mitchell HD, Eisfeld AJ, Sims AC,
McDermott JE, Matzke MM, Webb-Robertson BJ, Tilton SC, Tchitchek N,
Josset L, Li C, et al: A network integration approach to predict
conserved regulators related to pathogenicity of influenza and
SARS-CoV respiratory viruses. PLoS One. 8:e693742013. View Article : Google Scholar : PubMed/NCBI
|
|
18
|
Teschendorff AE, Banerji CR, Severini S,
Kuehn R and Sollich P: Increased signaling entropy in cancer
requires the scale-free property of protein interaction networks.
Sci Rep. 5:96462015. View Article : Google Scholar : PubMed/NCBI
|
|
19
|
Lopes FM, de Oliveira EA and Cesar RM Jr:
Inference of gene regulatory networks from time series by Tsallis
entropy. BMC Syst Biol. 5:612011. View Article : Google Scholar : PubMed/NCBI
|
|
20
|
Jin S, Li Y, Pan R and Zou X:
Characterizing and controlling the inflammatory network during
influenza A virus infection. Sci Rep. 4:37992014. View Article : Google Scholar : PubMed/NCBI
|
|
21
|
Irizarry RA, Hobbs B, Collin F,
Beazer-Barclay YD, Antonellis KJ, Scherf U and Speed TP:
Exploration, normalization, and summaries of high density
oligonucleotide array probe level data. Biostatistics. 4:249–264.
2003. View Article : Google Scholar : PubMed/NCBI
|
|
22
|
Franceschini A, Szklarczyk D, Frankild S,
Kuhn M, Simonovic M, Roth A, Lin J, Minguez P, Bork P, von Mering
C, et al: STRING v9.1: Protein-protein interaction networks, with
increased coverage and integration. Nucleic Acids Res. 41(D1):
D808–D815. 2013. View Article : Google Scholar : PubMed/NCBI
|
|
23
|
Srihari S and Ragan MA: Systematic
tracking of dysregulated modules identifies novel genes in cancer.
Bioinformatics. 29:1553–1561. 2013. View Article : Google Scholar : PubMed/NCBI
|
|
24
|
Liu G, Wong L and Chua HN: Complex
discovery from weighted PPI networks. Bioinformatics. 25:1891–1897.
2009. View Article : Google Scholar : PubMed/NCBI
|
|
25
|
Srihari S and Leong HW: A survey of
computational methods for protein complex prediction from protein
interaction networks. J Bioinform Comput Biol. 11:12300022013.
View Article : Google Scholar : PubMed/NCBI
|
|
26
|
Hong S, Dong H, Jin L and Xiong M: Gene
co-expression network and functional module analysis of ovarian
cancer. Int J Comput Biol Drug Des. 4:147–164. 2011. View Article : Google Scholar : PubMed/NCBI
|
|
27
|
Teschendorff AE and Severini S: Increased
entropy of signal transduction in the cancer metastasis phenotype.
BMC Syst Biol. 4:1042010. View Article : Google Scholar : PubMed/NCBI
|
|
28
|
West J, Bianconi G, Severini S and
Teschendorff AE: Differential network entropy reveals cancer system
hallmarks. Sci Rep. 2:8022012. View Article : Google Scholar : PubMed/NCBI
|
|
29
|
Assenov Y, Ramírez F, Schelhorn SE,
Lengauer T and Albrecht M: Computing topological parameters of
biological networks. Bioinformatics. 24:282–284. 2008. View Article : Google Scholar : PubMed/NCBI
|
|
30
|
Chen B, Fan W, Liu J and Wu FX:
Identifying protein complexes and functional modules - from static
PPI networks to dynamic PPI networks. Brief Bioinform. 15:177–194.
2014. View Article : Google Scholar : PubMed/NCBI
|
|
31
|
Li A, Chen M, Jiang TX, Wu P, Nie Q,
Widelitz R and Chuong CM: Shaping organs by a
wingless-int/Notch/nonmuscle myosin module which orients feather
bud elongation. Proc Natl Acad Sci USA. 110:E1452–E1461. 2013.
View Article : Google Scholar : PubMed/NCBI
|
|
32
|
Shim SM, Lee WJ, Kim Y, Chang JW, Song S
and Jung YK: Role of S5b/PSMD5 in proteasome inhibition caused by
TNF-α/NFκB in higher eukaryotes. Cell Rep. 2:603–615. 2012.
View Article : Google Scholar : PubMed/NCBI
|
|
33
|
Djakovic SN, Schwarz LA, Barylko B,
DeMartino GN and Patrick GN: Regulation of the proteasome by
neuronal activity and calcium/calmodulin-dependent protein kinase
II. J Biol Chem. 284:26655–26665. 2009. View Article : Google Scholar : PubMed/NCBI
|
|
34
|
Kawahara H and Yokosawa H: Intracellular
calcium mobilization regulates the activity of 26 S proteasome
during the metaphase-anaphase transition in the ascidian meiotic
cell cycle. Dev Biol. 166:623–633. 1994. View Article : Google Scholar : PubMed/NCBI
|
|
35
|
Li X, Yang D, Li L, Peng C, Chen S and Le
W: Proteasome inhibitor lactacystin disturbs the intracellular
calcium homeostasis of dopamine neurons in ventral mesencephalic
cultures. Neurochem Int. 50:959–965. 2007. View Article : Google Scholar : PubMed/NCBI
|