Introduction
Cisplatin (Cis), whose antineoplastic efficacy was
discovered in 1960s, is a platinum-derivative antineoplastic agent
used to treat a variety of solid organ tumors such as testis,
ovaries, urinary bladder, head and neck, brain, and lungs (1–5). Despite
its potent antineoplastic efficacy, Cis's toxic side effects during
treatment such as nephrotoxicity, neurotoxicity, ototoxicity,
myelosuppression, hepatotoxicity limits its clinical use (1–5). Studies
investigating the relationship between Cis dose and toxic side
effects have mostly suggested a correlation between Cis's
cumulative dose and toxic side effects. This is particularly
prominent for the liver and hematopoietic system (1–6).
However, it has been shown that hepatotoxicity may also develop
after a single dose or low repeated doses (1).
Although there is no consensus as to the mechanism
of Cis-induced hepatotoxicity, the two most widely recognized views
are the shift of the antioxidant balance towards oxidative stress
and acceleration of apoptosis (1,3,7). Cells exposed to oxidative stress
eliminate reactive oxygen species (superoxide, hydroxyl, hydrogen
peroxide) and reactive nitrogen species [nitric oxide (NO),
nitrogen dioxide, and peroxynitrite] by using endogenous enzymatic
antioxidants (SOD, GSH-Px, CAT, GSR), endogenous nonenzymatic
antioxidants (GSH, thioredoxin, melatonin), and exogenous
antioxidants (ascorbic acid, α-tocopherol, retinol, α-carotene,
β-carotene, lycopene, cryptoxanthin, zinc, copper, manganese, iron,
selenium, flavonoids, phenols, phenolic acid, lignins, tannins).
Experimental studies using many antioxidants, free radical
scavengers, and natural herbal compounds have been conducted to
prevent Cis's side effects without limiting its antineoplastic
efficacy. Other than the above-mentioned antioxidants, antioxidant
substances including apocynin, thymoquinone, naringenin-oxime,
curcumin, silymarin, resveratrol, gingko, phosphomycine, sodium
thiosulfate, n-acetyl-cysteine, methionine, taurine, and
dexpanthenol (Dexp) have been most heavily studied in the
literature.
Dexp is a pantothenic acid (PA) analogue oxidized to
PA in peripheral tissues. PA and its derivatives are known to
increase reduced glutathione (GSH) and coenzyme A (CoA) levels and
augment ATP synthesis. All of these functions play an important
role for cellular protection against oxidative stress and
inflammatory response (1,8–13).
Therefore, studies on antineoplastic agents exerting toxic side
effects through oxidative stress mechanism have traditionally used
Dexp. In this experimental study, we aimed to investigate the
protective effects of Dexp against Cis-induced hepatotoxicity.
Materials and methods
Rat selection
Thirty-two Sprague Dawley rats aged 11 to 12 weeks
weighing 230 to 300 grams were obtained from Experimental Animal
Research Center of Inonu University, Malatya, Turkey. The rats were
fed on standard rat feed and provided water ad libitum. They were
kept under laboratory conditions (21±2°C, % 60±5 moisture and 12:12
h light/dark cycle). All procedures applied to the rats complied
with the National Health Institute's Guidelines for Animal
Research. The experimental groups were formed by the simple
randomization technique.
Institutional approvals
This study was approved by Inonu University Faculty
of Medicine Animal Research Ethics Committee (2016/A-36). It was
funded by Inonu University Scientific Research Project Coordination
Unit (Project no. 2016/179).
Experimental design
Thirty-two rats were divided into four groups each
containing an equal number of rats (n=8). The study groups were
defined as follows: The rats of the control group were not
administered anything else than standard rat feed and water. The
rats in the Dexp group were administered a single dose
intraperitoneal Dexp at a dose of 500 mg/kg for 3 days (Bepanthene
500 mg vials, Bayer Corp, Istanbul, Turkey) (12). The dosage range at which Dexp exerts
its cytoprotective effect has been shown by the previous studies.
Hence, we calculated the effective Dexp dose on the basis of the
literature studies (4,8,12).
Although the duration of Dexp use ranged between 1 and 12 days in
the previous experimental studies about the Dexp's cytoprotective
effect, we limited that duration to 3 days (12). The rats in the Cis group were
administered a single dose of Cis at a dose of 7 mg/kg only on the
first day of the study (Cis 50 mg vials; Kocak Pharma, İstanbul,
Turkey) (2,7). The dosage range at which Cis exerts its
cytotoxic (hepatotoxic) effects has been shown by the previous
experimental studies (2,7). The rats in the Cis+Dexp group were
administered intraperitoneal Dexp at a dose of 500 mg/kg for three
days. One hour after the first Dexp dose a single intraperitoneal
dose of 7 mg/kg Cis was administered. All rats were sacrificed by
ketamine hydrochloride (Ketalar 500 mg vials; Pfizer Inc., NY, USA)
overdose at the end of the fourth day of the follow-up period.
Immediately before the scarification procedure blood samples were
collected from the inferior vena cava for biochemical analysis.
Hepatectomy was carried out after blood collection, and part of the
hepatectomy material was fixated with formalin for
histopathological examination and the remaining tissues were stored
at −70°C for biochemical analysis.
Biochemical analysis
At the end of study period, the animals were
anesthetized and blood samples were withdrawn into evacuated tubes
by vena cava inferior puncture. Then the rats were sacrificed and
taken their livers. The liver samples were frozen at −70°C until
assayed. The liver samples were homogenized in cold phosphate
buffer (20 mmol; pH 7.4; containing protease inhibitor cocktail,
BioShop Canada Inc., Burlington, ON, Canada) with a homogenizer
(IKA ultra turrax T 25 basic) at 16,000 rpm for 3 min at +4°C. The
homogenats were centrifuged at 10,000 × g for 20 min at +4°C and
the obtained supernatants were used to measure the levels of MDA,
GSH, GSH-Px, CAT, total nitrite, IL-1β, IL-6, TNF-α, TAS, and TOS.
The blood samples taken from rats were centrifuged at 2,000 × g for
10 min at +4°C and the obtained serum samples were used to measure
the levels of GSH, TAS, TOS, total nitrite, l-arginine, ADMA, and
SDMA. The serum samples were frozen at −70°C until assayed.
Malondialdehyde (MDA) assay
MDA, referred to as thiobarbituric acid reactive
substances (TBARS), was measured with thiobarbituric acid at 535
and 520 nm in spectrophotometer using a microplate reader (Synergy
H1; BioTek Instruments, Inc.) as previously described (14). Results were reported as nmol/g wet
tissue for tissue.
Reduced GSH assay
GSH concentrations in the homogenate and serum
samples were measured according to the spectrophotometric Ellman's
method (15). Results were reported
as nmol/g wet tissue for tissue and micromole/l for serum.
Catalase (CAT) activity assay
CAT activity was determined according to the method
of Aebi (16) by monitoring the
initial rate of disappearance of hydrogen peroxide (initial
concentration 10 mM) at 240 nm in a spectrophotometer (microplate
reader; Synergy H1). Results were reported as constant rate per
gram protein (K/g protein).
GSH-peroxidase (Px) activity
assay
GSH-Px activity was measured according to Paglia and
Valentine (17) by monitoring the
oxidation of reduced nicotinamide adenine dinucleotide phosphate
(NADPH) at 340 nm. Results were reported as units per gram protein
(U/g protein).
Protein assay
Protein concentrations of the supernatant samples
were measured the method of Lowry et al (18).
NO assay
NO level of the supernatant and serum samples was
measured as total nitrite with the spectrophotometric Griess
reaction. Because, it was showed that plasma nitrite/nitrate is an
index of endogenous NO production (19,20). The
procedure was partly adapted from the method described by Ozbek
et al (21) Results were
reported as nanomole/g wet tissue for tissue and micromole/liter
for serum.
Measurement of the supernatant and
serum ADMA, SDMA, and L-arginine levels
The supernatant and serum ADMA, SDMA, and L-arginine
concentrations were measured with high performance liquid
chromatography using commercially available kits (Eureka Laboratory
Division s.r.l., Chiaravalle, Italy). The results were expressed as
micromole/liter.
Measurement of the supernatant and
serum total antioxidant status (TAS) and total oxidant status (TOS)
levels
The supernatant and serum TAS and TOS concentrations
were measured with spectrophotometer (microplate reader; Synergy
H1) using commercially available kits (Rel Assay Diagnostics,
Gaziantep, Turkey). The results were expressed as millimole Trolox
Eqv/liter for TAS and micromole H2O2
Eqv/liter for TOS.
Measurement of the supernatant IL-1β,
IL-6, TNF-α levels
The supernatant IL-1β, IL-6, TNF-α levels was
measured spectrophotometrically using Elabscience Raybiotech
commercial kits (microplate reader; Synergy H1).
Oxidative stress index (OSI)
The ratio of TOS to TAS was accepted as OSI. The OSI
value was calculated according to the following formula: OSI
(arbitrary unit)=TOS (micromole H2O2 Eqv/liter)/TAS (millimole
Trolox Eqv/liter) (22).
Histopathological analysis
Liver tissue was fixed in 10% formalin and was
embedded in paraffin. Tissue sections were cut at 4 µm, mounted on
slides, stained with hematoxylin and eosin (H&E) for general
liver structure, Periodic Acid Schiff (PAS) to demonstrate the
glycogen deposition in hepatocytes and Kupffer cells. The liver
damage was semi quantitatively assessed as follows; sinusoidal
congestion, and loss of the glycogen deposition in hepatocytes. The
sinusoidal congestion, and glycogen loss were scored between 0–3; 0
was defined as normal liver, 1 was defined as liver damage
involving ≤25% of liver, 2 was defined as liver damage involving
25–50% of liver and 3 was defined as liver damage involving ≥50% of
liver. For each criterion, ten fields were examined in X20
objective magnification. In addition, Kupffer cells were counted
manually on digital images Leica Q Win analysis system using point
counting. For each animal, three sections were used. In each
section, 10 fields were randomly chosen at 40X, totaling 30 fields
per animal.
Immunohistochemical analysis
After deparaffinization and rehydration procedures,
sections were placed in antigen retrieval solution (citrate buffer,
pH 6.0) and boiled in a pressure cooker for 20 min and cooled to
room temperature for 20 min. Then the sections were washed with
phosphate-buffered saline (PBS). After washing the sections, 3%
hydrogen peroxide solution was applied to block endogenous peroxide
for 15 min at room temperature and washed with PBS. Then protein
block was applied to the sections. The sections were incubated with
caspase-3 primary antibody (rabbit polyclonal; Thermo Fisher
Scientific, Inc.) for 60 min, then were rinsed in PBS and incubated
with biotinylated goat anti polyvalent for 20 min and streptavidin
Px for 20 min at room temperature. Staining was completed with
chromogen+substrate for 10 min, and slides were counter stained
with Mayer's hematoxylin for 1 min, rinsed in tap water, and
dehydrated. Caspase-3 positive cells stained as brown color. The
expression of caspase-3 was assessed as follows: 0, no expression;
1, minimal expression (involving ≤25% of liver); 2, moderate
expression (involving 25–50% of liver) and 3, severe expression
(involving ≥50% of liver). For this analysis ten fields were
examined in objective magnification, ×20. All sections were
evaluated using a Leica DFC280 light microscope and a Leica Q Win
Image Analysis system (Leica Micros Imaging Solutions Ltd.,
Cambridge, UK).
Statistical analysis
The results of the histologic examination were
compared using SPSS software (Chicago, IL, USA) version 17 for
Microsoft Windows. Mann-Whitney U (Bonferroni) test was used for
comparison between groups. The results of the biochemical analysis
were compared using SPSS software (SPSS, Chicago, IL, USA) version
22.0 for Microsoft Windows. Kruskal-Wallis test was used for
comparison between groups. When significant differences were
determined in Kruskal-Wallis test, pairwise comparisons were carry
out using Conover's test. The results are expressed as the med
(min-max). P<0.05 was considered to indicate a statistically
significant difference.
Results
Biochemical results
Tissue biochemical results
As all biochemical parameters measured in the liver
tissues showed a nonparametric distribution, Kruskal-Wallis test
was used for inter-group comparisons. There were significant
inter-group differences with respect to MDA (P=0.001), GSH
(P=0.001), CAT (P=0.001), GHS-Px (P=0.001), Total Nitrite
(P=0.001), TAS (P=0.001), TOS (P=0.001), OSI (P=0.001) and IL-6
(P=0.017) levels whereas tissue L-1β (P<0.081) and TNF-α
(P<0.322) levels were comparable. For groups that were found to
have statistical differences, Conover test was applied to find out
the different pairs. Significant differences were found between all
groups with respect to tissue MDA, CAT and Total Nitrite levels.
Whereas there were no significant differences between the Control
and Dexp groups in terms of tissue GHS-Px, TOS and OSI, the Cis and
Cis+Dexp groups showed significant differences from the other
groups. Whereas the Control and Cis groups did not show any
significant differences for tissue GSH level, Dexp and Cis+Dexp
groups were significantly different from the other groups. Although
no significant differences existed between the control and Cis+Dexp
groups with regard to tissue TAS level, the Dexp and Cis groups
were significantly different from the other groups. A significant
difference existed between tissue IL-6 levels of the Dexp and Cis
groups. Table I summarizes the
results of the tissue biochemical parameters.
 | Table I.Comparison of biochemical parameters
measured in liver tissue. |
Table I.
Comparison of biochemical parameters
measured in liver tissue.
| Parameters | Group | Median | Minimum | Maximum | P |
|---|
| MDA (nmol/gr wet
tissue) | Controla | 659.9 | 592.9 | 854.2 | 0.001 |
|
| Dexpb | 512.5 | 197.6 | 629.8 |
|
|
| Cisc | 1334.9 | 783.9 | 1999.9 |
|
|
| Cis+Dexpd | 904.5 | 673.3 | 1139 |
|
| GSH (nmol/gr wet
tissue) |
Controla | 2035.2 | 1781.9 | 2140.9 | 0.001 |
|
| Dexpb | 2769.1 | 2602.4 | 3198.6 |
|
|
| Cisc | 1612.1 | 1346.1 | 1865.3 |
|
|
| Cis+Dexpa | 2019.1 | 1852.5 | 2506.3 |
|
| CAT (K/g
protein) |
Controla | 24.1 | 20.1 | 30.3 | 0.001 |
|
| Dexpb | 51.4 | 48.4 | 57.2 |
|
|
| Cisc | 13.2 | 12.3 | 15.9 |
|
|
| Cis+Dexpd | 30.7 | 25.3 | 39.2 |
|
| GSH-Px (U/g
protein) |
Controla | 101.1 | 90.0 | 118.3 | 0.001 |
|
| Dexpa | 107 | 95.9 | 125.9 |
|
|
| Cisb | 59.8 | 45.4 | 95.47 |
|
|
| Cis+Dexpa | 89.2 | 71.8 | 108.1 |
|
| Tot Nit (nmol/gr
wet tissue) |
Controla | 275.4 | 266.4 | 298.8 | 0.001 |
|
| Dexpb | 349.2 | 288 | 381.6 |
|
|
| Cisc | 248.4 | 216 | 273.6 |
|
|
| Cis+Dexpd | 298.8 | 266.4 | 324 |
|
| TAS (mmol Trolox
Eqv/l) |
Controla | 2.2 | 2.1 | 2.54 | 0.001 |
|
| Dexpb | 2.5 | 2.4 | 2.6 |
|
|
| Cisc | 1.8 | 1.7 | 1.85 |
|
|
| Cis+Dexpa | 2.1 | 1.9 | 2.31 |
|
| TOS (µmol
H2O2 Eqv/l) |
Controla | 26.2 | 19.5 | 33.8 | 0.001 |
|
| Dexpa | 24.1 | 20.1 | 31.8 |
|
|
| Cisb | 39.1 | 35.2 | 46.4 |
|
|
| Cis+Dexpc | 33.3 | 26.2 | 35.1 |
|
| OSI (µmol
H2O2 Eqv/mmol Trolox Eqv) |
Controla | 11.9 | 7.7 | 15.6 | 0.001 |
|
| Dexpa | 9.7 | 7.8 | 13.1 |
|
|
| Cisb | 21.8 | 20.1 | 25.9 |
|
|
| Cis+Dexpc | 15.5 | 11.5 | 16.8 |
|
| IL-1β (pg/ml) |
Controla | 23.3 | 18.4 | 42.8 | 0.081 |
|
| Dexpa | 16.4 | 12.9 | 67.7 |
|
|
| Cisa | 26.8 | 19.4 | 63.4 |
|
|
| Cis+Dexpa | 35.9 | 20.5 | 41.7 |
|
| IL-6 (pg/ml) |
Controla | 13.8 | 5.8 | 20.5 | 0.017 |
|
| Dexpa | 11.7 | 4.5 | 20.1 |
|
|
| Cisb | 28.8 | 13.8 | 60.1 |
|
|
| Cis+Dexpa | 17.1 | 6.3 | 34.6 |
|
| TNF-α (pg/ml) |
Controla | 263.6 | 167.7 | 332.4 | 0.322 |
|
| Dexpa | 237.7 | 141.5 | 300.1 |
|
|
| Cisa | 293.6 | 219.5 | 441.6 |
|
|
| Cis+Dexpa | 242.4 | 222.4 | 361.9 |
|
Serum biochemistry results
As all biochemical parameters obtained from the
serum samples showed a nonparametric distribution, inter-group
comparisons were carried out using the Kruskal-Wallis test. The
groups had significant differences with regard to serum GSH
(P=0.014), TAS (P=0.003), OSI (P=0.004), Total Nitrite (P=0.003),
L-Arginine (P=0.003), ADMA (P=0.026) and SDMA (P=0.022) levels
whereas serum TOS (P<0.058) levels were similar. Serum
biochemistry results were presented on Table II.
| Table II.Comparison of biochemical parameters
measured in serum samples. |
Table II.
Comparison of biochemical parameters
measured in serum samples.
| Parameters | Groups | Median | Minimum | Maximum | P |
|---|
| GSH (µmol/l) |
Controla | 15.9 | 15.7 | 16,3 | 0.014 |
|
| Dexpb | 19.2 | 17.3 | 19,4 |
|
|
| Cisa | 15.9 | 14.3 | 17,1 |
|
|
| Cis+Dexpb | 17.7 | 16.3 | 19,1 |
|
| TAS (mmol Trolox
Eqv/l) |
Controla | 1.3 | 1.3 | 1.3 | 0.003 |
|
| Dexpb | 1.7 | 1.4 | 1.9 |
|
|
| Cisc | 1.1 | 1.1 | 1.1 |
|
|
| Cis+Dexpb | 1.6 | 1.4 | 1.6 |
|
| TOS (µmol
H2O2 Eqv/l) |
Controla | 41.2 | 38.8 | 42.8 | 0.058 |
|
| Dexpa | 35.2 | 32.4 | 38.4 |
|
|
| Cisa | 49.6 | 33.6 | 55.6 |
|
|
| Cis+Dexpa | 44.4 | 37.6 | 44.8 |
|
| OSI (µmol
H2O2 Eqv/mmol trolox Eqv) |
Controla | 32.6 | 30.6 | 32.9 | 0.004 |
|
| Dexpb | 20.1 | 16.8 | 27.9 |
|
|
| Cisa | 47.1 | 30.9 | 54.3 |
|
|
| Cis+Dexpb | 27.2 | 26.9 | 27.3 |
|
| Tot Nit
(µmol/l) |
Controla | 33.9 | 32.9 | 34.8 | 0.003 |
|
| Dexpb | 45.2 | 44.3 | 48.0 |
|
|
| Cisa | 32.5 | 31.1 | 33.9 |
|
|
| Cis+Dexpc | 36.7 | 35.8 | 37.7 |
|
| L-Arjinin
(µmol/l) |
Controla | 0.5 | 0.3 | 0.7 | 0.003 |
|
| Dexpa | 0.4 | 0.3 | 0.5 |
|
|
| Cisb | 6.2 | 5.8 | 6.8 |
|
|
| Cis+Dexpc | 5.5 | 5.3 | 5.6 |
|
| ADMA (µmol/l) |
Controla | 0.2 | 0,2 | 0.3 | 0.026 |
|
| Dexpa | 0.4 | 0,2 | 0.4 |
|
|
| Cisb | 0.5 | 0,2 | 0.6 |
|
|
| Cis+Dexpa | 0.2 | 0,1 | 0.3 |
|
| SDMA (µmol/l) |
Controla | 0.5 | 0.4 | 0.5 | 0.022 |
|
| Dexpa | 0.4 | 0.3 | 0.5 |
|
|
| Cisb | 0.6 | 0.5 | 0.7 |
|
|
| Cis+Dexpa | 0.4 | 0.4 | 0.5 |
|
Histopathological results
Hematoxylin and eosin
Liver tissue of the Control and Dexp groups showed
entirely normal histological appearance but minimal changes.
Sinusoidal congestion was the most prominent alteration in the Cis
group. Furthermore, hepatocytes with eosinophilic cytoplasm and
pyknotic nuclei were detected in some sections. The Cis+Dexp group
showed similarities with the Cis group in terms of histological
changes. Table III shows
congestion scores of the study groups.
| Table III.Comparison of groups interms of
histopathological and immunhistochemical findings. |
Table III.
Comparison of groups interms of
histopathological and immunhistochemical findings.
| Parameters | Control | Dexp | Cis | Cis+Dexp |
|---|
| Congestion |
| Median
(min-max) | 1.0 (0.0–2.0) | 1.0 (0.0–2.0) | 1.0
(0.0–3.0)a | 1.0
(0.0–3.0)c |
| Mean ±
SD | 0.56±0.58 | 0.70±0.60 | 1.13±0.66 | 1.30±0.60 |
| Glycogen loss |
| Median
(min-max) | 0.0 (0.0–3.0) | 0.0 (0.0–3.0) | 2.0
(0.0–3.0)a | 1.0 (0.0–2.0)b |
| Mean ±
SD | 0.57±0.69 | 0.49±0.83 | 2.09±0.65 | 0.69±0.65 |
| Kupffer cells |
| Median
(min-max) | 1.0 (0.0–5.0) | 1.0 (0.0–6.0) | 5.0
(0.0–20.0)a | 1.0
(0.0–8.0)b |
| Mean ±
SD | 1.35±1.30 | 1.22±1.50 | 5.46±3.79 | 1.63±1.60 |
| Caspase-3
expression |
| Median
(min-max) | 0.0 (0.0–1.0) | 0.0 (0.0–1.0) | 1.0
(0.0–3.0)a | 0.0
(0.0–1.0)b |
| Mean ±
SD | 0.15±0.36 | 0.33±0.47 | 1.02±0.85 | 0.12±0.32 |
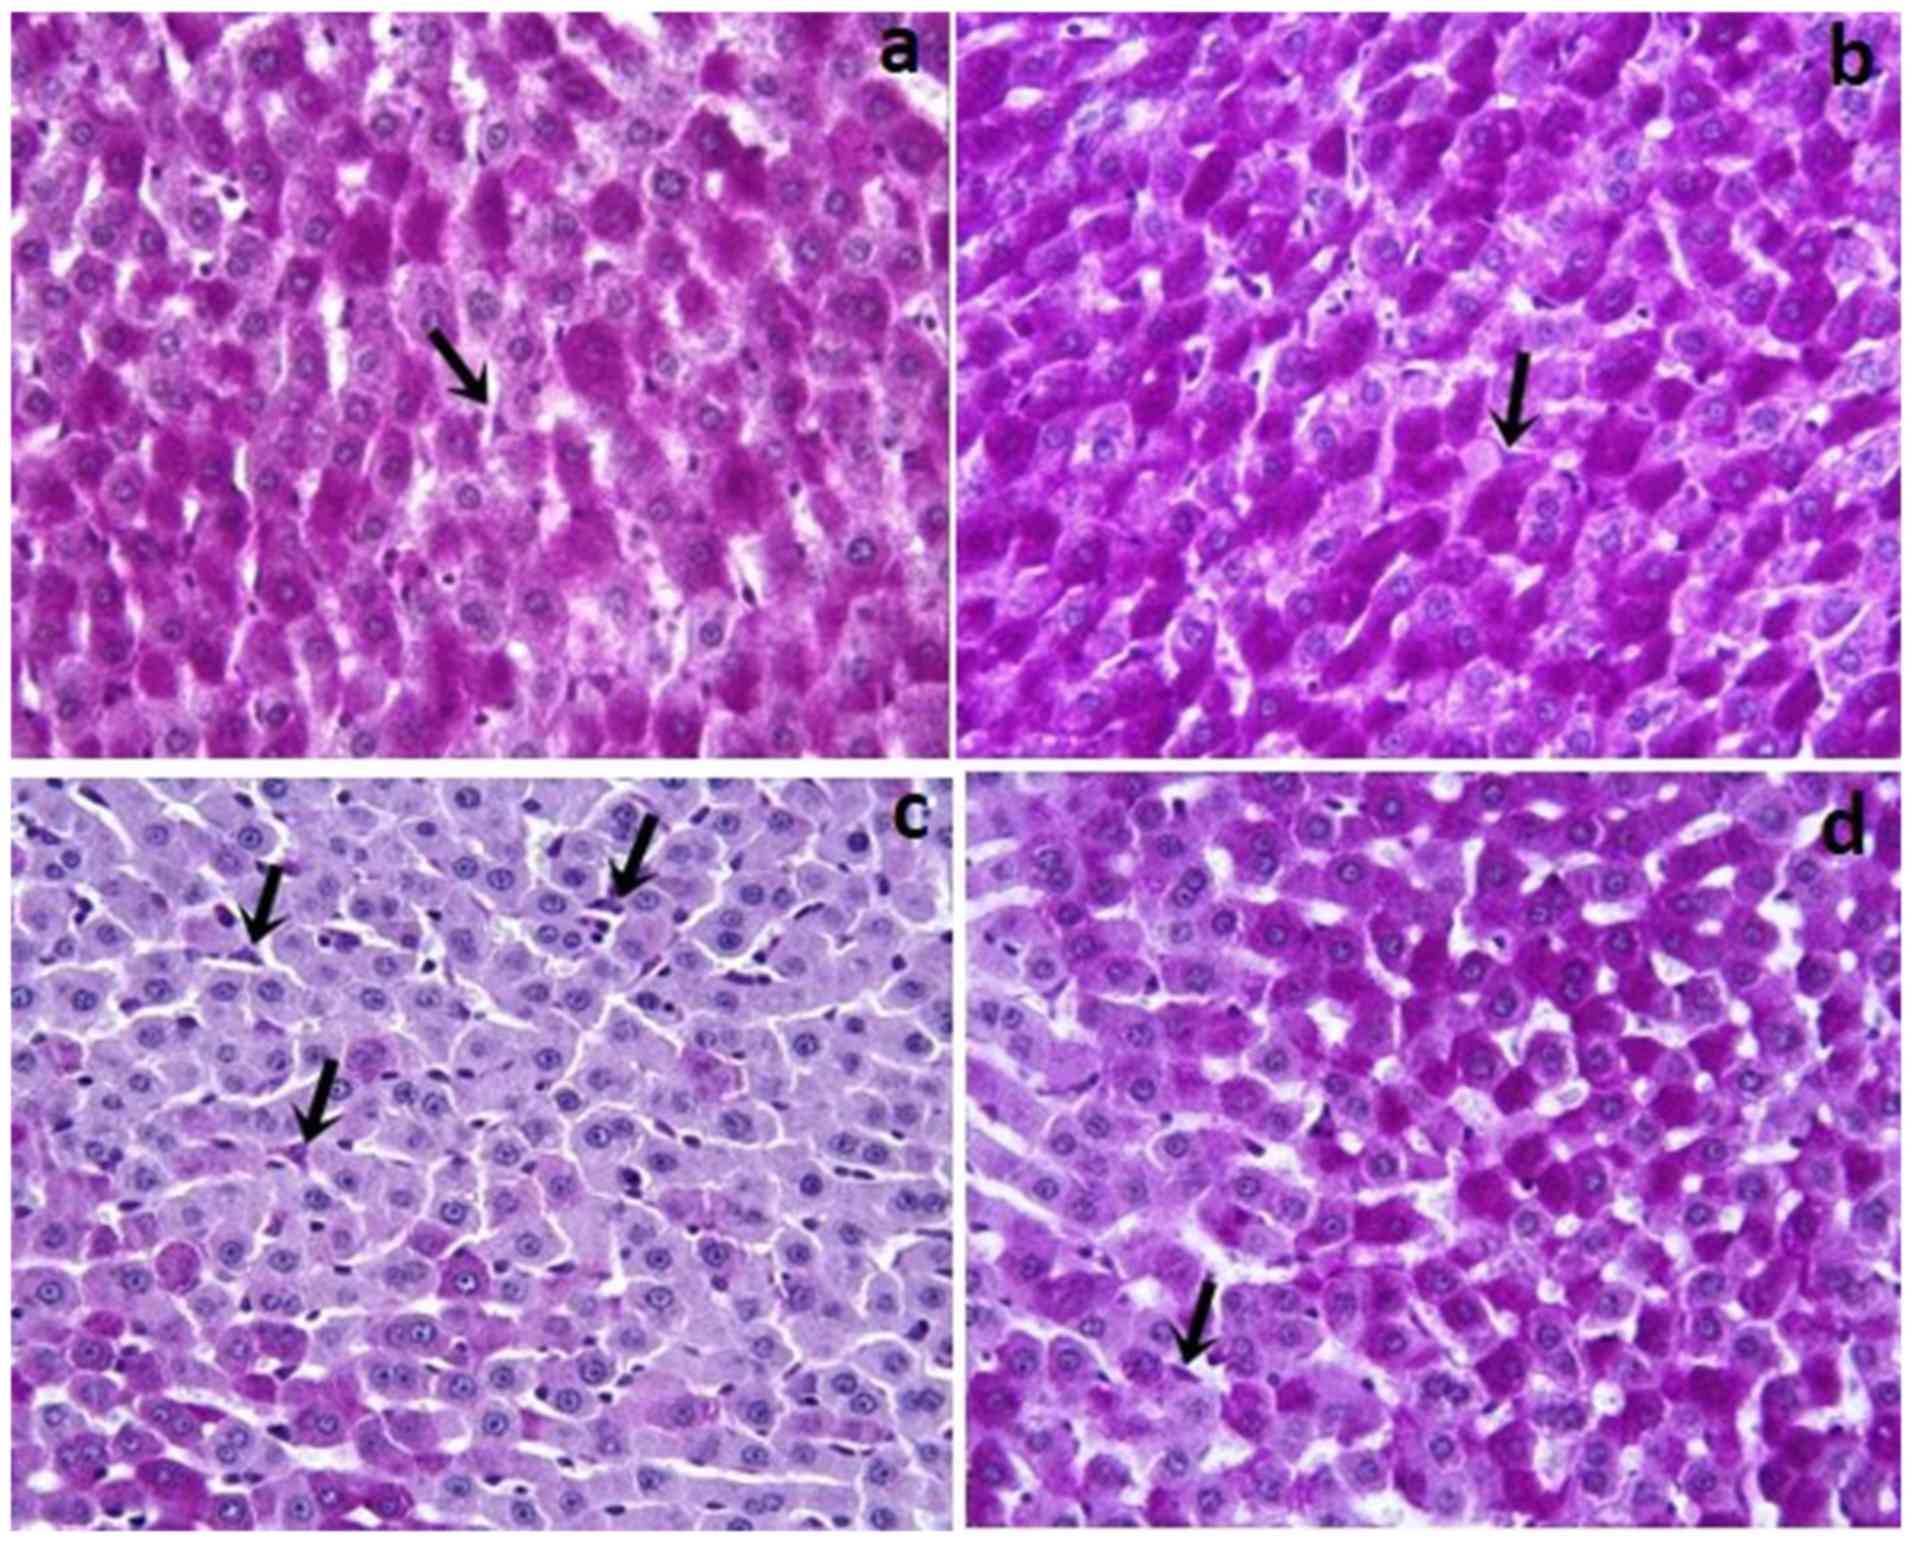
PAS
In the Control and Dexp groups, glycogen and Kupffer
cells (Fig. 1a and b) in the
hepatocyte cytoplasm were stained with pink and purple stain. As
compared with the controls, the Cis group showed a reduced amount
of glycogen accumulation in hepatocytes (P<0.001). Additionally,
the Cis group, as compared to the Control and Dexp groups, had a
significantly increased number of Kupffer cells (Fig. 1c) (P<0.001). In the Dexp group,
glycogen loss in hepatocytes was significantly reduced (Fig. 2d) (P<0.001). Furthermore, Cis+Dexp
group showed a significant reduction in the number of Kupffer cells
as compared to the Cis group. (Fig.
1d) (P<0.001).
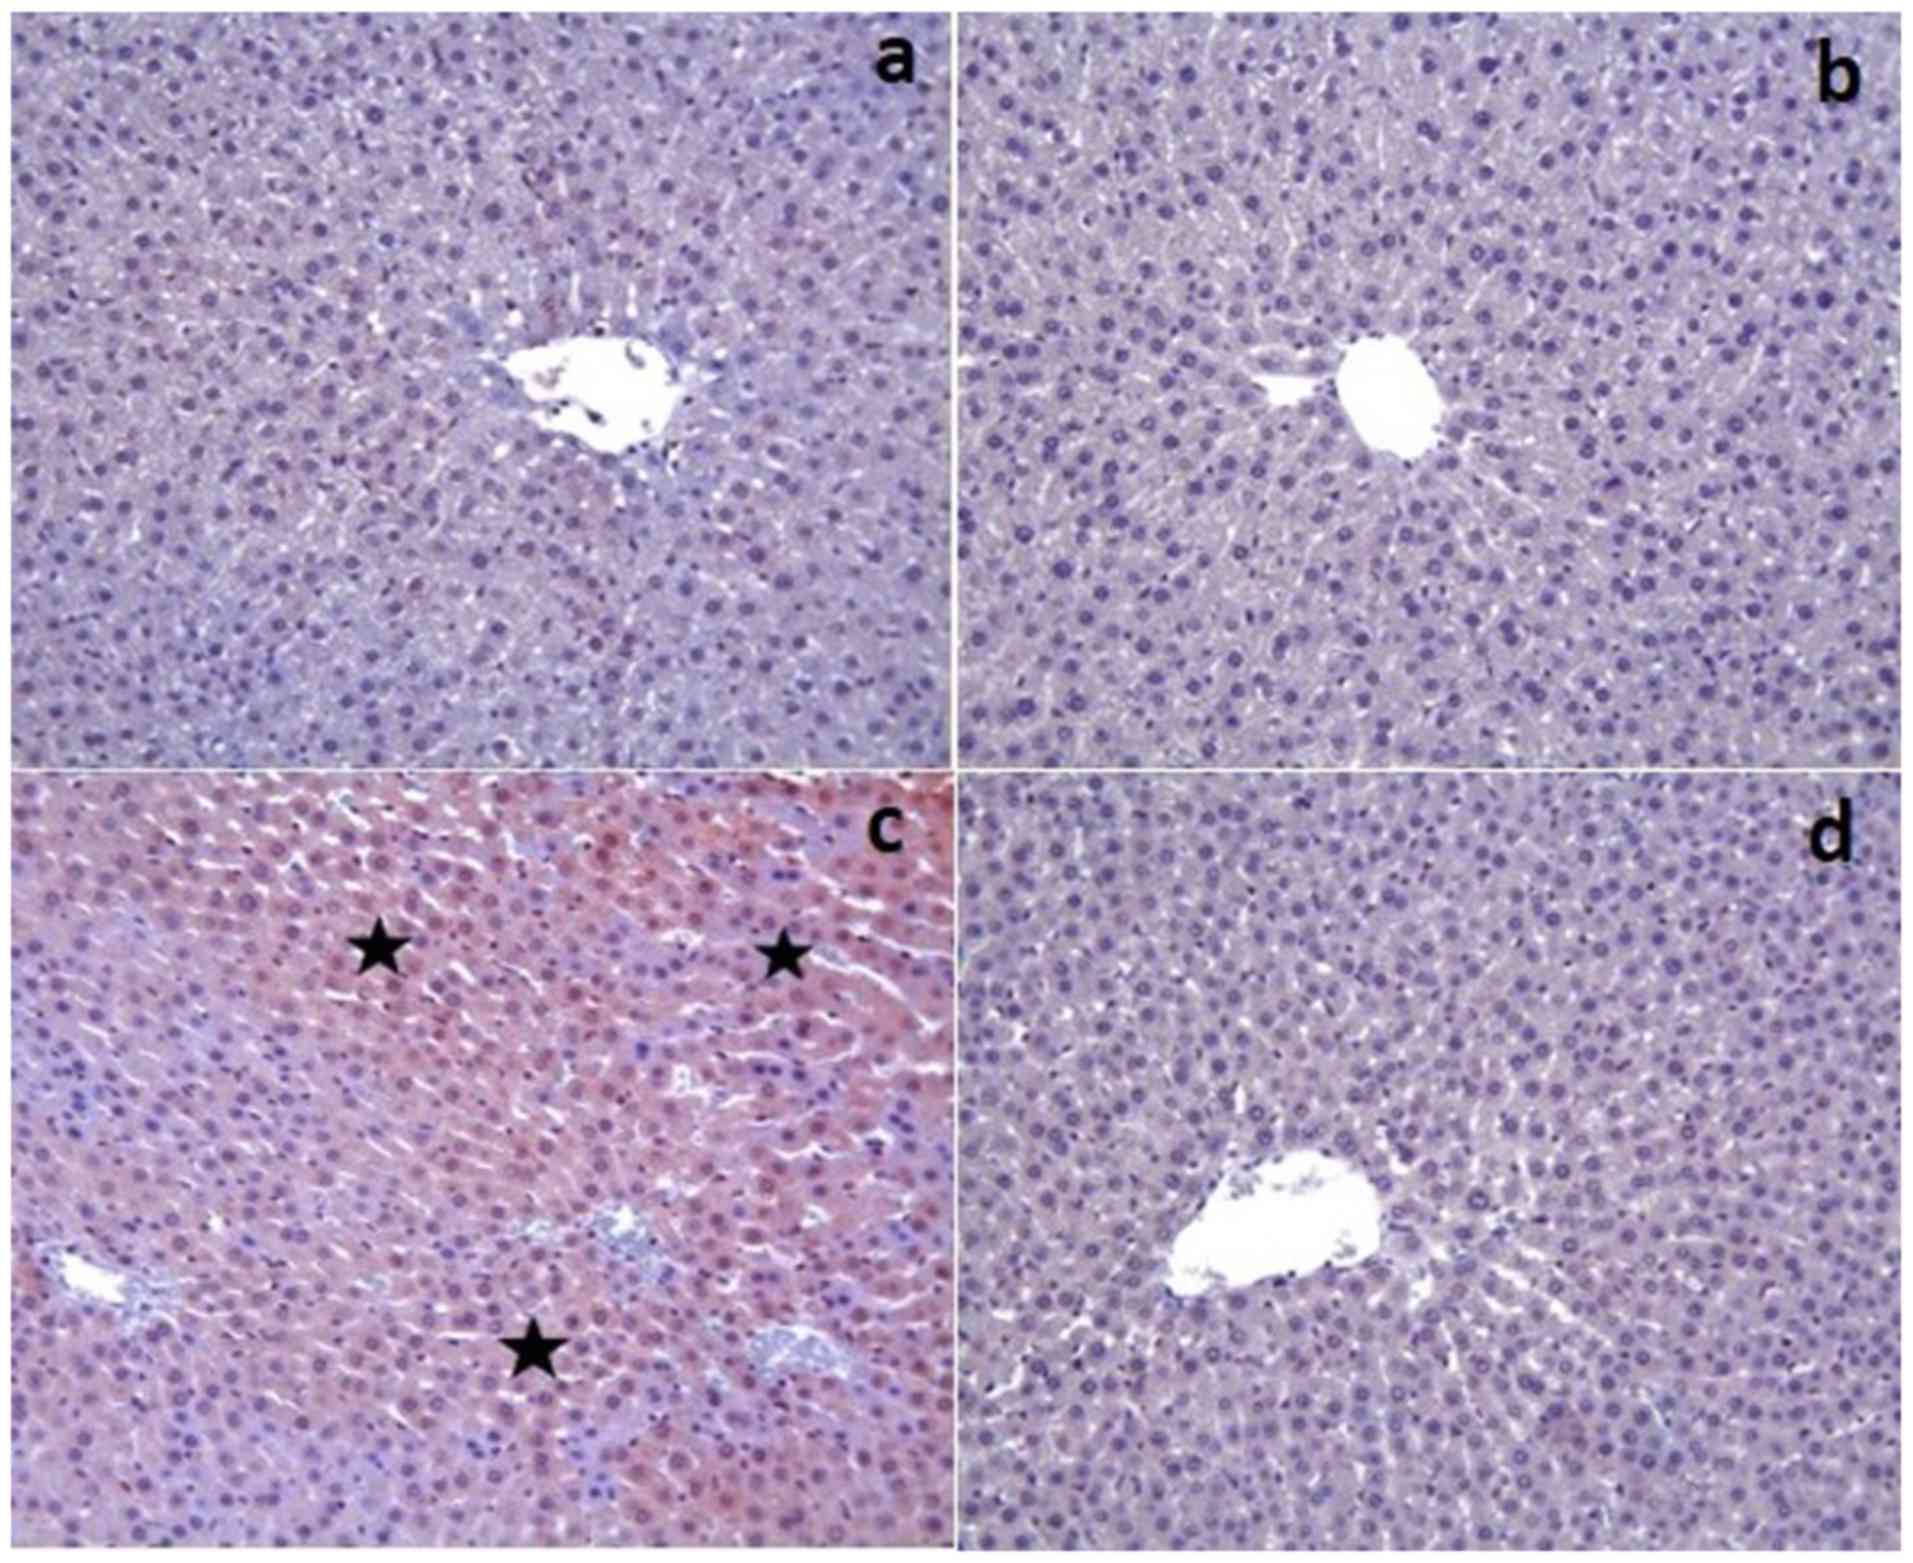
Immunohistochemical results
The control and Dexp groups had no caspase-3
expression in the tissue sections except for a few hepatocytes
(Fig. 2a and b). On the other hand,
there was a significant increase in the caspase-3 expression in the
Cis group (P<0.001) (Fig. 2c).
That group also demonstrated an increased caspase-3 staining
intensity. However, Cis+Dexp group had a significant decrease in
the caspase-3 expression (P<0.001) (Fig. 2d). Table
III shows the immunohistochemical staining scores of the study
groups.
Discussion
Although several experimental studies have reported
hepatotoxicity occurring with high doses of Cis, some others have
indicated that the former may occur even with a single dose or low
prolonged doses use of Cis (1,6). As Cis
is a small molecule, it easily passes through the cell membrane to
reach cell nucleus and alter DNA structure (5). Although the pathophysiological
mechanism of Cis-induced hepatotoxicity has yet to be fully
understood, recent studies have shown that a considerable
proportion of its toxic side effects originate from oxidative
stress and apoptosis (1,5). Studies on Cis toxicity showing reduced
hepatic GSH levels and increased hepatic MDA levels have
corroborated the notion that Cis toxicity is linked with oxidative
stress of hepatocytes (5).
Therefore, experimental studies have so far employed many
antioxidants, free radical scavengers, and natural herbal extracts
considered to have protective properties against Cis-associated
cytotoxicity.
Oxidative stress may be defined as overproduction of
reactive oxygen species and/or failure of antioxidant mechanisms
(3). Reactive oxygen species
produced by normal metabolism are eliminated in the liver by
certain reactions in which enzymes such as superoxide dismutase,
catalase, GSH Pxs, and peroxiredoxin are involved (5,23). When
the liver is exposed to oxidative stress as in Cis-induced
hepatotoxicity, liver cells encounter large quantities of reactive
oxygen species that overwhelm their detoxification capacity.
Reactive oxygen species then cause hepatocyte injury by injuring
DNA (increased cell death, reduced proliferation), protein
oxidation (growth factor inhibition, reduced enzymatic functions),
lipid peroxidation (inflammation, radical formation) and direct
action on signal pathways (transcription factor activation, reduced
angiogenesis, reduced NO level) (5,23).
In the present experimental study model, we aimed to
investigate if Dexp would exert any cytoprotective and antioxidant
effect on Cis-induced hepatotoxicity. According to the most recent
literature data, an important percentage of Cis related side
effects occur through oxidative stress pathways. Based on this
information, we studied several oxidative stress parameters in
liver tissue and blood samples. The levels of tissue antioxidant
parameters (GSH, CAT, GSH-Px, TAS) were significantly greater in
the Cis+ Dexp group compared to the Cis group. In contrast, the
levels of oxidative stress products (MDA, TOS, OSI) were
significantly greater in the Cis group than the Cis+Dexp group.
Similarly, serum GSH and TAS levels were greater in the Cis+Dexp
group whereas serum TOS and L-Arginine levels were greater in the
Cis group. These results suggest that Dexp minimizes Cis's
hepatotoxic effect by intensifying antioxidant mechanisms.
ADMA and SDMA are toxic non-proteinogenic amino
acids formed by post-translational modification. These toxic
dimethylarginines were first detected in human urine in 1970. Both
of them suppress NO production by inhibiting the Nitric Oxide
Synthase (NOS) enzyme. Clinical and experimental studies have shown
that ADMA and SDMA play a role in the pathophysiological mechanism
of endothelial dysfunction, atherosclerosis, oxidative stress,
inflammation, and apoptosis (24).
ADMA disintegrates NOS into its isoenzymes to produce superoxide
radicals that are involved in oxidative stress (24). SDMA, unlike ADMA, induces pathways
involved in the production of free oxygen species and has therefore
proinflammatory and prooxidant properties (24). In our study the Cis+Dexp group had
significantly lower blood ADMA, SDMA, and L-Arginine levels than
the Cis group. In contrast, the Cis+Dexp group had a significantly
higher total nitrite levels than the Cis group. These results
suggest that since Dexp reduced ADMA and SDMA levels, the NOS
enzyme was not inhibited and Arginine was converted into NO
molecule, which reduced blood arginine level in the Cis+Dexp
group.
Another important point to stress is the mechanism
of the alterations of blood and tissue NO levels. A general
consensus exists that NO behaves differently in physiological and
pathological conditions. It is known that many hepatotoxic drugs
and chemical substances increase hepatic NO production by
inhibiting iNOS enzyme and are converted to peroxynitrite by
reacting with NO's superoxide anion, causing hepatic injury via
nitrous active stress (25). In this
regard, our results do not overlap with the literature data. This
is because both tissue and blood total nitrite levels were
significantly higher in the Dexp and Cis+Dexp groups compared to
the Cis group. Moreover, total nitrite levels were even higher in
the Cis group than the control group. That is, in contrast with the
literature data, the findings of the present study indicate that
antioxidant agents increased NO levels rather than reducing them.
To our opinion, this finding may be related to a reduction of ADMA
and SDMA levels by Dexp, as we pointed above. Nevertheless, in any
case, this point needs to be confirmed by other studies.
Cytokines playing a role in both proinflammatory and
anti-inflammatory stages of inflammation are the major molecules
that have been investigated by inflammation models (11,26). As
the liver hosts receptors belonging to many different varieties of
cytokines, it has been widely studied in inflammation models.
Reactive oxygen species produced during oxidative stress may
further augment Cis's cytotoxic effects in the liver by increasing
nuclear kappa factor B expression and release of proinflammatory
cytokines (particularly IL-1β, TNF-α, and IL-6) (2,26). We
aimed to investigate how proinflammatory cytokines behave in
Cis-induced hepatotoxicity and how Dexp affects their tissue
levels. Accordingly, although tissue IL-6 and TNF-α levels were
higher in the Cis group compared to the Cis+Dexp group, this
difference did not reach statistical significance. However, these
findings show parallelism with the literature data with regard to
their mathematical results (11). In
contrast, tissue IL-1β level was found lower in the Cis group than
the Cis+Dexp group. This finding about IL-1β contradicts with the
literature data. To our opinion, this contradiction should be
corroborated or refuted by future studies.
We discussed above that an important proportion of
Cis's side effects occur through oxidative stress pathways. Another
mechanism responsible for the genesis of toxic side effects is
apoptosis (1). Increased
intracellular levels of reactive oxygen species result in DNA
injury in the cell nucleus, and when that injury could not be
repaired, both proliferation is limited and apoptosis is augmented
(23). Many experimental ischemia
reperfusion injury and hepatotoxicity models studied the
relationship between antioxidant or free radical scavenging agents
and apoptosis by both immunohistochemical staining techniques
(active caspase-3, split PARP, TUNEL) and tissue/blood biochemical
parameters (IL-6, TNF-α, caspase-3 activity, DNA fragmentation)
(1,2). We studied immunohistochemically
caspase-3 expression to assess apoptosis. In the Cis+Dexp group
caspase-3 expression was significantly lower than in the Cis group.
The overall findings of our study suggest that Dexp reduced
apoptosis both by directly eliminating reactive oxygen species that
accelerate apoptosis and by reducing the level of the ADMA molecule
that induces apoptosis (27).
We would like to mention some points that limited us
in this experimental study. The first limiting factor was that we
did not studied serum and tissue parameters indicative of
nephrotoxicity although the latter is the main most serious side
effect of Cis (28). In the present
study we had the opportunity to show both the nephrotoxic effects
of Cis and the nephroprotective effects of Dexp (29). However, as the study designs solely
focused on the liver, renal effects were unfortunately ignored. The
second limiting factor was the absence of the determination of AST,
ALT, ALP, and bilirubin levels, which are directly indicative of
hepatic injury, although many tissue and serum parameters
indicative of oxidative stress, antioxidant response, and
apoptosis. The previous experimental studies examining the
hepatotoxic effects of Cis showed marked alterations in ALT, AST,
and ALP levels (28).
As far as we know, this is the first study in the
literature that specifically studied the protective effect of Dexp
against Cis-induced hepatotoxicity. Hence, it is clear that the
findings of the present study need to be supported by other studies
designed with the same model. In conclusion, in this experimental
study model we demonstrated that Dexp exerted a hepatoprotective,
antioxidant, and antiapoptotic action; in other words, it minimized
Cis-induced hepatotoxicity.
Acknowledgements
Not applicable.
Funding
The present study was supported by the Inonu
University Scientific Research Project Coordination Unit (grant no.
2016/179).
Availability of data and materials
The datasets used and/or analyzed during the current
study are available from the corresponding author on reasonable
request.
Authors' contributions
YB, SA, HP and YT designed and directed the
experiments. YB, SA, OO and YT performed the experiments. MEE, ZA
and YT performed biochemical analysis. NV performed
histopathological analysis. SA performed the statistical analysis.
SA wrote the manuscript. YB, SA, HP and YT reviewed and edited the
manuscript. All authors read and approved the final manuscript.
Ethics approval and consent to
participate
The animal use protocol was reviewed and approved by
the Inonu University Faculty of Medicine Animal Research Ethics
Committee (2016/A-36). All animals received humane care in
compliance with the Guide for the Care and Use of Laboratory
Animals published by the National Institutes of Health.
Patient consent for publication
Not applicable.
Competing interests
The authors declare that they have no competing
interests.
References
|
1
|
Cagin YF, Atayan Y, Sahin N, Parlakpinar
H, Polat A, Vardi N, Tagluk ME, Tanbek K and Yildiz A: Beneficial
effects of dexpanthenol on mesenteric ischemia and reperfusion
injury in experimental rat model. Free Radic Res. 50:354–365. 2016.
View Article : Google Scholar : PubMed/NCBI
|
|
2
|
Cure MC, Cure E, Kalkan Y, Kırbaş A,
Tümkaya L, Yılmaz A, Türkyılmaz AK, Şehitoğlu İ and Yüce S:
Infliximab modulates cisplatin-induced hepatotoxicity in rats.
Balkan Med J. 33:504–511. 2016. View Article : Google Scholar : PubMed/NCBI
|
|
3
|
Karale S and Kamath JV: Effect of daidzein
on cisplatin-induced hematotoxicity and hepatotoxicity in
experimental rats. Indian J Pharmacol. 49:49–54. 2017.PubMed/NCBI
|
|
4
|
Toplu Y, Sapmaz E, Parlakpinar H, Kelles
M, Kalcioglu MT, Tanbek K and Kizilay A: The effect of dexpanthenol
on ototoxicity induced by cisplatin. Clin Exp Otorhinolaryngol.
9:14–20. 2016. View Article : Google Scholar : PubMed/NCBI
|
|
5
|
Al-Malki AL and Sayed AA: Thymoquinone
attenuates cisplatin-induced hepatotoxicity via nuclear factor
kappa-β. BMC Complement Altern Med. 14:2822014. View Article : Google Scholar : PubMed/NCBI
|
|
6
|
Astolfi L, Ghiselli S, Guaran V, Chicca M,
Simoni E, Olivetto E, Lelli G and Martini A: Correlation of adverse
effects of cisplatin administration in patients affected by solid
tumours: A retrospective evaluation. Oncol Rep. 29:1285–1292. 2013.
View Article : Google Scholar : PubMed/NCBI
|
|
7
|
Koyuncu I, Kocyigit A, Gonel A, Arslan E
and Durgun M: The protective effect of naringenin-oxime on
cisplatin-induced toxicity in rats. Biochem Res Int.
2017:94789582017. View Article : Google Scholar : PubMed/NCBI
|
|
8
|
Ermis H, Parlakpinar H, Gulbas G, Vardi N,
Polat A, Cetin A, Kilic T and Aytemur ZA: Protective effect of
dexpanthenol on bleomycin-induced pulmonary fibrosis in rats.
Naunyn Schmiedebergs Arch Pharmacol. 386:1103–1110. 2013.
View Article : Google Scholar : PubMed/NCBI
|
|
9
|
Karadag A, Ozdemir R, Kurt A, Parlakpinar
H, Polat A, Vardi N, Taslidere E and Karaman A: Protective effects
of dexpanthenol in an experimental model of necrotizing
enterocolitis. J Pediatr Surg. 50:1119–1124. 2015. View Article : Google Scholar : PubMed/NCBI
|
|
10
|
Karapinar Soylu O, Pinar N, Ozgür T, Özcan
O, Bayraktar HS, Kurt RK and Nural O: The protective role of
dexpanthenol on the endometrial implants in an experimentally
induced rat endometriosis model. Reprod Sci. 24:285–290. 2017.
View Article : Google Scholar : PubMed/NCBI
|
|
11
|
Li-Mei W, Jie T, Shan-He W, Dong-Mei M and
Peng-Jiu Y: Anti-inflammatory and Anti-oxidative Effects of
Dexpanthenol on Lipopolysaccharide Induced Acute Lung Injury in
Mice. Inflammation. 39:1757–1763. 2016. View Article : Google Scholar : PubMed/NCBI
|
|
12
|
Sen H, Deniz S, Yedekci AE, Inangil G,
Muftuoglu T, Haholu A and Ozkan S: Effects of dexpanthenol and
N-acetylcysteine pretreatment in rats before renal
ischemia/reperfusion injury. Ren Fail. 36:1570–1574. 2014.
View Article : Google Scholar : PubMed/NCBI
|
|
13
|
Uysal HB, Dagli B, Yilmaz M, Kahyaoglu F,
Gokcimen A, Omurlu IK and Demirci B: Protective effects of
dexpanthenol against acetaminophen-induced hepatorenal damage.
Biomed Res. 28:740–749. 2017.
|
|
14
|
Mihara M and Uchiyama M: Determination of
malonaldehyde precursor in tissues by thiobarbituric acid test.
Anal Biochem. 86:271–278. 1978. View Article : Google Scholar : PubMed/NCBI
|
|
15
|
Ellman GL: Tissue sulphydryl groups. Arch
Biochem Biophys. 82:70–77. 1959. View Article : Google Scholar : PubMed/NCBI
|
|
16
|
Aebi H; Bergmeter HU: Methods in enzymatic
analysis, Weinheim, Verlag Chemie 3. 1–282. 1982.
|
|
17
|
Paglia D and Valentine WN: Studies on the
quantitative and qualitative charecterization of erythrocyte
glutathione peroxidase. J Lab Clin Med. 70:158–169. 1967.PubMed/NCBI
|
|
18
|
Lowry OH, Rosenbrough NJ, Farr AL and
Randall RJ: Protein measurement with the folin phenol reagent. J
Biol Chem. 193:265–275. 1951.PubMed/NCBI
|
|
19
|
Jungersten L, Edlund A, Petersson AS and
Wennmalm A: Plasma nitrate as an index of nitric oxide formation in
man: Analyses of kinetics and confounding factors. Clin Physiol.
16:369–379. 1996. View Article : Google Scholar : PubMed/NCBI
|
|
20
|
Zeballos GA, Bernstein RD, Thompson CI,
Forfia PR, Seyedi N, Shen W, Kaminiski PM, Wolin MS and Hintze TH:
Pharmacodynamics of plasma nitrate/nitrite as an indication of
nitric oxide formation in conscious dogs. Circulation.
91:2982–2988. 1995. View Article : Google Scholar : PubMed/NCBI
|
|
21
|
Ozbek E, Turkoz Y, Gokdeniz R, Davarci M
and Ozugurlu F: Increased nitric oxide production in the spermatic
vein of patients with varicocele. Eur Urol. 37:172–175. 2000.
View Article : Google Scholar : PubMed/NCBI
|
|
22
|
Erel O: A new automated colorimetric
method for measuring total oxidant status. Clin Biochem.
38:1103–1111. 2005. View Article : Google Scholar : PubMed/NCBI
|
|
23
|
Auten RL and Davis JM: Oxygen toxicity and
reactive oxygen species: the devil is in the details. Pediatr Res.
66:121–127. 2009. View Article : Google Scholar : PubMed/NCBI
|
|
24
|
Tain YL and Hsu CN: Toxic
dimethylarginines: Asymmetric Dimethylarginine (ADMA) and Symmetric
Dimethylarginine (SDMA). Toxins (Basel). 9:E922017. View Article : Google Scholar : PubMed/NCBI
|
|
25
|
Singh H, Sidhu S, Chopra K and Khan MU:
The novel role of β-aescin in attenuating CCl4-induced
hepatotoxicity in rats. Pharm Biol. 55:749–757. 2017. View Article : Google Scholar : PubMed/NCBI
|
|
26
|
Kandil YI, Maraqa AD, Oriquat GA and
Shraideh ZA: Resveratrol pretreatment reduces circulating
inflammatory interleukins in CCl4-induced hepatotoxicity rats.
Bulletin Faculty Pharm Cairo Univ. 55:319–323. 2017. View Article : Google Scholar
|
|
27
|
Ye S, Zhou X2, Lin J and Chen P:
Asymmetric dimethylarginine induced apoptosis and dysfunction of
endothelial progenitor cells: Role of endoplasmic reticulum stress
pathway. Biomed Res Int. 2017:63956012017. View Article : Google Scholar : PubMed/NCBI
|
|
28
|
Pezeshki Z, Khosravi A, Nekuei M,
Khoshnood S, Zandi E, Eslamian M, Talebi A, Emami SN and
Nematbakhsh M: Time course of cisplatin-induced nephrotoxicity and
hepatotoxicity. J Nephropathol. 6:163–167. 2017. View Article : Google Scholar : PubMed/NCBI
|
|
29
|
Dogan EE, Erkoc R, Ekinci I, Hamdard J,
Doner B, Cikrikcioglu MA, Karatoprak C, Coban G, Ozer OF and
Kazancioglu R: Protective effect of dexpanthenol against
nephrotoxic effect of amikacin: An experimental study. Biomed
Pharmacother. 89:1409–1414. 2017. View Article : Google Scholar : PubMed/NCBI
|