Introduction
The most prevalent type of idiopathic interstitial
pneumonia is idiopathic pulmonary fibrosis (IPF) (1). Chronic progressive fibrosis in IPF is
characterized by unexplained progressive dyspnea, decreased
exercise tolerance and lung parenchyma interstitial infiltration or
restricted pulmonary ventilation function (restrictive lung
ventilation disorder) confirmed by histopathology and/or imaging
(1). Following diagnosis, the
average survival rate of patients ranges between 2.5–3.5 years,
which is due to the difficulty of early diagnosis and lack of
effective treatment methods (2,3). Over
the past several decades, studies into the pathogenesis of IPF have
made substantial progress, and an initial hypothesis suggested that
chronic inflammation in early IPF may stimulate and damage the lung
tissue, regulate fibroplasia and induce extracellular matrix
(ECM)deposition, leading to late PF (4). However, mechanistic studies have
indicated that chronic inflammation does not sufficiently explain
the occurrence and development of IPF (5–8);
therefore, a novel hypothesis that IPF is caused by abnormal damage
and repair of alveolar epithelial cells (AECs) has been proposed
(9). This hypothesis suggests that
AECs, fibroblasts and their interaction, and not chronic
inflammation, are the key factors in the pathogenesis of IPF.
Recent studies have indicated that IPF results from abnormal
cellular repair following sustained epithelial cell damage in the
lung parenchyma, along with the proliferation and accumulation of
fibroblasts/myofibroblasts and excessive ECM deposition (10–12).
Injured AECs following repeated complex minor stimulations,
including repeated infections and physical and chemical injuries,
have been demonstrated to secrete pro-fibrotic factors, including
transforming growth factor-β (TGF-β), tumor necrosis factor-α and
platelet-derived growth factor (13–15),
thereby initiating the proliferation, migration and differentiation
of fibroblasts (9).
Fibroblasts/myofibroblasts are able to stimulate the formation of
fibroblast foci and secrete large quantities of ECM proteins, in
addition to matrix metalloproteinases (MMPs) and MMP tissue
inhibitors, thus resulting in the deposition of ECM (9). Furthermore, AECs have been demonstrated
to induce the formation of a pro-coagulant alveolar environment,
leading to increased fibrosis (9).
In addition, myofibroblasts may secrete angiotensinogen to induce
AEC apoptosis, thus resulting in continuous injury (9). Injured AECs have been reported to
activate fibroblasts, resulting in a vicious cycle that critically
alters normal alveolar structure (9). A previous study indicated that IPF
pathogenesis was a result of the combined effects of inflammatory
reaction pathways, epithelial damage pathways and abnormal repair
pathways (16).
In the present study, human embryonic lung
fibroblasts (HELFs) were cultured in vitro and used to
construct a TGF-β1-induced HELF PF model, in order to characterize
the effect of Ginkgo biloba leaf extract (GBLE), shenmai (S)
and matrine (M) on PF. It has been previously reported that GBLE
has a positive effect on the treatment of pulmonary interstitial
fibrosis and tis mechanism of action may be via inhibiting the
activity of nuclear factor-κB and decreasing TGF-β, which
ameliorates inflammation and fibrosis (17). Shenmai may inhibit collagen synthesis
and TGF-β and regulate the biological redox equilibrium (18). While matrine exerts an anti-PF effect
by inhibiting the JAK-STAT signaling transduction pathways
(19). This was hoped to elucidate
an experimental basis for the treatment of PF with GBLE, S and
M.
Materials and methods
HELF culture and grouping
HELFs (cat. no. KG062; Nanjing Keygen BioTech Co.,
Ltd., Nanjing, China) were cultured in α-Minimum Essential Medium
(α-MEM; Nanjing Keygen BioTech Co., Ltd.) supplemented with 5%
penicillin, 5% streptomycin and 10% fetal bovine serum (Nanjing
Keygen BioTech Co., Ltd.) at 37°C in an atmosphere containing 5%
CO2. When the cells had reached ~80% confluence, trypsin
(Sigma-Aldrich; Merck KGaA; Darmstadt, Germany) was utilized for
passage. Cells generated from passage 3–4 were used for the
following experiments.
Following trypsinization, the cells were centrifuged
at 37°C at 256 × g for 10 min and resuspended in 4 ml fresh
supplemented α-MEM (as described above) and counted using a DVM6
optical microscope (Leica Microsystems GmbH, Wetzlar, Germany).
Cells were allocated into the following groups: Group A, control
group; group B, TGF-β1 (model) group (1 ng/ml; Nanjing Keygen
BioTech Co., Ltd.); group C1, TGF-β1 (1 ng/ml) + GBLE (approval
number: X20010117; Dr. Willmar Schwabe GmbH & Co. KG,
Karlsruhe, Germany; 5 µl/ml); group C2: TGF-β1 (1 ng/ml) + GBLE (10
µl/ml); group C3: TGF-β1 (1 ng/ml) + GBLE (20 µl/ml); group D1:
TGF-β1 (1 ng/ml) + S (approval number: Z51022290; Sichuan Chuanda
West China Pharmaceutical Co., Ltd., Chengdu, China; 10 µl/ml);
group D2: TGF-β1 (1 ng/ml) + S (20 µl/ml); group D3: TGF-β1 (1
ng/ml) + S (40 µl/ml); group E1: TGF-β1 (1 ng/ml) + M (approval
number: H22024149; Changchun Tiancheng Pharmaceutical Co., Ltd.,
Changchun, China; 10 µl/ml); group E2: TGF-β1 (1 ng/ml) + M (20
µl/ml); and group E3: TGF-β1 (1 ng/ml) + M (40 µl/ml). After
treatments were administered, cells were incubated for 24 h at 37°C
in a humidified atmosphere containing 5% CO2. The
treatment groups were incubated in 12-well plates (6 wells per
group) and 96-well plates (5 wells per group).
MTT cell proliferation assay
An MTT assay was performed using 96-well plates with
5 repeat wells per group. Cells (1×10⁵ cells/ml) were
cultured in 200 µl α-MEM in the 96-well plates with 10 µl MTT
solution (Amresco, Solon, OH, USA) at 37°C in an atmosphere
containing 5%CO2 for 4 h. The edges of wells were filled
with sterile phosphate-buffered saline (PBS) to prevent
evaporation. If the drug reacted with MTT, MTT was added after the
culture was centrifuged at 256 × g at room temperature and washed
two to three times with PBS. After 4 h, the supernatant was removed
from the plates by gently tapping on a pre-prepared absorbent paper
one to two times. To dissolve the crystals, 50 µl dimethylsulfoxide
(Sigma-Aldrich; Merck KGaA) was added to the cells, and the plates
were placed on a low-speed oscillator for 10 min at room
temperature. The optical density (OD) of each well was measured at
490 nm and the growth inhibition rate of each group was calculated,
as follows: Cell growth inhibition rate = (OD of the control
group-OD of treatment group)/OD of the control group ×100%
(20).
Detection of cell apoptosis by flow
cytometry
The rate of apoptosis was detected by flow
cytometry, using 12-well plates with 6 repeat wells per group.
Cells were seeded at a density of 1×10⁵ cells/ml in 2
ml/wells with α-MEM and FBS. Following incubation for 24 h at 37°C
with the drug treatments, cells in the 12-well plates were removed
from the incubator, imaged under a DVM6 optical microscope and 1 ml
of the supernatant from each well was stored at −80°C for
measurement of protein content by ELISA. The remaining supernatant
was discarded and cells were washed twice with PBS. Trypsinized
cells were collected, centrifuged at 650 × g for 7 min at 4°C and
washed twice with PBS. Cells were subsequently resuspended in 500
µl of 1X binding buffer, filtered through a 80 µm filter and
transferred to a tube for antigen labeling. Cells were then
incubated with 4 µl fluorescein isothiocyanate-annexin V and 8 µl
propidium iodide (PI) for 5 min in the dark at room temperature. A
FACSCalibur flow cytometer was used for analysis using Winmidi 2.9
analysis software (both BD Biosciences, San Jose, CA, USA) to
detect cells undergoing apoptosis. Normal living cells and early
apoptotic cells were defined as those cells resistant to PI
staining, whereas necrotic cells were identified by PI-positive
staining.
ELISA
The levels of collagen type I (COL-1; cat. no.
ab6308), collagen type III (COL-III; cat. no. ab7778), α-smooth
muscle actin (α-SMA; ab5694) and extracellular superoxide dismutase
(ECSOD; ab13534) in the ECM of HELFs were measured by ELISA (Abcam,
Cambridge, UK), according to manufacturer's protocol.
Semi-quantitative reverse
transcription-polymerase chain reaction (RT-PCR)
The levels of COL-I, COL-III, α-SMA and ECSOD mRNA
expression were assessed by semi-quantitative RT-PCR. The primer
sequences used are presented in Table
I.
 | Table I.Primer sequences used in the present
study. |
Table I.
Primer sequences used in the present
study.
| Gene | Direction | Sequence, 5′-3′ | Size, bp |
|---|
| β-actin | Forward |
GTGGGGCGCCCCAGGCACC | 500 |
|
| Reverse |
CTCCTTAATGTCACGCACGATTT |
|
| COL-III | Forward |
ACGGAAACACTGGTGGACAG | 386 |
|
| Reverse |
GTAGTCTCACAGCCTTGCGT |
|
| COL-I | Forward |
GCTCGTGGAAATGATGGTGC | 449 |
|
| Reverse |
CCTCGCTTTCCTTCCTCTCC |
|
| α-SMA | Forward |
GACCTTTGGCTTGGCTTGTC | 418 |
|
| Reverse |
AGCTGCTTCACAGGATTCCC |
|
| ECSOD | Forward |
GTGAAGGTGTGGGGAAGCAT | 339 |
|
| Reverse |
TCCAGCGTTTCCCGTCTTTG |
|
At 24 h after treatment, the 12-well plates were
removed from the incubator and the cells were washed twice with
PBS. Cells were resuspended in 1 ml TRIzol (Tianjin Kailiqi
Biopharma Technology Co., Ltd., Tianjin, China) and placed into
diethyl pyrocarbonate (DEPC; Fuzhou Maixin Biotech Co., Ltd.,
Fuzhou, China) water-treated Eppendorf tubes for total RNA
extraction on ice. RT-PCR primers were designed using Primer 5.0
software (Premier, Inc., Charlotte, NC, USA). RNA was extracted
using TRIzol, and RNA concentration and purity were measured using
a UV spectrophotometer at an absorbance (A) ratio of 260/280 nm.
cDNA was synthesized from 2.5 µg total RNA according to RT kit
instructions (MBI Fermentas; Thermo Fisher Scientific, Inc.,
Pittsburgh, PA, USA) using oligo dTs (Bio Basic, Inc., Markham, ON,
Canada). PCR was performed with 5 µl cDNA, 2.5 µl 10 X PCR buffer,
2 µl 25 mM MgCl2, 0.25 µl primers (25 pmol each), 0.5 µl
10 mM dNTPs, 0.5 µl Taq DNA polymerase (MBI Fermentas; Thermo
Fisher Scientific, Inc.) and 14 µl DEPC water. The PCR reaction
underwent the following conditions: 95°C for 5 min, 94°C for 1 min,
58–60°C for 1 min and 72°C for 1 min for 26 cycles, followed by an
extension step at 70°C for 10 min. PCR products were
electrophoresed and analyzed on a 1.5% gel stained with ethidium
bromide and an Alpha Innotech Digital Imaging System (Bosch
Institute, Sydney Medical School, University of Sydney, NSW,
Australia) was used with Essential version 6 software (UVItec Ltd.,
Cambridge, UK) to determine the relative levels of target gene
expression by calculating the gray value ratio between the target
gene bands and β-actin control bands.
Statistical analysis
SPSS 17.0 software (SPSS, Inc., Chicago, IL, USA)
was used for analysis of the data. The data were expressed as the
mean ± standard deviation. One-way analysis of variance and paired
t-tests were used for intergroup comparisons, and the Fisher's
least significant difference test was used for pairwise comparisons
among multiple groups. P<0.05 was considered to indicate a
statistically significant difference.
Results
Comparison of cell proliferation
Compared with the control group, the OD value in the
model group significantly increased (P<0.05). Compared with the
model group, the OD value in each treatment group were
significantly decreased (P<0.05). The OD values and cell growth
inhibitory rates exhibited significant differences among Group C1,
C2, and C3 (P<0.05), as well as among Group D1, D2, and D3
(P<0.05), and among Group E1, E2, and E3 (P<0.05). The OD
value in Group D3 was significantly lower (P<0.05) and the cell
growth inhibition rate was significantly higher, compared with
other treatment groups with the same concentrations (P<0.05).
The results are reported in Table
II.
| Table II.Results of human embryonic lung
fibroblast MTT assay. |
Table II.
Results of human embryonic lung
fibroblast MTT assay.
| Group | OD value of cell
proliferation | Growth inhibition
rate (%) |
|---|
| Control | 0.177±0.0071 | – |
| Model |
0.214±0.0045a | 6.5±1.45 |
| C1 |
0.166±0.0076b |
0.0651±0.014c,d |
| C2 |
0.153±0.0056b,c |
0.1342±0.0078c,e |
| C3 |
0.146±0.0043b,d,e |
0.1762±0.0085d,e |
| D1 |
0.146±0.0060b |
0.1783±0.0090c,d |
| D2 |
0.132±0.0076b,c |
0.2551±0.0191c,e |
| D3 |
0.117±0.0046b,d–f | 0.3384±0.
0125d–f |
| E1 |
0.153±0.0061b |
0.1351±0.0083c,d |
| E2 |
0.143±0.0050b,c |
0.1973±0.0107c,e |
| E3 |
0.128±0.0060b,d,e |
0.2782±0.0094d,e |
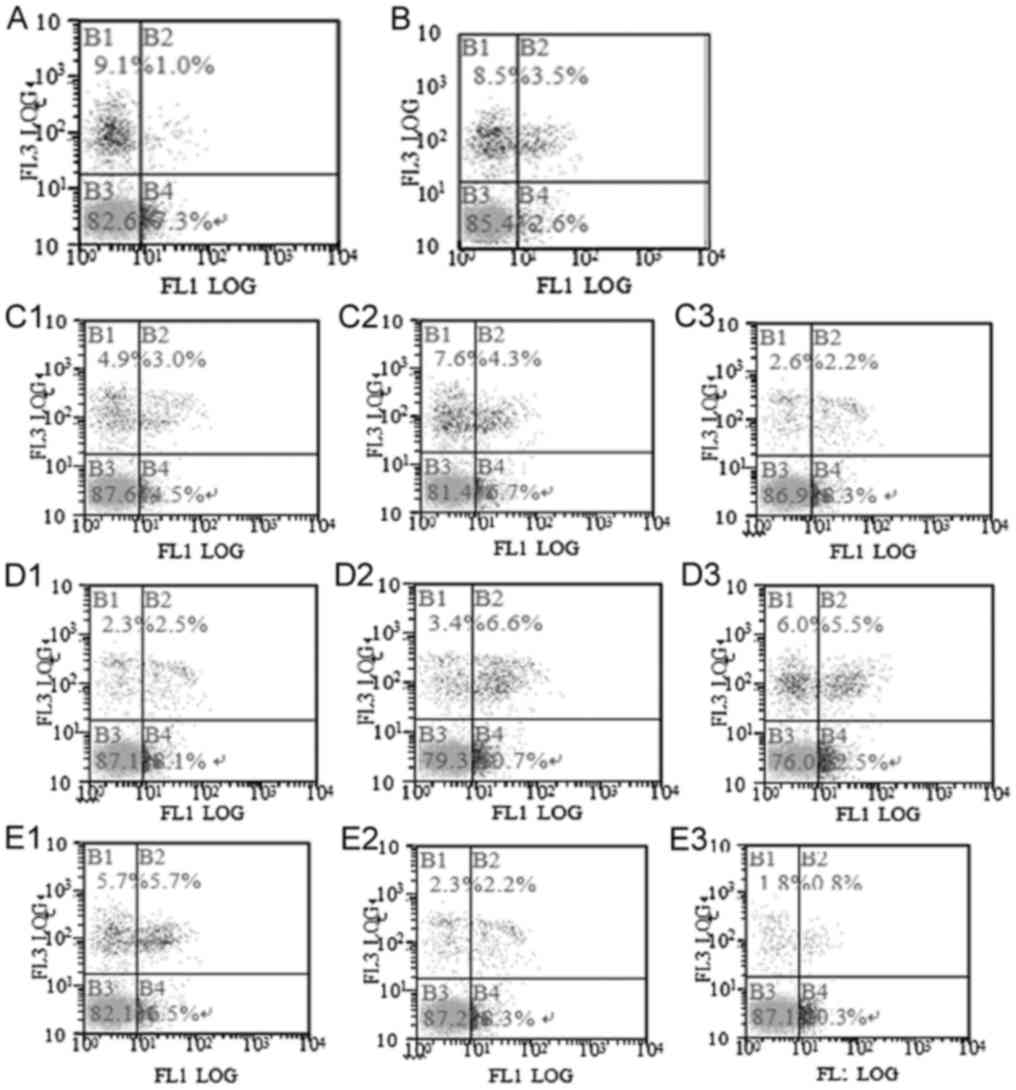
Comparison of apoptosis
Compared with the control group, the apoptosis rate
in the model group was significantly decreased (P<0.05; Fig. 1). Compared with the model group, the
apoptosis rate in each treatment group was significantly increased
(P<0.05). The apoptosis rate had significant difference among
the C1, C2 and C3 groups (P<0.05), among the D1, D2 and D3
groups (P<0.05), and among the E1, E2 and E3 groups (P<0.05).
The apoptosis rate in the D3 group was significantly higher than in
the other treatment groups at the same dose (P<0.05). The
results are presented in Table III
and Fig. 1.
| Table III.Results of human embryonic lung
fibroblast apoptosis assay. |
Table III.
Results of human embryonic lung
fibroblast apoptosis assay.
| Group | Apoptotic rate,
% |
|---|
| Control | 0.0731±0.0060 |
| Model |
0.0262±0.0036a |
| C1 |
0.0451±0.0049b–d |
| C2 |
0.0673±0.0045b,c,e |
| C3 |
0.0831±0.0046b,d,e |
| D1 |
0.0812±0.0021b–d |
| D2 |
0.1071±0.0030b,c,e |
| D3 |
0.1252±0.0051b,d–f |
| E1 |
0.0651±0.0038b–d |
| E2 |
0.0833±0.0040b,c,e |
| E3 |
0.1034±0.0050b,d,e |
Comparison of extracellular matrix
protein expression levels
Compared with the control group, the protein and
mRNA expression levels of COL-III, COL-I and α-SMA in the model
group were significantly increased (P<0.05; Fig. 2 and Table
IV). Compared with the model group, the above indexes in each
treatment group were significantly decreased (P<0.05). There was
a significant difference in each index among the C1, C2 and C3
groups (P<0.05), among the D1, D2 and D3 groups (P<0.05), and
among the E1, E2 and E3 groups (P<0.05). The protein and mRNA
expression levels of COL-III, COL-I and α-SMA in the E3 group were
significantly lower than in the other treatment groups (P<0.05).
The results are presented in Compared with the control group, the
expressions of COL-III, COL-I, α-SMA protein and mRNA in the model
group increased significantly (P<0.05). Compared with the model
group, the expressions of COL-III, COL-I, α-SMA protein and mRNA,
exhibiting significant differences among Group C1, C2, and C3
(P<0.05), as well as among Group D1, D2, and D3 (P<0.05), and
among Group E1, E2, and E3 (P<0.05). The expressions of COL-III,
COL-I, α-SMA protein and mRNA in Group Matrine Injection was
significantly lower (P<0.05). The results are shown in Tables IV, V
and Fig. 2.
| Table IV.Extracellular matrix protein
content. |
Table IV.
Extracellular matrix protein
content.
| Group | COL-III | COL-I | α-SMA |
|---|
| Control | 8.44±0.28 | 17.43±0.33 | 180.93±2.24 |
| Model |
55.28±0.17a |
25.85±0.47a |
252.20±4.87a |
| C1 |
51.74±0.37b–d |
24.51±0.37b–d |
246.49±0.79b–d |
| C2 |
48.37±0.41b,c,e |
22.55±0.22b,c,e |
234.07±4.75b,c,e |
| C3 |
43.30±0.42b,d,e |
19.71±0.31b,d,e |
225.20±2.76b,d,e |
| D1 |
49.15±1.60b–d |
23.48±0.33b–d |
234.94±3.92b–d |
| D2 |
45.43±0.24b,c,e |
21.59±0.27b,c,e |
217.39±5.41b,c,e |
| D3 |
40.14±0.83b,d,e |
18.99±0.30b,d,e |
207.90±3.13b,d,e |
| E1 |
44.26±0.27b–d |
22.89±0.25b–d |
219.34±3.85b–d |
| E2 |
40.46±0.22b,c,e |
20.50±0.25b,c,e |
205.78±2.47b,c,e |
| E3 |
37.76±0.20b,d–f |
17.89±0.20b,d–f |
193.41±1.76b,d–f |
| Table V.COL-III, COL-I, α-SMA and ECSOD mRNA
(n=6). |
Table V.
COL-III, COL-I, α-SMA and ECSOD mRNA
(n=6).
| Group |
COL-III/β-actin | COL-I/β-actin | α-SMA/β-actin | ECSOD/β-actin |
|---|
| Control | 0.1988±0.0078 | 0.1929±0.0109 | 0.2002±0.0007 | 0.8987±0.0027 |
| Model |
0.9822±0.0224a |
0.9762±0.0193a |
0.9912±0.0014a |
0.0977±0.0012a |
| C3 |
0.6152±0.0113b |
0.6098±0.0125b |
0.6023±0.0445b |
0.7024±0.0106b |
| D3 |
0.4351±0.0223b |
0.4289±0.0089b |
0.4278±0.0169b |
0.3532±0.0072b,c |
| E3 |
0.2221±0.0121b,c |
0.2091±0.0435b,c |
0.2332±0.0651b,c |
0.1977±0.0124b,c |
Impact of antioxidant factors on
ECSOD
Compared with the control group, the expression of
ECSOD mRNA in the model group was significantly decreased
(P<0.05; Table V). Compared with
the model group, the expression of ECSOD mRNA in each treatment
group was significantly increased (P<0.05). There was a
significant difference in each index among the C1, C2 and C3 groups
(P<0.05), among the D1, D2 and D3 groups (P<0.05) and among
the E1, E2 and E3 groups (P<0.05). The expression of ECSOD mRNA
in the C3 group was significantly lower than in the other treatment
groups at the same dose (P<0.05). The results are presented in
Tables V, VI and Fig.
3).
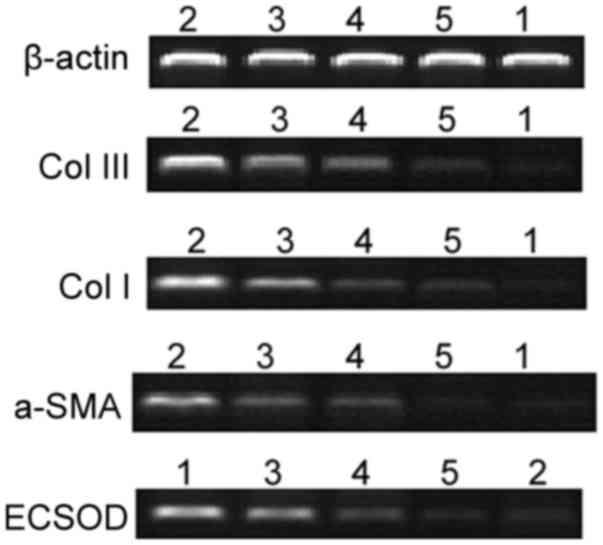
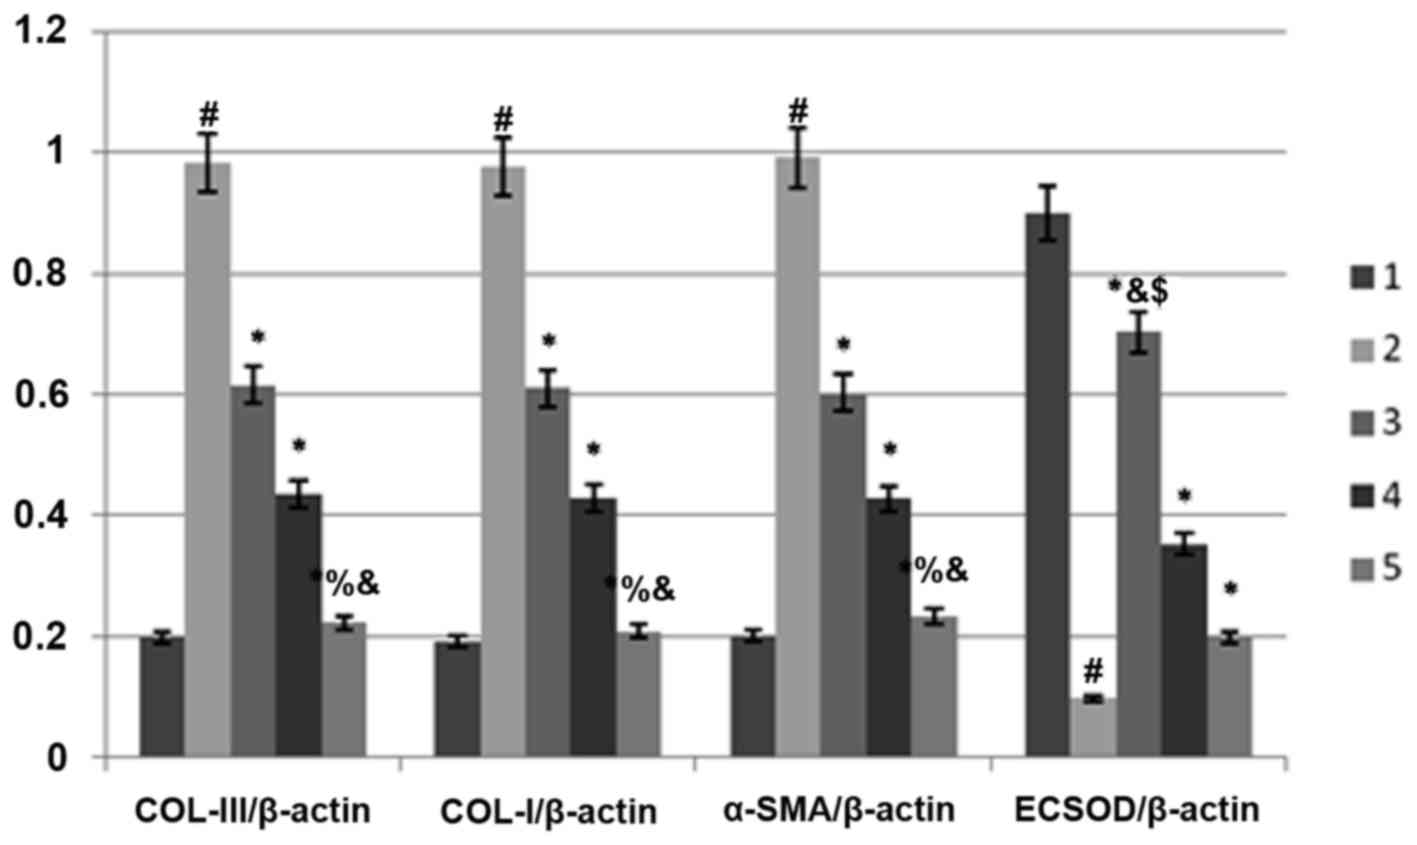 | Figure 3.mRNA expression of COL-III, COL-I,
α-SMA and ECSOD. 1, control; 2, Model; 3, C3-transforming growth
factor β1 + high-dose Ginkgo leaf extract; 4, D3-transforming
growth factor β1 + high-dose shenmai; 5, E3-transforming growth
factor β1 + high-dose matrine. COL-I collagen type I; COL-III,
collagen type III; α-SMA, α-smooth muscle actin; ECSOD,
extracellular superoxide dismutase. #P<0.05 vs. the
control group; *P<0.05 vs. the model group;
%P<0.05 vs. the C3 group; &P<0.05
vs. the D3 group; $P<0.05 vs. the E3 group. |
| Table VI.ECSOD protein content. |
Table VI.
ECSOD protein content.
| Group | ECSOD (mU/l) |
|---|
| Control | 49.67±0.95 |
| Model |
34.82±0.43a |
| C1 |
39.98±0.26b–d |
| C2 |
44.40±0.84b,c,e |
| C3 |
48.46±0.65b,d,e |
| D1 |
38.53±0.44b–d |
| D2 |
42.74±0.77b,c,e |
| D3 |
46.24±0.43b,d–f |
| E1 |
37.30±0.37b–d |
| E2 |
40.81±0.36b,d,e |
| E3 |
43.89±0.67b,d,e |
Discussion
Under homeostatic conditions, fibroblasts in the
lung tissues assume a resting state; however, during fibrosis,
various internal and external factors stimulate and activate
fibroblasts to transition from a resting state to a
hyperproliferative state, leading to the formation of a lung
fibroblastic focus (10). Inducing
fibroblast apoptosis may alleviate PF, thereby promoting recovery
(21). In the lung tissue, increased
expression of ECM proteins, particularly of collagens, is an
important indicator of the degree of fibrosis (22,23), as
demonstrated by previous studies that identified large quantities
of collagen deposition within fibrotic alveoli, in which COL-I and
COL-III were the primary constituents (24,25). The
detection of ECM protein expression at the mRNA and protein level
may be of significant value in the assessment of anti-fibrotic drug
efficacy. Activated fibroblasts transform into myofibroblasts
following functional and phenotypic changes, leading to the
expression of α-SMA (26).
Myofibroblasts are the primary cell responsible for the abnormal
synthesis and deposition of ECM proteins, and α-SMA may be used as
a marker of myofibroblasts (27). A
previous study demonstrated that the degree of PF in patients was
positively correlated with the level of oxidative stress in
vivo (28). ECSOD as the primary
antioxidant within lung tissue, exhibits the highest enzyme
activity in the lungs (29). ECSOD
removes superoxide from cells and inhibits the reaction between
nitric oxide and superoxide, which protects lung tissue and
collagen from free radical-induced injury during the inflammatory
process (30). Therefore, ECSOD
exerts critical protective effects against oxidative stress-induced
PF (30).
Previous studies have suggested that the predominant
active ingredients in GBLE are flavonoids (31–33).
These flavonoids have the ability to dilate blood vessels, improve
microcirculation, resist oxidation, scavenge oxygen free radicals
and prevent or reverse the fibrosis of multiple organs, thus
alleviating PF and reducing the degree of alveolitis and fibrosis
(33,34). Ginseng saponin and Ophiopogonin D are
the primary active ingredients in S, which may inhibit the
activation of myofibroblasts by scavenging free radicals and
blocking the free-radical-generation enzyme system, thus acting as
antioxidants and reducing PF (35–37).
Tetracyclic quinodines are active ingredients in M that have been
reported to directly scavenge cytotoxic free radicals, aid in the
inhibition of fibroblast division and proliferation, promote the
expression of TGF-β1 and CT-GF and prevent tissue injury and PF
(38,39).
The present data demonstrated that GBLE, S and M
inhibited the proliferation and induced the apoptosis of lung
fibroblasts, inhibited the synthesis and secretion of COL-I,
COL-III and α-SMA, and promoted the synthesis and secretion of
ECSOD.S exhibited the greatest activity in suppressing the abnormal
proliferation of lung fibroblasts and promoting their apoptosis,
while M exhibited the greatest activity in reducing the synthesis
of collagens, potentially by inhibiting expression of the collagen
gene. In addition, GBLE exhibited the greatest activity in
promoting the secretion of the antioxidant factor ECSOD. The above
activities were all significantly associated with drug
concentration.
The present findings suggest that different
traditional Chinese medicines have various anti-fibrotic targets.
Thus, drug treatment should be selected based on the particular
stage of fibrosis and mechanism of drug action.
Acknowledgements
The present study was supported by the Taishan
Scholar Duty Foundation of Lung Diseases in Chinese Medicine (grant
no. ts20110819) and the Innovation Projects of Shandong Provincial
Postdoctoral Special Foundation (grant no. 201 303 066).
Competing interests
The authors declare that they have no competing
interests.
References
|
1
|
Raghu G, Collard HR, Egan JJ, Martinez FJ,
Behr J, Brown KK, Colby TV, Cordier JF, Flaherty KR, Lasky JA, et
al: An official ATS/ERS/JRS/ALAT statement: Idiopathic pulmonary
fibrosis: Evidence-based guidelines for diagnosis and management.
Am J Respir Crit Care Med. 183:788–824. 2011. View Article : Google Scholar : PubMed/NCBI
|
|
2
|
King TE Jr, Albera C, Bradford WZ,
Costabel U, Hormel P, Lancaster L, Noble PW, Sahn SA, Szwarcberg J,
Thomeer M, et al: Effect of interferon gamma-1b on survival in
patients with idiopathic pulmonary fibrosis (INSPIRE): A
multicentre, randomized, placebo-controlled trial. Lancet.
374:222–228. 2009. View Article : Google Scholar : PubMed/NCBI
|
|
3
|
Raghu G, Rochwerg B, Zhang Y, Garcia CA,
Azuma A, Behr J, Brozek JL, Collard HR, Cunningham W, Homma S, et
al: An official ATS/ERS/JRS/ALAT clinical practice guideline:
Treatment of idiopathic pulmonary fibrosis An update of the 2011
clinical practice guideline. Am J Respir Crit Care Med. 192:e3–e19.
2015. View Article : Google Scholar : PubMed/NCBI
|
|
4
|
Merrill WW and Reynoldss HY: Bronchial
lavage in inflammatory lung disease. Clin Chest Med. 4:71–84.
1983.PubMed/NCBI
|
|
5
|
Katzenstein AL and Myers JL: Idopathic
pulmonary fibrosis: Clinical relevance of pathologic
classification. Am J Respir Crit Care Med. 157:1301–1315. 1998.
View Article : Google Scholar : PubMed/NCBI
|
|
6
|
Munger JS, Huang X, Kawakatsu H, Griffiths
MJ, Dalton SL, Wu J, Pittet JF, Kaminski N, Garat C, Matthay MA, et
al: The integrin alpha v beta 6 binds and activates latent TGF beta
1: A mechanism for regulating pulmonary inflammation and fibrosis.
Cell. 96:319–328. 1999. View Article : Google Scholar : PubMed/NCBI
|
|
7
|
Remy-Jardin M, Giraud F, Remy J, Copin MC,
Gosselin B and Duhamel A: Importance of groundglass attenuation in
chronic diffuse infiltrative lung disease: Pathologic-CT
correlation. Radiology. 189:693–698. 1993. View Article : Google Scholar : PubMed/NCBI
|
|
8
|
Baroke E, Gauldie J and Kolb M: New
treatment and markers of prognosis for idiopathic pulmonary
fibrosis: Lessons learned from translational research. Expert Rev
Respir Med. 7:465–478. 2013. View Article : Google Scholar : PubMed/NCBI
|
|
9
|
Selman M, King TE and Pardo A: American
Thoracic Society; European Respiratory Society and American College
of Chest Physicians: Idiopathic pulmonary fibrosis: Prevailing and
evolving hypotheses about its pathogenesis and implications for
therapy. Ann Intern Med. 134:136–151. 2001. View Article : Google Scholar : PubMed/NCBI
|
|
10
|
Noble PW, Barkauskas CE and Jiang D:
Pulmonary fibrosis: Patterns and perpetrators. J Clin Invest.
122:2756–2762. 2012. View
Article : Google Scholar : PubMed/NCBI
|
|
11
|
Lawson WE, Cheng DS, Degryse AL, Tanjore
H, Polosukhin VV, Xu XC, Newcomb DC, Jones BR, Roldan J, Lane KB,
et al: Endoplasmic reticulum stress enhances fibrotic remodeling in
the lungs. Pro Natl Acad Sci USA. 108:10562–10567. 2011. View Article : Google Scholar
|
|
12
|
Lawson WE, Crossno PF, Polosukhin VV,
Roldan J, Cheng DS, Lane KB, Blackwell TR, Xu C, Markin C, Ware LB,
et al: Endoplasmic reticulum stress in alveolar epithelial cells is
prominent in IPF: Association with altered surfactant protein
processing and herpesvirus infection. Am J Physiol Lung Cell Mol
Physiol. 294:L1119–L1126. 2008. View Article : Google Scholar : PubMed/NCBI
|
|
13
|
Chen CY, Peng WH, Wu LC, Wu CC and Hsu SL:
Luteolin ameliorates experimental lung fibrosis both in vivo and in
vitro: Implications for therapy of lung fibrosis. J Agric Food
Chem. 58:11653–11661. 2010. View Article : Google Scholar : PubMed/NCBI
|
|
14
|
Broekelmann TJ, Limper AH, Colby TV and
McDonald JA: Transforming growth factor beta-1 is present at sites
of extracellular matrix gene expression in human pulmonary
fibrosis. Proc Natl Acad Sci USA. 88:6642–6646. 1991. View Article : Google Scholar : PubMed/NCBI
|
|
15
|
Ho YY, Lagares D, Tager AM and Kapoor M:
Fibrosis-a lethal component of systemic sclerosis. Nat Rev
Rheumatol. 10:390–402. 2014. View Article : Google Scholar : PubMed/NCBI
|
|
16
|
Park S and Lee EJ: Recent advances in
idiopathic pulmonary fibrosis. Tuber Respir Dis (Seoul). 74:1–6.
2013. View Article : Google Scholar
|
|
17
|
Chen J, He B and Liu X: Experimental study
on effect of folium Ginkgo biloba in treating pulmonary
interstitial fibrosis in rats. Zhongguo Zhong Xi Yi Jie He Za Zhi.
20:441–443. 2000.(In Chinese). PubMed/NCBI
|
|
18
|
Xiao-Jiao LI, Guo G, Cheng ZX, Hui-Yun LI,
Zhang HS and Zhong QC: Effect of Shenmai Kaifei San on the level of
IL-6, TNF-α and TGF-β1 in patients with systemic sclerosis
complicated by pulmonary fibrosis. Rheumatism and Arthritis.
5:10–12. 2016.(In Chinese).
|
|
19
|
Ma X, Chen R, Liu X, Xie J, Si K and Duan
L: Effects of matrine on JAK-STAT signaling transduction pathways
in bleomycin-induced pulmonary fibrosis. Afr J Tradit Complement
Altern Med. 10:442–448. 2013.PubMed/NCBI
|
|
20
|
He WW, Zhang DP and Xie N: Effect of
curcumin on proliferation, apoptosis and the extracellular matrix
of human embryonic lung fibroblast. Pharm Clin Res. 21:322–325.
2013.
|
|
21
|
Thannickal VJ and Horowitz JC: Evolving
concepts of apoptosis in idiopathic pulmonary fibrosis. Proc Am
Thorc Soc. 3:350–356. 2006. View Article : Google Scholar
|
|
22
|
Nkyimbeng T, Ruppert C, Shiomi T, Dahal B,
Lang G, Seeger W, Okada Y, D'Armiento J and Günther A: Pivotal role
of matrix metalloproteinase 13 in extracellular matrix turnover in
idiopathic pulmonary fibrosis. PLoS One. 8:e732792013. View Article : Google Scholar : PubMed/NCBI
|
|
23
|
Tsukui T, Ueha S, Abe J, Hashimoto S,
Shichino S, Shimaoka T, Shand FH, Arakawa Y, Oshima K, Hattori M,
et al: Qualitative rather than quantitative changes are hallmarks
of fibroblasts in bleomycin-induced pulmonary fibrosis. Am J
Pathol. 183:758–773. 2013. View Article : Google Scholar : PubMed/NCBI
|
|
24
|
Kliment CR and Oury TD: Oxidative stress,
extracellular matrix targets, and idiopathic pulmonary fibrosis.
Free Radic Biol Med. 49:707–717. 2010. View Article : Google Scholar : PubMed/NCBI
|
|
25
|
Meltzer EB and Noble PW: Idiopathic
pulmonary fibrosis. Orphanet J Rare Dis. 3:82008. View Article : Google Scholar : PubMed/NCBI
|
|
26
|
Hinz B, Phan SH, Thannickal VJ, Galli A,
Bochaton-Piallat ML and Gabbiani G: The myofibroblast: One
function, multiple origins. Am J Pathol. 170:1807–1816. 2007.
View Article : Google Scholar : PubMed/NCBI
|
|
27
|
Zheng L, Zhou Z, Lin L, Alber S, Watkins
S, Kaminski N, Choi AM and Morse D: Carbon monoxide modulates
alpha-smooth muscle actin and small proline rich-1a expression in
fibrosis. Am J Respir Cell Mol Biol. 41:85–92. 2009. View Article : Google Scholar : PubMed/NCBI
|
|
28
|
Daniil ZD, Papageorgiou E, Koutsokera A,
Kostikas K, Kiropoulos T, Papaioannou AI and Gourgoulianis KI:
Serum levels of oxidative stress as a marker of disease severity in
idiopathic pulmonary fibrosis. Pulm Pharmacol Ther. 21:26–31. 2008.
View Article : Google Scholar : PubMed/NCBI
|
|
29
|
Bowler RP and Crapo JD: Oxidative stress
in airways: Is there a role for extracellular superoxide dismutase.
Am J Respir Crit Care Med. 166:S38–S43. 2002. View Article : Google Scholar : PubMed/NCBI
|
|
30
|
Serra V, von Zglinicki T, Lorenz M and
Saretzki G: Extracellular superoxide dismutase is a major
antioxidant in human fibroblasts and slows telomere shortening. J
BiolChem. 278:6824–6830. 2003.
|
|
31
|
Chen X and Chen WZ: Recent phremacological
progress of Ginkgobiloba extract for cardiovascular and
neuronal disease. Chin J Integ Trad West Med. 2:3001996.(In
Chinese).
|
|
32
|
Isah T: Rethinking Ginkgo biloba L:
Medicinal uses and conservation. Pharmacogn Rev. 9:140–148. 2015.
View Article : Google Scholar : PubMed/NCBI
|
|
33
|
Wang CG, Dai Y, Li DL and Ma KY: Ginkgo
biloba leaf extract action in scavenging free radicals and
reducing mutagenicity and toxicity of cigarette smoke in vivo. J
Environ Sci Health A Tox Hazard Subst Environ Eng. 45:498–505.
2010. View Article : Google Scholar : PubMed/NCBI
|
|
34
|
Akiba S, Chiba M, Mukaida Y, Tamura A and
Sato T: The leaf extract of Ginkgo Biloba L. suppresses
oxidized LDL-stimulated fibronectin production through an
antioxidant action in rat mesangial cells. Br J Pharmacol.
142:419–424. 2004. View Article : Google Scholar : PubMed/NCBI
|
|
35
|
Su X, Ma Y, Huang R, Wang X and Wang Y:
Effects of shenmai injection on blood SOD activity and MDA level in
senile patients with coronary heart disease. J Tradit Chin Med.
25:50–53. 2005.PubMed/NCBI
|
|
36
|
Zhao LM, Ma LJ, Zhang LX and Wu JZ:
Shenmai injection inhibiting the extracellular signal regulated
kinase-lnduced human airway smooth muscle proliferation in asthma.
Chin J Integr Med. 16:331–336. 2010. View Article : Google Scholar : PubMed/NCBI
|
|
37
|
Yu YH, Cui NQ, Fu Q and Li J: Change of
TH1/TH2 cytokine equilibrium in rats with severe sepsis and
therapeutic effect of recombinant interleukin-12 and shenmai
injection. Chin J Integr Med. 11:136–141. 2005. View Article : Google Scholar : PubMed/NCBI
|
|
38
|
Li Y, Wang B, Zhou C and Bi Y: Matrine
induces apoptosis in angiotensin II-stimulated hyperplasia of
cardiac fibroblasts: Effects on Bcl-2/Bax expression and caspase-3
activation. Basic Clin Pharmacol Toxicol. 101:1–8. 2007. View Article : Google Scholar : PubMed/NCBI
|
|
39
|
Jung E, Lee J, Huh S, Lee J, Hwang H, Kim
Y, Kim YW, Byun SY and Park D: Matrine inhibits PMA-induced MMP-1
expression in human dermal fibroblasts. Biofactors. 33:121–128.
2008. View Article : Google Scholar : PubMed/NCBI
|