Introduction
Lung cancer is the most common type of malignant
tumor and the leading cause of cancer-associated mortality
worldwide (1,2). Small cell lung cancer (SCLC) accounts
for 15–20% of all lung cancer cases and is characterized by rapid
growth and early metastatic spread (3). Of all newly diagnosed patients with
SCLC, ~70% present with advanced disease and require systemic
chemotherapy. In such cases, clinicians must promptly initiate
treatment. However, although SCLC is sensitive to chemotherapy,
with initial response rates of ≥60%, the 5-year overall survival
rate is <5% (4). In the last
decades, SCLC therapy and prognosis have not significantly improved
and no novel drugs have been approved in the recent years (5), although progress has been made in the
characterization of the genetic landscape of SCLC (6–8). In
addition to continued development of novel treatments, the
determination of the optimal use of the existing chemotherapies to
improve the survival rate of SCLC patients represents a major
clinical challenge.
Several combinations of chemotherapeutics may be
used to treat SCLC. However, the etoposide-cisplatin (EP) regimen
remains the primary choice of treatment and no novel
chemotherapeutic combinations have been identified to be superior
to EP as the first-line therapy in SCLC patients (9,10).
However, certain cases of SCLC do not respond well to EP
chemotherapy. Thus, the possibility to predict treatment outcomes
for SCLC patients, particularly those at high risk of responding
poorly to first-line chemotherapy, is of great interest. This may
allow for pre-chemotherapy risk stratification in SCLC and enable
clinicians to select a treatment tailored to each patient's
individual risk profile.
To date, no biomarkers with the ability to indicate
the clinical response of SCLC patients to treatment have been
identified; 75% of patients with SCLC have ≥2 circulating tumor
cells (CTCs)/7.5 ml peripheral venous blood. Thus, CTC detection
may be used to determine the response to therapy (11,12).
However, the low CTC number in blood may affect the reproducibility
of these tumor cell counts. Furthermore, the currently available
serum tumor markers for lung cancer cannot be used to monitor SCLC,
as they have relatively low sensitivity and specificity for cancer
cells; these include neuron-specific enolase (NSE), New York
esophageal squamous cell carcinoma 1 antibody, plasma fibrinogen,
D-dimer, carcinoembryonic antigen (CEA) and progastrin-releasing
peptide (ProGRP) (13–15). The identification of novel,
cost-effective and accurate biomarkers is crucial for predicting
the clinical response of SCLC patients to chemotherapy.
Previous radiological studies have performed
large-scale data analyses to improve the utilization of imaging
over the past decade. High-throughput medical image analysis has
been performed for quantitative feature extraction. From the
images, certain features are being extracted and converted into
data, which may in turn be analyzed using a decision support
system; this novel technology is known as radiomics (16). This method is particularly useful in
solid tumors that are unevenly shaped. Radiomics is able to capture
heterogeneity in a non-invasive and cost-effective way (17–19). In
fact, it is more useful than biopsy in this regard, as it reveals
heterogeneity across the entire tumor (20).
Computed tomography (CT) is the most commonly used
imaging modality, it is able to quantify tissue density with a high
resolution and provide clear tumor images through enhanced scanning
(19). In recent years, radiomics
research has greatly advanced with regard to CT image analysis.
Previous studies have identified features associated with tumor
histology (21–23), tumor staging (24), overall survival (25,26) and
gene mutations (27). However, to
the best of our knowledge, no previous study has elucidated the
prognostic value of radiomics in SCLC patients scheduled for
first-line chemotherapy.
The aim of the present study was to identify a
CT-based radiomics signature and investigate whether it is able to
predict the clinical response of SCLC patients to first-line
chemotherapy.
Materials and methods
Patient selection
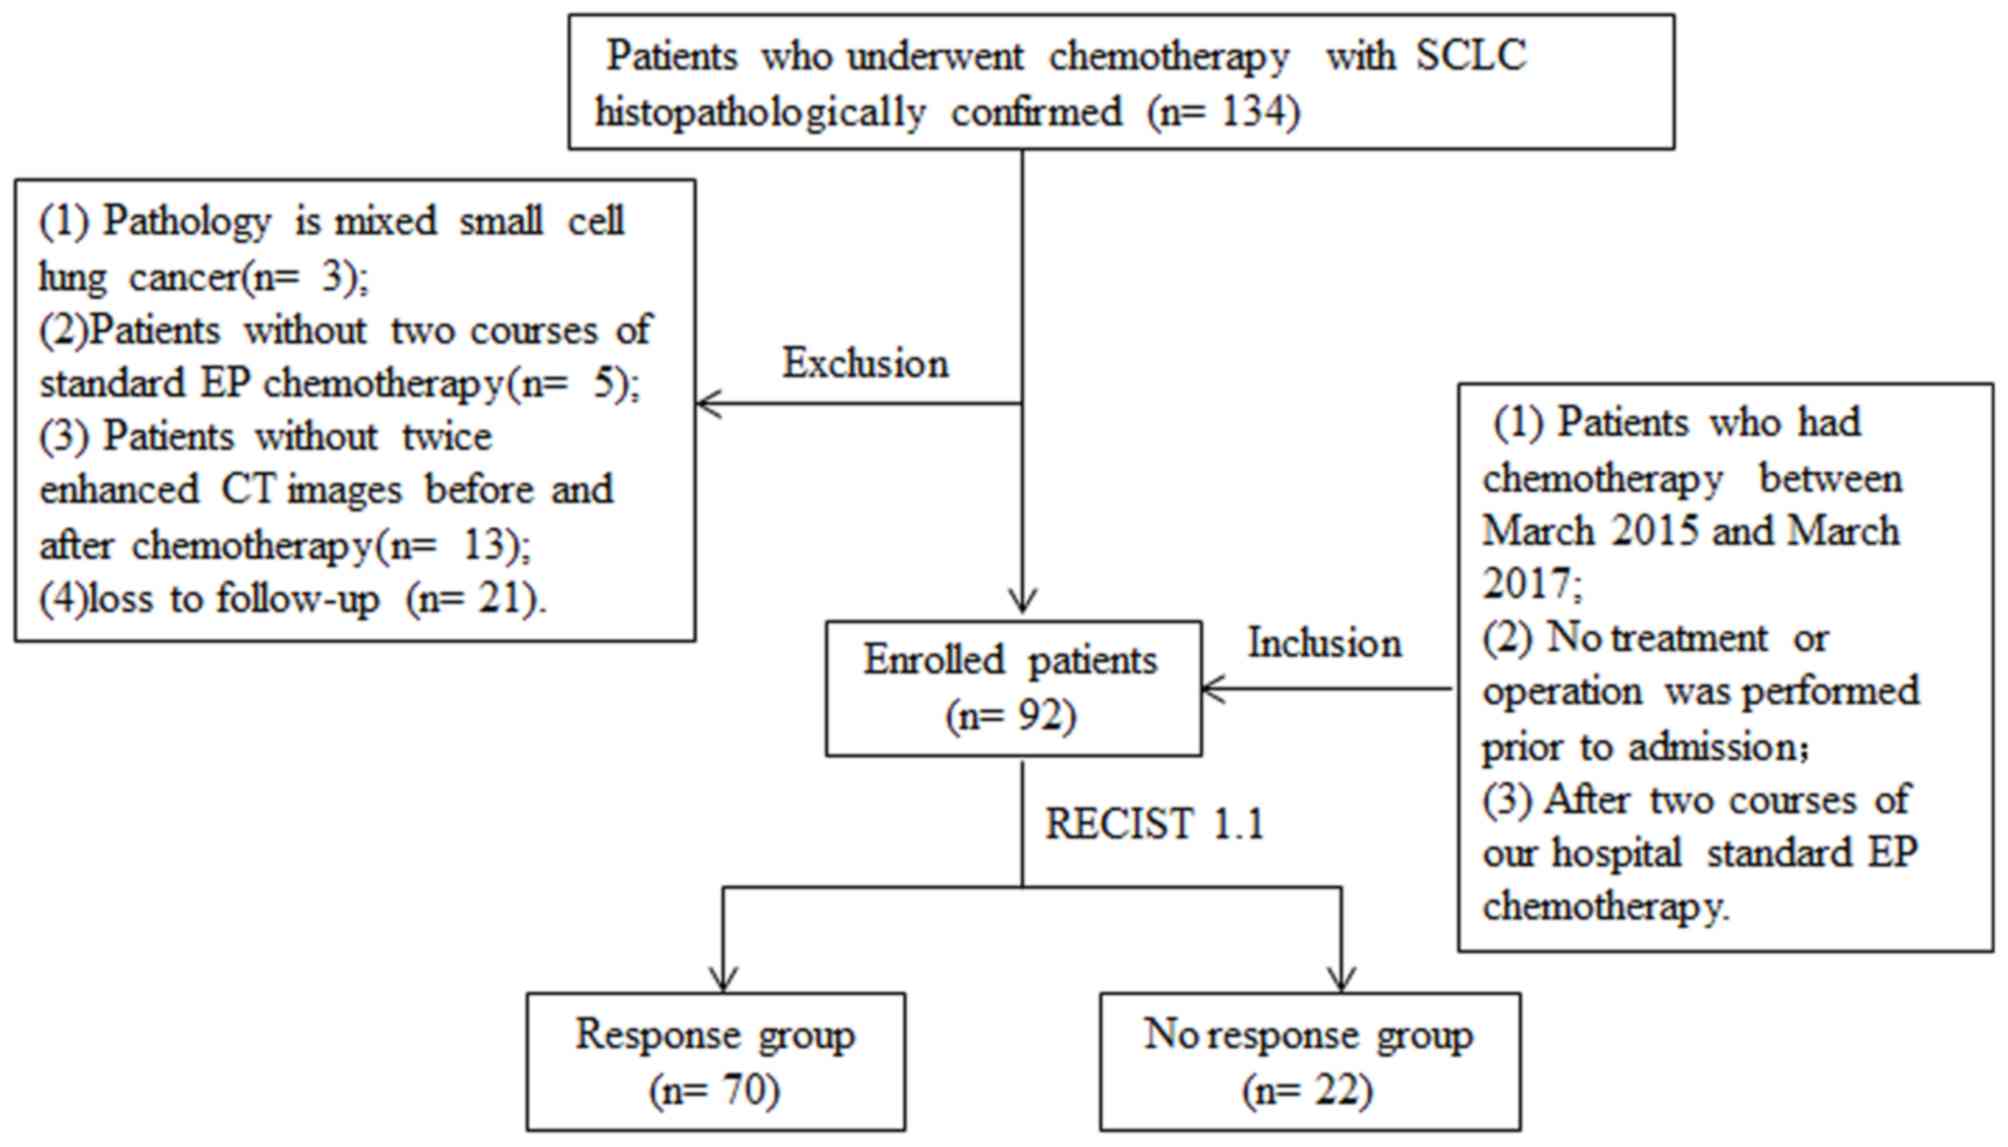
A total of 134 patients with SCLC
histopathologically confirmed by fine-needle aspiration biopsy and
received chemotherapy at Shandong Cancer Hospital Affiliated to
Shandong University (Jinan, China) were recruited for the present
study. The patient inclusion criteria were as follows: i)
Chemotherapy between March 2015 and March 2017; ii) No treatment or
operation prior to admission; and iii) two courses of standard EP
chemotherapy. Subjects with a mixed SCLC pathology (n=3), as well
as those who did not receive two courses of standard EP
chemotherapy (n=5), no availability of double-enhanced CT images
captured prior to and after chemotherapy (n=13) and those who were
lost to follow-up (n=21) were excluded (Fig. 1).
Therapeutic process and grouping
standard
A total of 92 patients with SCLC who received two
cycles of EP chemotherapy were included in the present study (EP
regimen: cisplatin at an accumulated dose of 80 mg/m2 IV
for 3 days and 100 mg/m2 IV etoposide daily (days 1–3).
The interval between the two cycles of EP chemotherapy was 18 days.
A chest CT scan was performed during the week prior to treatment
initiation and at 4 weeks following routine chemotherapy. In
accordance with the New Response Evaluation Criteria in Solid
Tumors (RECIST) 1.1 (28), two
experienced radiologists compared the CT imaging characteristics
from all scans obtained prior to chemotherapy compared with the
post-chemotherapy scans. Each radiologist evaluated the images in
the same manner and any discrepancies were resolved by discussion
until a consensus was reached. The patients were divided into the
following groups: Response group (n=70) and no response (n=22)
group. Those patients who achieved either a complete or a partial
response were assigned to the response group, whereas those with
stable disease or disease progression were assigned to the no
response group (29).
Clinicopathological factors
The potential clinicopathological factors associated
with SCLC including age (<60 years or ≥60 years), sex, tumor
extent (limited or diffuse) (30),
tumor (T)-stage, nodal (N)-stage, metastasis (M)-stage, tumor
location (central or peripheral), smoking (yes or no), smoking
period (≤10, 11–20, 21–30, or ≥30 years), smoking index (<400 or
≥400) and tumor laboratory indicators [ProGRP, <54.8 or ≥54.8
ng/ml; NSE, <3.4 or ≥3.4 ng/ml; CEA, <17 or ≥17 ng/ml; and
cytokeratin 19 fragment (Cyfra21-1), <3.3 or ≥3.3 ng/ml] were
analyzed.
CT image acquisition and
pre-processing imaging environment
All patients underwent pulmonary CT examination
using a Philips Brilliance 128i CT scanner (Philips Healthcare,
Amsterdam, Netherlands). The tube voltage and current were 120 kV
and 220 mA, respectively; the pitch was 1.0 and the collimator
measured 64×0.625 mm. The acquired data were reconstructed into
slices of 1.0 mm thickness at 1.0-mm intervals. The field of view
was 20×20 cm. Prior to each scan, 1.5 ml/kg non-ionic contrast
medium (Ultravist 300 mg I/ml; Schering Healthcare, Guangzhou,
Guangdong, China) was injected into the antecubital vein using a
20G needle at a flow rate of 3 ml/sec. Saline (30–40 ml) was
injected at the same flow rate. CT scanning was automatically
triggered using a bolus-tracking technique following administration
of the contrast agent. The region of interest was the pulmonary
artery trunk and a threshold of 100 Hounsfield units was set.
Scanning was triggered with a delay of 2 sec once the threshold was
reached.
Pre-processing
All original images captured prior to chemotherapy
were in Digital Imaging and Communications in Medicine format (the
international standard to transmit, store, retrieve, print, process
and display medical imaging information). Prior to extraction of
the quantitative radiomics features, the images required
3-dimensional (3D) manual segmentation. Itk-snap software (version
3.4; www.itksnap.org) was used for this
purpose. First, the abdominal window was contoured to identify its
boundaries with the chest wall and other soft tissues. The
pulmonary window was then contoured to capture the maximum extent
of the tumor in the lung parenchyma (25). All tumors were manually segmented and
completed independently by two radiologists with 11 and 20 years of
experience in CT imaging of thoracic malignancies, respectively.
Each radiologist reviewed the segmented images and any
discrepancies were resolved by discussion until a consensus was
reached. All images were normalized to gray values.
Radiomic feature extraction
In SCLC, radiomic feature extraction is performed in
3D volumes of interest (VOIs) in order to calculate a set of
statistical measures. These are then analyzed to determine which
are statistically significant. The 3D VOIs were comprised of 3D
regions of primary SCLC tumors. In each case, the 3D VOI was
segmented manually by two experienced (≥10 years experience)
radiologists. The radiologists delineated the boundaries of the
primary tumors on a transversal plane using an in-house manual
drawing program in MATLAB (version 7.0; The MathWorks, Inc. Natick,
Massachusetts, USA).
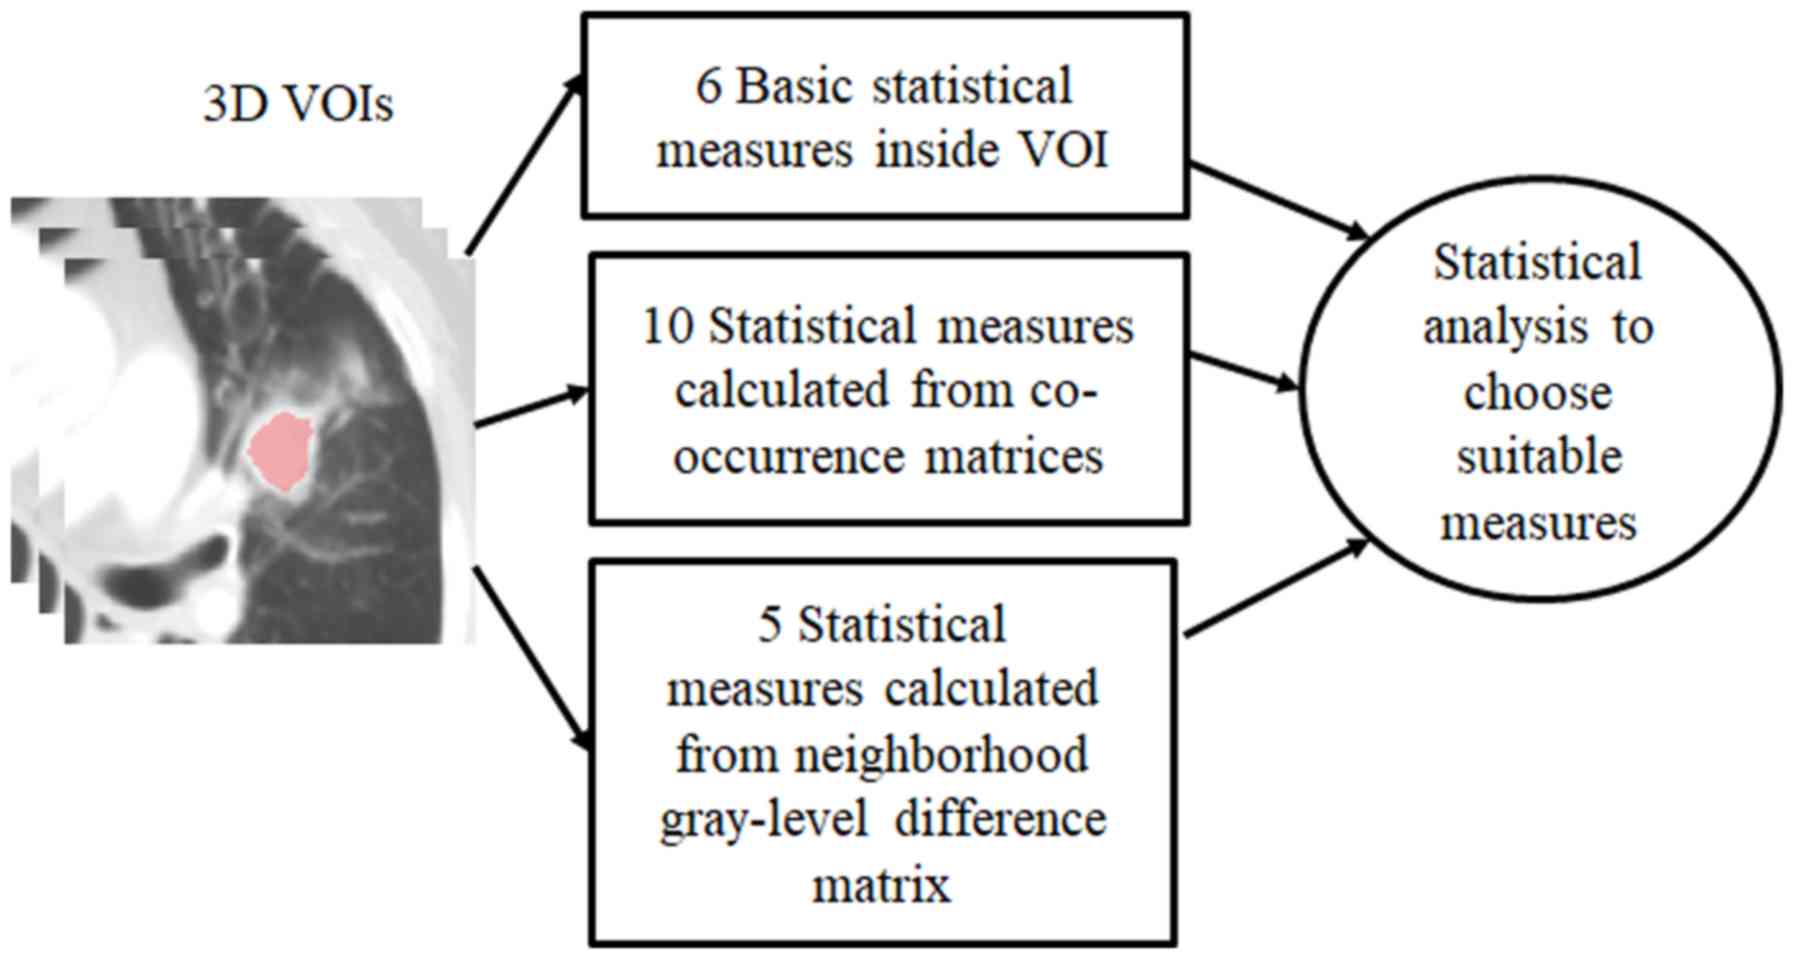
In the present study, the CT images were processed
using 3 different radiomic feature extraction strategies. The first
method of gray level histogram analysis (GLHA) was used to
calculate six parameters (31):
Maximum, minimum, mean, standard deviation, skewedness and kurtosis
of the CT values inside the 3D VOI. These parameters reflect the
basic statistical characteristics of pixels inside tumors. However,
they do not take into consideration the spatial information between
adjacent pixels.
The second method of spatial gray-level dependence
matrices (SGLDM) was used to calculate 10 statistical measures to
quantify the differences between two adjacent pixels along specific
directions: Entropy, angular second moment, contrast, homogeneity,
sum-mean, variance, correlation maximum probability, inverse
difference moment and cluster tendency. These parameters have been
defined by previous studies (32,33).
They are calculated from 2D co-occurrence matrices, whose function
Md(i, j) denotes the number of pairs of adjacent pixels with gray
level i and with gray level j along the dth direction. As CT images
are too thick for detailed analysis, only adjacent pixels within
the same transverse plane were considered. In the present study,
four directions along 0°, 45°, 90° and 135° were used.
The third method of neighborhood gray-tone
difference matrices (NGTDM) calculated five statistical parameters:
Coarseness, contrast, business, complexity and strength. They have
also been defined previously (34,35).
This method differs from SGLDM, which quantified the associations
between two adjacent pixels along given axes. Instead, this method
describes how the gray level of a pixel differs from that of all
its neighbors. The parameters were calculated on the basis of a
neighborhood gray-level difference matrix M(i). The elements of
this matrix consist of the differences between a pixel with gray
level i and all of its neighbors. As in SGLDM, a pixel's neighbors
are only defined along the same transverse plane. Table I presents the radiomic features of
these parameters, including category, label, feature name and
description. Fig. 2 presents a
diagram of the method adopted in the present study.
 | Table I.Information of the 21 radiomic
features. |
Table I.
Information of the 21 radiomic
features.
| Parameter
category/label | Feature name | Description |
|---|
| Gray level
histogram analysis |
|
G1 | Maximum of CT
value | Six statistics
calculated on gray-level distribution (histogram) without
considering spatial associations of voxels |
|
G2 | Minimum of CT
value |
|
|
G3 | Mean |
|
|
G4 | Standard
deviation |
|
|
G5 | Skewedness |
|
|
G6 | Kurtosis |
|
| Spatial gray-level
dependence matrix |
|
S1 | Entropy | Ten parameters
calculated from co-occurrence matrix, characterizing variations of
gray levels for a pair of consecutive voxels by considering spatial
associations |
|
S2 | Angular second
moment |
|
|
S3 | Contrast |
|
|
S4 | Homogeneity |
|
|
S5 | Sum-mean |
|
|
S6 | Variance |
|
|
S7 | Correlation |
|
|
S8 | Maximum
probability |
|
|
S9 | Inverse difference
moment |
|
|
S10 | Cluster
tendency |
|
| Neighborhood
gray-tone difference matrix |
|
N1 | Coarseness | Five parameters
calculated from neighborhood Five parameters calculated from
neighborhood gray.tone difference matrix, characterizing
differences of gray levels between a voxel and all its
neighbors |
|
N2 | Contrast |
|
|
N3 | Frequency of
involvement |
|
|
N4 | Complexity |
|
|
N5 | Intensity
level |
|
Statistical analysis
All statistical analyses were performed using SPSS
version 19.0 (IBM Corp., Armonk, NY, USA). Student's t-tests were
used for the comparison of two groups. Mann-Whitney U test was used
to analyze the differences between each of the 21
computer-extracted features between the responsive and
non-responsive two groups. Association between responsive and
non-responsive groups and clinicopathological data from patients
with SCLC was analyzed by Chi-square test. Binary logistic
regression analysis was performed to assess the influence of the 21
computer-extracted indexes on the treatment efficacy. Receiver
operating characteristic (ROC) curves were generated to determine
the optimal cut-off threshold values. The area under the curve
(AUC) (36) was used to evaluate the
accuracy of the radiomics signature and the model in predicting the
efficacy of chemotherapy. P≤0.05 was considered to indicate a
statistically significant difference.
Results
Clinicopathological
characteristics
The median age of the patients was 59 years (range,
22–83 years). Patients aged ≥60 years accounted for 43.5% of the
study population and the majority of the patients were male (n=74;
80.4%). Smokers accounted for 69.6% of the population and 40
patients (43.5%) presented with distant metastasis (Table II).
| Table II.Association between
clinicopathological parameters and patient outcome for patients
with SCLC. |
Table II.
Association between
clinicopathological parameters and patient outcome for patients
with SCLC.
| Parameter | Total (n=92) | Response group
(n=70) | No response group
(n=22) | P-value |
|---|
| Age (years) |
|
|
| 0.830 |
|
<60 | 52 (56.5) | 40 (57.1) | 12 (54.5) |
|
|
≥60 | 40 (43.5) | 30 (42.9) | 10 (45.5) |
|
| Sex |
|
|
| 0.546 |
|
Male | 74 (80.4) | 55 (78.6) | 19 (86.4) |
|
|
Female | 18 (19.6) | 15 (21.4) | 3 (13.6) |
|
| Tumor extent |
|
|
| 0.845 |
|
Limited | 36 (39.1) | 27 (38.6) | 9 (40.9) |
|
|
Extensive | 56 (60.9) | 43 (61.4) | 13 (59.1) |
|
| Location |
|
|
| 0.206 |
|
Central | 76 (82.6) | 60 (85.7) | 16 (72.7) |
|
|
Peripheral | 16 (17.4) | 10 (14.3) | 6 (27.3) |
|
| T-stage |
|
|
| 0.485 |
| 0 | 18 (19.6) | 13 (18.6) | 5 (22.7) |
|
| 1 | 26 (28.3) | 18 (25.7) | 8 (36.4) |
|
| 2 | 30 (32.6) | 23 (32.9) | 7 (31.8) |
|
| 3 | 18 (19.6) | 16 (22.9) | 2 (9.1) |
|
| N-stage |
|
|
| 0.338 |
| 0 | 5 (5.4) | 4 (5.7) | 1 (4.5) |
|
| 1 | 11 (12.0) | 6 (8.6) | 5 (22.7) |
|
| 2 | 39 (42.4) | 30 (42.9) | 9 (40.9) |
|
| 3 | 37 (40.2) | 30 (42.9) | 7 (31.8) |
|
| M-stage |
|
|
| 0.206 |
| 0 | 52 (56.5) | 37 (52.9) | 15 (68.2) |
|
| 1 | 40 (43.5) | 33 (47.1) | 7 (31.8) |
|
| Smoking |
|
|
| 0.050 |
| No | 28 (30.4) | 25 (35.7) | 3 (13.6) |
|
|
Yes | 64 (69.6) | 45 (64.3) | 19 (86.4) |
|
| Smoking index |
|
|
| 0.100 |
|
<400 | 39 (42.4) | 33 (47.1) | 6 (27.3) |
|
|
≥400 | 53 (57.6) | 37 (52.9) | 16 (72.7) |
|
| Smoking time
(years) |
|
|
| 0.378 |
|
≤10 | 30 (32.6) | 27 (38.6) | 3 (13.6) |
|
|
11–20 | 15 (16.3) | 10 (14.3) | 5 (22.7) |
|
|
21–30 | 22 (23.9) | 16 (22.9) | 6 (27.3) |
|
|
≥30 | 25 (27.2) | 17 (24.3) | 8 (36.4) |
|
| ProGRP (ng/ml) |
|
|
| 0.078 |
|
<54.8 | 71 (77.2) | 51 (72.9) | 20 (90.9) |
|
|
≥54.8 | 21 (22.8) | 19 (27.1) | 2 (9.1) |
|
| NSE (ng/ml) |
|
|
| 0.275 |
|
<3.4 | 19 (20.7) | 13 (18.6) | 6 (27.3) |
|
|
≥3.4 | 73 (79.3) | 57 (81.4) | 16 (72.7) |
|
| CEA (ng/ml) |
|
|
| 0.337 |
|
<17 | 50 (54.3) | 40 (57.1) | 10 (45.5) |
|
|
≥17 | 42 (45.7) | 30 (42.9) | 12 (54.5) |
|
| Cyfra21-1
(ng/ml) |
|
|
| 0.512 |
|
<3.3 | 53 (57.6) | 39 (55.7) | 14 (63.6) |
|
|
≥3.3 | 39 (42.4) | 31 (44.3) | 8 (36.4) |
|
Association of clinicopathological
factors with treatment efficacy
The smoking status in the response group was
significantly associated with treatment efficacy compared with the
no response group (P=0.05). However, there was no statistical
significance in the smoking time (≤10, 11–20, 21–30 and ≥30 years,
respectively; 38.6, 14.3, 22.8 and 24.3 vs. 13.6, 22.7, 27.3 and
36.4%) and smoking index (<400 and ≥400, respectively; 47.1 and
52.9 vs. 27.3 and 72.7%) between the response and no response
groups (P>0.05; Table II). This
may be due to the small size of the cohort, which limits the
statistical power of the data.
Association of the 21 radiomics
characteristics with treatment efficacy
Univariate analysis revealed that, among the 21
radiological features analyzed, two features exhibited significant
differences between the response and no response groups. The GLHA
category had a maximum CT value, which was significantly different
between the two groups (P=0.020). The inverse difference moment was
observed in the SGLDM category, which was also significantly
different between the two groups (P=0.037; Table III).
| Table III.Univariate analysis of the 21
radiomic features associated with the chemotherapeutic effect
introduced in Table II. |
Table III.
Univariate analysis of the 21
radiomic features associated with the chemotherapeutic effect
introduced in Table II.
| Radiomic
feature | Mean ± SD | Z | P-value |
|---|
| G1 | 119.750±12.976 | −2.325 | 0.020 |
| G2 | 1.110±4.835 | −0.175 | 0.861 |
| G3 | 63.080±4.222 | −1.895 | 0.058 |
| G4 | 9.600±4.677 | −0.989 | 0.323 |
| G5 | −0.700±1.103 | −1.071 | 0.284 |
| G6 | 10.760±6.485 | −1.510 | 0.131 |
| S1 | 6.240±0.407 | −0.622 | 0.534 |
| S2 | 0.004±0.063 | −0.201 | 0.840 |
| S3 | 66.050±47.271 | −1.565 | 0.118 |
| S4 | 0.300±0.0357 | −1.245 | 0.213 |
| S5 | 64.370±4.199 | −1.922 | 0.055 |
| S6 |
102.410±168.990 | −1.044 | 0.297 |
| S7 | 0.570±0.111 | −0.211 | 0.833 |
| S8 | 0.015±0.030 | −0.842 | 0.400 |
| S9 | 0.200±0.037 | −2.087 | 0.037 |
| S10 |
343.590±640.074 | −0.86 | 0.390 |
| N1 | 0.012±0.005 | −0.32 | 0.749 |
| N2 | 0.086±0.145 | −1.556 | 0.120 |
| N3 | 0.530±0.530 | −0.137 | 0.891 |
| N4 | 1.740±3.782 | −0.824 | 0.410 |
| N5 | 4.660±7.240 | −0.165 | 0.869 |
Establishment of prediction models of the
response to SCLC chemotherapy
Prediction results of the radiomic
features model
The radiomics signature model took into account 21
radiomics features. In the binary logistic regression analysis,
backward logistic regression was adopted (R2=0.358).
Analysis of the joint radiomics parameters revealed that the
following 5 radiomics features exhibited significant differences:
i) characteristics of the GLHA category [standard deviation,
P=0.003; odds ratio, 8.069; 95% confidence interval (CI),
2.077–31.340]; ii) characteristics of the SGLDM category (contrast,
P=0.005; odds ratio, 0.870; 95% CI, 0.790–0.959 and correlation,
P=0.030; odds ratio, <0.001; 95% CI 0–0.248); iii)
characteristics of the NGTDM category (contrast, P=0.002; odds
ratio, <0.001, 95% CI, 0–0.001); and complexity (N4, P=0.002;
odds ratio, 4.979; 95% CI, 1.790–13.847; Table IV).
| Table IV.Prediction model of 21 radiomics
features. |
Table IV.
Prediction model of 21 radiomics
features.
| Radiomic
feature | β | Odds ratio (95%
CI) | P-value |
|---|
| G2 | 0.176 | 1.193
(0.940–1.514) | 0.147 |
| G4 | 2.088 | 8.069
(2.077–31.340) | 0.003 |
| S3 | −0.139 | 0.870
(0.790–0.959) | 0.005 |
| S5 | 0.193 | 1.213
(0.962–1.531) | 0.103 |
| S7 | −14.174 | <0.001
(0–0.248) | 0.030 |
| N2 | −59.356 | <0.001
(0-<0.001) | 0.002 |
| N3 | 1.661 | 5.266
(0.672–41.244) | 0.114 |
| N4 | 1.605 | 4.979
(1.790–13.847) | 0.002 |
Prediction results of the
clinicopathological parameter model
The clinicopathological parameter model took into
account conventional clinical risk factors (age ≥60 years, male
sex, extensive tumor, central tumor, T1-3, N1-3, M1, smoking,
smoking time, smoking index ≥400, ProGRP ≥54.8 ng/ml, NSE ≥3.4
ng/ml, CEA ≥17 ng/ml and Cyfra21-1 ≥3.3 ng/ml). For the binary
logistic regression analysis, a backward logistic regression was
adopted (R2=0.121). The results revealed that only
smoking had a significant impact on the response to chemotherapy
(P=0.038; 95% CI, 0.020–0.894; Table
V).
| Table V.Multivariate analysis in the backward
logistic regression model of clinicopathological parameters. |
Table V.
Multivariate analysis in the backward
logistic regression model of clinicopathological parameters.
| Parameter | β | Odds ratio (95%
CI) | P-value |
|---|
| Gender
(female) | −0.764 | 0.466
(0.056–3.869) | 0.479 |
| Tumor extent
(extensive) | −0.747 | 0.474
(0.113–1.996) | 0.309 |
| Tumor location
(peripheral) | −0.587 | 0.556
(0.124–2.482) | 0.442 |
| T-stage (T0) |
|
| 0.323 |
| T1 | −1.173 | 0.309
(0.038–2.547) | 0.275 |
| T2 | −1.903 | 0.149
(0.020–1.111) | 0.063 |
| T3 | −1.296 | 0.274
(0.043–1.759) | 0.172 |
| M-stage (M0) | 0.836 | 2.306
(0.599–8.877) | 0.224 |
| Smoking (yes) | −2.024 | 0.132
(0.020–0.894) | 0.038 |
| ProGRP (≥54.8) | 0.789 | 2.202
(0.385–12.600) | 0.375 |
| NSE (≥3.4) | 0.651 | 1.917
(0.500–7.345) | 0.342 |
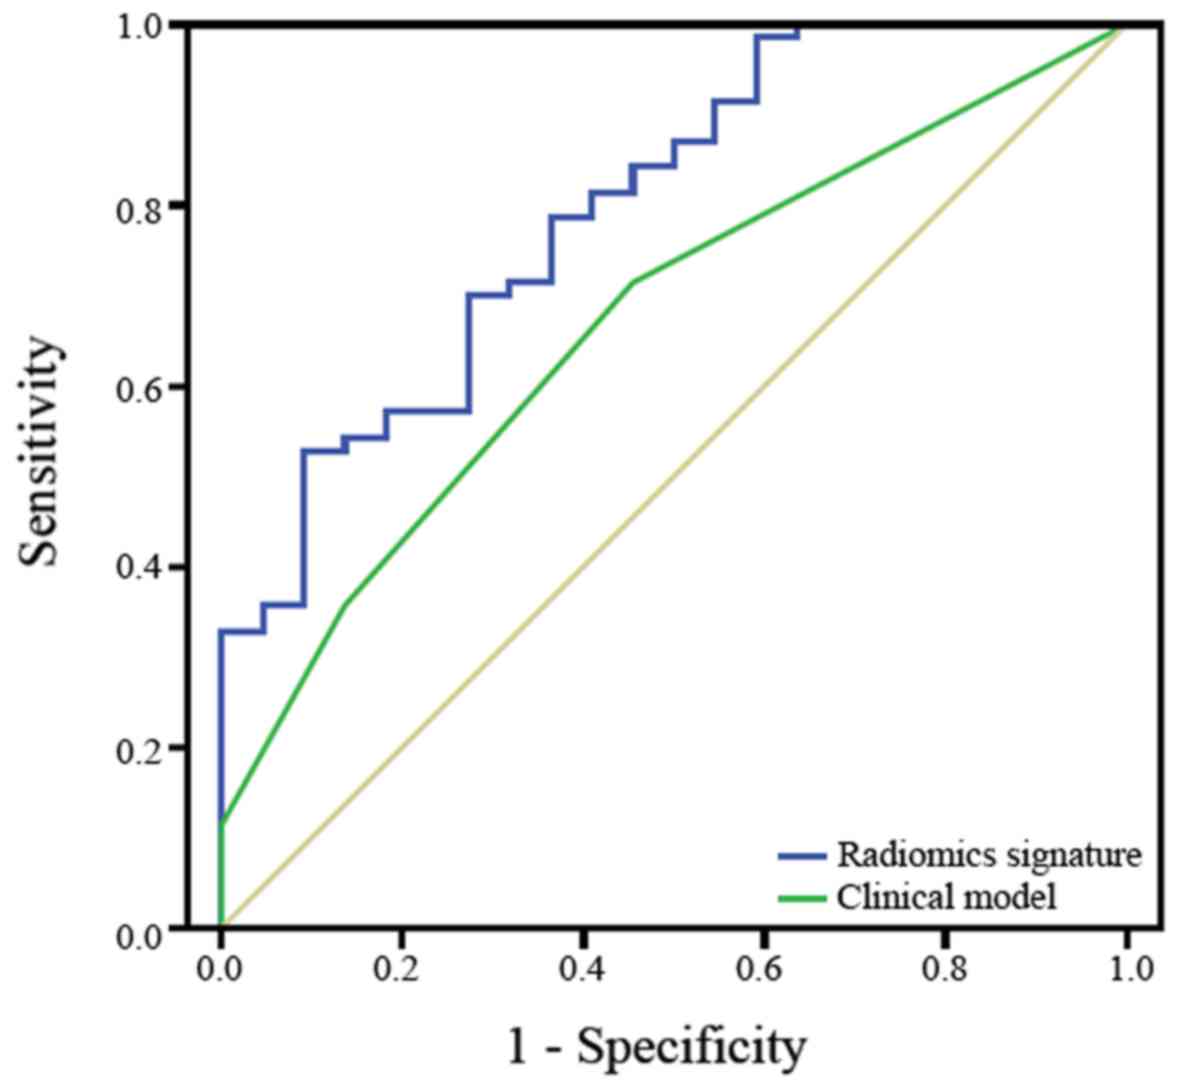
Predictive performance of the two
models
The ROC curves of the radiomics signature model and
clinicopathological parameter model were calculated using the
significant variables in the logistic regression and are presented
in Fig. 3. The AUC of the radiomics
signature was 0.797 (95% CI, 0.692–0.901). The AUC of the
clinicopathological parameter model was 0.670 (95% CI,
0.547–0.793). Regarding the prediction of the accuracy of the
efficacy of chemotherapy in patients with SCLC, the radiomics
signature model was superior to the clinicopathological parameter
model.
Discussion
In the subgroup of current and former smokers, the
lung cancer-associated mortality rate is highest at ~20%. Smoking
is an important independent risk factor for SCLC and ≥90% of
patients with SCLC are smokers (1,37). In
the present study, a significant difference in response to
treatment between the smoking and non-smoking groups was
identified. However, the smoking time and smoking index exhibited a
similar trend but there was no significant difference observed.
This may be due to the small size of the cohort, which limits the
statistical power of the data. The results of the present study
demonstrated that smoking was associated with the efficacy of
chemotherapy in patients with SCLC. Thus, smoking cessation should
be encouraged by clinicians.
At present, the tumor response is assessed by
determining changes in tumor size (RECIST 1.1 is based on the
diameter of the lesion). However, the tumor size does not truly
reflect the morphological, functional and metabolic changes
following tumor treatment, as necrosis, hemorrhage and cavitation
frequently occur following chemotherapy (38). The present study, statistical
analysis of primary tumor and radiomic texture characteristics may
be used to predict the efficacy of chemotherapy in patients with
SCLC. Such analyses constitute a powerful upgrade of the
morphological assessment system, as indicated in a study on the
pathological responses of lung cancer patients to chemotherapy
(39).
Radiomics provides a non-invasive, rapid,
cost-effective and reproducible method for detailed and
comprehensive characterization of the tumor phenotypic information
(shape, intensity, texture and wavelets) (17–19,36,40,41). It
may reduce the requirement for biopsy and it appears to offer a
nearly limitless supply of imaging information that may potentially
aid in the prediction of the response to chemotherapy as early as
possible and, in turn, reduce unnecessary chemotherapy (42). Recently, radiomics has made a series
of advances in tumor prediction. A radiomics signature has been
demonstrated to be a biomarker for distant metastasis of lung
adenocarcinoma (AUC=0.61) (25). It
is able to predict histopathological features of lung carcinoma
(22,23,43,44), the
recurrence of hepatocellular carcinoma (AUC=0.817) (45) and pre-operative prediction of lymph
node metastasis in colorectal cancer (AUC=0.736) (46). Radiomics studies of lung cancer have
mostly focused on non-SCLC (20,22–26,43);
however, to the best of our knowledge, no previous study has
investigated radiomics approaches in SCLC.
Radiomics features may be divided into four
categories: Morphology, statistics, region and model. The
statistical features of these categories may be classified as
single-point statistics (histogram) or higher-order statistics
(texture) (47). In the present
study, 21 quantitative parameters were extracted from the
statistical radiology characteristics. GLHA features constitute
single-point statistics, which include 6 statistics (maximum of CT
value, minimum of CT value, mean, standard deviation, skewedness
and kurtosis) calculated from gray-level distributions (histogram)
of voxels without considering spatial associations. SGLDM
parameters include 10 statistics calculated from a co-occurrence
matrix, characterizing variations of gray levels for a pair of
consecutive voxels by considering spatial associations. NGTDM
parameters use the intensity values of a neighborhood instead of
one pixel to characterize differences in gray levels between a
voxel and all its neighbors. SGLDM and NGTDM constitute
higher-order statistics. They may be used to obtain information
regarding the spatial association between pixels and thus reflect
the textural characteristics of tumors. Ultimately, the five
characteristics that exhibited significant differences between the
effective and ineffective groups were included in the present
model; the first- and higher-order statistics were included. Of
note, the radiological features prediction model based on these
features (AUC=0.797) had a higher predictive accuracy than the
model of clinicopathological characteristics (AUC=0.670),
indicating that radiomics features provide more information
regarding heterogeneity within a tumor, and that the radiomics
signature may successfully stratify chemotherapy patients into
high- and low-risk groups. This would allow for the targeted and
continued treatment of patients expected to exhibit a poor response
to first-line chemotherapy, and may improve long-term patient
survival.
In conclusion, the results of the present study
revealed that a radiomics signature may be an independent predictor
of the efficacy of chemotherapy in SCLC patients. It represents a
novel biomarker that may be used for quantitative analysis in
radiology and this information may help clinicians to better
evaluate patients and select optimal treatment strategies.
Acknowledgements
Not applicable.
Funding
The present study was supported by grants from the
Taishan Scholars Project, National Natural Science Foundation
Research (grant nos. 81371548, 81571672 and 61603218), and the
Shandong Provincial Natural Science Foundation (grant no.
ZR2014HQ054).
Availability of data and materials
The datasets used and/or analyzed during the current
study are available from the corresponding author on reasonable
request.
Authors' contributions
XW, XQ and HW contributed to the conception/design
of the study; HW, FY and ZL acquired the data; HW, FY, ZL, SS, FX,
HL, PL and XW analyzed the data; HW, QL and XQ prepared the
manuscript. QL also made substantial contributions to acquisition,
analysis and interpretation of data All authors critically revised
and approved the final version of the manuscript.
Ethics approval and consent to
participate
The current study was performed in accordance with
the Declaration of Helsinki. The present study was approved by the
Ethics Committee of Shandong Cancer Hospital Affiliated to Shandong
University (Jinan, China) and written informed consent was obtained
from each participant prior to the study.
Patient consent for publication
Not applicable.
Competing interests
The authors declare that they have no competing
interests.
References
|
1
|
Siegel RL, Miller KD and Jemal A: Cancer
Statistics, 2017. CA Cancer J Clin. 67:7–30. 2017. View Article : Google Scholar : PubMed/NCBI
|
|
2
|
Chen W, Zheng R, Baade PD, Zhang S, Zeng
H, Bray F, Jemal A, Yu XQ and He J: Cancer statistics in China,
2015. CA Cancer J Clin. 66:115–132. 2016. View Article : Google Scholar : PubMed/NCBI
|
|
3
|
van Meerbeeck JP, Fennell DA and De
Ruysscher DK: Small-cell lung cancer. Lancet. 378:1741–1755. 2011.
View Article : Google Scholar : PubMed/NCBI
|
|
4
|
Alvarado-Luna G and Morales-Espinosa D:
Treatment for small cell lung cancer, where are we now?-a review.
Transl Lung Cancer Res. 5:26–38. 2016.PubMed/NCBI
|
|
5
|
Bunn PA Jr, Minna JD, Augustyn A, Gazdar
AF, Ouadah Y, Krasnow MA, Berns A, Brambilla E, Rekhtman N, Massion
PP, et al: Small cell lung cancer: Can recent advances in biology
and molecular biology be translated into improved outcomes? J
Thorac Oncol. 11:453–474. 2016. View Article : Google Scholar : PubMed/NCBI
|
|
6
|
Polański R, Hodgkinson CL, Fusi A, Nonaka
D, Priest L, Kelly P, Trapani F, Bishop PW, White A, Critchlow SE,
et al: Activity of the monocarboxylate transporter 1 inhibitor
AZD3965 in small cell lung cancer. Clin Cancer Res. 20:926–937.
2014. View Article : Google Scholar : PubMed/NCBI
|
|
7
|
Sen T, Tong P, Stewart CA, Cristea S,
Valliani A, Shames DS, Redwood AB, Fan YH, Li L, Glisson BS, et al:
CHK1 inhibition in small-cell lung cancer produces single-agent
activity in biomarker-defined disease subsets and combination
activity with cisplatin or olaparib. Cancer Res. 77:3870–3884.
2017. View Article : Google Scholar : PubMed/NCBI
|
|
8
|
Ross JS, Wang K, Elkadi OR, Tarasen A,
Foulke L, Sheehan CE, Otto GA, Palmer G, Yelensky R, Lipson D, et
al: Next-generation sequencing reveals frequent consistent genomic
alterations in small cell undifferentiated lung cancer. J Clin
Pathol. 67:772–776. 2014. View Article : Google Scholar : PubMed/NCBI
|
|
9
|
Qiu YF, Liu ZG, Yang WJ, Zhao Y, Tang J,
Tang WZ, Jin Y, Li F, Zhong R and Wang H: Research progress in the
treatment of small cell lung cancer. J Cancer. 8:29–38. 2017.
View Article : Google Scholar : PubMed/NCBI
|
|
10
|
Lu HY, Wang XJ and Mao WM: Targeted
therapies in small cell lung cancer. Oncol Lett. 5:3–11.
2013.PubMed/NCBI
|
|
11
|
Hiltermann TJ, Pore MM, van den Berg A,
Timens W, Boezen HM, Liesker JJ, Schouwink JH, Wijnands WJ, Kerner
GS, Kruyt FA, et al: Circulating tumor cells in small-cell lung
cancer: A predictive and prognostic factor. Ann Oncol.
23:2937–2942. 2012. View Article : Google Scholar : PubMed/NCBI
|
|
12
|
Hou JM, Krebs MG, Lancashire L, Sloane R,
Backen A, Swain RK, Priest LJ, Greystoke A, Zhou C, Morris K, et
al: Clinical significance and molecular characteristics of
circulating tumor cells and circulating tumor microemboli in
patients with small-cell lung cancer. J Clin Oncol. 30:525–532.
2012. View Article : Google Scholar : PubMed/NCBI
|
|
13
|
Zhu LR, Li J, Chen P, Jiang Q and Tang XP:
Clinical significance of plasma fibrinogen and D-dimer in
predicting the chemotherapy efficacy and prognosis for small cell
lung cancer patients. Clin Transl Oncol. 18:178–188. 2016.
View Article : Google Scholar : PubMed/NCBI
|
|
14
|
Yang J, Jiao S, Kang J, Li R and Zhang G:
Application of serum NY-ESO-1 antibody assay for early SCLC
diagnosis. Int J Clin Exp Pathol. 8:14959–14964. 2015.PubMed/NCBI
|
|
15
|
Buil-Bruna N, López-Picazo JM,
Moreno-Jiménez M, Martin-Algarra S, Ribba B and Trocóniz IF: A
population pharmacodynamic model for lactate dehydrogenase and
neuron specific enolase to predict tumor progression in small cell
lung cancer patients. AAPS J. 16:609–619. 2014. View Article : Google Scholar : PubMed/NCBI
|
|
16
|
Gillies RJ, Kinahan PE and Hricak H:
Radiomics: Images are more than pictures, they are data. Radiology.
278:563–577. 2016. View Article : Google Scholar : PubMed/NCBI
|
|
17
|
Lambin P, Rios-Velazquez E, Leijenaar R,
Carvalho S, van Stiphout RG, Granton P, Zegers CM, Gillies R,
Boellard R, Dekker A and Aerts HJ: Radiomics: Extracting more
information from medical images using advanced feature analysis.
Eur J Cancer. 48:441–446. 2012. View Article : Google Scholar : PubMed/NCBI
|
|
18
|
Chen B, Zhang R, Gan Y, Yang L and Li W:
Development and clinical application of radiomics in lung cancer.
Radiat Oncol. 12:1542017. View Article : Google Scholar : PubMed/NCBI
|
|
19
|
Aerts HJ, Velazquez ER, Leijenaar RT,
Parmar C, Grossmann P, Carvalho S, Bussink J, Monshouwer R,
Haibe-Kains B, Rietveld D, et al: Decoding tumour phenotype by
noninvasive imaging using a quantitative radiomics approach. Nat
Commun. 5:40062014. View Article : Google Scholar : PubMed/NCBI
|
|
20
|
Fave X, Zhang L, Yang J, Mackin D, Balter
P, Gomez D, Followill D, Jones AK, Stingo F, Liao Z, et al:
Delta-radiomics features for the prediction of patient outcomes in
non-small cell lung cancer. Sci Rep. 7:5882017. View Article : Google Scholar : PubMed/NCBI
|
|
21
|
Wang H, Guo XH, Jia ZW, Li HK, Liang ZG,
Li KC and He Q: Multilevel binomial logistic prediction model for
malignant pulmonary nodules based on texture features of CT image.
Eur J Radiol. 74:124–129. 2010. View Article : Google Scholar : PubMed/NCBI
|
|
22
|
Ferreira Junior JR, Koenigkam-Santos M,
Cipriano FEG, Fabro AT and Azevedo-Marques PM: Radiomics-based
features for pattern recognition of lung cancer histopathology and
metastases. Comput Methods Programs Biomed. 159:23–30. 2018.
View Article : Google Scholar : PubMed/NCBI
|
|
23
|
Wu W, Parmar C, Grossmann P, Quackenbush
J, Lambin P, Bussink J, Mak R and Aerts HJ: Exploratory study to
identify radiomics classifiers for lung cancer histology. Front
Oncol. 6:712016. View Article : Google Scholar : PubMed/NCBI
|
|
24
|
Ganeshan B, Abaleke S, Young RC, Chatwin
CR and Miles KA: Texture analysis of non-small cell lung cancer on
unenhanced computed tomography: Initial evidence for a relationship
with tumour glucose metabolism and stage. Cancer Imaging.
10:137–143. 2010. View Article : Google Scholar : PubMed/NCBI
|
|
25
|
Coroller TP, Grossmann P, Hou Y, Rios
Velazquez E, Leijenaar RT, Hermann G, Lambin P, Haibe-Kains B, Mak
RH and Aerts HJ: CT-based radiomic signature predicts distant
metastasis in lung adenocarcinoma. Radiother Oncol. 114:345–350.
2015. View Article : Google Scholar : PubMed/NCBI
|
|
26
|
Fried DV, Tucker SL, Zhou S, Liao Z,
Mawlawi O, Ibbott G and Court LE: Prognostic value and
reproducibility of pretreatment CT texture features in stage III
non-small cell lung cancer. Int J Radiat Oncol Biol Phys.
90:834–842. 2014. View Article : Google Scholar : PubMed/NCBI
|
|
27
|
Gevaert O, Xu J, Hoang CD, Leung AN, Xu Y,
Quon A, Rubin DL, Napel S and Plevritis SK: Non-small cell lung
cancer: Identifying prognostic imaging biomarkers by leveraging
public gene expression microarray data-methods and preliminary
results. Radiology. 264:387–396. 2012. View Article : Google Scholar : PubMed/NCBI
|
|
28
|
Eisenhauer EA, Therasse P, Bogaerts J,
Schwartz LH, Sargent D, Ford R, Dancey J, Arbuck S, Gwyther S,
Mooney M, et al: New response evaluation criteria in solid tumours:
Revised RECIST guideline (version 1.1). Eur J Cancer. 45:228–247.
2009. View Article : Google Scholar : PubMed/NCBI
|
|
29
|
Ohno Y, Fujisawa Y, Koyama H, Kishida Y,
Seki S, Sugihara N and Yoshikawa T: Dynamic contrast-enhanced
perfusion area-detector CT assessed with various mathematical
models: Its capability for therapeutic outcome prediction for
non-small cell lung cancer patients with chemoradiotherapy as
compared with that of FDG-PET/CT. Eur J Radiol. 86:83–91. 2017.
View Article : Google Scholar : PubMed/NCBI
|
|
30
|
Zelen M: Keynote address on biostatistics
and data retrieval. Cancer Chemother Rep 3. 4:31–42.
1973.PubMed/NCBI
|
|
31
|
Huang X, Cheng Z, Huang Y, Liang C, He L,
Ma Z, Chen X, Wu X, Li Y, Liang C and Liu Z: CT-based radiomics
signature to discriminate high-grade from low-grade colorectal
adenocarcinoma. Acad Radiol. 25:1285–1297. 2018. View Article : Google Scholar : PubMed/NCBI
|
|
32
|
Haralick RM, Shanmugam K and Dinstein I:
Textural features for image classification. IEEE Trans Syst Man
Cybern. 3:610–621. 1973. View Article : Google Scholar
|
|
33
|
Kurani AS, Xu DH, Furst J and Raicu DS:
Co-occurrence matrices for volumetric data. Proceedings of the 7th
IASTED International Conference on Computer Graphics and Imaging.
CGIM. (Kauai, Hawaii). 447–452. 2004.
|
|
34
|
Amadasun M and King R: Textural features
corresponding to textural properties. IEEE Trans Systems Man
Cybern. 19:1264–1274. 1989. View Article : Google Scholar
|
|
35
|
Xu R, Kido S, Suga K, Hirano Y, Tachibana
R, Muramatsu K, Chagawa K and Tanaka S: Texture analysis on
(18)F-FDG PET/CT images to differentiate malignant and benign bone
and soft-tissue lesions. Ann Nucl Med. 28:926–935. 2014. View Article : Google Scholar : PubMed/NCBI
|
|
36
|
van Griethuysen JJM, Fedorov A, Parmar C,
Hosny A, Aucoin N, Narayan V, Beets-Tan RGH, Fillion-Robin JC,
Pieper S and Aerts HJWL: Computational radiomics system to decode
the radiographic phenotype. Cancer Res. 77:e104–e107. 2017.
View Article : Google Scholar : PubMed/NCBI
|
|
37
|
Pesch B, Kendzia B, Gustavsson P, Jöckel
KH, Johnen G, Pohlabeln H, Olsson A, Ahrens W, Gross IM, Brüske I,
et al: Cigarette smoking and lung cancer-relative risk estimates
for the major histological types from a pooled analysis of
case-control studies. Int J Cancer. 131:1210–1219. 2012. View Article : Google Scholar : PubMed/NCBI
|
|
38
|
Kang H, Lee HY, Lee KS and Kim JH:
Imaging-based tumor treatment response evaluation: Review of
conventional, new, and emerging concepts. Korean J Radiol.
13:371–390. 2012. View Article : Google Scholar : PubMed/NCBI
|
|
39
|
Chong Y, Kim JH, Lee HY, Ahn YC, Lee KS,
Ahn MJ, Kim J, Shim YM, Han J and Choi YL: Quantitative CT
variables enabling response prediction in neoadjuvant therapy with
EGFR-TKIs: Are they different from those in neoadjuvant concurrent
chemoradiotherapy? PLoS One. 9:e885982014. View Article : Google Scholar : PubMed/NCBI
|
|
40
|
Zhong Y, Yuan M, Zhang T, Zhang YD, Li H
and Yu TF: Radiomics approach to prediction of occult mediastinal
lymph node metastasis of lung adenocarcinoma. AJR Am J Roentgenol.
211:109–113. 2018. View Article : Google Scholar : PubMed/NCBI
|
|
41
|
Bogowicz M, Riesterer O, Ikenberg K, Stieb
S, Moch H, Studer G, Guckenberger M and Tanadini-Lang S: Computed
tomography radiomics predicts HPV status and local tumor control
after definitive radiochemotherapy in head and neck squamous cell
carcinoma. Int J Radiat Oncol Biol Phys. 99:921–928. 2017.
View Article : Google Scholar : PubMed/NCBI
|
|
42
|
Avanzo M, Stancanello J and El Naqa I:
Beyond imaging: The promise of radiomics. Phys Med. 38:122–139.
2017. View Article : Google Scholar : PubMed/NCBI
|
|
43
|
Ha S, Choi H, Cheon GJ, Kang KW, Chung JK,
Kim EE and Lee DS: Autoclustering of non-small cell lung carcinoma
subtypes on (18)F-FDG PET using texture analysis: A preliminary
result. Nucl Med Mol Imaging. 48:278–286. 2014. View Article : Google Scholar : PubMed/NCBI
|
|
44
|
Patil R, Mahadevaiah G and Dekker A: An
approach toward automatic classification of tumor histopathology of
non-small cell lung cancer based on radiomic features. Tomography.
2:374–377. 2016. View Article : Google Scholar : PubMed/NCBI
|
|
45
|
Zhou Y, He L, Huang Y, Chen S, Wu P, Ye W,
Liu Z and Liang C: CT-based radiomics signature: a potential
biomarker for preoperative prediction of early recurrence in
hepatocellular carcinoma. Abdom Radiol (NY). 42:1695–1704. 2017.
View Article : Google Scholar : PubMed/NCBI
|
|
46
|
Huang YQ, Liang CH, He L, Tian J, Liang
CS, Chen X, Ma ZL and Liu ZY: Development and validation of a
radiomics nomogram for preoperative prediction of lymph node
metastasis in colorectal cancer. J Clin Oncol. 34:2157–2164. 2016.
View Article : Google Scholar : PubMed/NCBI
|
|
47
|
Lee G, Lee HY, Park H, Schiebler ML, van
Beek EJR, Ohno Y, Seo JB and Leung A: Radiomics and its emerging
role in lung cancer research, imaging biomarkers and clinical
management: State of the art. Eur J Radiol. 86:297–307. 2017.
View Article : Google Scholar : PubMed/NCBI
|