Introduction
The liver receives a dual blood supply from the
hepatic portal vein and the hepatic artery. The portal vein
provides 70–80% of the supply, carrying nutrients and various other
substances to the liver. The remaining 20–30% of the blood supply
comes via the hepatic artery and mainly nourishes the biliary
system (1). While the blood
pressure of the arterial system exceeds 100 mmHg, the pressure of
the portal vein is as low as 6–8 mmHg. Due to this pressure
difference, when problems arise in the liver or other areas
supplied by these vessels, the portal vein is usually the first
vessel affected, therefore leading to a reduced blood flow. Such
reduction in the total hepatic blood supply appears to activate a
compensatory mechanism that increases the arterial blood flow
(1–4).
Our group is studying hepatic hemodynamic changes in
an effort to understand the pathology of liver disease.
In the present study, a case of acute portal vein
thrombosis is reported that may reveal, in part, the mechanism that
regulates the blood flow balance between the hepatic artery and the
hepatic portal vein.
Case report
Patient history and presentation
This study was performed with approval of the Ethics
Committee at Toho University Omori Medical Center (Tokyo, Japan).
Written informed patient consent was obtained from the patient. A
55-year-old male developed a fever of ≥39°C and intermittent pain
in the lower right abdomen in April 2011. The patient visited the
Toho University Omori Medical Center 7 days subsequent to onset due
to gradually intensifying pain and yellow eyes. The patient had no
history of alcohol consumption or smoking, but was treated
previously for cutaneous lupus erythematosus. His family history
revealed nothing of note. At the initial visit, the patient was
alert with a blood pressure of 140/76 mmHg, a heart rate of 100 bpm
and a body temperature of 38.3°C. The palpebral conjunctiva showed
no signs of anemia, but the bulbar conjunctiva revealed a yellowish
discoloration. Pure heart sounds, clear breath sounds and a soft,
flat abdomen were noted. Although the abdomen in the lower right
quadrant was tender to touch, there was no muscular defense or
rebound tenderness. The liver and spleen were not palpable and no
edema was present in the lower extremities. The hematological
findings showed 21.0 mg/dl C-reactive protein (CRP), a white blood
cell (WBC) count of 16,900 cells/μl, indicating a heightened
inflammatory response, a reduced platelet (Plt) count of
37,000/μl and high levels of fibrin degradation products
(FDPs) and D-dimers. The levels of hepatic and biliary enzymes
(Table I) were also increased. On
the basis of these findings, the patient was admitted with
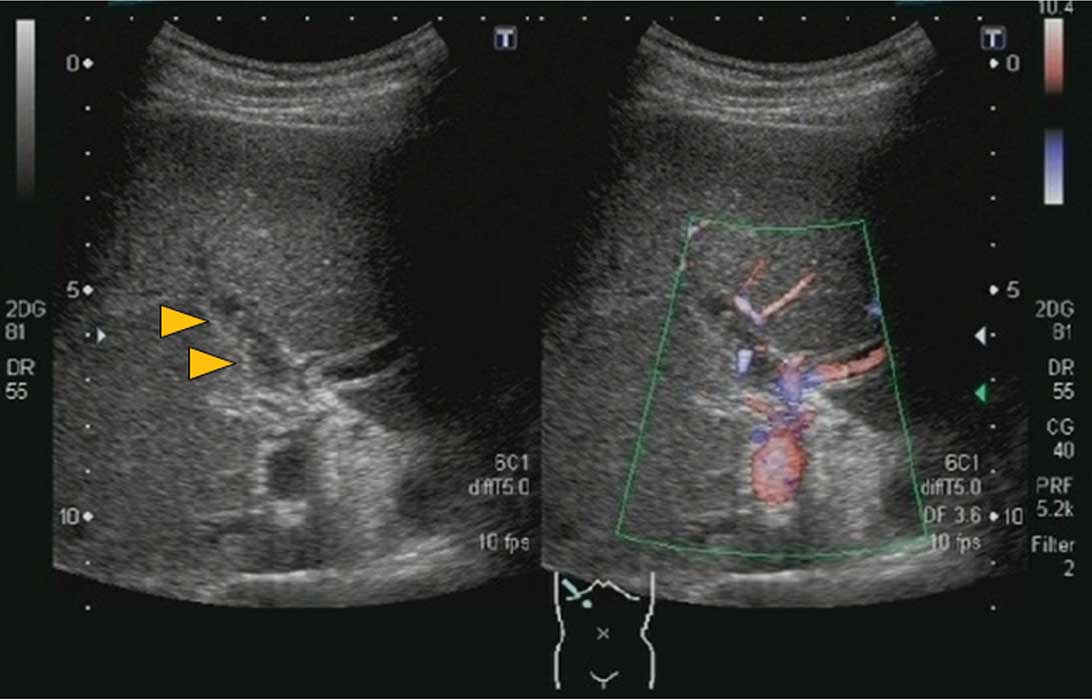
suspected sepsis. Abdominal ultrasonography (US) performed on
admission revealed a solid lesion with a mixed hyper- and
hypoechoic pattern in the right branch of the hepatic portal vein
with virtually no blood flow detected by color Doppler US. There
was no portal vein expansion noted. From these findings, a
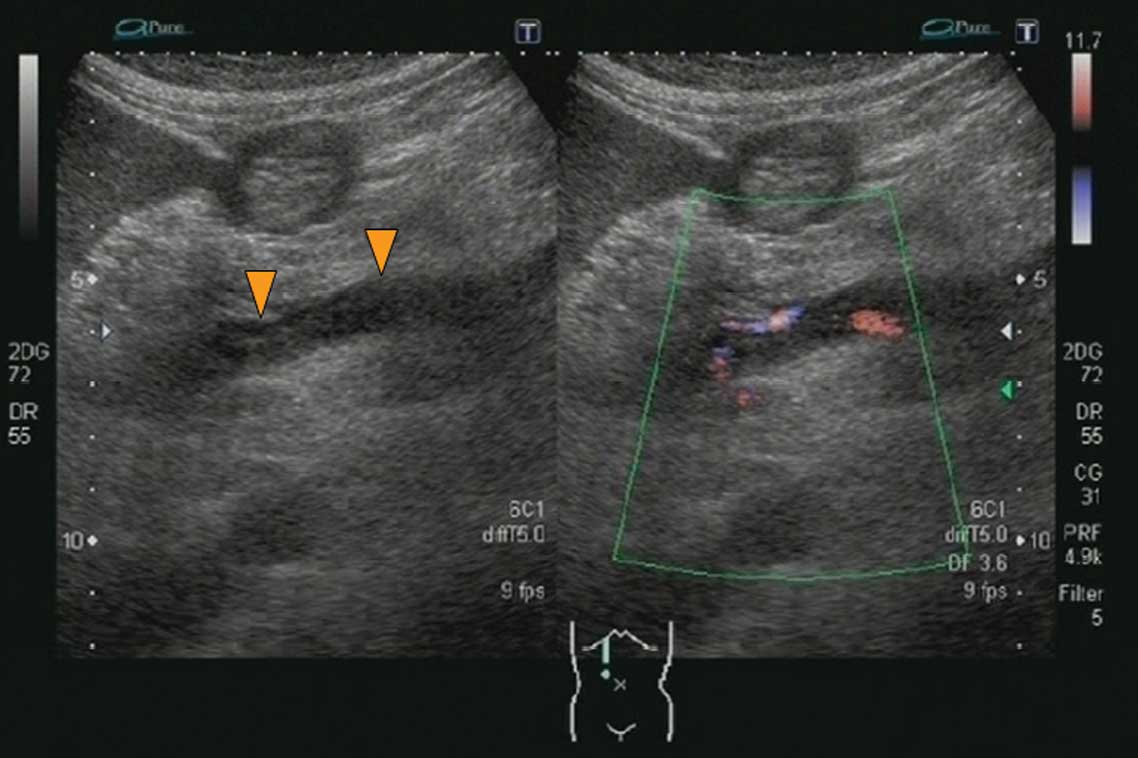
diagnosis of right portal vein thrombosis was made (Fig. 1). The left branch of the portal
vein was free of thrombi and had a normal blood flow. However, a
thrombus was present in the superior mesenteric vein (Fig. 2), suggesting that the splenic vein
and the inferior mesenteric vein were the source of the blood to
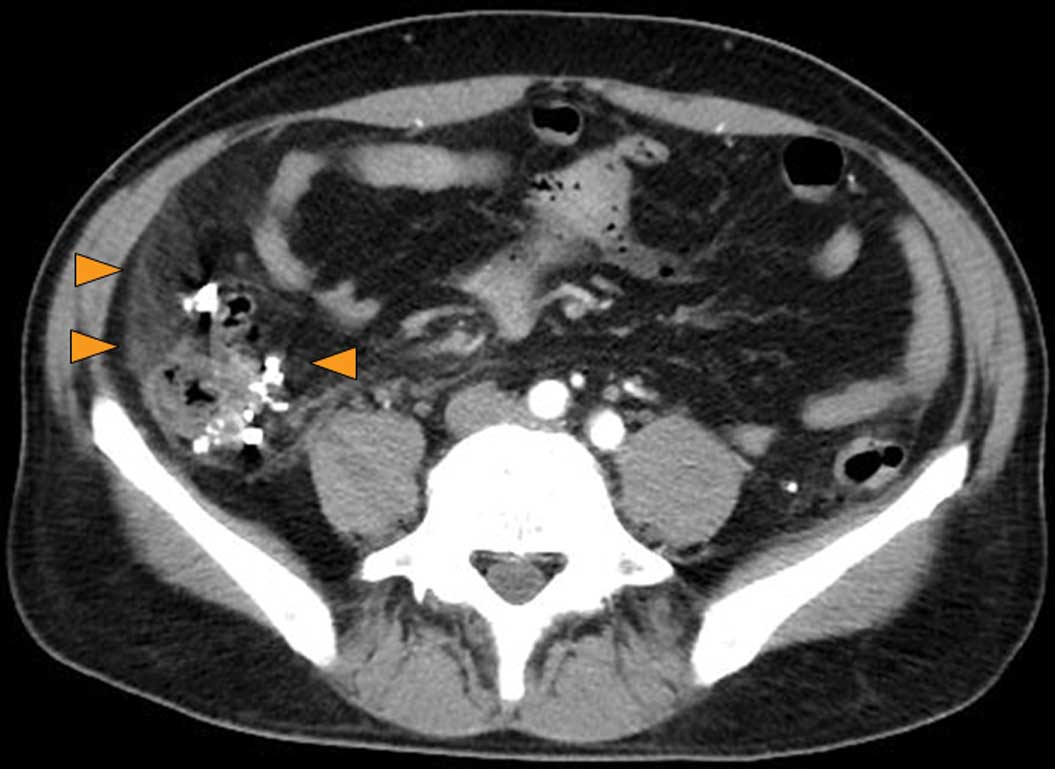
the portal vein. There was also thickening of the ascending colon
wall, numerous diverticula within and outside the colon wall and
thickening of the surrounding fat layer, all of which led to a
diagnosis of colonic diverticulitis (Fig. 3). These findings corresponded with
the patient’s tender abdominal area.
 | Table I.Hematological findings on
admission. |
Table I.
Hematological findings on
admission.
| Diagnostic blood
tests | Results |
|---|
| White blood
cells | 16,900
cells/μl |
| Red blood cells | 460×104
cells/μl |
| Hemoglobin | 14.6 g/dl |
| Platelets | 3.7/μl |
| Basophils | 0% |
| Eosinophils | 1.3% |
| Lymphocytes | 27.8% |
| Monocytes | 5.2% |
| Neutrophils | 65.6% |
| Prothrombin time | 82% |
| Activated partial
thromboplastin time | 35.2 sec |
| Total protein | 5.2 g/dl |
| Albumin | 1.9 g/dl |
| Thymol turbidity
test | 3.2 SH-U |
| Zinc turbidity
test | 9.5 K-U |
| Total bilirubin | 4.4 mg/dl |
| Direct bilirubin | 2.8 mg/dl |
| Aspartate
aminotransferase | 65 IU/l |
| Alanine
aminotransferase | 44 IU/l |
| Lactate
dehydrogenase | 219 IU/l |
| Alkaline
phosphatase | 746 IU/l |
|
γ-glutamyltranspeptidase | 176 IU/l |
| Choline esterase | 78 IU/l |
| Amylase | 31 IU/l |
| Blood urea
nitrogen | 34 mg/dl |
| Creatinine | 1.25 mg/dl |
| Na | 131 mM |
| K | 3.2 mM |
| Cl | 109 mM |
| C-reactive
protein | 21.0 mg/dl |
| Fibrin degradation
product | 18.7 mg/dl |
| D-dimer | 10.4 mg/dl |
| Hepatitis C virus
antibody | - |
| Hepatitis B surface
antigen | - |
| Carcinoembryonic
antigen | 3.9 ng/ml |
| Carbohydrate antigen
19-9 | 9.6 U/ml |
Clinical course and imaging findings
subsequent to admission
Due to the presence of Escherichia coli in
the blood culture subsequent to admission, the patient was
diagnosed with sepsis caused by ascending colon diverticulitis. He
was consequently started on 1.5 g/day of the antibiotic doripenem
and 2 g/day of gabexate mesilate on hospital day 1, followed by
12,800 U/day thrombomodulin-α and 10,000 U/day heparin Na on day 2.
Arrival time parametric imaging (At-PI) using Sonazoid-enhanced US
was performed on hospital day 1 to assess the blood flow in the
hepatic portal vein and the hepatic artery.
US imaging was performed using a Toshiba Aplio XG
ultrasonographic device (model SSA-790A; Toshiba Medical Systems
Co., Tochigi, Japan) with a 3.75-MHz convex array probe (PVT-375BT)
at a mechanical index of 0.21. Images showing the liver parenchyma
from the right intercostal space to segments 5–8 of the right
hepatic lobe as well as the right kidney were captured for
analysis. The focal depth was set at 8 cm to visualize the kidney.
Subsequent to setting the imaging parameters, the recommended dose
of Sonazoid (0.015 ml/kg; perfluorobutane; GE Healthcare, Oslo,
Norway) was injected via the cubital vein. The sonographic data
that were generated for a period of ∼40 sec following the Sonazoid
infusion were stored as raw data in the system hardware.
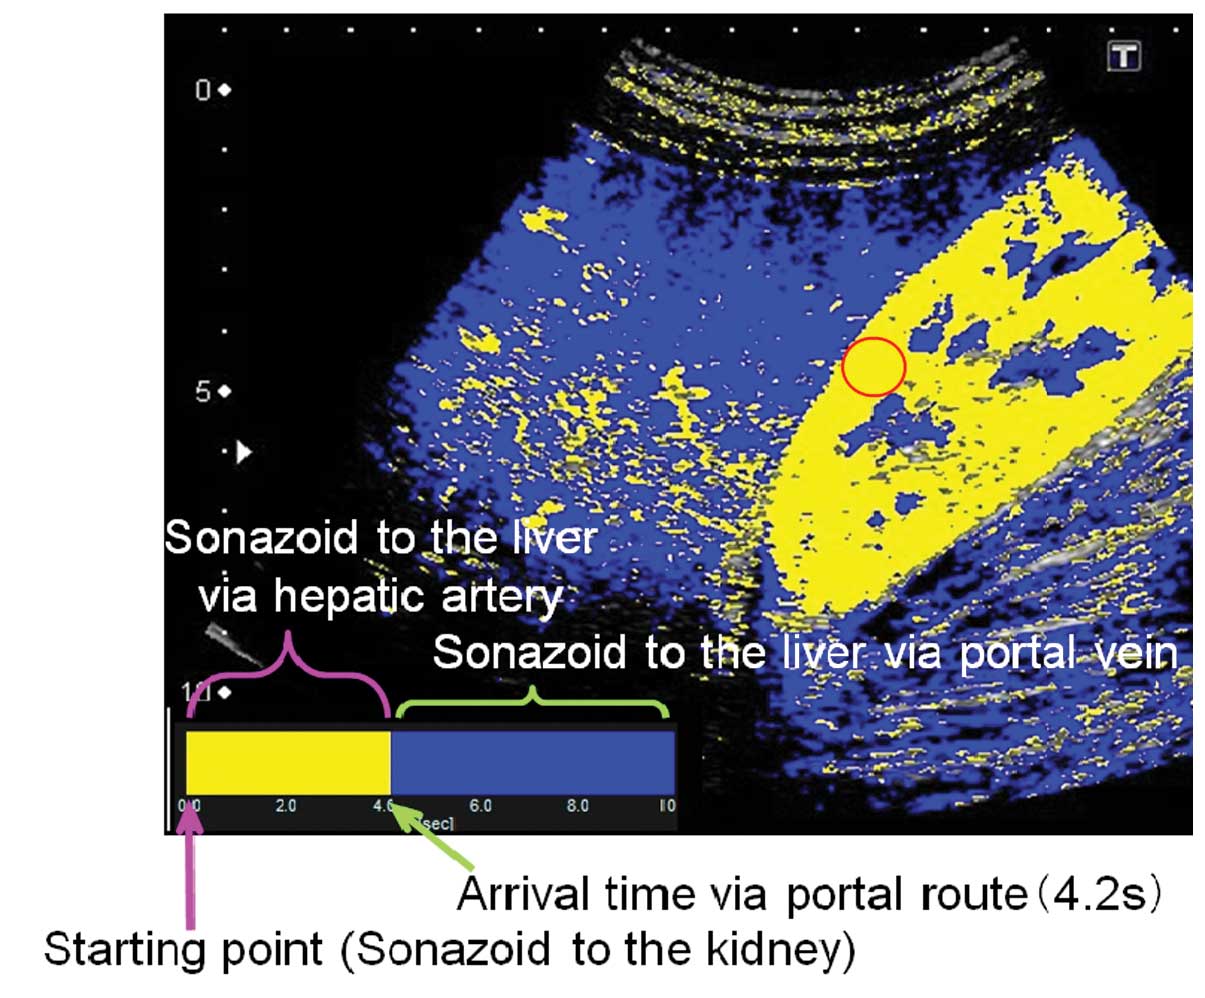
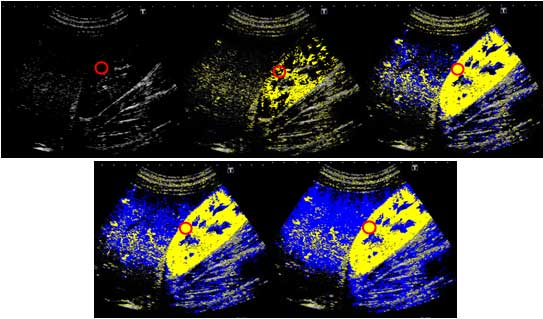
At-PI of the stored data was performed using the
software interfaced with the ultrasound system. By selecting the
region of interest (ROI) within the kidney parenchyma, the point at
which 80% of the ROI was contrasted was set as time 0 and the
arrival time of individual pixels representing hepatic parenchymal
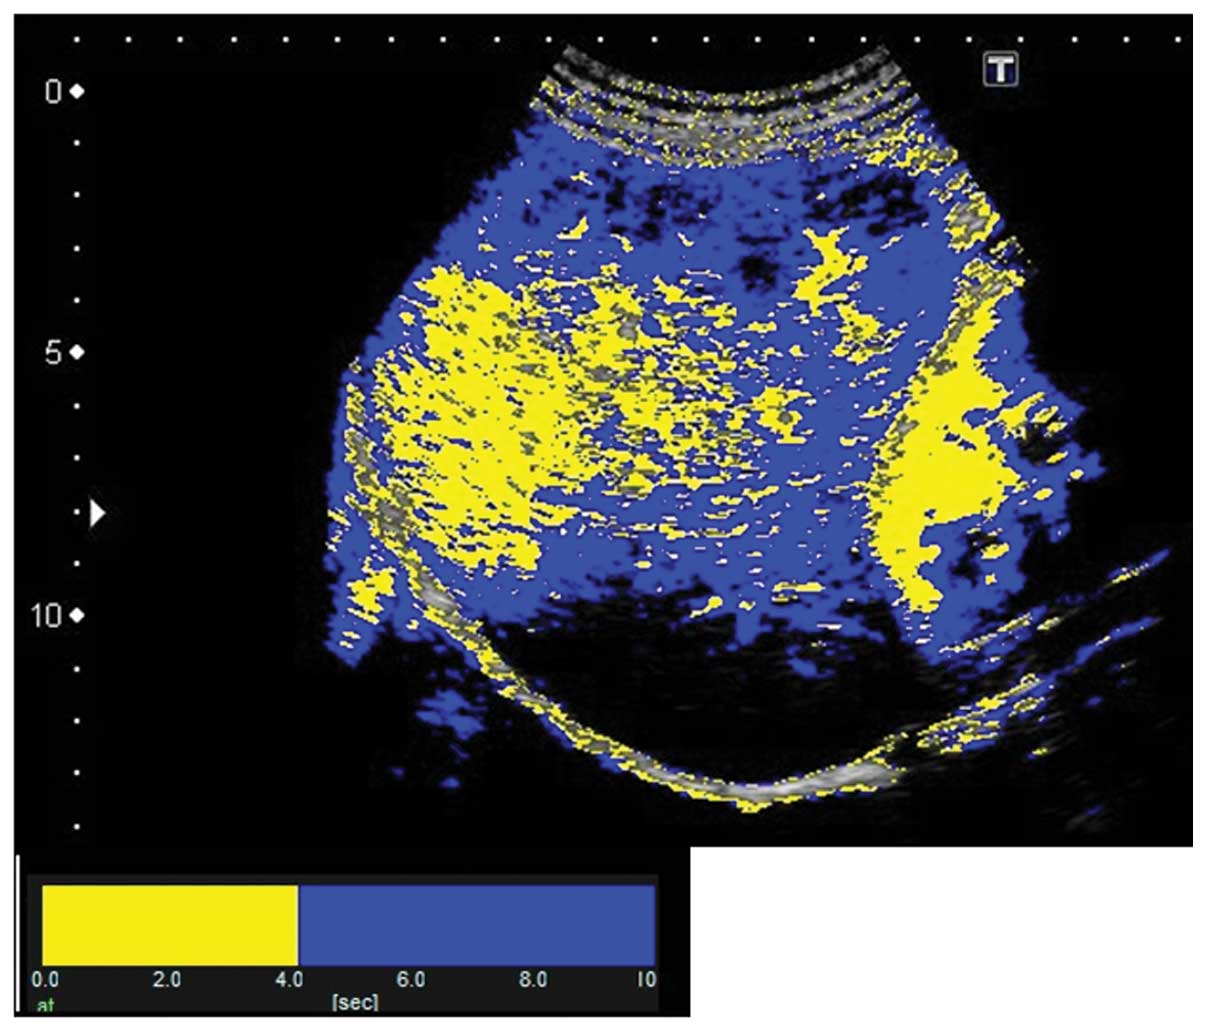
enhancement were sequentially calculated. A color map was created
and automatically superimposed on a B-mode image. In the present
study, two colors were selected to differentiate the portal venous
perfusion from the hepatic arterial perfusion. With time 0 starting
at 80% of the renal enhancement, the pixels arriving prior to the
visualization of the portal vein were displayed in yellow and those
arriving subsequent to the visualization were displayed in blue.
The 4.2 sec taken to visualize the left branch of the hepatic
portal vein were used to discriminate the route of hepatic
perfusion and thus color maps generated in the present study showed
the period of hepatic arterial perfusion in yellow and that of
portal venous perfusion in blue (Figs.
4 and 5).
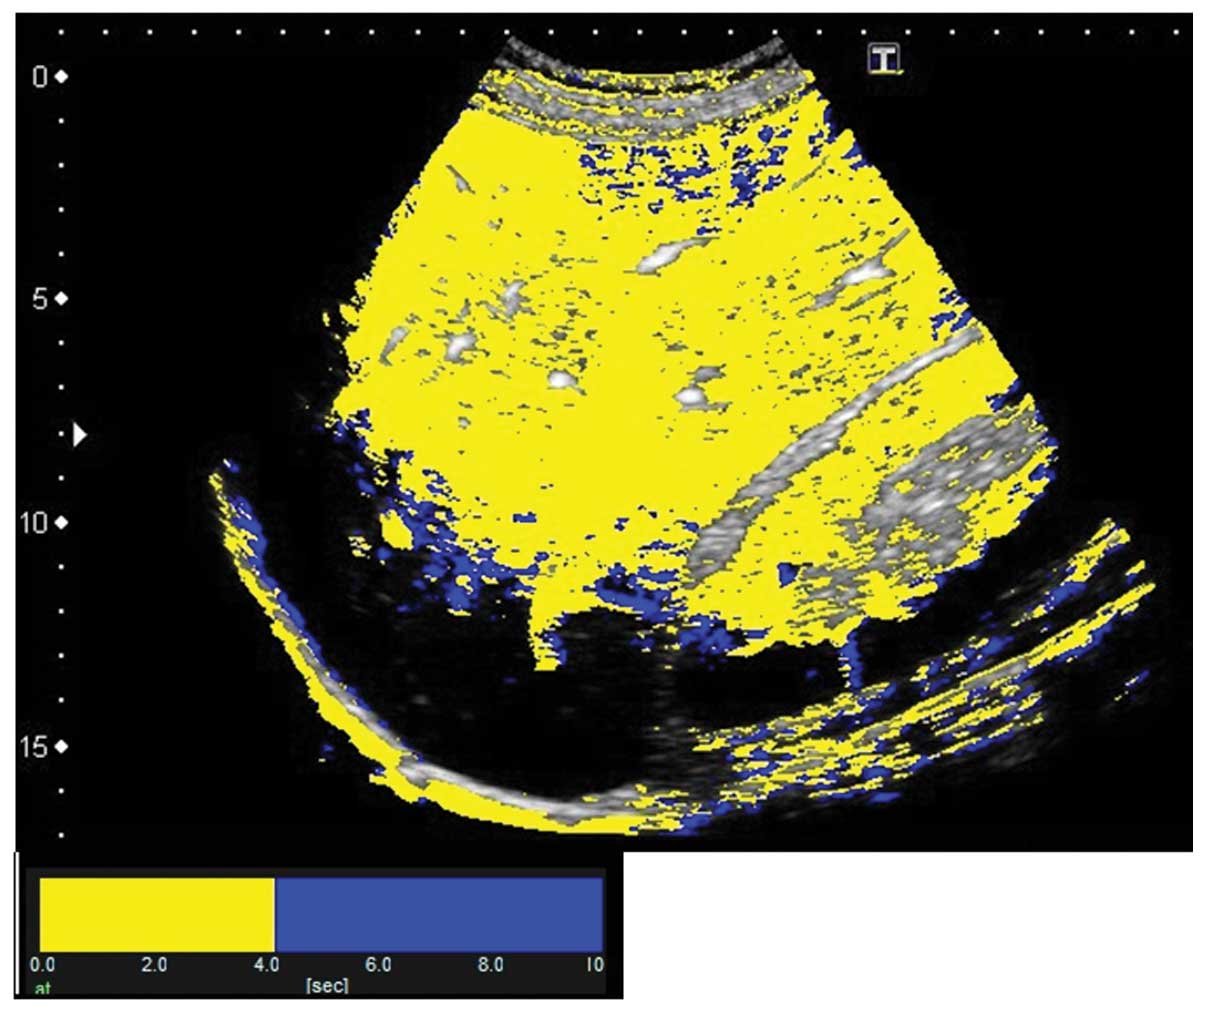
The results of At-PI on admission showed that the
entire right lobe of the liver was highlighted in yellow due to the
portal vein obstruction by the thrombus, revealing that the liver
parenchyma was perfused by the hepatic artery (Fig. 6). The abatement of the patient’s
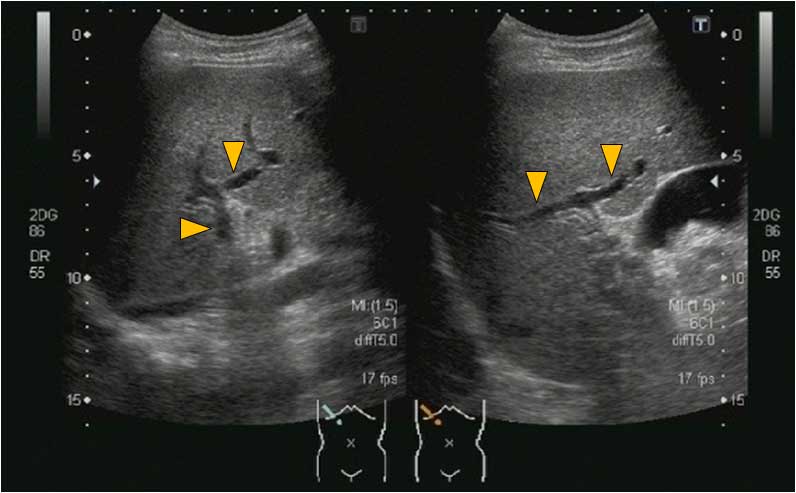
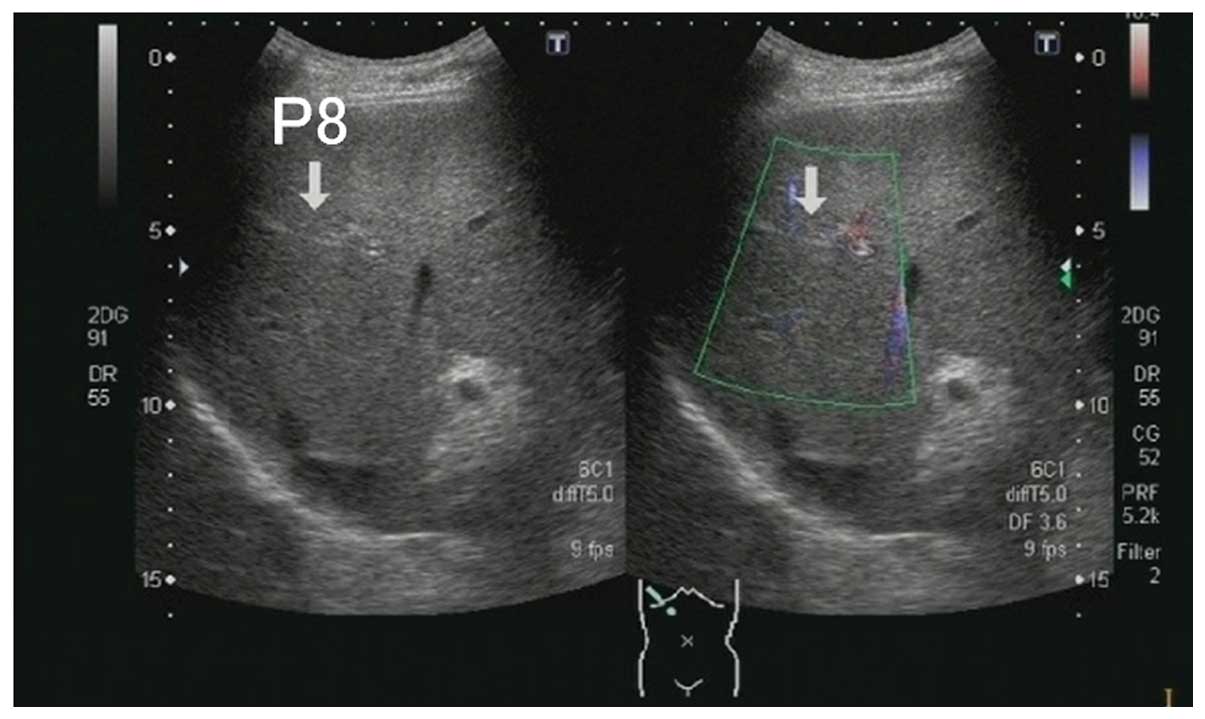
fever and an improvement in sepsis began on hospital day 8 and the
blood culture was then negative on day 9. With the exception of one
thrombus in the P8 branch of the portal vein, virtually complete
dissolution of the thrombi in the right main branch of the portal
vein and in the superior mesenteric vein was observed by abdominal
B-mode US on day 22 (Figs. 7 and
8). At-PI performed on this day
displayed a yellow color over segment 8 of the liver parenchyma
indicative of early contrast arrival times, while the other areas
of the liver parenchyma were displayed in blue, suggesting late
arrival times (Fig. 9). In
essence, segment 8 continued to receive hepatic arterial perfusion
due to the undissolved thrombus although portal venous perfusion
had been restored in the rest of the parenchyma. An oral
administration of 2 mg warfarin was started upon discharge. The
hepatic parenchyma in segment 8 remained yellow in At-PI images at
6 months after discharge, as was observed on hospital day 22.
Discussion
At-PI is an ultrasound imaging analysis tool that
was introduced into the Toshiba Aplio XG ultrasound system (Toshiba
Medical Systems Co.) in October 2010 and which traces and color
codes temporal changes in contrast-enhanced US images. Using At-PI,
we have previously investigated the effect of the hepatic portal
vein and the hepatic artery on hepatic parenchymal enhancement and
also reported its use in the clinical assessment of type C chronic
liver disease (5) and alcoholic
liver disease (6). In the present
study, At-PI was performed to elucidate the effect of a portal
thrombus on hepatic parenchymal enhancement and to demonstrate the
changes in the contrast subsequent to the treatment.
In the present study, the best use of At-PI
technology in the evaluation of hepatic parenchymal perfusion was
considered to be in the comparison of the arrival times of the
Sonazoid to the liver and kidney. While the liver receives its
blood supply from the hepatic artery and the portal vein, the
kidney is supplied exclusively by the arteries. A comparison of the
contrast starting times between the liver and kidney parenchyma
provides an insight into the balance of the hepatic blood flow. A
shortened time difference between the hepatic and renal enhancement
may indicate a change in the hepatic blood flow from portal vein
dominance to hepatic artery dominance, enabling an objective
evaluation of the hepatic hemodynamic balance between the portal
vein and hepatic artery.
In line with the objectives and considerations
mentioned above, the present study revealed that, due to a blocked
right portal vein branch at admission, the right hepatic lobe was
perfused by the hepatic artery, as indicated by a yellow color
representing the early contrast enhancement. Subsequent to starting
the anticoagulant therapy, another At-PI performed on hospital day
22 revealed that the liver parenchyma, with the exception of
segment 8, was in blue, indicating that the portal vein had resumed
its role of being the major blood supply to the liver.
The blood flow in the liver, particularly the
intrahepatic microcirculation, requires consideration when studying
the changes in hepatic parenchymal perfusion. Sonazoid injected via
the cubital vein reaches the liver via the arterial blood flow. In
healthy individuals, the hepatic artery is considered to be the
blood vessel that feeds the biliary system. Arterial blood flow
nourishes the large and small bile ducts while traveling through
the liver toward the periphery. A peribiliary capillary plexus is
formed around the bile ducts and a number of the capillaries merge
into the terminal portal venules or sinusoids. There is, however, a
population of branches that directly merge into the sinusoids
without passing through the peribiliary capillary plexus or
nourishing the portal vein by extending to the wall (7–9).
The ratio of blood inflow via the hepatic portal
vein and the hepatic artery is 7–8:2–3 and therefore the portal
vein is the main blood supply to the liver in healthy individuals
(1). This is presumably due to the
blood flowing through the portal vein containing nutrients from the
stomach and intestine, making the portal vein the nutrient vessel
for the liver. A previous study, which examined the pressure
difference between the two vascular systems by micropuncturing the
hepatic microvasculature under a biomicroscope, reported that blood
pressure at the distal end branches of the hepatic artery was 6–8
times higher than that at the portal vein branches (300–400 vs. 50
mm H2O, respectively) (10). The precapillary sphincter plays a
significant role in enabling the portal vein to carry a large
amount of blood into the sinusoids despite its low blood pressure.
The distal end branches of the hepatic artery and the peribiliary
capillary plexus around the bile ducts exist in the form of
capillaries. Each capillary is encircled by a precapillary
sphincter which adjusts the blood flow from the arterioles into the
capillary (11). By controlling
the amount of blood entering from the high-pressure arterial
system, the precapillary sphincter makes it easier for the
low-pressure portal vein system to pump blood into the
sinusoids.
The present study revealed that when the portal vein
blood flow is obstructed by a thrombus, the hepatic artery takes
over parenchymal perfusion of the affected liver segments. It is
likely that obstruction of the portal vein blood flow triggers a
chain of signal transduction that allows the precapillary sphincter
to increase the arterial blood flow to compensate for the reduced
blood flow to the liver. When thrombus dissolution improved portal
vein blood flow to the liver parenchyma in our patient, hepatic
perfusion restored portal vein dominance, presumably through a
readjustment of the arterial blood flow by the precapillary
sphincter.
In conclusion, the present study of acute portal
vein thrombosis demonstrates how a portal thrombus affects hepatic
parenchymal enhancement and how anticoagulant treatment changes the
pattern of contrast enhancement. At-PI also enabled the easy
visualization of the contrast changes and provided a deeper
understanding of the pathology. Even 6 months subsequent to
discharge, the hepatic parenchymal perfusion in segment 8 continued
to show a yellow color reflecting the arterial blood supply. If
hepatic parenchymal perfusion remains arterialized subsequent to
the treatment of the portal vein thrombosis, as in our patient,
then it may be necessary to administer a more powerful
anticoagulant, such as urokinase, and to start thrombolytic therapy
as an additional intervention. Further study is warranted to
investigate the utility of At-PI in the treatment of
arterialization and to accumulate a higher number of cases.
Abbreviations:
|
At-PI
|
arrival time parametric imaging;
|
|
US
|
ultrasonography;
|
|
CRP
|
C-reactive protein;
|
|
CT
|
computed tomography;
|
|
ROI
|
region of interest
|
References
|
1.
|
Kleber G, Steudel N, Behrmann C, et al:
Hepatic arterial flow volume and reserve in patients with
cirrhosis: use of intra-arterial Doppler and adenosine infusion.
Gastroenterology. 116:906–914. 1999.PubMed/NCBI
|
|
2.
|
Rocheleau B, Ethier C, Houle R, Huet PM
and Bilodeau M: Hepatic artery buffer response following left
portal vein ligation: its role in liver tissue homeostasis. Am J
Physiol. 277:G1000–G1007. 1999.PubMed/NCBI
|
|
3.
|
Leen E, Goldberg JA, Anderson JR, et al:
Hepatic perfusion changes in patients with liver metastases:
comparison with those patients with cirrhosis. Gut. 34:554–557.
1993. View Article : Google Scholar : PubMed/NCBI
|
|
4.
|
Lautt WW: Mechanism and role of intrinsic
regulation of hepatic arterial blood flow: hepatic arterial buffer
response. Am J Physiol. 249:G549–G556. 1985.PubMed/NCBI
|
|
5.
|
Wakui N, Takayama R, Kanekawa T, et al:
Usefulness of arrival time parametric imaging in evaluating the
degree of liver disease progression in chronic hepatitis C
infection. J Ultrasound Med. 31:373–382. 2012.PubMed/NCBI
|
|
6.
|
Wakui N, Takayama R, Mimura T, et al:
Drinking status of heavy drinkers detected by arrival time
parametric imaging using sonazoid-enhanced ultrasonography: study
of two cases. Case Rep Gastroenterol. 5:100–109. 2011. View Article : Google Scholar : PubMed/NCBI
|
|
7.
|
Rappaport AM, Black RG, Locas CC, Ridout
JH and Best CH: Normal and pathologic microcirculation of the
living mammalian liver. Rev Int Hepatol. 16:813–828.
1966.PubMed/NCBI
|
|
8.
|
Rappaport AM: Hepatic blood flow:
morphologic aspects and physiologic regulation. Int Rev Physiol.
21:1–63. 1980.PubMed/NCBI
|
|
9.
|
Ekataksin W and Kaneda K: Liver
microvascular architecture: an insight into the pathophysiology of
portal hypertension. Semin Liver Dis. 19:359–382. 1999. View Article : Google Scholar : PubMed/NCBI
|
|
10.
|
Nakata K, Leong GF and Brauer RW: Direct
measurement of blood pressures in minute vessels of the liver. Am J
Physiol. 199:1181–1188. 1960.PubMed/NCBI
|
|
11.
|
Rhodin JA: The ultrastructure of mammalian
arterioles and precapillary sphincters. J Ultrastruct Res.
18:181–223. 1967. View Article : Google Scholar : PubMed/NCBI
|