Introduction
Adenosine diphosphate (ADP)-ribosylation reaction
refers to the process during which mono- or poly-ADP is transferred
onto amino acid residues. The process is catalyzed by
ADP-ribosyltransferases (ARTS) to break the glycosidic bond between
nicotinamide of nicotinamide adenine dinucleotide (NAD+)
and adjacent ribose (1,2).
The mono-ADP-ARTS (mARTS) include 5 members, the
only one of which, existing in human cells with a fixed sequence
R-S-EXE of arginine-specific ARTS, is arginine-specific
mono-ADP-ribosyltransferase-1 (ART1) (16), which can directly modify integrin
α7β1. As a transmembrane protein, integrin α7β1 is highly involved
in the adhesion, invasion and metastasis of cancer cells. The
modified integrin α7β1 is functionally upregulated, with its
affinity to laminin (LN) improved (3–5).
Meta-iodobenzylguanidine (MIBG) is a type of
analogue of guanidine neurotransmitter, norepinephrine, which can
inhibit the function of ARTS through competitive binding of the
catalytic site. As a result, MIBG can function as an ART1-specific
inhibitor (6). It has been
previously reported that MIBG inhibits the proliferation and
metastasis of smooth muscle cells (7).
In a previous study by our group, it was
demonstrated that the gene silencing of ART1 in colorectal
carcinoma inhibited the expression of ART1, downregulated the
expression of matrix metalloproteinase (MMP)-2 and MMP-9, inhibited
their activity and eventually affected the adhesion and invasion
capacity of CT26 colorectal carcinoma cells (8). Currently, however, the effects of
ART and integrin α7β1 on the invasion and metastasis of
hepatocellular carcinoma (HCC) (HepG2) cells remains unknown.
Consequently, this study aimed to investigate the effects of ART
and integrin α7β1 on the invasion and metastasis of HCC cells, as
well as to determine the effects of ART1 on the expression of
integrin α7β1, focal adhesion kinase (FAK), phosphatidylinositol
3-kinase (PI3K) and urokinase-type plasminogen activator (uPA) in
HepG2 cells, after inhibiting the expression of ART1 by utilizing
MIBG. The present study provides preliminarily relevant
experimental foundation for a novel method for HCC
moleculer-targeted therapy.
Materials and methods
Immunohistochemical (IHC) analysis
HCC tissue sections (n=39) were obtained from the
Department of Pathology of the First Affiliated Hospital of
Chongqing Medical University, Chongqing, China. Of these, 29 were
from male patients and 10 were from female patients with the liver
histological grade (Edmondson grade) distributed as follows: I–II
(12 cases), III–IV (27 cases), HCC with metastasis (lymph node,
blood vessel or other organs) (17 cases) and HCC without metastasis
(22 patients). IHC was used to detect the expression of ART1
(Sigma, St. Louis, MO, USA) and integrin α7 (Beijing, Biosynthesis
Biotechnology Co., Ltd., Beijing, China) in the HCC tissues
according to the instructions provided with the kit. Sets of
positively stained cells were divided into groups based on the
antigen signal: pale yellow, weakly positive (+) 1 point; yellow,
moderately positive (++) 2 points; brownish yellow, strongly
positive (+++) 3 points. The slides were divided into groups based
on the number of positive cells: weakly positive (+, refers to the
number of positive cells up to 25%); moderately positive (++,
refers to the number of positive cells between 25–49%); strongly
positive (+++, >50% of cells were positive). Using integrated
measurement, the following calculation formula was developed and
used: (+)% × 1 + (++)% × 2 + (+++)% × 3, the total value of <1.0
by (+), 1.0 to 1.5 by (++), >1.5 by (+++). Random observations
were made for at least 5–10 high-power fields (HPFs).
RT-PCR detection of ART1 and integrin α7
mRNA expression
Fresh HCC samples (3 cases of HCC with metastasis; 3
cases of HCC without metastasis) were obtained from the Department
of Hepatobiliary Surgery of the First Affiliated Hospital of
Chongqing Medical University. The samples were stored in liquid
nitrogen. Total RNA was extracted from the tissue samples using a
One-Step RT-PCR kit (Takara, Shiga, Japan) according to the
manufacturer’s instructions. The primers for ART1 (XM_005252934)
and integrin α7 (NM_001144996) were synthesized by Shanghai Sangon
Biological Engineering Technology & Services, Co., Ltd.,
Shanghai, China. The primer sequences were as follows: ART1
forward, 5′-CTCCATTTCC TGCTGACTGAG-3′ and reverse, 5′-AGGTCCAGATGCC
GAAGAAG-3′; integrin α7 forward, 5′-GAACTCCTCCC ACCCAACTT-3′ and
reverse, 5′-GACGAAACCACGAAA CCACT-3′; β-actin forward,
5′-GTCAAGAAAGGGTGTAA CGCAAC-3′ and reverse, 5′-TCCTGTGGCATCCACGA
AACT-3′. The PCR reaction conditions for ART1 and integrin α7 were
as follows: 30 cycles of 94°C for 3 min, 94°C for 30 sec and 60°C
for 30 sec. The PCR reaction conditions for β-actin were as
follows: 30 cycles of 94°C for 3 min, 94°C for 30 sec, 56°C for 60
sec and 72°C for 60 sec. After completion of the reaction, 20 μl
PCR reaction solution was used for electrophoresis on an agarose
gel. Band intensities were measured using Quantity One software
(Bio-Rad, Hercules, CA, USA), and gene amplification was defined as
the ratio of the optical density (OD) of the target gene to that of
the housekeeping gene, β-actin. The experiment was performed 3
times.
Cell culture
HepG2 cells were provided by the Life Science
Institute of Chongqing Medical University. The cells were grown in
RPMI-1640 supplemented with 10% fetal calf serum plus ampicillin
(100 μ/ml) and streptomycin (100 μg/ml), at 37°C and 5%
CO2. MIBG (Sigma) was used to inhibit the ART1 signaling
pathway.
Immunofluorescence (IF) detection of ART1
expression
The HepG2 cells (1×10⁶ cells/well) were
seeded into 6-well plates containing glass coverslips. When cell
attachment to the glass was approximately 90% complete, the slides
were removed and washed 3 times with PBS. These cells were fixed
with 10% formaldehyde for 30 min, washed 3 times with PBS for 2 min
each, and treated with 0.5% Triton for a further 15 min. They were
then washed twice with PBS for 5 min each. The cells were then
covered with 1% BSA for 30 min and incubated with 1:100 anti-ART1
antibody overnight at 4°C. Cells exposed to PBS instead of the
primary antibody served as the negative controls. The following
day, the slides were washed 3 times with PBS for 5 min each.
Subsequently, 1:500 rabbit anti-goat IgG/FITC-labeled antibody was
added at 37°C in the dark for hybridization followed by incubation
for 1 h. The slides were then washed 3 times with PBS. Finally, the
glass coverslips were mounted using fluorescence quenching liquid.
Images were captured using a fluorescence microscope (Olympus,
Tokyo, Japan) and analyzed using IPP Image software (Media
Cybernetics, Inc., Rockville, MD, USA).
Cell proliferation, migration and
invasion assays
Cell proliferation inhibition
assay
Cell proliferation was determined by MTT assay.
Briefly, the HepG2 cells, at 103 cells/well, were
dispensed in 100 μl aliquots into 96-well plates. Subsequently, 24
h after inoculation, the cell culture medium was replaced with
final concentrations of 50, 100, 150, 200, 250 and 300 μmol/l MIBG
for 24 h. An equal volume of DMSO was used as a negative control.
After 24 h, 20 μl MTT were added to each well followed by culture
for a further 4 h. The supernatant was then carefully aspirated.
Subsequently, 150 μl of DMSO were added to each well, and the plate
was shaken until the purple crystals were completely dissolved.
OD490 nm (A) was measured using a 680 microplate reader (Bio-Rad).
The rate of inhibition of cell growth (IR) was calculated as
follows: cell growth inhibition rate (%) = (1−A treatment/A
control) ×100%. The half maximal inhibition concentration
(IC50) of IMBG in the HepG2 cells was determined using
IC50 calculation software (SPSS, Inc., Chicago, IL,
USA).
Cell migration assay
Cell migration was evaluated using a scratch wound
assay. Briefly, 5×10⁵ HepG2 cells/well were plated in
6-well plates and cultured overnight to yield a confluent
monolayer. A 10-μl pipette tip was used to scratch the bottom of
the culture plates. The remaining cells were washed twice, then
cultured with fresh medium supplemented with MIBG 200 μmol/l, and
fresh medium was used as a control medium. Images were captured at
0 and 24 h using an NIS-Elements Image Analysis System (Nikon
Corp., Tokyo, Japan). Distance was marked at fixed intervals. Three
mean values were calculated, including the width of the scratch
test, according to the following formula to determine the rate at
which the scratches healed. Healing rate = (initial scratch width
value − corresponding points scratch width)/initial value ×100%
scratch width.
Cell invasion assay
Cell invasion was evaluated using a Transwell
Matrigel invasion assay. First, 105 HepG2 cells/well
suspended with RPMI-1640 were seeded in the upper chamber
(Millipore Corp., Billerica, MA, USA). These were coated with
Matrigel (BD Biosciences, Bedford, MA, USA) and incubated with
HepG2 conditioned supernatant (MIBG 200 μmol/l in serum-free
RPMI-1640, and RPMI-1640 without serum served as a control).
RPMI-1640 supplemented with 10% FBS was in the lower chamber. After
24 h, the invading cells on the bottom surface were fixed with 4%
paraformaldehyde and quantified after staining with crystal violet.
The invasion inhibition rate was caclulated as follows: invasion
inhibition rate = (average untreated control group − average
treated group)/average value for the dosing control group
×100%.
Western blot analysis
Protein concentrations were evaluated using BCA
protein assay reagent (Beyotime, Shanghai, China). HepG2 cells from
different groups (control group, MIBG 150 μmol/l-treated group and
MIBG 200 μmol/l-treated group) were lysed with RIPA buffer, and 25
μg of total protein were separated by standard 6–10% SDS-PAGE and
transferred onto PVDF membranes. The membranes were washed and
blocked with 5% skim milk at room temperature for 1 h before being
incubated with primary antibodies to ART1 (Sigma), integrin α7
(Beijing Biosynthesis Biotechnology Co., Ltd., Beijing, China),
FAK, PI3K and uPA (Wuhan Mitaka Biotechnology, Wuhan, China) at 4°C
overnight. The primary antibodies were diluted as follows: ART1,
1:500; integrin α7, 1:500; FAK, 1:500; PI3K, 1:500; uPA, 1:200; and
β-actin, 1:1,000. An HRP-conjugated secondary anti-rabbit antibody
(1:1,000) was then added for 2 h at room temperature. The reactions
were detected by enhanced chemiluminescence assay (Beyotime
Institute of Biotechnology). The relative intensity of each band
was determined using Quantity One software (Bio-Rad). Each
experiment was performed 3 times.
Statistical analysis
SPSS 18.0 statistical software was used for
statistical analysis. The quantitative data are presented as the
means ± standard deviation (SD). Comparisons of continuous data
were performed using one-way ANOVA. The rank-sum and least
significant difference (LSD) test were used to analyze the ranked
data and the differences between each group. The relationship
between 2 groups was analyzed by correlation analysis. A value of
P<0.05 was considered to indicate a statistically significant
difference.
Results
Expression of ART1 and integrin α7 in HCC
tissues
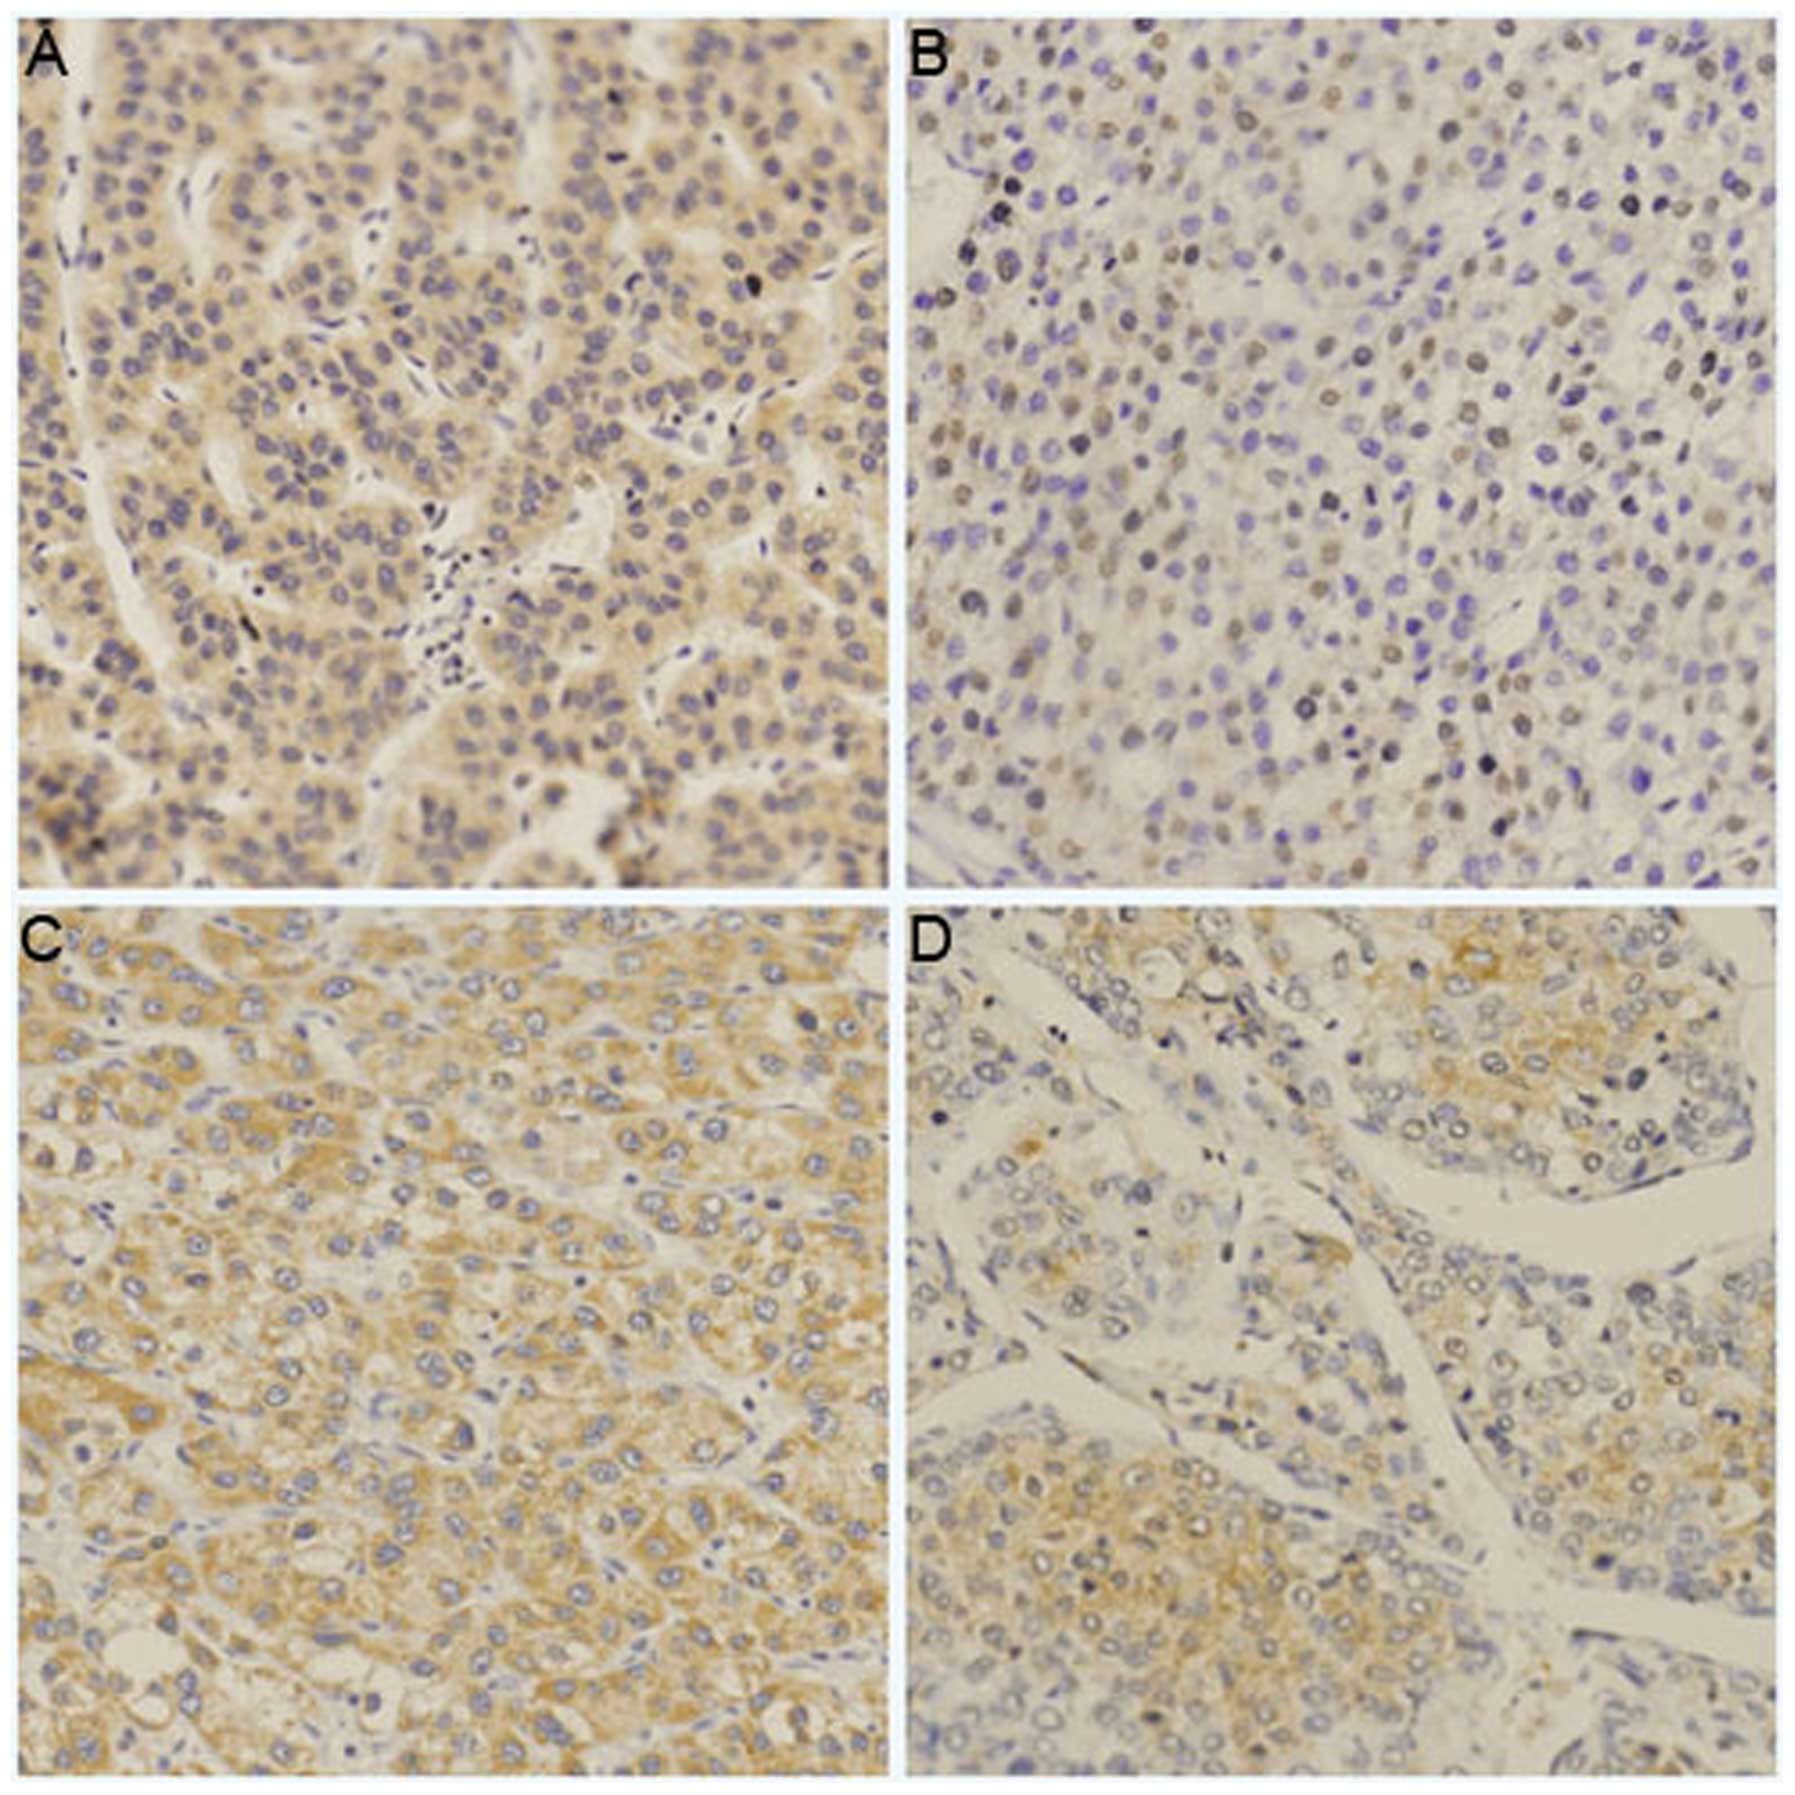
IHC revealed the positive expression of ART1 and
integrin α7 in the HCC tissues. Its expression was mostly observed
on the cell surface and in the cytoplasm. The expression levels of
ART1 and integrin α7 in the HCC samples with metastasis and a liver
histological grade (Edmondson grade) of III–IV were significantly
higher than those in the HCC samples without metastasis and a liver
histological grade (Edmondson grade) of I–II (P<0.05; Table I, Fig. 1).
 | Table IAssociation between the pathological
features of HCC and the expression of ART1 and integrin α7 in HCC
tissues. |
Table I
Association between the pathological
features of HCC and the expression of ART1 and integrin α7 in HCC
tissues.
| A, Association
between pathological features of HCC and the expression of ART1 in
HCC tissues |
|---|
|
|---|
| | Semi-quantitative
grading | | |
|---|
| |
| | |
|---|
| Pathological
features | n | − | + | ++ | +++ | U value | P-value |
|---|
| Pathological
grade |
| III–IV | 27 | 0 | 9 | 11 | 6 | 2.8109 | <0.05 |
| I–II | 12 | 4 | 6 | 2 | 1 | | |
| Tumor metastasis |
| Yes | 17 | 0 | 4 | 6 | 7 | 3.4485 | <0.01 |
| No | 22 | 4 | 11 | 7 | 0 | | |
|
| B, Association
between pathological features of HCC and the expression of integrin
α7 in HCC tissues |
|
| | Semi-quantitative
grading | | |
| |
| | |
| Pathological
features | n | − | + | ++ | +++ | U value | P-value |
|
| Pathological
grade |
| III–IV | 27 | 1 | 6 | 9 | 11 | 2.4627 | <0.05 |
| I–II | 12 | 1 | 7 | 3 | 1 | | |
| Tumor
metastasis |
| Yes | 17 | 0 | 3 | 5 | 9 | 3.4485 | <0.01 |
| No | 22 | 2 | 10 | 7 | 3 | | |
Correlation between ART1 and integrin α7
expression
ART1 expression was significantly lower in the HCC
tissues that were weakly positive for integrin α7 than in the HCC
tissues that were strongly positive for integrin α7. The expression
of ART1 positively correlated with the expression of integrin α7 in
the HCC tissues (ρ=0.87629; P<0.01) (data not shown).
mRNA expression of ART1 and integrin α7
in HCC tissues
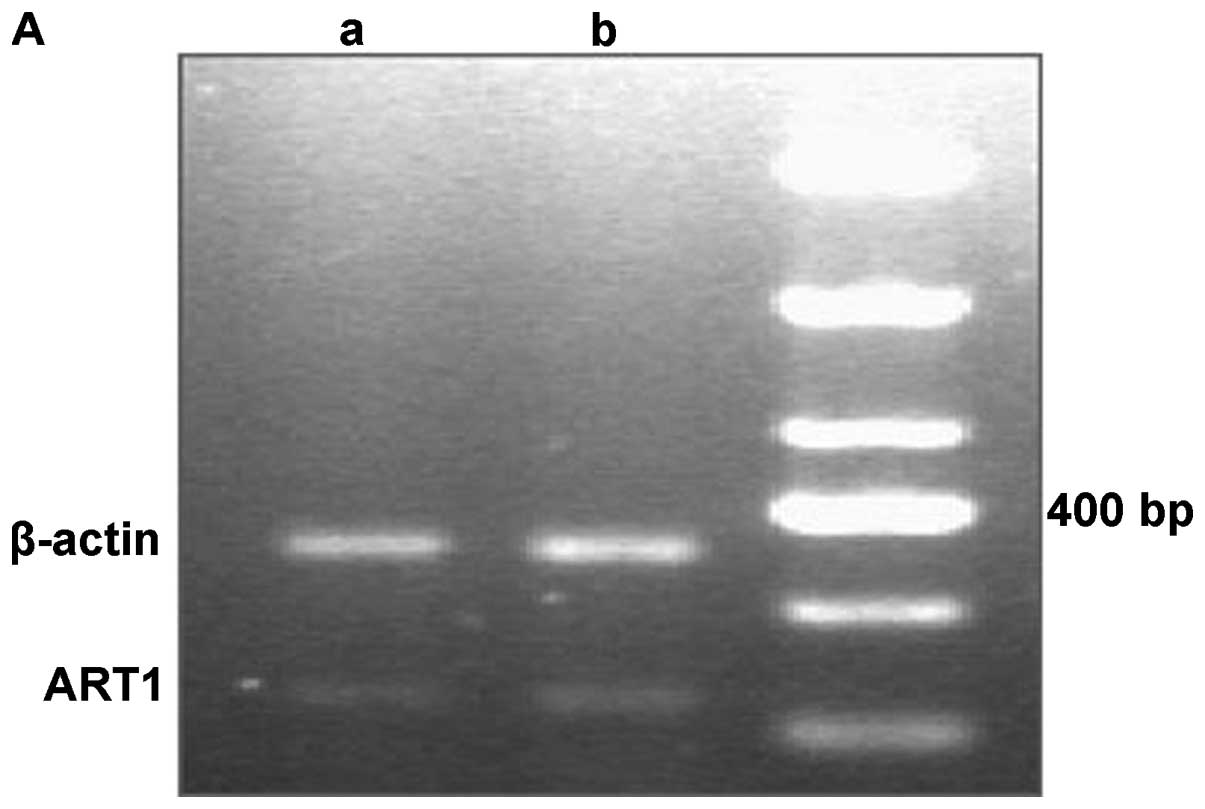
The RT-PCR results revealed that the mRNA expression
levels of ART1 and integrin α7 were significantly higher in the HCC
samples with metastasis than in the HCC samples without metastasis
(P<0.05; Fig. 2).
Immunofluorescence detection of the
expression of ART1 on the surface of HepG2 cells
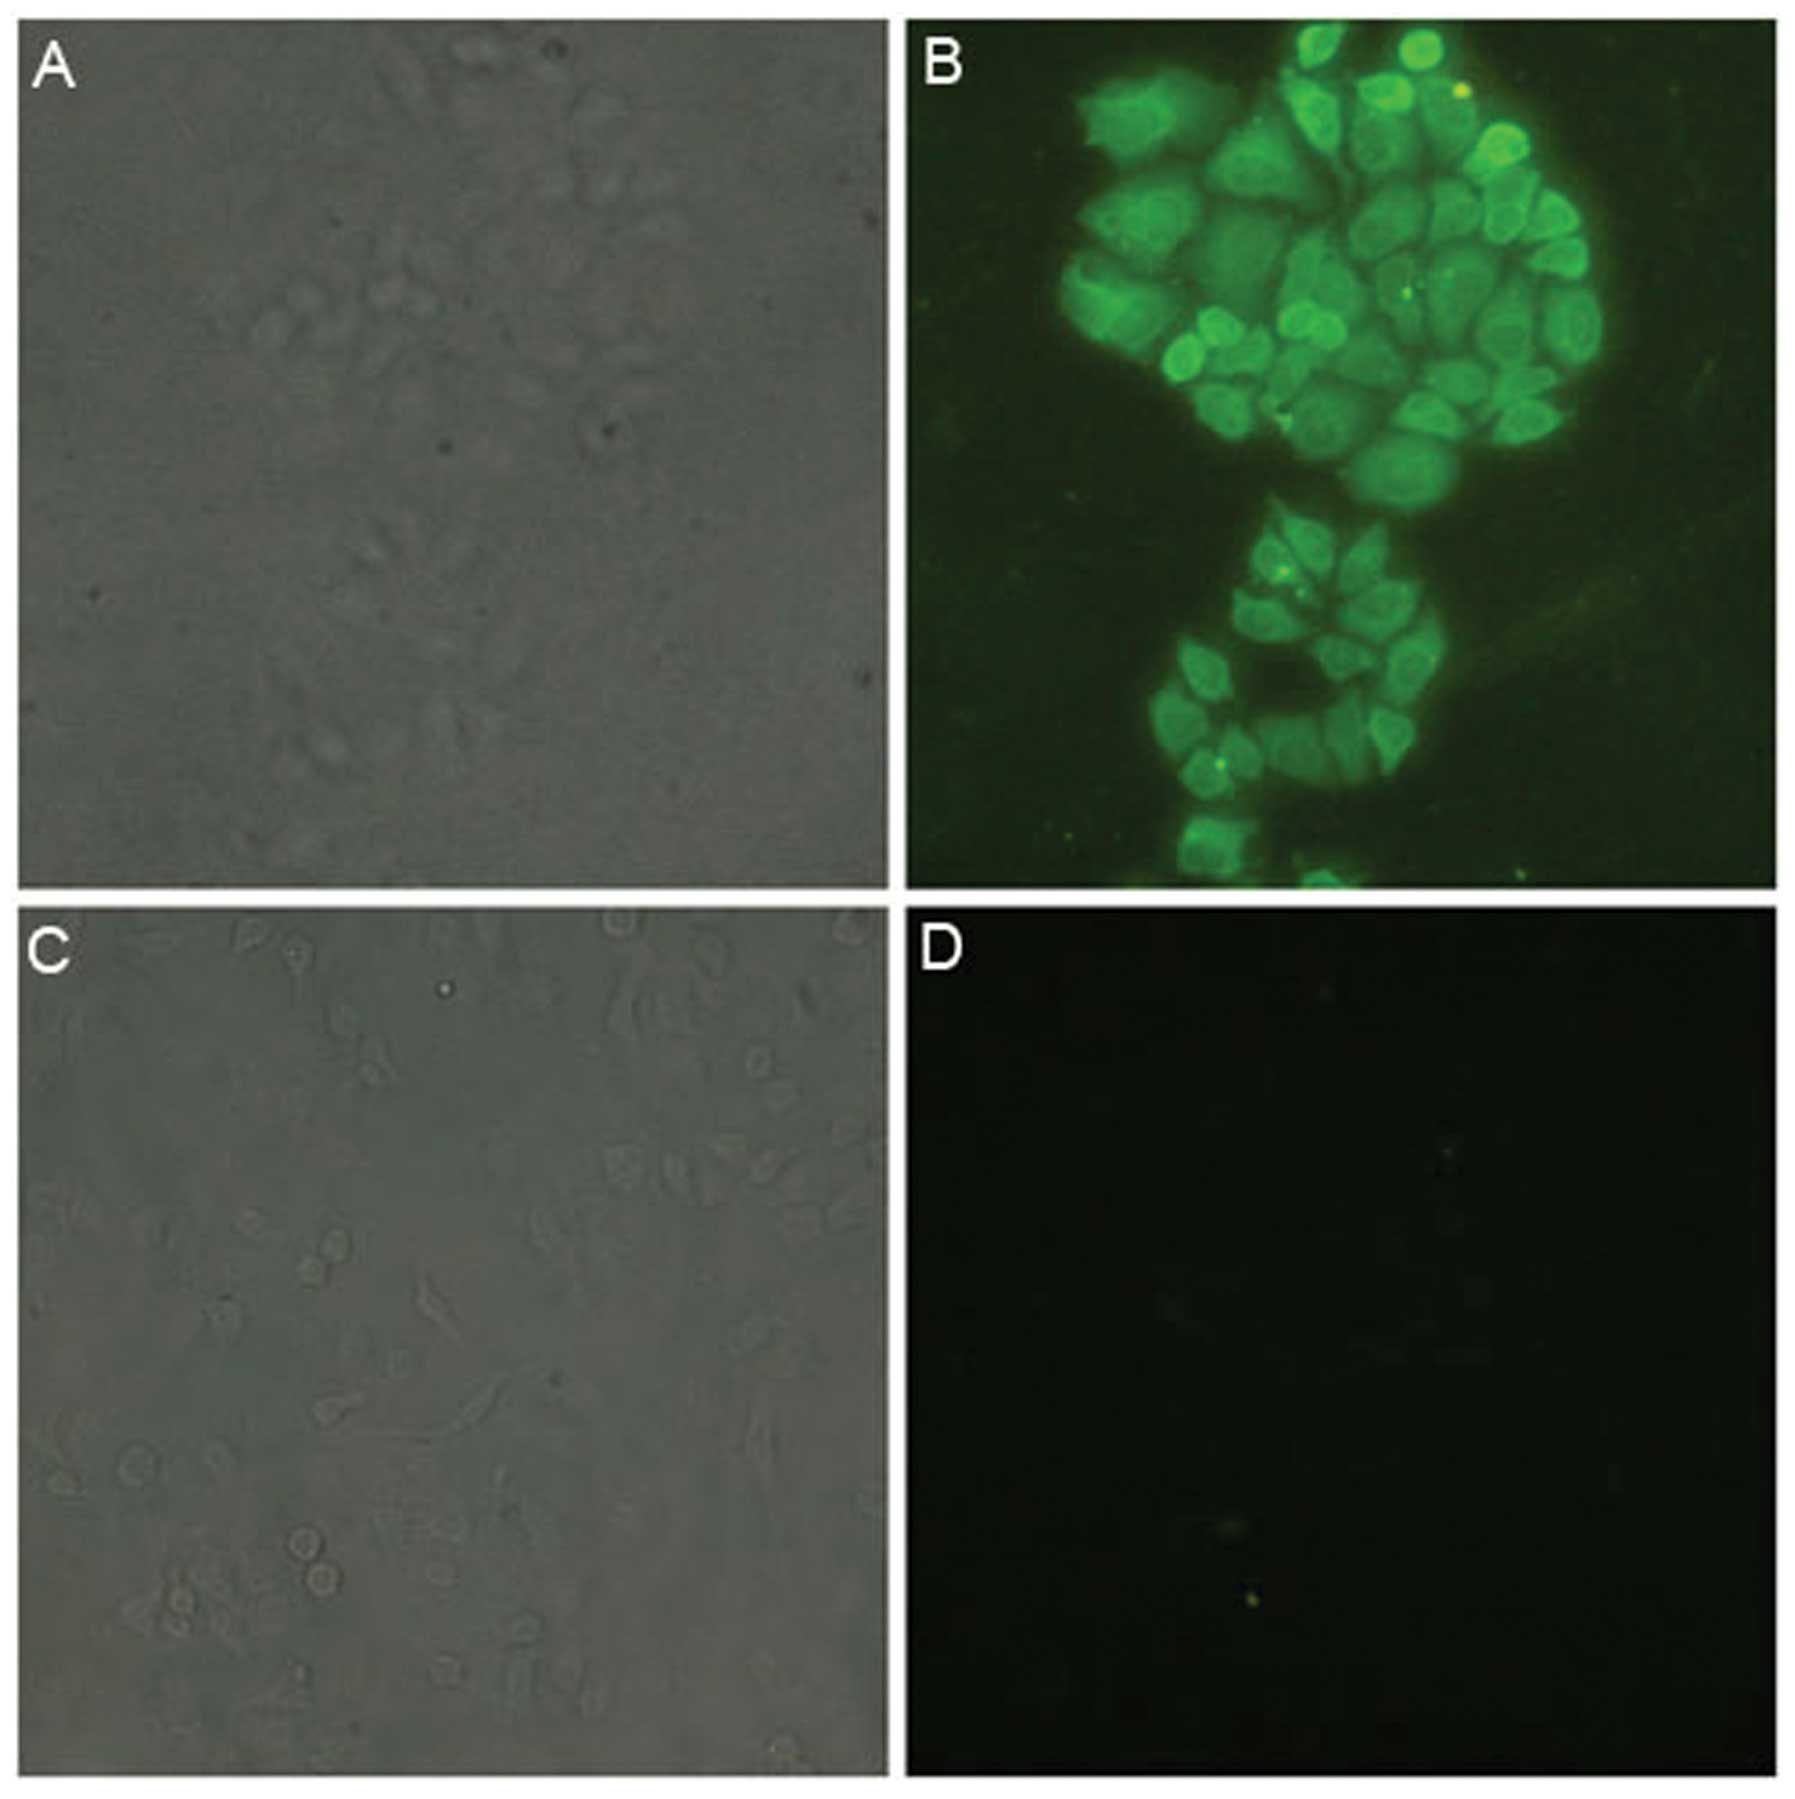
The HepG2 cells were incubated with anti-ART1
antibody, then bound with FITC-labeled secondary antibody. They
were then observed under a fluorescence microscope (Olympus), and
the results showed green fluorescence on the cell surface and in
the cytoplasm. The negative control HepG2 cells did not show green
fluorescence. This indicates that ART1 is expressed in HepG2 cells
(Fig. 3).
IC50 of MIBG in HepG2
cells
The proliferation of HepG2 cells decreased as the
concentration of MIBG increased, indicating that MIBG inhibited the
proliferation of the HepG2 cells. The IC50 of MIBG in
the HepG2 cells was 200 μmol/l (P<0.05; Table II).
| Table IIOptical density (OD) values at
different concentrations and the rate of cell growth inhibition
(SD±s, n=5). |
Table II
Optical density (OD) values at
different concentrations and the rate of cell growth inhibition
(SD±s, n=5).
| Group | OD | Inhibition rate
(%) |
|---|
| Control | 0.853±0.119 | |
| MIBG (μmol/l) |
| 50 | 0.803±0.071a | 5.86 |
| 100 | 0.681±0.086a | 20.1 |
| 150 | 0.597±0.097a | 30.0 |
| 200 | 0.397±0.049a | 53.0 |
| 250 | 0.328±0.062a | 61.5 |
| 300 | 0.233±0.048a | 72.7 |
Effect of MIBG on the migration of HepG2
cells
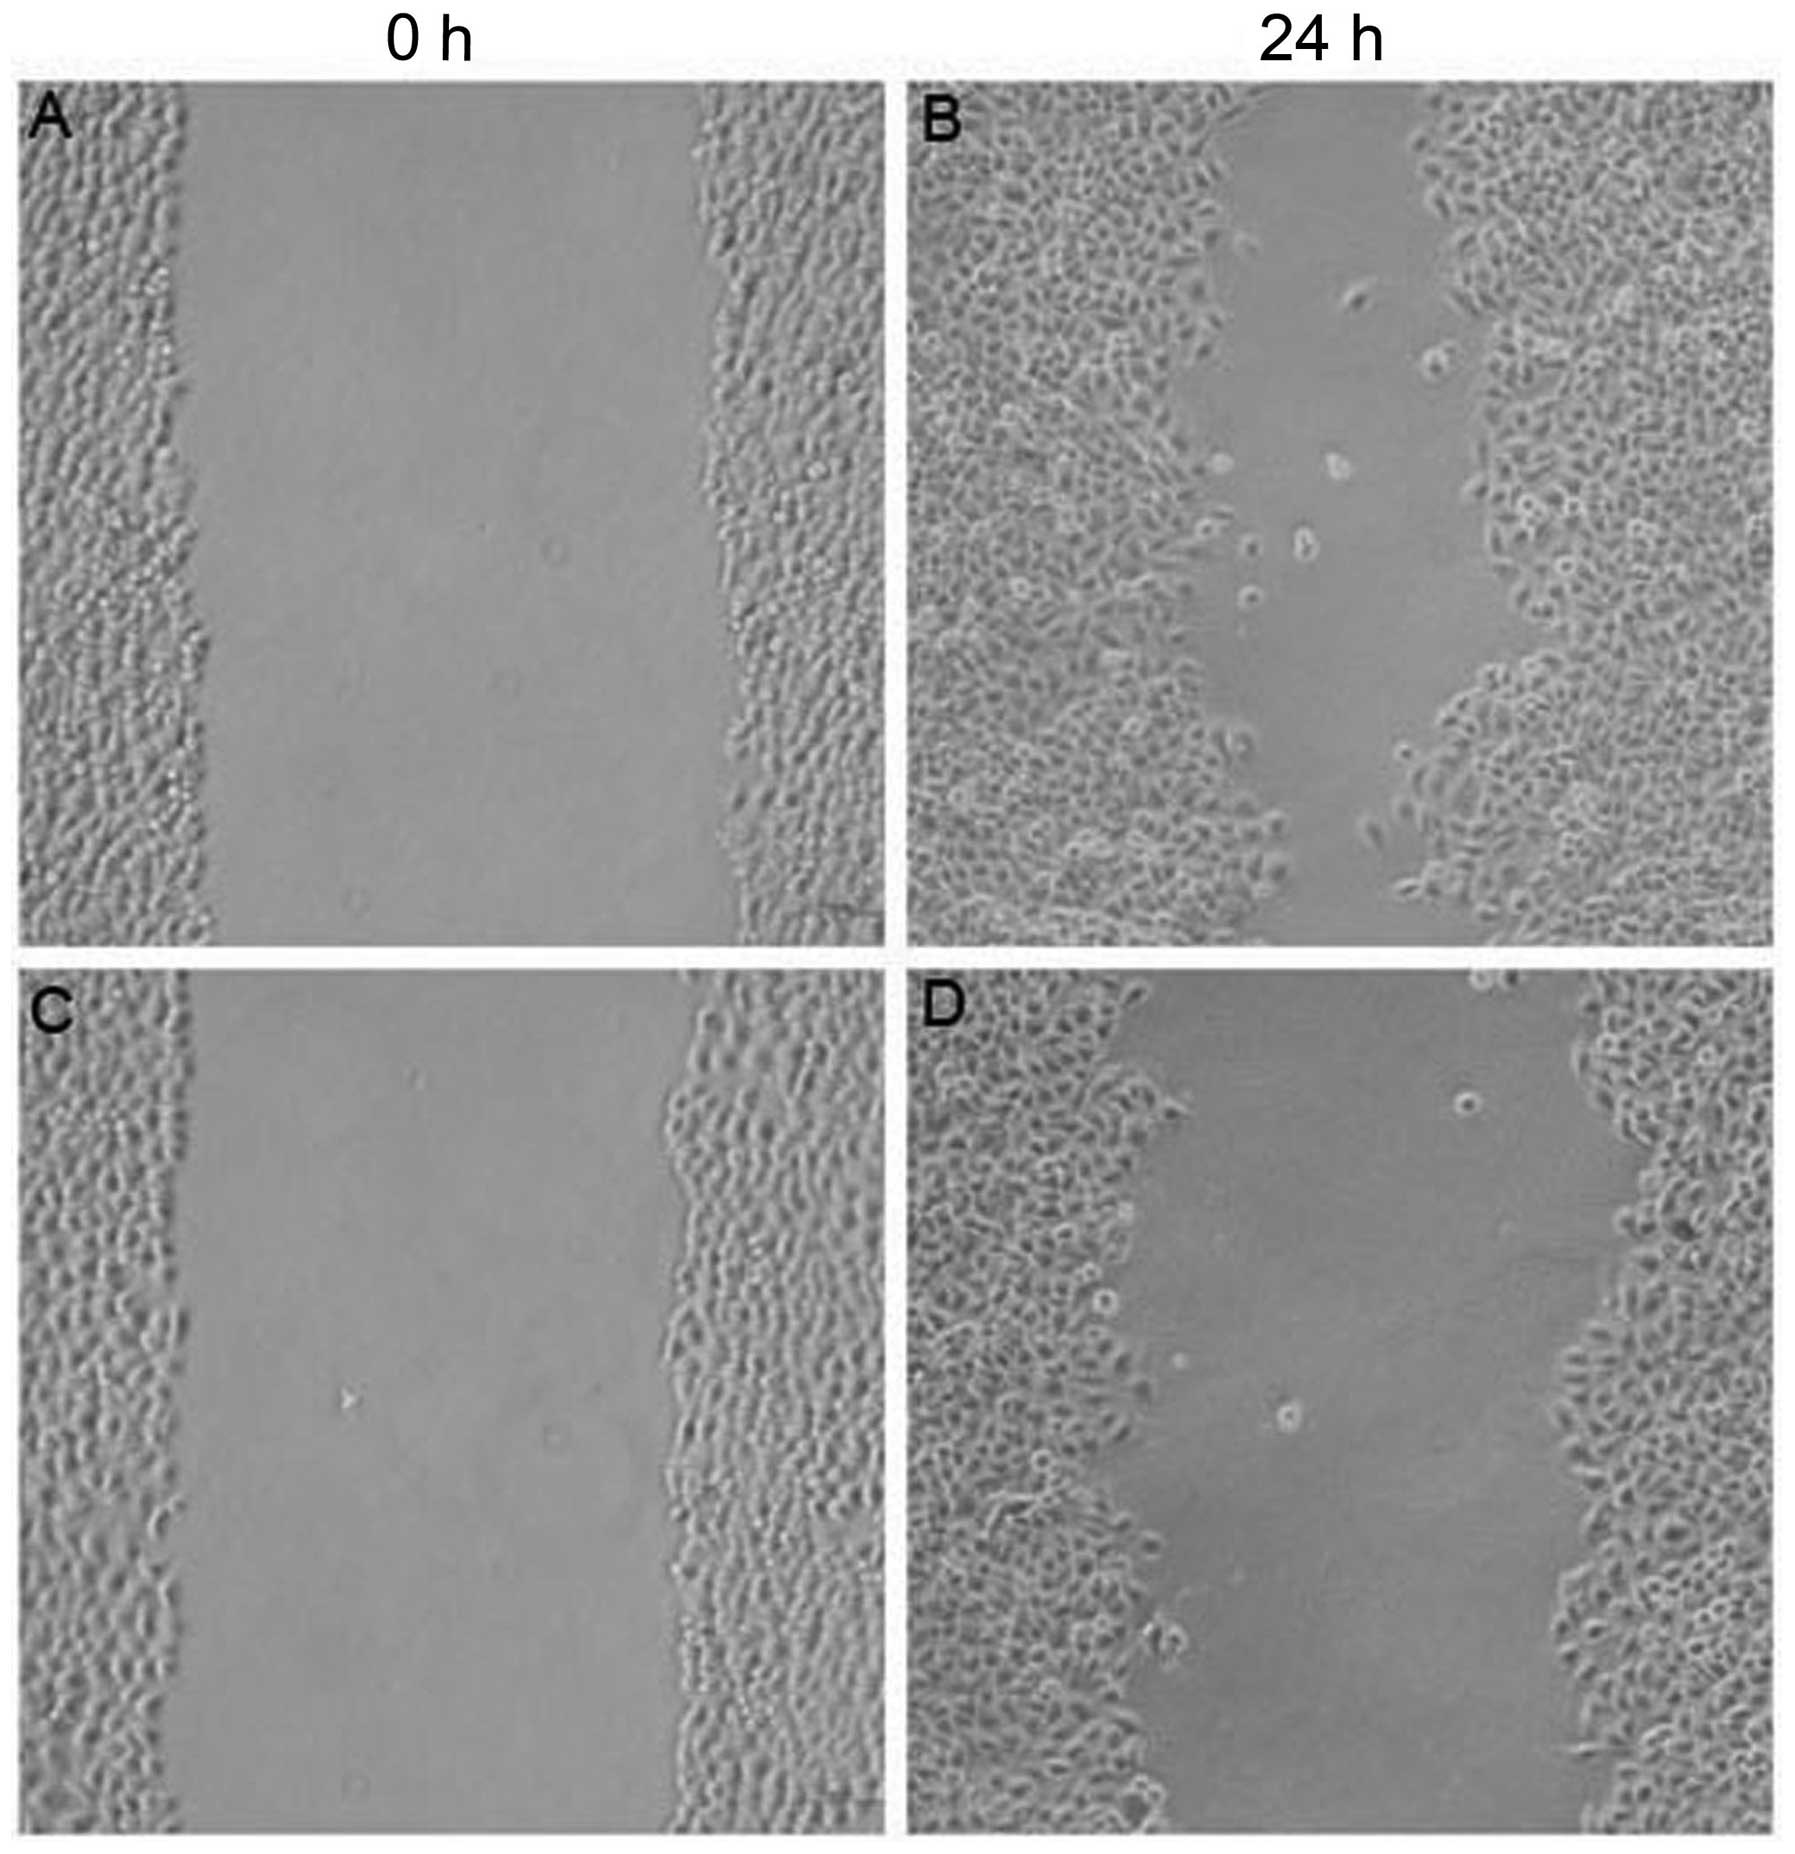
The width of the scratched area in the untreated
control group of HepG2 cells at 24 h was significantly smaller than
that at 0 h (P<0.05; Fig. 4).
This indicated that the HepG2 cells had a strong ability to
migrate. In the 200 μmol/l MIBG-treated group, the width of the
scratched area of HepG2 cells at 24 h was significantly greater
than that of the untreated group (P<0.05). This indicated that
HepG2 cell migration was inhibited by MIBG.
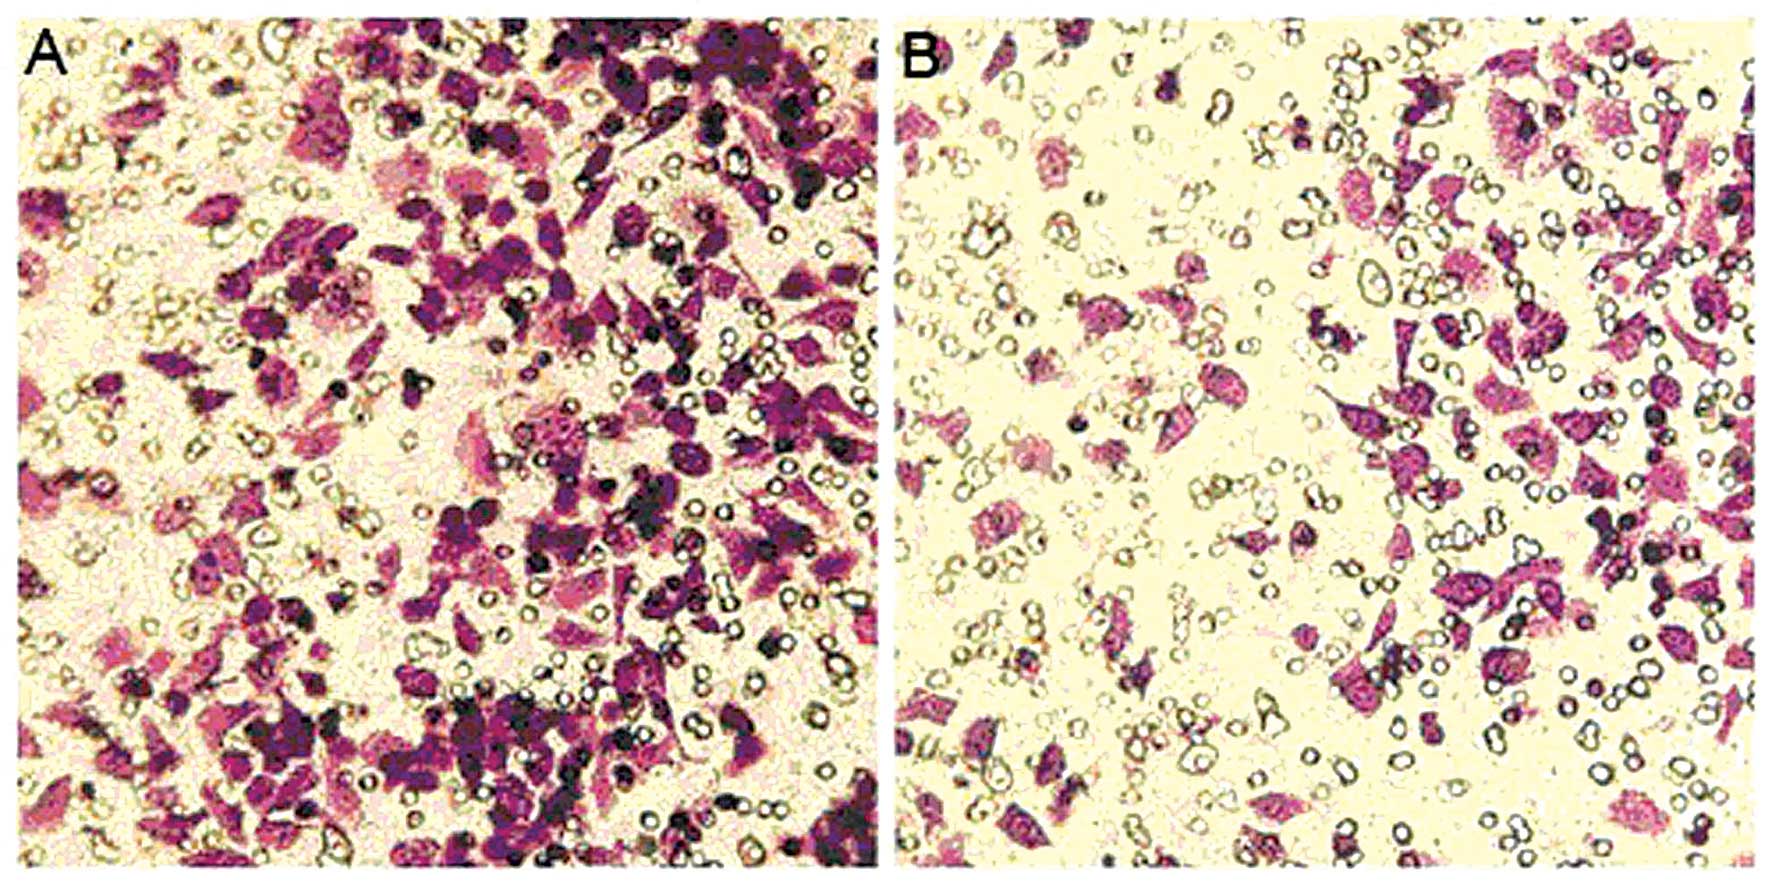
Effect of MIBG on the invasion of HepG2
cells
The number of HepG2 cells that underwent invasion
through Matrigel in the MIBG-treated group was 147.2±18.23952. The
number of untreated control group cells was 300.4±11.9147. These
values were significantly lower in the MIBG-treated group than in
the control group (P<0.01; Fig.
5), indicating that MIBG inhibited the invasive ability of the
HepG2 cells.
Effect of MIBG on the protein expression
of ART1, integrin α7, FAK, PI3K and uPA in HepG2 cells
Western blot analysis revealed that after MIBG was
incubated with the HepG2 cells, the protein expression of ART1,
integrin α7, FAK, PI3K and uPA in the HepG2 cells was significantly
lower compared with the untreated group, and this difference was
dose-dependent. The difference was statistically significant
(P<0.05; Fig. 6). These
results suggested that MIBG inhibited the invasion and migration of
HepG2 cells, possibly through the inhibition of the ART1/integrin
α7/FAK/PI3K/uPA pathway.
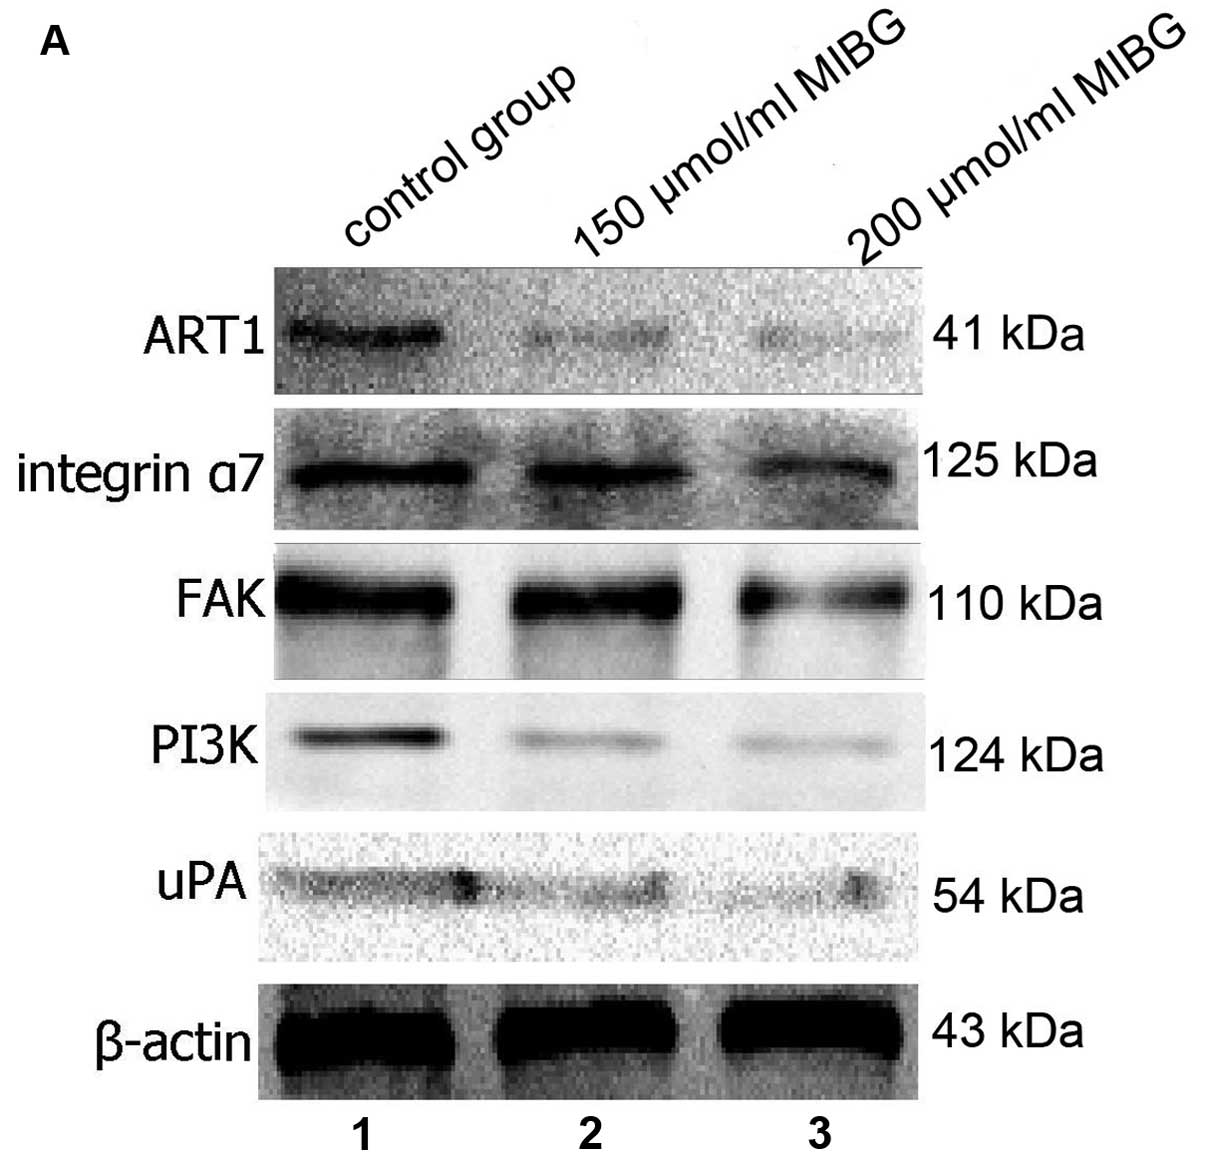 | Figure 6(A) The protein expression of ART1,
integrin α7, FAK, PI3K and uPA in the hepatocellular carcinoma
(HepG2) cells in the different groups was detected by western blot
analysis. Lane 1, control group; lane 2, 150 μmol/l MIBG-treated
group; lane 3, 200 μmol/l MIBG-treated group. (B) The protein
levels of ART1, integrin α7, FAK, PI3K and uPA in the control
group, 150 μmol/l MIBG-treated group and the 200 μmol/l
MIBG-treated group were determined and compared with each other,
and the results showed a significant difference.
*P<0.05. |
Discussion
Metastatic disease is the most common cause of liver
cancer-related deaths, thus research on effective anti-metastatic
drugs has become a hotspot in drug development. MIBG is currently
being used for the diagnosis and treatment of neuroendocrine tumors
(9,10).
The invasion and metastasis of tumor cells is a
complex process. Adherence to the extracellular matrix (ECM) is the
first step in cancer invasion. It is mediated by a specific cell
surface receptor. Adhesion molecules are one of the most important
molecules in the integrin family.
Integrin adhesion molecules include the
non-covalently bound α-subunit and β-subunit. These are connected
by heterodimeric transmembrane glycoproteins. There are 18
α-subunits and 8 β-subunits in the 24 different integrins (11). Integrins α3β1, α6β1, α6β4 and α7β1
mediate cell interaction with the ECM, whereas integrin α7β1 binds
to laminin and promotes tumor cell invasion and migration (12–14).
ART1 is an ADP-ribosyltransferase expressed at a low
level in eukaryotes. It is specifically involved in the arginine
ADP-ribosylation process. It transfers the ADP-ribose of
NAD+ to histidine residues of a targeted protein. This
reaction can regulate a variety of important cellular functions,
including immune responses, cell adhesion, cell signaling and
metabolism (15). However, only
α7 subunits can be modified in integrin α7β1. The β1 subunit cannot
undergo ribosylation. The ribosylation of integrin α7β1 causes a
conformational change in integrin dimers, leading to greater
affinity to a ligand and the enhancement of the function of
integrin α7β1 (16). The maximum
rate of migration of tumor cells depends on the concentration of
ligands, the levels of integrin expression and affinity between
ligands and integrins (17). For
this reason, as shown by our results, when integrin α7β1 was
modified with ART1, the ability of the tumor cells to migrate
improved.
The integrin signaling pathway involves a variety of
protein kinases, such as FAK, proline rich tyrosine kinase 2 (Pyk2)
and Src kinase homologs. FAK plays a pivotal role in signal
transduction mediated by integrins (18,19). FAK is a non-receptor tyrosine
kinase with a molecular weight of 125 kD. It binds to the integrin
β-subunit to activate the latter (20,21). FAK binds to and phosphorylates the
proline-rich region of the p85 subunit of PI3K. This takes place
directly or indirectly through Src, and then the invasion signal is
mediated by integrins (22–24). This prompts uPA secretion. It has
been reported that inhibitors of PI3K and AKT may reduce the
expression of uPA (25–28). uPA is a serine protease, and
activated uPA can activate collagenase, which decomposes the
collagen matrix. Activated uPA can degrade the basement membrane
and extracellular matrix components directly, which promotes tumor
metastasis (29,30). Increased levels of uPA and
invasive properties of tumor cells have been found to be closely
related to the overexpression of uPA in breast cancer. This is a
strong indicator of a poor prognosis (31). In HCC, uPA upregulation is closely
related to vascular invasion and intrahepatic metastasis (32).
The results of the present study demonstrated that
there was a higher expression of ART1 and integrin α7 in HCC with
metastasis than in carcinoma without metastasis. These elevated
expression levels were found to positively correlate with each
other. As the expression of integrin α7 increased, the expression
of ART1 also increased, indicating that the expression of integrin
α7 correlated with the expression of ART1. This suggests that these
two proteins are synergistically involved in HCC invasion and
metastasis. MIBG inhibitedthe expression of ART1, downregulated the
expression of integrin α7β1, continually inhibited its downstream
pathway, FAK/PI3K, and further inhibited the expression of uPA. The
migratory and invasive capabilities of the HepG2 cells were
reduced, suggesting that MIBG inhibited ART1, decreased the
secretion of uPA and affected the ability of the HepG2 cells to
migrate and invade.
The expression levels of ART1 and integrin α7 are
closely related to the degree of differentiation and metastasis of
HCC; thus, these two proteins can be used as indicators for the
degree of malignancy and invasiveness of HCC. The role of ART1 and
integrin α7 in HCC invasion has important clinical significance for
the treatment of liver cancer. MIBG can suppress HCC invasion and
metastasis through the inhibition of the expression of ART1 and
integrin α7. Based on our observations, MIBG shows promise as a
novel anticancer drug for use in the treatment of HCC.
Acknowledgements
The present study was supported by grants from the
Ministry of Education Specialized Research Fund for the Doctoral
Program of Higher Education (grant no. 20105503110009) and the
Science and Technology Project of the Education Commission of
Chongqing (grant no. KJ110322).
References
|
1
|
Di Girolamo M, Dani N, Stilla A and Corda
D: Physiological relevance of the endogenous mono
(ADP-ribosyl)ation of cellular proteins. FEBS J. 272:4565–4575.
2005.PubMed/NCBI
|
|
2
|
Corda D and Di Girolamo M: Functional
aspects of protein mono-ADP-ribosylation. EMBO J. 22:1953–1958.
2003. View Article : Google Scholar : PubMed/NCBI
|
|
3
|
Zolkiewska A and Moss J: Processing of
ADP-ribosylated integrin 7 in skeletal muscle myotubes. J Biol
Chem. 270:9227–9233. 1995. View Article : Google Scholar : PubMed/NCBI
|
|
4
|
Friedrich M, Böhlig L, Kirschner RD,
Engeland K and Hauschildt S: Identification of two regulatory
binding sites which confer myotube specific expression of the
mono-ADP-ribosyltransferase ART1 gene. BMC Mol Bio. 9:912008.
View Article : Google Scholar : PubMed/NCBI
|
|
5
|
Zhao Z, Gruszczynska-Biegala J and
Zolkiewska A: ADP-ribosylation of integrin alpha7 modulates the
binding of integrin alpha7beta1 to laminin. Biochem J. 385:309–317.
2005. View Article : Google Scholar : PubMed/NCBI
|
|
6
|
Loesberg C, van Rooij H and Smets LA:
Meta-iodobenzylguanidine (MIBG), a novel high-affinity substrate
for cholera toxin that interferes with cellular mono
(ADP-ribosylation). Biochim Biophys Acta. 1037:92–99. 1990.
View Article : Google Scholar : PubMed/NCBI
|
|
7
|
Yau L, Litchie B and Zahradka P: MIBG, an
inhibitor of arginine-dependent mono (ADP-ribosyl)ation, prevents
differentiation of L6 skeletal myoblasts by inhibiting expression
of myogenin and p21cip1. Exp Cell Res. 301:320–330.
2004. View Article : Google Scholar : PubMed/NCBI
|
|
8
|
Song Gl, Tang Y, Wang YL, Xu JX and Xiong
W: Effect of ART 1 gene silencing on metastatic potential of mouse
colon cancer CT26 cells and its mechanism. Tumor. 33:490–496.
2013.
|
|
9
|
Garaventa A, Gambini C, Villavecchia G, et
al: Second malignancies in children with neuroblastoma after
combined treatment with 131I-metaiodobenzylguanidine.
Cancer. 97:1332–1338. 2003. View Article : Google Scholar : PubMed/NCBI
|
|
10
|
Shapiro B: Summary, conclusions, and
future directions of [131I] metaiodobenzylguanidine
therapy in the treatment of neural crest tumors. J Nucl Biol Med.
35:357–363. 1990.
|
|
11
|
Rathinam R and Alahari SK: Important role
of integrins in the cancer biology. Cancer Metastasis Rev.
29:223–237. 2010. View Article : Google Scholar : PubMed/NCBI
|
|
12
|
Nishiuchi R, Takagi J, Hayashi M, et al:
Ligand-binding specificities of laminin-binding integrins: a
comprehensive survey of laminin-integrin interactions using
recombinant alpha3beta1, alpha6beta1, alpha7beta1 and alpha6beta4
integrins. Matrix Biol. 25:189–197. 2006. View Article : Google Scholar
|
|
13
|
Yao CC, Ziober BL, Squillace RM and Kramer
RH: α7 integrin mediates cell adhesion and migration on specific
laminin isoforms. J Biol Chem. 271:25598–25603. 1996.
|
|
14
|
Crawley S, Farrell EM, Wang W, et al: The
α7β1 integrin mediates adhesion and migration of skeletal myoblasts
on laminin. Exp Cell Res. 235:274–286. 1997.
|
|
15
|
Tsurumura T, Tsumori Y, Qiu H, et al:
Arginine ADP-ribosylation mechanism based on structural snapshots
of iota-toxin and actin complex. Proc Natl Acad Sci USA.
110:4267–4272. 2013. View Article : Google Scholar : PubMed/NCBI
|
|
16
|
Zolkiewska A: Ecto-ADP-ribose
transferases: cell-surface response to local tissue injury.
Physiology. 20:374–381. 2005. View Article : Google Scholar : PubMed/NCBI
|
|
17
|
Koistinen P and Heino J: Integrins in
cancer cell invasion Cell invasion. Landes Bioscience; 2002
|
|
18
|
Prasadam I, Farnaghi S, Feng JQ, et al:
Impact of extracellular matrix derived from osteoarthritis
subchondral bone osteoblasts on osteocytes: role of integrinβ1 and
focal adhesion kinase signaling cues. Arthritis Res Ther.
15:R1502013.PubMed/NCBI
|
|
19
|
Lim ST, Chen XL, Lim Y, et al: Nuclear FAK
promotes cell proliferation and survival through FERM-enhanced p53
degradation. Mol Cell. 29:9–22. 2008. View Article : Google Scholar : PubMed/NCBI
|
|
20
|
Schaller MD: Biochemical signals and
biological responses elicited by the focal adhesion kinase. Biochim
Biophys Acta. 1540:1–21. 2001. View Article : Google Scholar : PubMed/NCBI
|
|
21
|
Zhao J and Guan JL: Signal transduction by
focal adhesion kinase in cancer. Cancer Metastasis Rev. 28:35–49.
2009. View Article : Google Scholar : PubMed/NCBI
|
|
22
|
Thamilselvan V, Craig DH and Basson MD:
FAK association with multiple signal proteins mediates
pressure-induced colon cancer cell adhesion via a Src-dependent
PI3K/Akt pathway. FASEB J. 21:1730–1741. 2007. View Article : Google Scholar : PubMed/NCBI
|
|
23
|
Shen TL and Guan JL: Differential
regulation of cell migration and cell cycle progression by FAK
complexes with Src, PI3K, Grb7 and Grb2 in focal contacts. FEBS
Lett. 499:176–181. 2001. View Article : Google Scholar : PubMed/NCBI
|
|
24
|
Xia H, Nho RS, Kahm J, Kleidon J and Henke
CA: Focal adhesion kinase is upstream of phosphatidylinositol
3-kinase/Akt in regulating fibroblast survival in response to
contraction of type I collagen matrices via a β1 integrin viability
signaling pathway. J Biol Chem. 279:33024–33034. 2004.PubMed/NCBI
|
|
25
|
Chandrasekar N, Mohanam S, Gujrati M,
Olivero WC, Dinh DH and Rao JS: Downregulation of uPA inhibits
migration and PI3k/Akt signaling in glioblastoma cells. Oncogene.
22:392–400. 2003. View Article : Google Scholar : PubMed/NCBI
|
|
26
|
Nowicki TS, Zhao H, Darzynkiewicz Z, et
al: Downregulation of uPAR inhibits migration, invasion,
proliferation, FAK/PI3K/Akt signaling and induces senescence in
papillary thyroid carcinoma cells. Cell Cycle. 10:100–107. 2011.
View Article : Google Scholar
|
|
27
|
Shukla S, MacLennan GT, Hartman DJ, Fu P,
Resnick MI and Gupta S: Activation of PI3K-Akt signaling pathway
promotes prostate cancer cell invasion. Int J Cancer.
121:1424–1432. 2007. View Article : Google Scholar : PubMed/NCBI
|
|
28
|
Kargiotis O, Chetty C, Gogineni V, et al:
uPA/uPAR downregulation inhibits radiation-induced migration,
invasion and angiogenesis in IOMM-Lee meningioma cells and
decreases tumor growth in vivo. Int J Oncol. 33:937–947.
2008.PubMed/NCBI
|
|
29
|
Dass K, Ahmad A, Azmi AS, Sarkar SH and
Sarkar FH: Evolving role of uPA/uPAR system in human cancers.
Cancer Treat Rev. 34:122–136. 2008. View Article : Google Scholar : PubMed/NCBI
|
|
30
|
Ulisse S, Baldini E, Sorrenti S and
D’Armiento M: The urokinase plasminogen activator system: a target
for anti-cancer therapy. Curr Cancer Drug Targets. 9:32–71. 2009.
View Article : Google Scholar : PubMed/NCBI
|
|
31
|
Bevan P and Mala C: The role of uPA and
uPA inhibitors in breast cancer. Breast Care. 3:1–2. 2008.
View Article : Google Scholar : PubMed/NCBI
|
|
32
|
Chan CF, Yau TO, Jin DY, Wong CM, Fan ST
and Ng IO: Evaluation of nuclear factor-κB, urokinase-type
plasminogen activator, and HBx and their clinicopathological
significance in hepatocellular carcinoma. Clin Cancer Res.
10:4140–4149. 2004.
|