Introduction
Glycosyl antigen, an important component of
glycoproteins and glycolipids, is widely expressed in the cell
membrane. Lewis(y) antigen is a difucosylated oligosaccharide with
two fucoses carried by glycoconjugates (glycoproteins and
glycolipids) on the cell surface. It belongs to the A, B and H
Lewis blood group of antigens family with specific fucosylation of
the terminal end of carbohydrate structure catalyzed by the
α1,2-fucosyltransferase (α1,2-FT) (1). The overexpression of Lewis(y) has
been found in 70–90% of human carcinomas of epithelial cell origin,
including breast, ovary, prostate and colon cancer, and its high
expression has been shown to be associated with a poor prognosis
(2,3). The alterations of type II
carbohydrate chains, such as Lewis(x) and Lewis(y), are common in
ovarian cancer (4). The
overexpression of Lewis(y) antigen, which is closely associated
with prognosis, exists in 75% of epithelial ovarian cancers. CA125,
a tumor marker in epithelial ovarian cancer, also contains Lewis(y)
structure (5).
In our previous studies, human α1,2-FT, a key enzyme
in the synthesis of Lewis(y), was transfected into the ovarian
cancer cell line, RMG-I, which has endogenously a low expression of
Lewis(y), by gene transfection technology and the ovarian cancer
cell line, RMG-I-H, with a stable and high expression of Lewis(y)
was established. Compared with the RMG-I cells, the RMG-I-H cells
exhibited enhanced abilities of cell proliferation, invasion,
metastasis and drug resistance, indicating that Lewis(y) plays a
critical role in the progression of ovarian cancer (6,7).
MUC1 is a type I transmembrane glycoprotein and is
overexpressed in various epithelial tumor tissues. Through the
activation of other receptor molecules and signaling pathways, MUC1
can directly or indirectly affect the biological behaviors of tumor
cells (8). Some researchers have
demonstrated that the glycosylation status of MUC1 can affect
MUC1-mediated tumor growth and cell differentiation (9,10).
We thus hypothesized that Lewis(y) antigen may play a central role
in MUC1 expression, and that MUC1-mediated cell growth and
differentiation may be closely associated with Lewis(y)
antigen.
In this study, we first investigated the expression
pattern and the correlation of Lewis(y) and MUC1 in ovarian serous
and mucinous carcinoma tissue specimens by immunohistochemistry. At
the same time, double-labeling immunofluorescence,
co-immunoprecipitation, western blot analysis and reverse
transcription-quantitative PCR (RT-qPCR) were carried out to
further elucidate the correlation of Lewis(y) antigen and MUC1 in
many aspects. Our study provides a theoretical mechanism of ovarian
carcinogenesis and tumor progression, and a possible target for the
development of biological treatments.
Materials and methods
Materials
The following reagents were purchased from
commercial sources: Dulbecco's modified Eagle's medium (DMEM) and
fetal bovine serum (FBS) from HyClone (Logan, UT, USA); trypsin and
ethylenediamine tetraacetic acid (EDTA) from Amresco (Solon, OH,
USA). Mouse anti-human Lewis(y) monoclonal antibody (clone
A70-C/C8; ab217909) was purchased from Abcam (Cambridge, UK).
Rabbit anti-human MUC1 polyclonal antibody (sc-15333), HRP-labeled
second antibodies (sc-51948) and protein G plus-agarose (sc-500778)
were obtained from Santa Cruz Biotechnology, Inc. (Santa Cruz, CA,
USA). Goat monoclonal anti-mouse immunoglobulin E
tetramethylrhodamine isothiocyanate (TRITC; ZF-0313) and goat
monoclonal anti-rabbit immunoglobulin G fluorescein isothiocyanate
(FITC; ZF-0311) were purchased from Zhongshan Biotechnology
(Beijing, China). The immunohistochemical SP kit was purchased from
Mai Xin Co. (Fujian, China). TRIzol reagent, the PrimeScript™ RT
reagent kit and SYBR® Premix Ex Taq™ were purchased from
Takara Biotechnology Co. (Dalian, China). The sequences of the
primers were synthesized by Invitrogen Co. (Shanghai, China).
Patients and tissue samples
A total of 140 selected paraffin-embedded samples
are obtained from surgeries performed between 2000 to 2009 at the
Obstetrics and Gynecology, Shengjing Hospital Affiliated to China
Medical University, Shenyang, China. This study was approved by the
Ethics Committee of Shengjing Hospital Affiliated to China Medical
University (approval no. 2012PS96K) and written informed consent
was obtained from all participants prior to obtaining the samples.
All the tissue sections were diagnosed by specialists. There were
60 cases of primary malignant ovarian tumors (including 30 mucous
and 30 serous cystadenocarcinomas), 30 borderline ovarian tumors,
30 benign ovarian tumors and 20 normal ovarian tissues (from the
normal ovarian tissue excised in the cervical cancer surgeries).
The mean age of these patients was 47.89 years (15–73 years). The
age range of the ovarian cancer group was 36–73 years and the
median age was 53 years. The age range of the borderline ovarian
tumor group was 22–55 years and median age was 35 years. The age
ranges of the benign ovarian tumor and normal tissue groups were
15–72 and 37–52 years, respectively and hte median ages were 44 and
42 years, respectively. Comparing these groups, there was no
statistically significant difference (P>0.05). According to the
pathological grading, the ovarian cancer group contained 21 cases
of high differentiation; 21 middle differentiation and 18 cases of
low differentiation. The group included 39 cases of stages I–II and
21 cases of stages III–VI according to the International Federation
of Gynecology and Obstetrics (FIGO) standard; there were also 12
cases of metastases to the pelvic lymph nodes. All the cases were
primary, and the information was complete; chemical treatment was
not used in any of the patients prior to surgery.
Cell culture and treatment
The RMG-I cell line, which originated from human
ovarian clear cell carcinoma, was donated by Professor Iwamori
Masao of Tokyo University in Japan. A RMG-I cell line, stabling
expressing the α1,2-FT gene was established as previously described
(11), and was termed RMG-I-H. We
transfected α1, 2-FT plasmids and empty plasmids into the RMG-I
cells using a Cellphect Transfection kit (Pharmacia, Piscataway,
NJ, USA). Transfection was performed according to the
manufacturer's instructions. The cells were cultured in DMEM
supplemented with 10% FBS at 37°C, 5% CO2 in humidified
air. For treatment with anti-Lewis(y) antibody, the final
concentration was 10 µg/ml. The duration of treatment was 24
h.
Immunohistochemistry and
immunocytochemistry
Histological sections from each group of ovarian
tissue were 5-µm-thick. The expression levels of Lewis(y)
and MUC1 in the ovarian carcinoma tissues were analyzed by
immunohistochemical streptavidin-peroxidase staining. A colon
cancer sample served as the positive control for Lewis(y) antigen,
and a breast cancer sample (obtained from the Pathology archive of
Shengjing Hospital Affiliated to China Medical University) was used
as a positive control for MUC1. The group treated with
phosphate-buffered saline (PBS) instead of the primary antibody was
used as a negative control. The working concentrations of the
primary antibodies against Lewis(y) and MUC1 were all 1:150. The
empirical procedure was performed according to instructions
provided with the kit (immunohistochemical SP kit).
The RMG-I-H and RMG-I cells at the exponential phase
of growth were digested by 0.25% trypsin and cultured in DMEM
containing 10% FBS to prepare single-cell suspension. The cells
were washed twice with cold PBS when growing in a single layer, and
fixed with 4% paraformaldehyde for 30 min. The expression of MUC1
in the cells was detected according to the instructions provided
with the SP kit. The concentration of MUC1 monoclonal antibody was
1:200. The primary antibody was replaced by PBS for the negative
control. Normal mouse IgG (10 µg/ml; sc-2025; Santa Cruz
Biotechnology, Inc.) acted as an irrelevant isotype-matched
control.
Two independent investigators examined all tumor
slides randomly. Five views were examined per slide, and 100 cells
were observed per view at ×400 magnification. The immunostaining of
Lewis(y) and MUC1 was scored following a semi-quantitative scale by
evaluating in representative tumor areas the intensity and
percentage of tumor cells. Nuclear and cytoplasmic immunostaining
in tumor cells was considered as positive staining. The intensity
of Lewis(y) and MUC1 staining was scored as 0 (negative), 1 (weak),
2 (moderate) and 3 (strong). Percentage scores were assigned as 1,
1–25%; 2, 26–50%; 3, 51–75%; and 4, 76–100%. The scores of each
tumor sample were multiplied to yield a final score of 0–12, and
the tumors were finally determined as negative (−) expression with
a score of <4, and a tumor sample with a score of ≥4 was
considered as positive. Tumors with a score of ≥4 and <7 were
classified as '+'; tumors with a score of ≥7 and <10 were
classified as '++'; and tumors with a score of ≥10 were classified
as '+++'.
The average optical densities (MOD) were measured
under a microscope (BX53; Olympus, Tokyo, Japan) with image
processing, being presented as the means ± standard deviation for 3
separate experiments.
Western blot analysis
The cells were washed twice with ice-cold PBS,
scraped in lysis buffer [50 mM Tris-HCl (pH 7.4), 150 mM NaCl, 0.5%
NP-40, 100 mM NaF, 200 µM Na3VO4, and
10 µg/ml each aprotinin, leupeptin, PMSF and pepstatin], and
incubated for 30 min at 4°C while rocking. Lysates were cleared by
centrifugation (10 min at 12,000 rpm, 4°C). For immunoblot
analysis, the protein content was measured using the protein assay
BCA kit (Beyotime Biotechnology, Shanghai, China) and 50 µg
of total protein were resolved by sodium dodecyl
sulfate-polyacrylamide gel electrophoresis (SDS-PAGE) and
transferred onto poly(vinylidene difluoride) membranes. The
membranes were blocked with TTBS [25 mM Tris-HCl, 150 mM NaCl (pH
7.5) and 0.1% Tween-20] containing 5% nonfat milk for 2 h and
incubated overnight at 4°C with the appropriate primary antibodies
at the dilutions recommended by the suppliers in TBST/1% non-fat
milk. The blots were washed in TTBS and incubated with the
appropriate HRP-labeled anti-rabbit secondary antibody, and
immunoreactive proteins were visualized with ECL detection system.
The western blots shown are representative of at least 3
independent experiments. Densitometry of each band for the target
proteins was quantified by densitometric analysis with LabWorks 4.6
software. The protein band intensity was quantified by the mean ±
SEM of 3 experiments for each group as determined from densitometry
relative to β-actin (4967; Cell Signaling Technology, Danvers, MA,
USA).
Immunoprecipitation
Washed monolayer cells were lysed with 200 µl
lysis buffer as described above. Following protein determination,
cell lysate containing 500 µg proteins was incubated with 5
µg of MUC1 antibody, and incubated at 4°C for overnight.
Protein G plus-agarose was added and the samples were incubated at
4°C for 3 h for immunoprecipitation.
In brief, the cells immunoprecipitated with MUC1
were subjected to SDS/PAGE, and then transferred onto a
poly(vinylidene difluoride) membrane and treated with 1:1,000
diluted anti-Lewis(y) and 1:500 diluted anti-MUC1 sera in
Tris-buffered saline with 5% non-fat milk, followed by 1:1,000
HRP-labeled secondary antibody. Finally, the color was developed
with enhanced chemiluminescence reagents (Pierce; Thermo Fisher
Scientific, Waltham, MA, USA), and followed by densitometric
scanning.
Double-labeling immunofluorescence
RMG-I-H cells were used to create a cell climbing
slice. Cells were fixed with 4% paraformaldehyde. The tissue
sections were selected tissues that exhibited a strong positive
result in immunohistochemistry using the double-labeling
immunofluorescence method. After blocking with normal goat serum,
the cells and sections were incubated primarily with antibodies
against Lewis(y) (1:150) and MUC1 (1:150) at the same time.
Negative control sections were incubated with PBS instead of the
primary antibody. The working concentrations of FITC and TRITC were
all 1:100. Nuclei were counterstained with DAPI. The empirical
procedure was performed according to the instructions provided with
the kit. The stained slides were observed under a laser confocal
microscope (C1-SI; Nikon, Tokyo, Japan). Data were collected using
a computer and digital images were generated.
RT-qPCR
Total RNA was extracted from the RMG-I and RMG-I-H
cells at the exponential phase of growth using TRIzol reagent (1
ml/1×107 cells). The concentration and purity of the RNA
were examined using an ultraviolet spectrometer. cDNA was
synthesized according to the instructions provided with the RNA
reverse transcription kit (Takara Biotechnology Co.). The reaction
system contained 4 µl of 5X PrimeScript™ buffer, 1 µl
of PrimeScript™ RT Enzyme Mix I, 1 µl of 50 µmol/l
oligo(dT) primer, 1 µl of 100 µmol/l Random 6 mers, 2
µl of total RNA, and 11 µl of RNase-free
dH2O. The reaction conditions were 37°C for 15 min, 85°C
for 5 sec, and 4°C for 5 min. The primer sequences of the MUC1 gene
primers were forward, 5′-CGTCGTGGACATTGATGGTA-3′ and reverse,
5′-GGTACCTCCTCTCACCTCCT-3′. The primer sequences of the β-actin
gene were forward, 5′-GGACTTCGAGCAAGAGATGG-3′and reverse,
5′-ACATCTGCTGGAAGGTGGAC-3′. The reaction system for real-time
fluorescent PCR contained 10 µl of 2X SYBR®
Premix Ex Taq™, 1 µl of 5 µmol/l PCR forward primer,
1 µl of 5 µmol/l PCR reverse primer, 2 µl of
cDNA and 6 µl of dH2O. The reaction conditions
included denaturation at 94°C for 20 sec, 45 cycles of 94°C for 20
sec and 62°C for 20 sec. The Light Cycler PCR system (Roche
Diagnostics, Mannheim, Germany) was used for real-time PCR
amplification and Ct value detection. The melting curves were
analyzed after amplification. PCR reactions of each sample were
carried out in triplicate. The change in the target gene expression
level was calculated using the 2−ΔΔCq method (12).
Assessment standard and statistical
analysis
The presence of brown-colored granules on the cell
membrane or in the cytoplasm was considered a positive signal, and
was divided by color intensity into not colored, light yellow,
brown and tan, and was recorded as 0, 1, 2 and 3, respectively. We
selected 5 high-power fields in series from each slice, and these
were scored, and the average percentage of stained cells was
calculated. A positive cell rate of <5% was given a score of 0,
a positive cell rate of 5–25% was given a score of 1, a positive
cell rate of 26–50% was given a score of 2, a positive cell rate of
51–75% was given a score of 3, and a positive cell rate of >75%
was given a score of 4. The final score was determined by
multiplying the positive cell rate and score values: 0–2 was equal
to negative expression (−), 3–4 was equal to weakly positive (+),
5–8 was equal to moderately positive (++) and 9–12 was equal to
strongly positive (+++). The results were read by 2 independent
observers to control for variability. Microscopic red fluorescence
indicated Lewis(y) antigen labeled by TRITC, green fluorescence
indicated MUC1 labeled by FITC. Images of the 2 individual
fluorescence channels were superimposed using image analysis
software, with yellow fluorescence indicating the co-localization
of Lewis(y) antigen and MUC1. The software SPSS version 16.0 (SPSS,
Inc., Chicago, IL, USA) was used for statistical analysis. Data are
expressed as the means ± SD. The Student's t test was applied to
compare data between the 2 groups, and analysis of variance was
applied to compare data among multiple groups. The Chi-square
(χ2) test was applied to analyze the expression of
Lewis(y) antigen, MUC1 and clinicopathological parameters. The
correlation between Lewis(y) antigen and MUC1 expression was
examined using Linear correlation and Spearman's rank correlation
analysis in ovarian tumors. A value of P<0.05 was considered to
indicate a statistically significant difference.
Results
Expression of Lewis(y) antigen and MUC1
in ovarian tissue groups
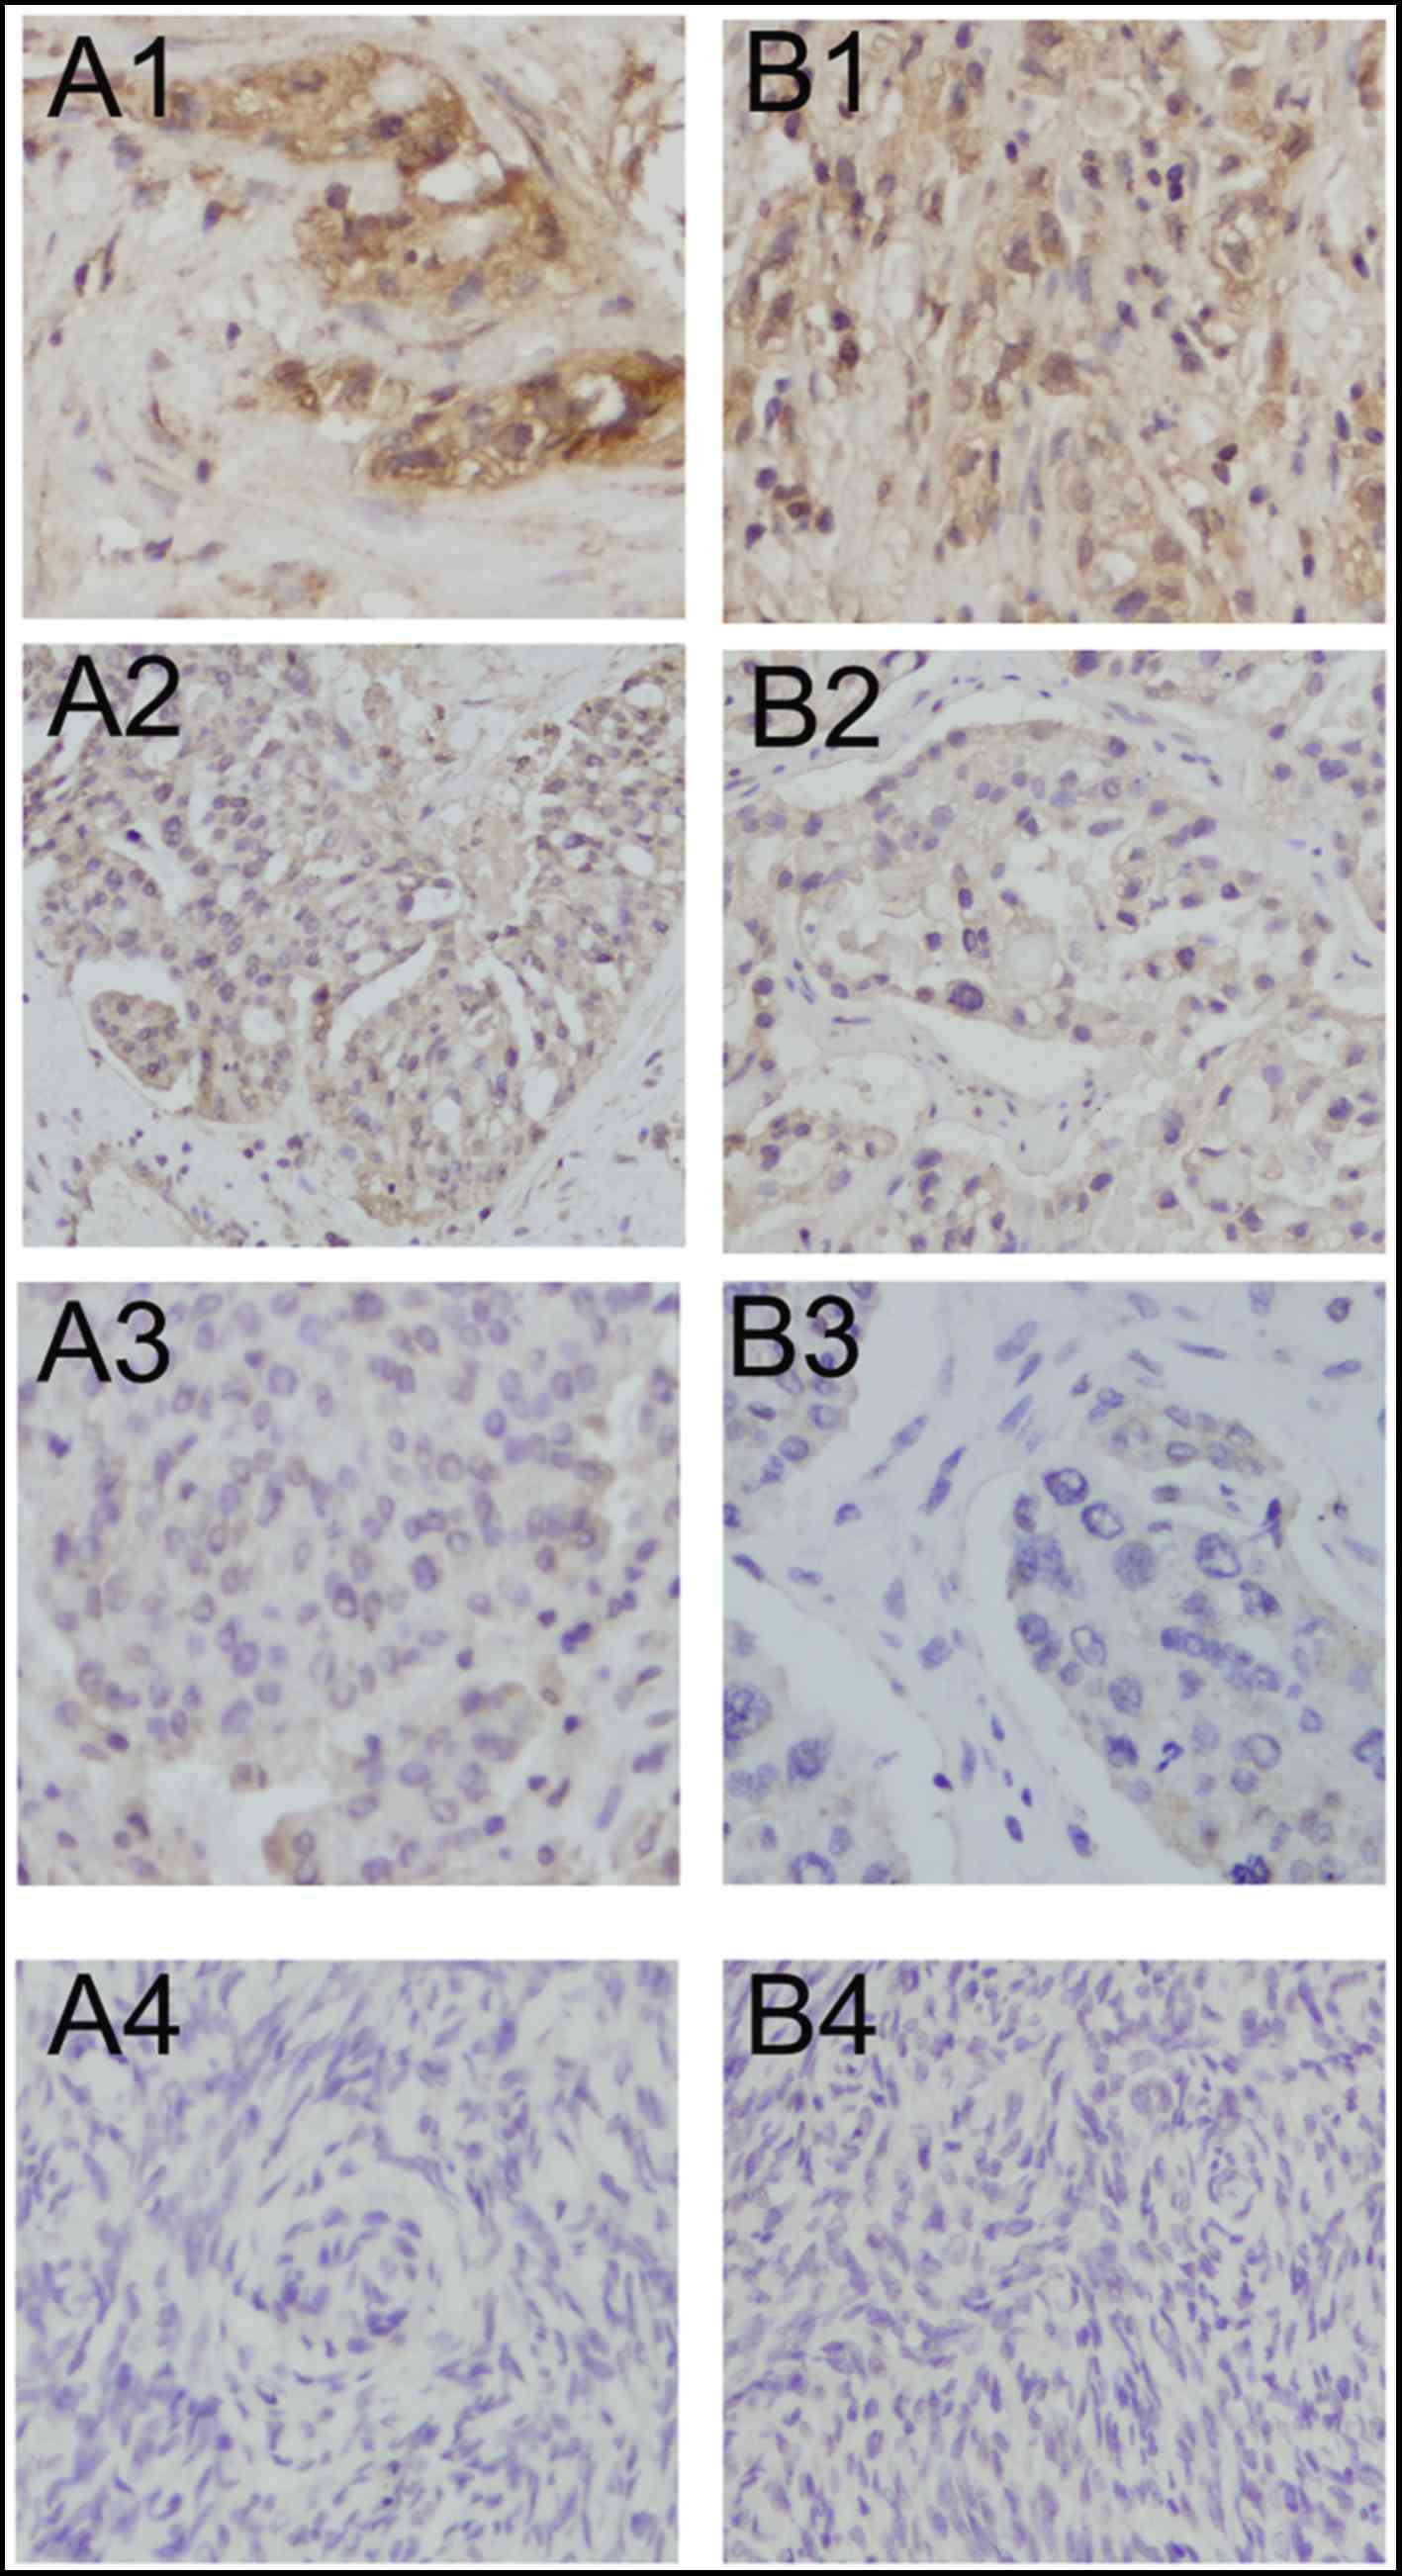
Lewis(y) was mainly localized in the cell membrane,
and detected to a limited extent in the cytoplasm. The positive
expression rates in the malignant, borderline, benign and normal
ovarian tissues for Lewis(y) antigen were 88.33, 60.00, 33.33 and
0%, respectively. The malignant groups displayed the highest
positive expression and was significantly higher than the rate of
the borderline (P<0.05) and benign and normal groups
(P<0.01). The expression rates in borderline groups were
markedly higher than those in the normal group (P<0.01). No
Lewis(y) expression was detected in the normal groups. However, the
difference in positive expression rates for Lewis(y) between
ovarian borderline tumors and benign tumors was not statistically
significant (P>0.05) (Table I
and Fig. 1).
 | Table IExpression of Lewis(y) antigen and
MUC1 in various ovarian tissues. |
Table I
Expression of Lewis(y) antigen and
MUC1 in various ovarian tissues.
| Group | Cases | Lewis(y)
| Positive cases | Rate (%) | MUC1
| Positive cases | Rate (%) |
|---|
| − | + | ++ | +++ | − | + | ++ | +++ |
|---|
| Malignant
group | 60 | 7 | 15 | 20 | 18 | 53 | 88.33a | 8 | 14 | 24 | 14 | 52 | 86.67a |
| Borderline
group | 30 | 12 | 6 | 11 | 1 | 18 | 60b | 14 | 9 | 5 | 2 | 16 | 53.33 |
| Benign group | 30 | 20 | 6 | 4 | 0 | 10 | 33.33 | 21 | 6 | 3 | 0 | 9 | 30 |
| Normal group | 20 | 20 | 0 | 0 | 0 | 0 | 0 | 15 | 5 | 0 | 0 | 5 | 25 |
MUC1 was mainly detected in the cell membrane with
sparse localization in the cytoplasm and nucleus. In malignant
epithelial ovarian tumors, the positive expression rate of MUC1
(86.67%) was significantly higher than that in the borderline
(53.33%) (P<0.05), benign (30.00%) (P<0.01) and normal
ovarian samples (25.00%) (P<0.01). Paired comparisons between
the borderline, benign and normal ovarian samples identified no
significant difference in positive expression rates (P>0.05)
(Table I and Fig. 1).
Correlation of MUC1 and Lewis(y) antigen
positive expression rates and clinical features of ovarian
cancer
In ovarian serous and mucinous carcinomas, the
positive expression rates of Lewis(y) were 90.00 and 86.67%,
respectively, which were similar (Chi-square test, P>0.05) (data
not shown). Lewis(y) was detected in 95.2% of the cases with stages
III–IV ovarian cancer. The rate of expression was higher than that
in the cases with stages I–II of the disease (82.05%), although
this difference did not reach statistical significance (P>0.05).
The expression rates of Lewis(y) in the high, moderate and poor
differentiation groups were 80.95, 85.71 and 100%, respectively;
however, this increase in the Lewis(y) positive rate with a
decrease in the cell differentiation level was not statistically
significant (P>0.05). The positive rate of Lewis(y) in the
lymphatic metastasis group (100%) was higher than that of the
non-lymphatic metastasis group (85.42%), although this difference
was not significant in statistical analysis (P>0.05) (Table II).
| Table IIAssociation between Lewis(y) antigen
and MUC1 expression, expression intensity and pathological features
in ovarian cancer. |
Table II
Association between Lewis(y) antigen
and MUC1 expression, expression intensity and pathological features
in ovarian cancer.
| Features | Case | Lewis(y)
| MUC1
|
|---|
| Positive cases | Rate (%) | P-value | MOD | P-value | Positive cases | Rate (%) | P-value | MOD | P-value |
|---|
| FIGO stage |
| I–II | 39 | 33 | 84.62 | >0.05 | 0.438±0.089 | <0.05 | 31 | 79.49 | >0.05 | 0.421±0.097 | <0.05 |
| III–IV | 21 | 20 | 95.24 | | 0.501±0.098 | | 21 | 100 | | 0.510±0.083 | |
| Differentiation
level |
| High | 21 | 17 | 80.95 | >0.05 | 0.431±0.089 | <0.05a | 18 | 85.71 | >0.05 | 0.440±0.095 | <0.05a |
| Moderate | 21 | 18 | 85.71 | | 0.465±0.092 | >0.05b | 17 | 80.95 | | 0.456±0.081 | >0.05b |
| Poor | 18 | 18 | 100 | | 0.493±0.104 | <0.05c | 17 | 94.44 | | 0.476±0.092 | <0.05c |
| Lymphatic
metastasis |
| No | 48 | 41 | 85.42 | >0.05 | 0.457±0.094 | >0.05 | 42 | 87.5 | >0.05 | 0.451±0.098 | >0.05 |
| Yes | 12 | 12 | 100 | | 0.489±0.077 | | 10 | 83.33 | | 0.485±0.069 | |
The positive expression rates of MUC1 in the serous
and mucinous carcinomas were 90.00 and 83.33% respectively, which
did not exhibit a significant difference (Chi-square test,
P>0.05) (data not shown). The MUC1 positive rate was detected in
100% of the cases with stages III–IV ovarian cancer. The rate of
expression was higher than that in stages I–II (79.49%), although
this difference did not reach statistical significance (P>0.05).
In the ovarian cancer tissues with high, moderate and poor
differentiation, the positive rates of MUC1 were 85.71, 80.95 and
94.44%, respectively, with no statistical significance being
detected among the 3 group (P>0.05). The positive rate of MUC1
in the lymphatic metastasis group (83.33%) was not significantly
higher than that in the lymphatic metastasis-free group (87.50%)
(P>0.05) (Table II).
Correlation of MUC1 and Lewis(y) antigen
staining intensity and clinical features of ovarian cancer
We detected and analyzed the staining intensity of
ovarian cancer sections that were positive for Lewis(y) and MUC1 by
immunohistochemistry. In the tissues with stages III–IV ovarian
cancer, the mean optical density (MOD) of Lewis(y) was 0.501±0.098,
which was significantly higher than that in stages I–II
(0.438±0.089) (P<0.05). In the ovarian cancer tissue with poor
differentiation, the MOD of Lewis(y) was 0.493±0.104, which was
significantly higher than the value (0.431±0.089) obtained from the
well differentiation group (P<0.05). However, there was no
significant difference when Lewis(y) staining intensities in the
moderate differentiation group were compared with those in the high
or poor differentiation group (P>0.05). We also found that the
staining intensity of Lewis(y) did not correlate with the
histological type of ovarian cancer or with lymph node metastasis
(P>0.05) (Table II).
The MOD of MUC1 in the cases with stages III–IV
ovarian cancer was 0.510±0.083, which was significantly higher than
that in stages I–II (0.421±0.097) (P<0.05). In the ovarian
cancer tissues with poor differentiation, the MOD of MUC1 was
0.476±0.092, which was significantly higher than the value
(0.440±0.095) obtained from the well differentiation group
(P<0.05). However, there was no significant difference when
Lewis(y) staining intensities in the moderate differentiation group
were compared with those in the well or poor differentiation group
(P>0.05). In accordance with Lewis(y), the MOD of MUC1 did not
correlate with the histological type of ovarian cancer or with
lymph node metastasis (P>0.05) (Table II).
Relevance of MUC1 and Lewis (y) antigen
expression in ovarian cancer
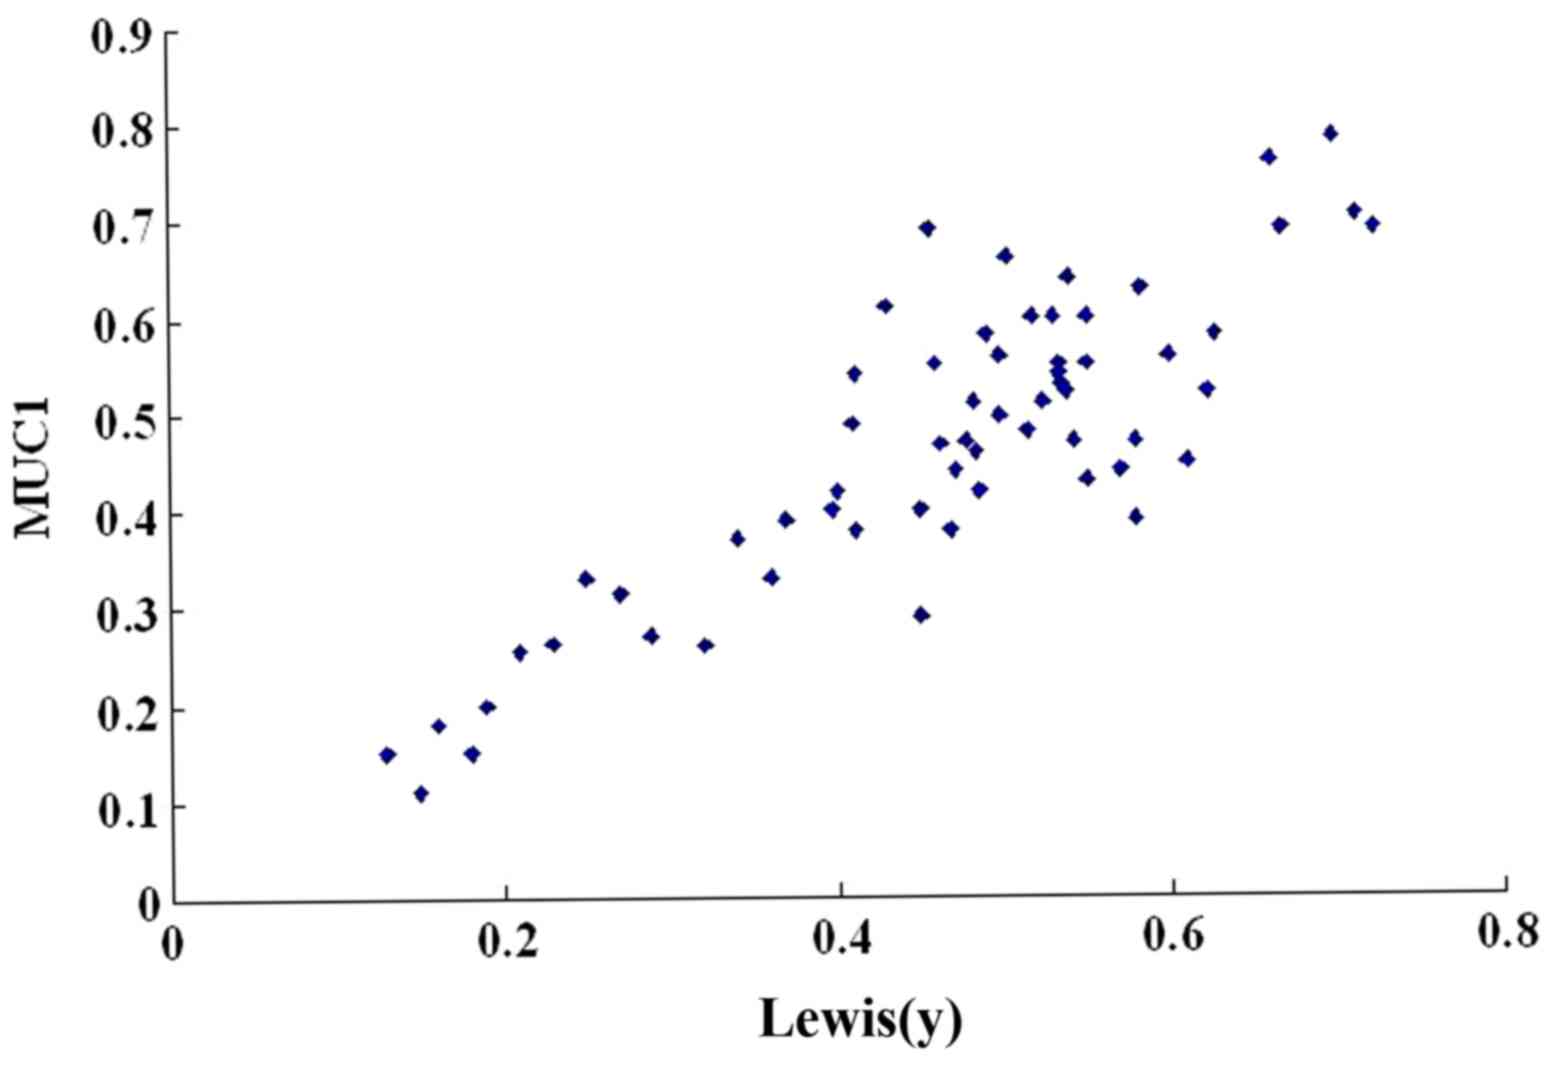
We then used a scatter plot of the MOD value to
analyze the relevance of MUC1 and Lewis(y) antigen expression in
ovarian cancer. In the majority of cases, the ovarian cancer
tissues that highly expressed Lewis(y) antigen concomitantly
expressed high levels of MUC1; the expression patterns of MUC1 and
Lewis(y) antigen linearly correlated (r=0.657, P<0.01) (Table III and Fig. 2). In addition, Spearman's rank
correlation was performed. There was a significant association
between MUC1 and Lewis(y) antigen based on the IHC scoring system
(P<0.05).
| Table IIIExpression and correlation of
Lewis(y) antigen and MUC1 in ovarian cancer. |
Table III
Expression and correlation of
Lewis(y) antigen and MUC1 in ovarian cancer.
| N | Expression of MUC1
|
|---|
| (−) | (+) | (++) | (+++) |
|---|
| Expression of
Lewis(y) antigen |
| (−) | 7 | 4 | 2 | 1 | 0 |
| (+) | 15 | 2 | 7 | 4 | 2 |
| (++) | 20 | 2 | 4 | 12 | 2 |
| (+++) | 18 | 0 | 1 | 7 | 10 |
| case | 60 | 8 | 14 | 24 | 14 |
MUC1 expression in RMG-I-H cells is
higher than that in RMG-I cells
In our previous study, human α1,2-FT, a key enzyme
in the synthesis of Lewis(y), was transfected into the ovarian
cancer cell line, RMG-I, which has an endogenously low expression
of Lewis(y), by gene transfection technology, and the ovarian
cancer cell line, RMG-I-H, with a stable and high expression of
Lewis(y) was established.
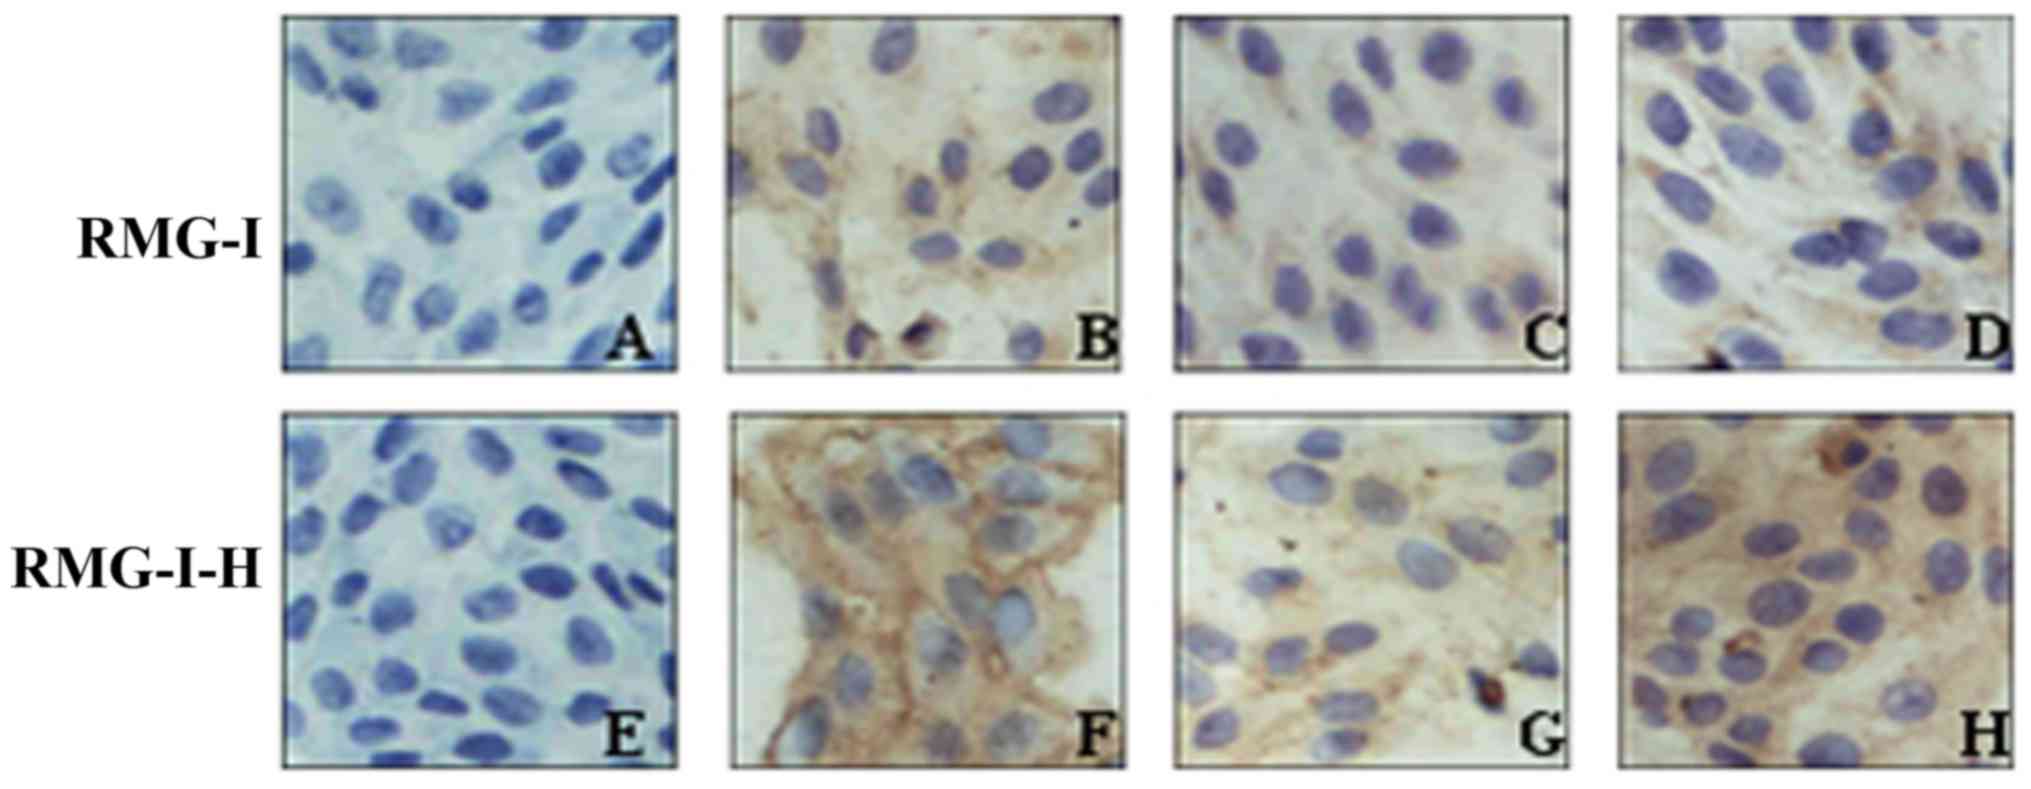
The results of immunocytochemistry revealed that
MUC1 was localized in the cytoplasm and membrane. In the RMG-I
cells, MUC1 staining presented as light yellow particles and its
MOD value was 0.187±0.011. In the RMG-I-H cells, MUC1 staining
presented as brown yellow particles and its MOD value was
0.498±0.023, which was significantly higher than that in the RMG-I
cells P<0.01) (Fig. 3 and
Table IV). In order to
demonstrate whether Lewis(y) is the central factor of regulating
MUC1 expression, we pre-treated the RMG-I cells and RMG-I-H cells
with Lewis(y) monoclonal antibody. Following treatment with
Lewis(y) antibody, the expression of MUC1 was decreased in both the
RMG-I-H cells and RMG-I cells (P<0.01), although no significant
difference was observed between these 2 cell lines (P>0.05).
However, following treatment with an irrelevant isotype IgG, MUC1
expression was not altered in the RMG-I-H cells and RMG-I cells
(Fig. 3 and Table IV).
| Table IVAverage optical indensity of MUC1 in
RMG-I and RMG-I-H cells. |
Table IV
Average optical indensity of MUC1 in
RMG-I and RMG-I-H cells.
| RMG-I | RMG-I-H |
|---|
| Negative
control | 0.024±0.019 | 0.025±0.018 |
| No treatment | 0.187±0.011 | 0.498±0.023a |
| Pre-treatment with
Lewis(y)mAb | 0.125±0.009b | 0.138±0.013b |
| Pre-treatment with
irrelevant isotype IgG | 0.194±0.008 | 0.469±0.019 |
We used RT-qPCR to examine the changes in the mRNA
expression levels of MUC1 following transfection with human
α1,2-FT. Our results revealed that the mRNA level of MUC1 in the
RMG-I-H cells was 1.35-fold higher than that in the RMG-I cells
(P<0.01), indicating that MUC1 was regulated at the
transcriptional level (Fig.
4).
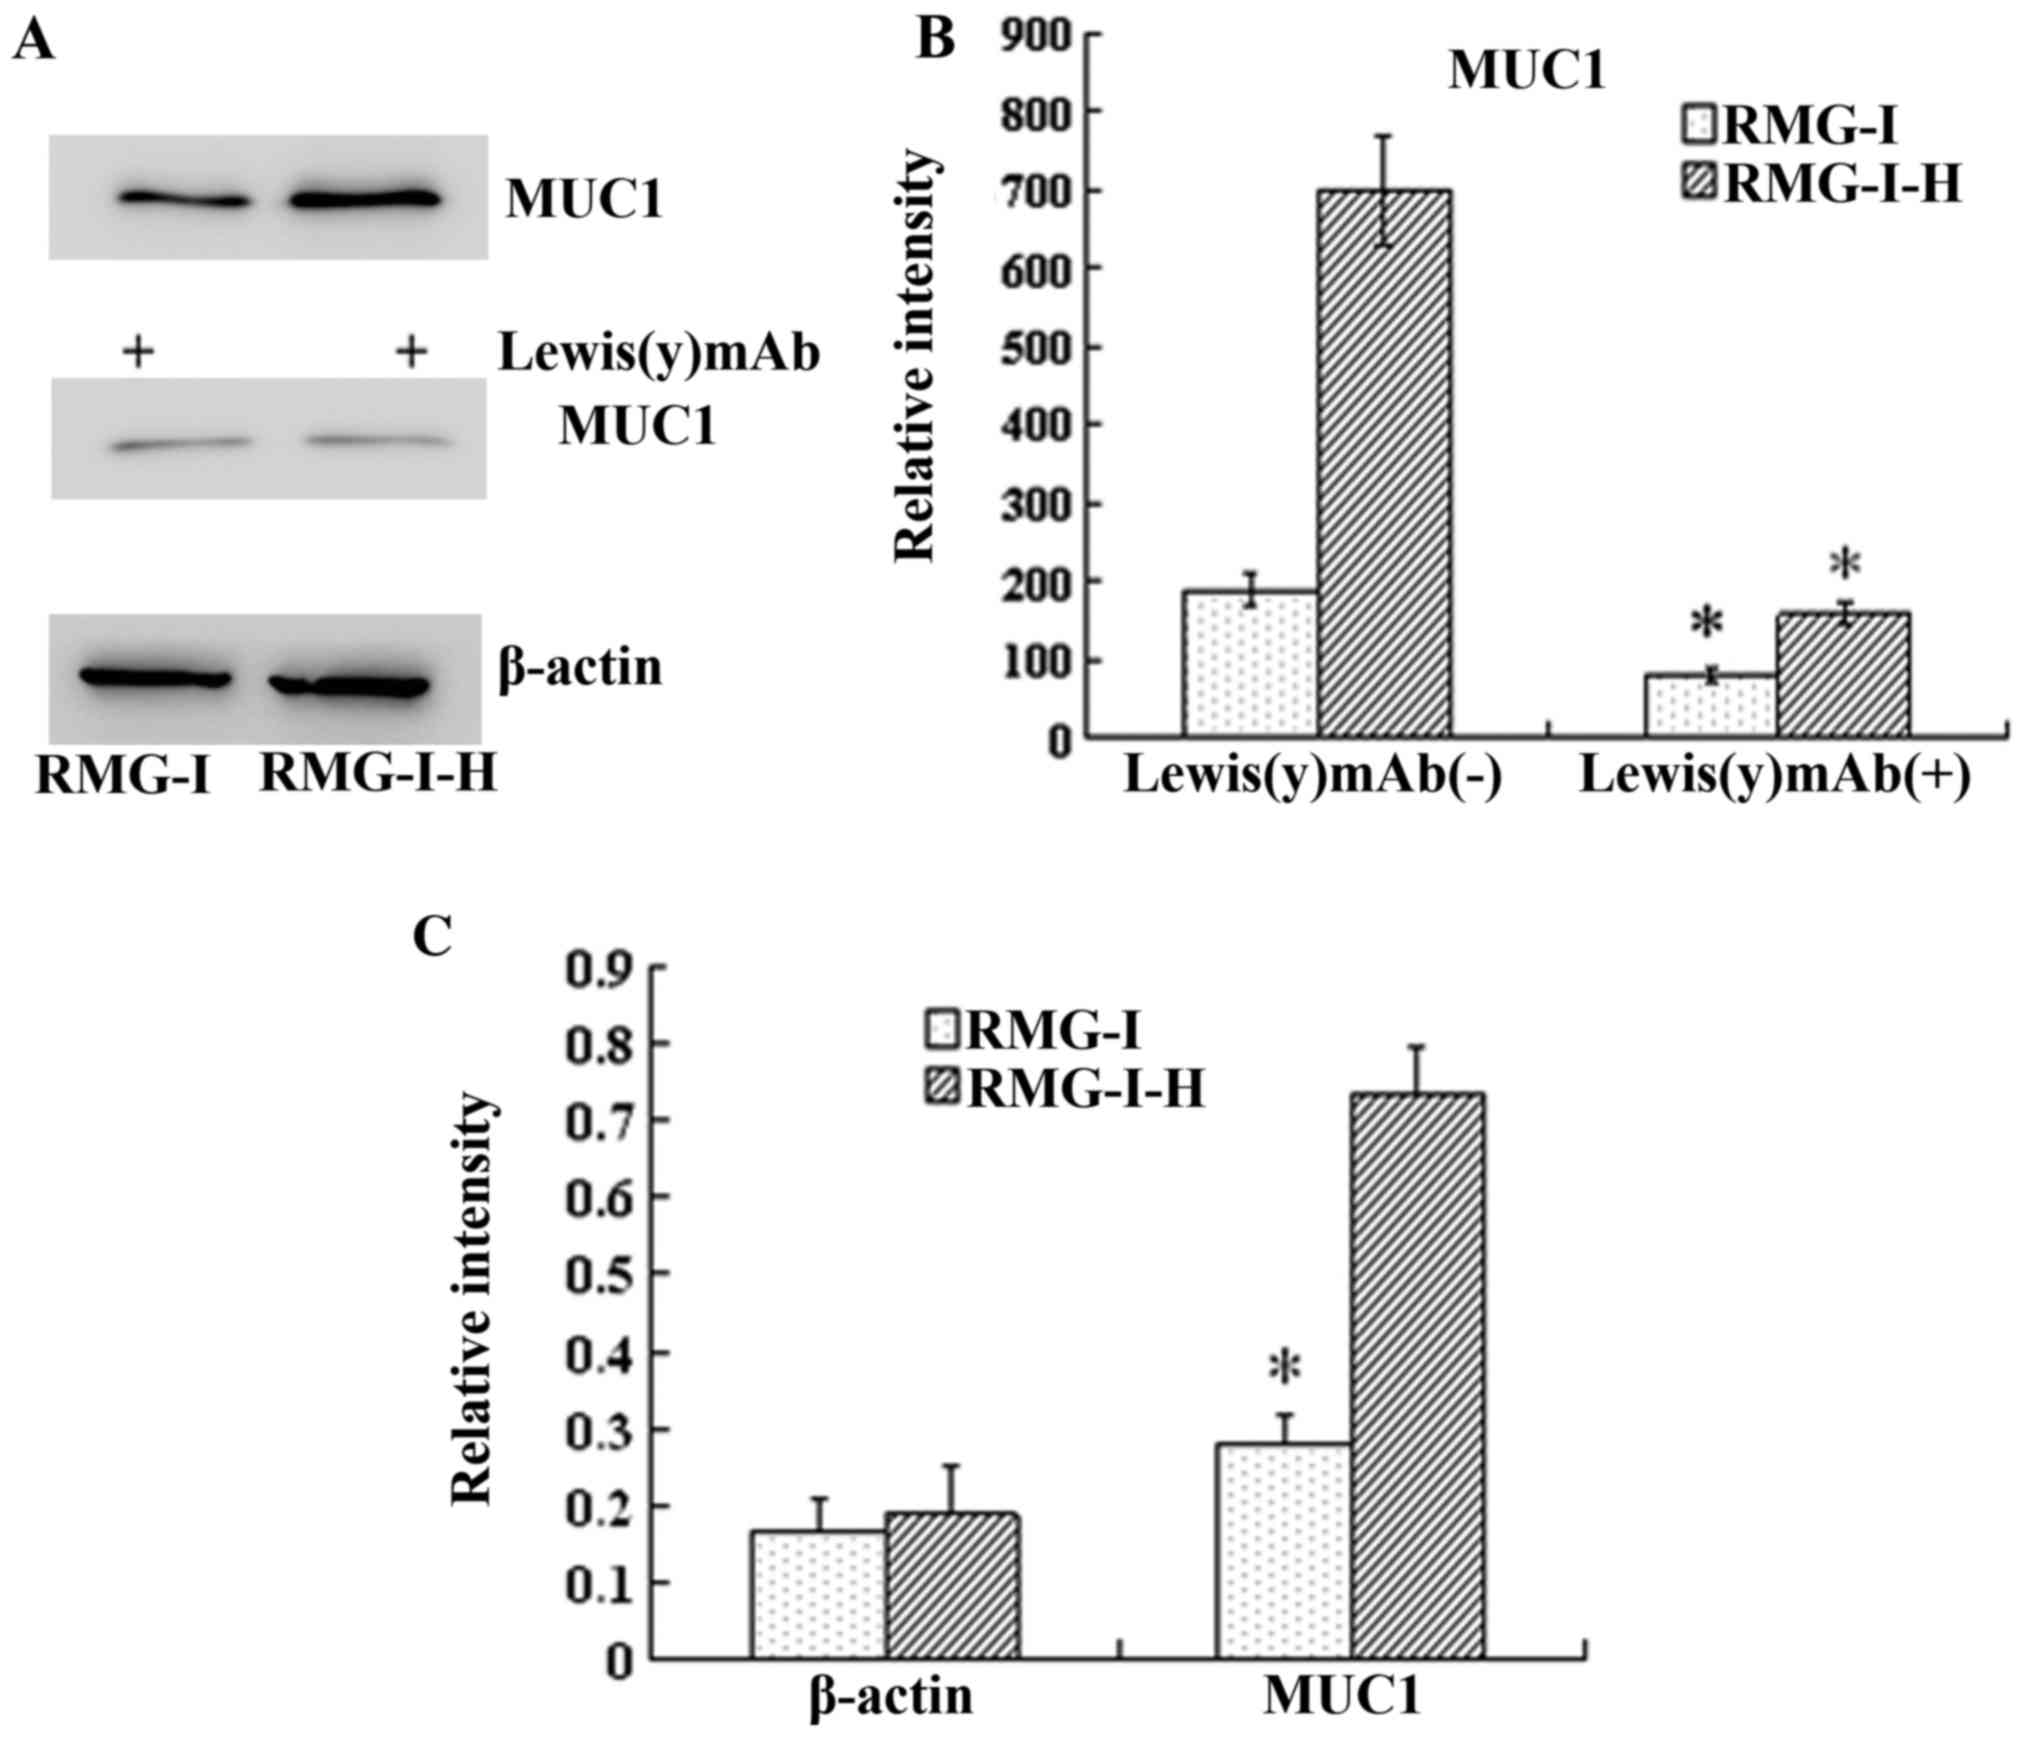
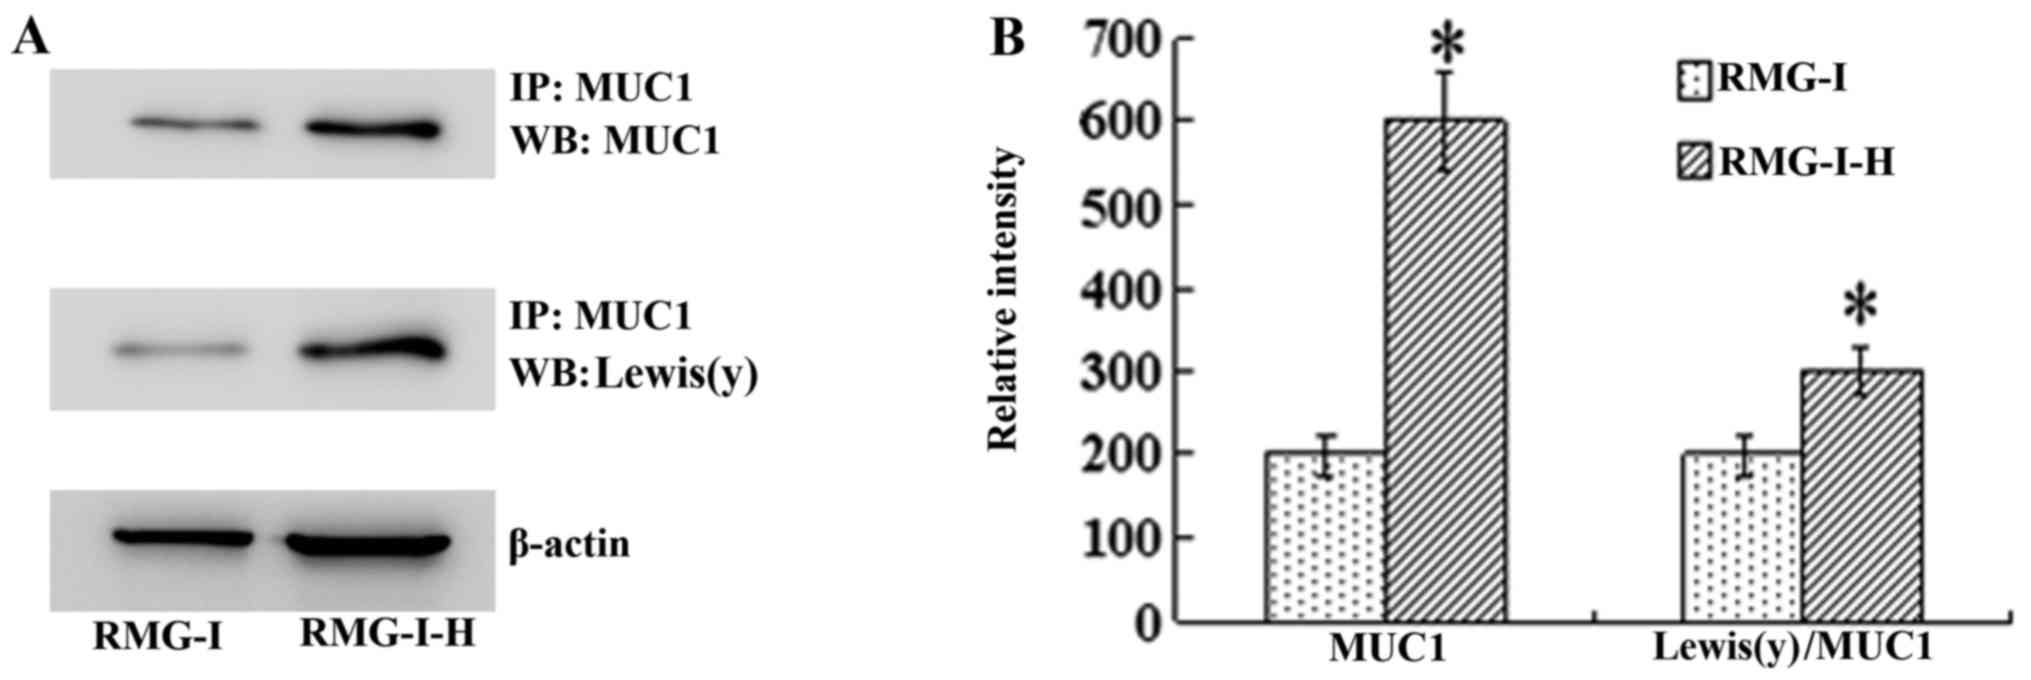
Similarly, the results of western blot analysis
demonstrated that the total amount of MUC1 protein was increased in
the RMG-I-H cells 3.68-fold compared with the RMG-I cells
(P<0.01). When Lewis(y) was blocked with monoclonal antibody,
the protein expression of MUC1 was decreased significantly
(P<0.01) (Fig. 4). Moreover,
the level of Lewis(y) interacting with MUC1 was observed by
immunoprecipitation. The ratio of total Lewis(y) immunoprecipitated
with MUC1 to total MUC1 protein was increased in the RMG-I-H cells
1.55-fold compared with the RMG-I cells (P<0.01) (Fig. 5).
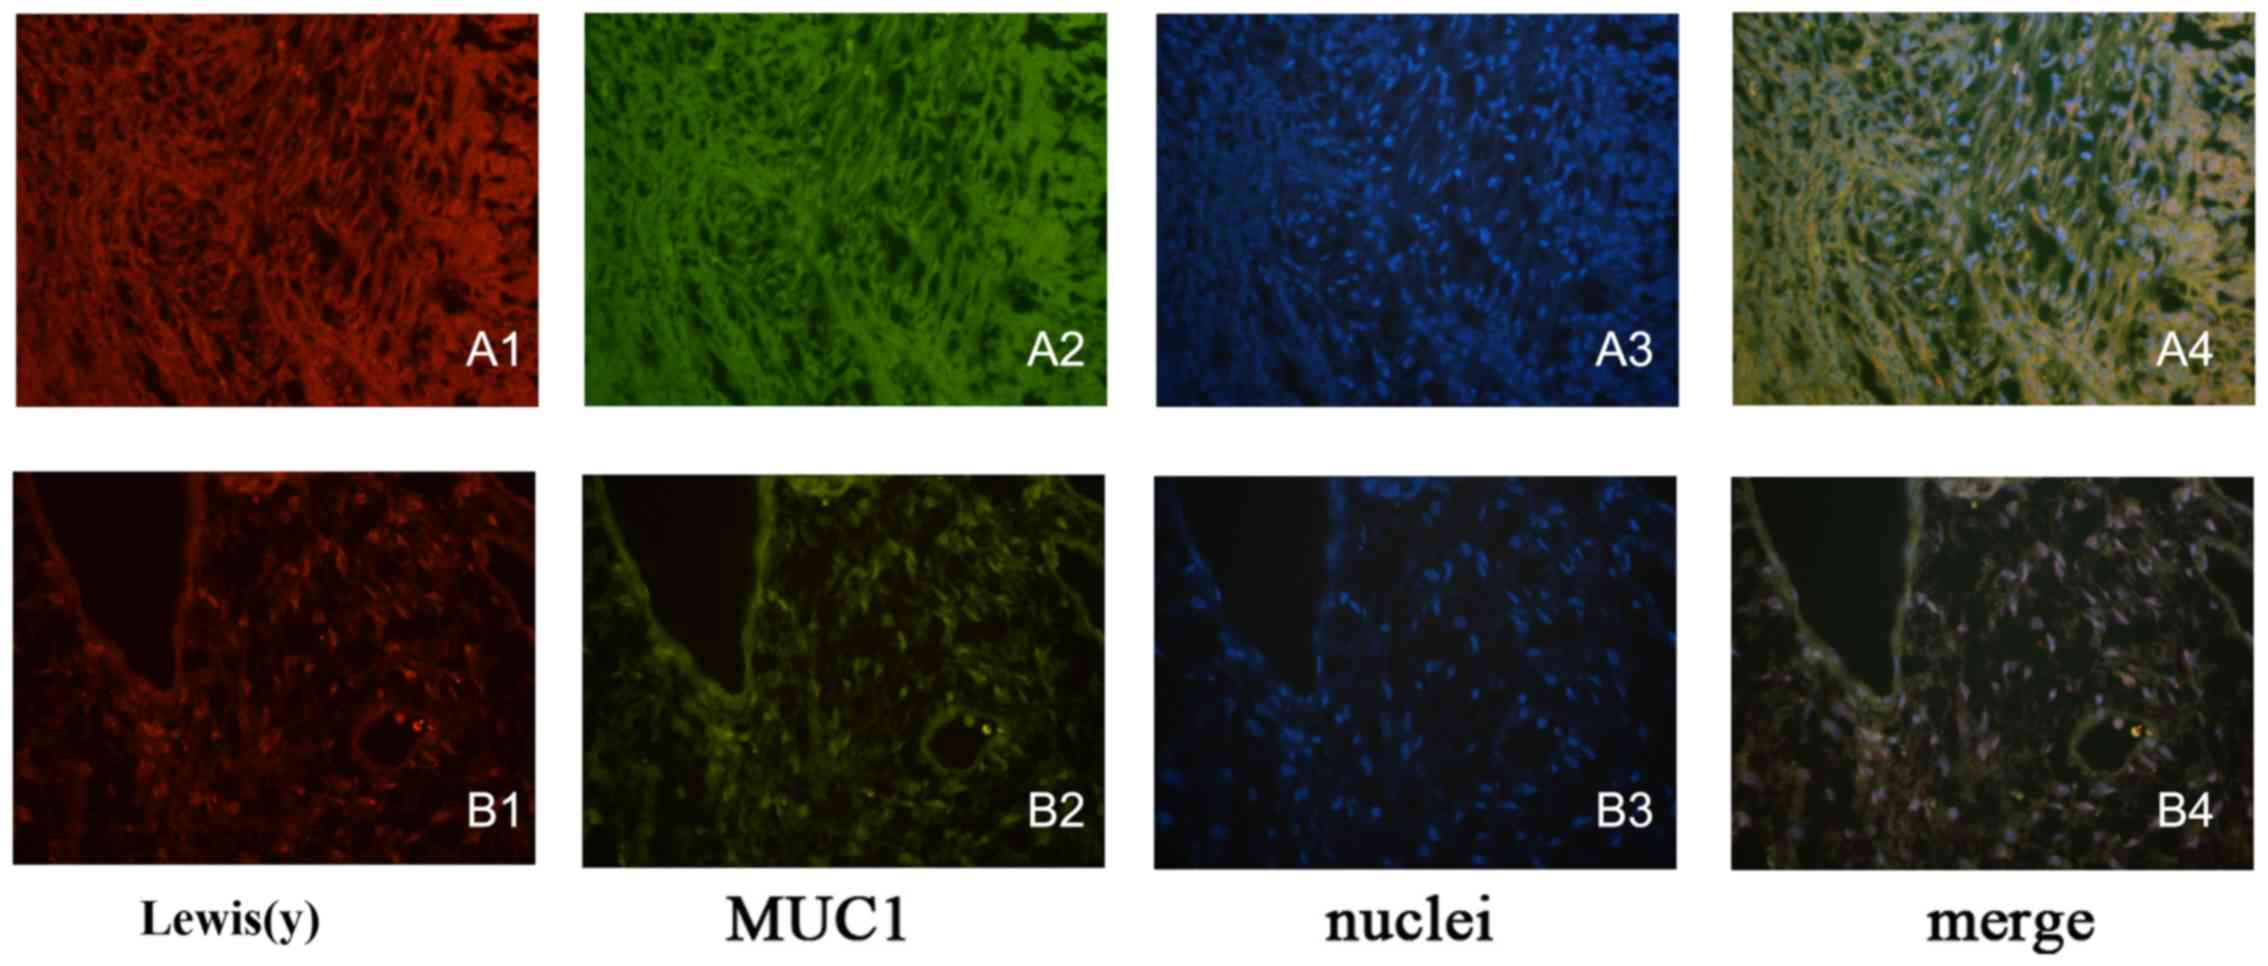
Co-localization of Lewis(y) and MUC1
protein in epithelial ovarian cancer tissues and cells
Double-labeling immunofluorescence experiments
revealed that red fluorescence-labeled Lewis(y) was localized in
the cell membrane, while green fluorescence-labeled MUC1 also
appeared in the cell membrane, but was observed to a limited extent
in the cytoplasm, and the blue fluorescence staining indicated the
nucleus after staining with DAPI. Images were obtained, and image
analysis software used to build up 3 fluorescence passages: yellow
fluorescence appeared in the positions where red and green
fluorescence overlapped simultaneously. Our findings clearly
illustrated that MUC1 and Lewis(y) antigen co-localized at the same
positions in ovarian cancer tissues and the RMG-I-H cell line
(Fig. 6).
Discussion
Cell surface receptors predominantly are populated
by glycoproteins, and the changes in the carbohydrate
chainsstructure can affect its expression and function (13). Some hallmarks of malignant tumor
cells, such as adhesion, migration and proliferation, are related
to changes in specific carbohydrate chains or residues (14). Fucose residue is a terminal
structure of glycan which is involved in the formation of
carbohydrate moieties of certain key growth factors, it also plays
an important role in mechanisms of tumor growth (15).
Lewis(y) antigen is a difucosylated oligosaccharide
antigen, and Lewis(y) expression has been shown to be significantly
increased during carcinogenisis, including ovarian cancer,
pancreatic cancer, prostate cancer, colon cancer and non-small cell
lung cancer (16–22). Lewis(y) can promote tumor
angiogenesis (23), inhibit cell
apoptosis, and can lead to enhanced cell proliferation and invasion
(24). In this study, we
confirmed that the Lewis(y) positive expression rate in ovarian
cancer tissues was significantly higher than that in borderline,
benign and normal groups. In addition, the expression intensity of
Lewis(y) increased as the malignancy grade increased. These results
indicate a positive correlation between the expression of Lewis(y)
antigen and the occurrence and development of ovarian cancer.
MUC1 is a type I transmembrane glycoprotein of high
molecular weight (>200 kDa). The carbohydrate chains account for
>50% of the molecular weight of MUC1, and play an important role
in determining the biochemical features and functionality of MUC1
(25). The abnormal expression of
MUC1 exists in a series of malignant tumors. First, the expression
levels of MUC1 in malignant tumors is markedly increased compared
with normal tissues. Second, MUC1 localization loses its polar
distribution, and is instead expressed on the entire cell surface.
Third, the structure of MUC1 is altered due to elevated
glycosyltransferase activity and abnormal glycosylation. More
importantly, MUC1 can protect the structure of the cell surface,
release active molecules and is involved in signal transduction,
immunomodulation, tumor invasion and metastasis (26,27). MUC1 expression has been found to
be higher in tumors with a poor prognosis, demonstrating that the
expression of MUC1 is closely associated with tumor development and
the prognosis of patients (28,29). Feng et al (30) reported that the expression of MUC1
was associated with the FIGO clinical stage and prognosis, and MUC1
expression and FIGO stage could be recognized as independent
prognostic indicators through multivariate analysis. In accordance
with previous reports, we found a weak positive expression of MUC1
in normal ovarian tissue. We also noted that the MUC1 expression
rate in malignant epithelial ovarian tumors was significantly
higher than that in borderline, benign and normal ovarian samples.
The expression intensity of MUC1 increased with the malignancy
level (P<0.05) and correlated with the FIGO stage (P<0.05).
Moreover, the analysis of staining intensity in ovarian cancer
tissues indicated that Lewis(y) linearly correlated with MUC1
(r=0.657, P<0.01). Furthermore, using the double-labeling
immunofluorescence method, we found that Lewis(y) and MUC1 were
located in the same position in ovarian cancer tissues.
Despite that Lewis(y) or MUC1 have been separately
reported to be overexpressed and promote cell invasion in various
types of human cancer, a direct correlation between Lewis(y) and
MUC1 has never been described. Most epithelial tumor cells
overexpress Lewis(y) antigen (2),
and this may result in the Lewis(y)-induced modification of
glycoprotein structures and functions on the cell surface (31). Some researchers have proven that
the oligosaccharide chains of MUC1 protein contain the structure of
Lewis(y) antigen. We thus speculated that the expression levels of
MUC1 and its ability to mediate cell growth and differentiation may
be related to Lewis(y) antigen on the cell surface. In this study,
we used a scatter plot of the MOD value to analyze the relevance of
MUC1 and Lewis(y) antigen expression in ovarian cancer and found a
linear correlation between the expression patterns of MUC1 and
Lewis(y) antigen. In our previous study, human α1,2-FT, a key
enzyme in the synthesis of Lewis(y), was transfected into the
ovarian cancer cell line, RMG-I, and the RMG-I-H cell line with a
stable and high expression of Lewis(y) was established. In this
study, using RT-qPCR, western blot analysis and
immunocytochemistry, we discovered that the gene and protein
expression levels of MUC1 in the α1,2-FT-transfected cells were
significantly upregulated compared with the cells that did not
overexpress α1,2-FT. Immunoprecipitation experiments revealed that
the ratio of Lewis(y) immunoprecipitated with MUC1 to total MUC1
increased 1.55-fold in the α1,2-FT-overexpressing cells. Exposure
to anti-Lewis(y) antibodies can block MUC1 upregulation. The
above-mentioned results indicated that the overexpression of
Lewis(y) resulted in the upregulation of MUC1. Some studies have
found that the abnormal glycosylation of MUC1 can weaken the
antitumor effect of DNA vaccine against MUC1 (32), and enhance the adhesion and
metastasis of tumor cells (33,34). In double-labeling
immunofluorescence experiments, our findings clearly illustrated
that MUC1 and Lewis(y) antigen co-localized at the same positions
in ovarian cancer tissues and the RMG-I-H cells. We thus speculated
the existence of an association between the upregulation of MUC1
expression and the changes in the carbohydrate chain structure of
cell surface receptors in the α1,2-FT-transfected cells. As a part
of exposed carbohydrate chains of MUC1, the increased content of
Lewis(y) can affect the three-dimensional structure of MUC1
protein, exposing more protein binding sites and tyrosine/serine
phosphorylation sites, leading to the elevated phosphorylation of
MUC1. As a result, downstream signal transduction pathways are
activated and growth signals accelerating gene transcription are
delivered to the nucleus, finally promoting the expression of
MUC1.
In conclusion, in this study, correlation and
co-expression were found between Lewis(y) antigen and MUC1 in
ovarian cancer tissues. Lewis(y) antigen and MUC1 are relevant to
the staging of ovarian cancer. Lewis(y) antigen was not only a
subdivision of MUC1, but also accelerated the gene transcription of
MUC1 in the endonucleus and then upregulated the expression level
of MUC1 proteins. Lewis(y) and MUC1 may be recognized as important
indicators of biological behaviors in ovarian cancer. Although the
specific mechanisms in this process still need to be elucidated,
our results provide new insight into the pathogenesis and
development, as well as the treatment of ovarian cancer.
Acknowledgments
This study was supported by the National Natural
Science Foundation of China (nos. 30872757, 81072118, 81172491 and
81101527); Ph.D. Programs Foundation of Ministry of Education of
China (nos. 20112104110016 and 20112104120019); Science Committee
Foundation of Shenyang City, China (no. F10-14-9-9-52); Shengjing
Free Researcher Project (no. 200807).
References
|
1
|
Goupille C, Hallouin F, Meflah K and Le
Pendu J: Increase of rat colon carcinoma cells tumorigenicity by
alpha(1-2)fucosyltransferase gene transfection. Glycobiology.
7:221–229. 1997. View Article : Google Scholar : PubMed/NCBI
|
|
2
|
Hellström I, Garrigues HJ, Garrigues U and
Hellström KE: Highly tumor-reactive, internalizing, mouse
monoclonal antibodies to Le(y)-related cell surface antigens.
Cancer Res. 50:2183–2190. 1990.PubMed/NCBI
|
|
3
|
Madjd Z, Parsons T, Watson NF, Spendlove
I, Ellis I and Durrant LG: High expression of Lewis y/b antigens is
associated with decreased survival in lymph node negative breast
carcinomas. Breast Cancer Res. 7:R780–R787. 2005. View Article : Google Scholar : PubMed/NCBI
|
|
4
|
Yang Z, Wu JH, Kuo HW, Kannagi R and Wu
AM: Expression of sialyl Lex, sialyl Lea, Lex and Ley glycotopes in
secreted human ovarian cyst glycoproteins. Biochimie. 91:423–433.
2009. View Article : Google Scholar
|
|
5
|
Rodríguez-Burford C, Barnes MN, Berry W,
Partridge EE and Grizzle WE: Immunohistochemical expression of
molecular markers in an avian model: A potential model for
preclinical evaluation of agents for ovarian cancer
chemoprevention. Gynecol Oncol. 81:373–379. 2001. View Article : Google Scholar : PubMed/NCBI
|
|
6
|
Lin B, Hao YY, Wang DD, Zhu LC, Zhang SL,
Saito M and Iwamori M: Transfection of alpha1, 2-fucosyltransferase
gene increases the antigenic expression of Lewis y in ovarian
cancer cell line RMG-I. Zhongguo Yi Xue Ke Xue Yuan Xue Bao.
30:284–289. 2008.In Chinese. PubMed/NCBI
|
|
7
|
Hao YY, Lin B, Zhao Y, Zhang YH, Li FF,
Diao B, Ou YL and Zhang SL: Alpha1,2-fucosyltransferase gene
transfection influences on biological behavior of ovarian
carcinoma-derived RMG-I cells. Fen Zi Xi Bao Sheng Wu Xue Bao.
41:435–442. 2008.In Chinese.
|
|
8
|
Yin L, Kharbanda S and Kufe D: Mucin 1
oncoprotein blocks hypoxia-inducible factor 1alpha activation in a
survival response to hypoxia. J Biol Chem. 282:257–266. 2007.
View Article : Google Scholar
|
|
9
|
Creaney J, Segal A, Sterrett G, Platten
MA, Baker E, Murch AR, Nowak AK, Robinson BW and Millward MJ:
Overexpression and altered glycosylation of MUC1 in malignant
mesothelioma. Br J Cancer. 98:1562–1569. 2008. View Article : Google Scholar : PubMed/NCBI
|
|
10
|
Premaratne P, Welén K, Damber JE, Hansson
GC and Bäckström M: O-glycosylation of MUC1 mucin in prostate
cancer and the effects of its expression on tumor growth in a
prostate cancer xenograft model. Tumour Biol. 32:203–213. 2011.
View Article : Google Scholar
|
|
11
|
Iwamori M, Tanaka K, Kubushiro K, Lin B,
Kiguchi K, Ishiwata I, Tsukazaki K and Nozawa S: Alterations in the
glycolipid composition and cellular properties of ovarian
carcinoma-derived RMG-1 cells on transfection of the
alpha1,2-fucosyltransferase gene. Cancer Sci. 96:26–30. 2005.
View Article : Google Scholar : PubMed/NCBI
|
|
12
|
Livak KJ and Schmittgen TD: Analysis of
relative gene expression data using real-time quantitative PCR and
the 2(-Delta Delta C(T)) Method. Methods. 25:402–408. 2001.
View Article : Google Scholar
|
|
13
|
Engelstaedter V, Fluegel B, Kunze S, Mayr
D, Friese K, Jeschke U and Bergauer F: Expression of the
carbohydrate tumour marker Sialyl Lewis A, Sialyl Lewis X, Lewis Y
and Thomsen-Friedenreich antigen in normal squamous epithelium of
the uterine cervix, cervical dysplasia and cervical cancer. Histol
Histopathol. 27:507–514. 2012.PubMed/NCBI
|
|
14
|
Kim YS, Hwang SY, Kang HY, Sohn H, Oh S,
Kim JY, Yoo JS, Kim YH, Kim CH, Jeon JH, et al: Functional
proteomics study reveals that N-Acetylglucosaminyltransferase V
reinforces the invasive/metastatic potential of colon cancer
through aberrant glycosylation on tissue inhibitor of
metalloproteinase-1. Mol Cell Proteomics. 7:1–14. 2008. View Article : Google Scholar
|
|
15
|
Mejías-Luque R, López-Ferrer A, Garrido M,
Fabra A and de Bolós C: Changes in the invasive and metastatic
capacities of HT-29/M3 cells induced by the expression of
fucosyltransferase 1. Cancer Sci. 98:1000–1005. 2007. View Article : Google Scholar : PubMed/NCBI
|
|
16
|
Chhieng DC, Rodriguez-Burford C, Talley
LI, Sviglin H, Stockard CR, Kleinberg MJ, Barnes MN, Partridge EE,
Khazaeli MB and Grizzle WE: Expression of CEA, Tag-72, and Lewis-Y
antigen in primary and metastatic lesions of ovarian carcinoma. Hum
Pathol. 34:1016–1021. 2003. View Article : Google Scholar : PubMed/NCBI
|
|
17
|
Kuemmel A, Single K, Bittinger F, Faldum
A, Schmidt LH, Sebastian M, Taube C, Buhl R and Wiewrodt R: The
prognostic impact of blood group-related antigen Lewis Y and the
ABH blood groups in resected non-small cell lung cancer. Tumour
Biol. 28:340–349. 2007. View Article : Google Scholar
|
|
18
|
Kobayashi H, Boelte KC and Lin PC:
Endothelial cell adhesion molecules and cancer progression. Curr
Med Chem. 14:377–386. 2007. View Article : Google Scholar : PubMed/NCBI
|
|
19
|
Li Q, Liu S, Lin B, Yan L, Wang Y, Wang C
and Zhang S: Expression and correlation of Lewis y antigen and
integrins α5 and β1 in ovarian serous and mucinous carcinoma. Int J
Gynecol Cancer. 20:1482–1489. 2010.PubMed/NCBI
|
|
20
|
Baldus SE, Hanisch FG, Pütz C, Flucke U,
Mönig SP, Schneider PM, Thiele J, Hölscher AH and Dienes HP:
Immunoreactivity of Lewis blood group and mucin peptide core
antigens: Correlations with grade of dysplasia and malignant
transformation in the colorectal adenoma-carcinoma sequence. Histol
Histopathol. 17:191–198. 2002.PubMed/NCBI
|
|
21
|
López-Ferrer A, de Bolós C, Barranco C,
Garrido M, Isern J, Carlstedt I, Reis CA, Torrado J and Real FX:
Role of fucosyltransferases in the association between apomucin and
Lewis antigen expression in normal and malignant gastric
epithelium. Gut. 47:349–356. 2000. View Article : Google Scholar : PubMed/NCBI
|
|
22
|
Kim YS, Yuan M, Itzkowitz SH, Sun QB,
Kaizu T, Palekar A, Trump BF and Hakomori S: Expression of LeY and
extended LeY blood group-related antigens in human malignant,
premalignant, and nonmalignant colonic tissues. Cancer Res.
46:5985–5992. 1986.PubMed/NCBI
|
|
23
|
Kuo CH, Chen PK, Chang BI, Sung MC, Shi
CS, Lee JS, Chang CF, Shi GY and Wu HL: The recombinant lectin-like
domain of thrombomodulin inhibits angiogenesis through inter-action
with Lewis Y antigen. Blood. 119:1302–1313. 2012. View Article : Google Scholar
|
|
24
|
Wang C, Yan L, Wang Y, Lin B, Liu S, Li Q,
Gao L, Zhang S and Iwamori M: Overexpression of Lewis(y) antigen
protects ovarian cancer RMG-1 cells from carboplatin-induced
apoptosis by the upregulation of Topo-I and Topo-II β. Anat Rec
(Hoboken). 294. pp. 961–969. 2011, View
Article : Google Scholar
|
|
25
|
Kawano T, Ahmad R, Nogi H, Agata N,
Anderson K and Kufe D: MUC1 oncoprotein promotes growth and
survival of human multiple myeloma cells. Int J Oncol. 33:153–159.
2008.PubMed/NCBI
|
|
26
|
Kufe DW: Functional targeting of the MUC1
oncogene in human cancers. Cancer Biol Ther. 8:1197–1203. 2009.
View Article : Google Scholar : PubMed/NCBI
|
|
27
|
Pająk J, Liszka L, Mrowiec S, Gołka D and
Lampe P: MUC1 immunoexpression is a virtually constant feature of
clear cell renal cell carcinoma metastatic to the pancreas. Adv
Anat Pathol. 19:125–127. 2012. View Article : Google Scholar
|
|
28
|
Khodarev NN, Pitroda SP, Beckett MA,
MacDermed DM, Huang L, Kufe DW and Weichselbaum RR: MUC1-induced
transcriptional programs associated with tumorigenesis predict
outcome in breast and lung cancer. Cancer Res. 69:2833–2837. 2009.
View Article : Google Scholar : PubMed/NCBI
|
|
29
|
Blixt O, Bueti D, Burford B, Allen D,
Julien S, Hollingsworth M, Gammerman A, Fentiman I,
Taylor-Papadimitriou J and Burchell JM: Autoantibodies to
aberrantly glycosylated MUC1 in early stage breast cancer are
associated with a better prognosis. Breast Cancer Res. 13:R252011.
View Article : Google Scholar : PubMed/NCBI
|
|
30
|
Feng H, Ghazizadeh M, Konishi H and Araki
T: Expression of MUC1 and MUC2 mucin gene products in human ovarian
carcinomas. Jpn J Clin Oncol. 32:525–529. 2002. View Article : Google Scholar
|
|
31
|
Li FF, Liu JJ, Liu DW, Lin B, Hao YY, Cong
JP, Zhu LC, Gao S, Zhang SL and Iwamori M: Lewis Y regulates
signaling molecules of the transforming growth factor β pathway in
ovarian carcinoma-derived RMG-I cells. Int J Oncol. 40:1196–1202.
2012.
|
|
32
|
Rong Y, Jin D, Wu W, Lou W, Wang D, Kuang
T, Ni X and Qin X: Induction of protective and therapeutic
anti-pancreatic cancer immunity using a reconstructed MUC1 DNA
vaccine. BMC Cancer. 9:1912009. View Article : Google Scholar : PubMed/NCBI
|
|
33
|
Zhao Q, Guo X, Nash GB, Stone PC, Hilkens
J, Rhodes JM and Yu LG: Circulating galectin-3 promotes metastasis
by modifying MUC1 localization on cancer cell surface. Cancer Res.
69:6799–6806. 2009. View Article : Google Scholar : PubMed/NCBI
|
|
34
|
Hattrup CL and Gendler SJ: Structure and
function of the cell surface (tethered) mucins. Annu Rev Physiol.
70:431–457. 2008. View Article : Google Scholar
|