Introduction
At present, acute myocardial infarction (AMI) is one
of the most life-threatening diseases worldwide (1). Therefore, the prompt diagnosis of
AMI is critical for rescuing cardiomyocytes and improving patient
survival. However, several deficiencies in the diagnosis of MI
remain. In the early-stage of AMI, most patients do not present
with typical signs, and 50% of the patients do not present with
specific electrocardiogram (ECG) changes (2). Currently, the most rapid and
effective estimation of MI is the detection of biochemical markers.
Cardiac troponin I (cTnI) and creatine kinase isoenzyme (CK-MB) are
the most widely used biomarkers in the clinic. Although the
sensitivity and specificity of these indices are acceptable, the
value in the diagnosis of AMI within 3 h remains limited (3-5).
Therefore, the identification of biomarkers that can reflect the
specificity of early MI within 3 h is under intensive focus.
The isobaric tags for relative and absolute
quantitation (ITRAQ) method is an efficient technique that examines
the biomarkers of various diseases developed by AB SCIEX (6). The technology uses four or eight
isotopic reagents labeled at the terminal end of the polypeptide
chain or side chain of lysine (7). According to the analysis of
high-resolution mass spectrometry, ITRAQ can compare eight samples
simultaneously. Although it has disadvantages, including
interference by coeluting peptides with close m/z, it is accurate
in quantitative analysis, possesses a low error rate, has high
efficiency and has a wide range of applications, among other
advantages (8). In recent years,
the technique has been commonly used in high-throughput screening
technology in quantitative proteomics.
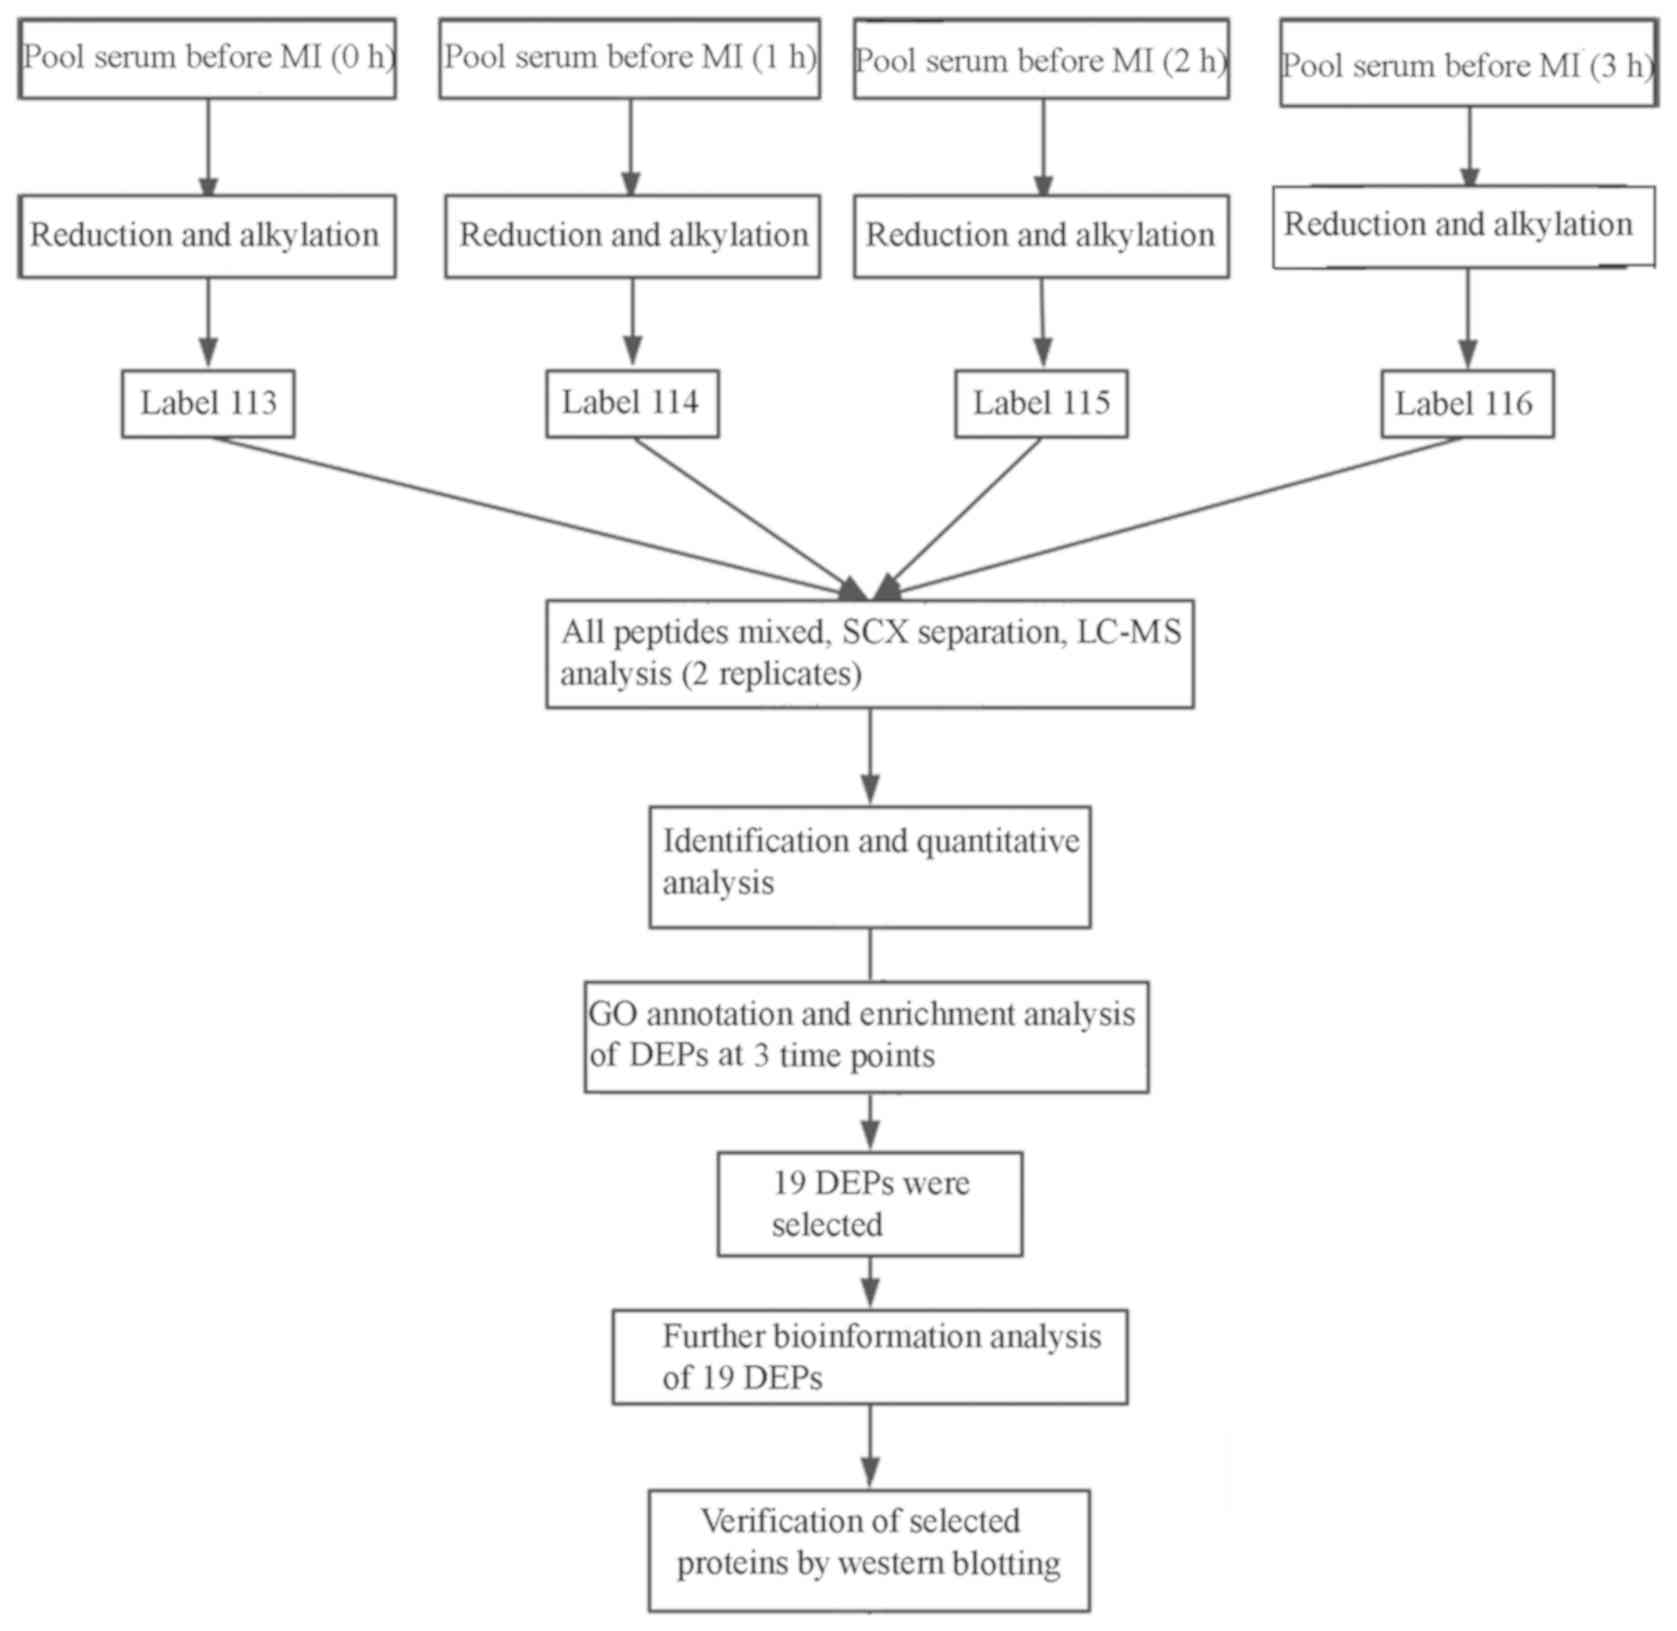
In the present study, ITRAQ technology combined with
mass spectrometry was used to investigate the MI model in beagle
dogs. The whole workflow of the study is shown in Fig. 1. The serum protein expression was
assessed prior to MI model establishment (0 h), and after 1, 2 and
3 h. The differentially expressed proteins (DEPs) were annotated,
and the protein-protein interaction (PPI) network was analyzed
bioinformatically. Western blot analysis was used to evaluate the
results obtained from ITRAQ, which may provide an in-depth
understanding of the pathophysiological process of MI, thereby
proposing a novel direction for the diagnosis of early MI.
Materials and methods
Beagle dogs and MI model
A total of 30 healthy beagle dogs (9 months old,
male:female ratio, 1:1) weighing 10-12 kg were purchased from
Shanghai Xingang Laboratory, Animal Farm (Shanghai, China). Ethics
approval was obtained prior to the start of the study. All animal
procedures were performed in accordance with the Animal Care
Committee of Zhejiang Hospital (Hangzhou, China). Beagle dogs were
housed in an environment of 16-28°C, relative humidity of 45-60%
with a 12-h light/dark cycle, fed rice every 12 h (2% body weight
each time) and were given free access to water. All dogs were
fasted for 12 h and water-deprived for 4 h prior to surgery. For
anesthesia, 3% pentobarbital sodium (30 mg/kg) was injected via the
left venae tibiales anteriores. When the dogs were asleep, touching
the eyelashes and the cornea without reaction confirmed that the
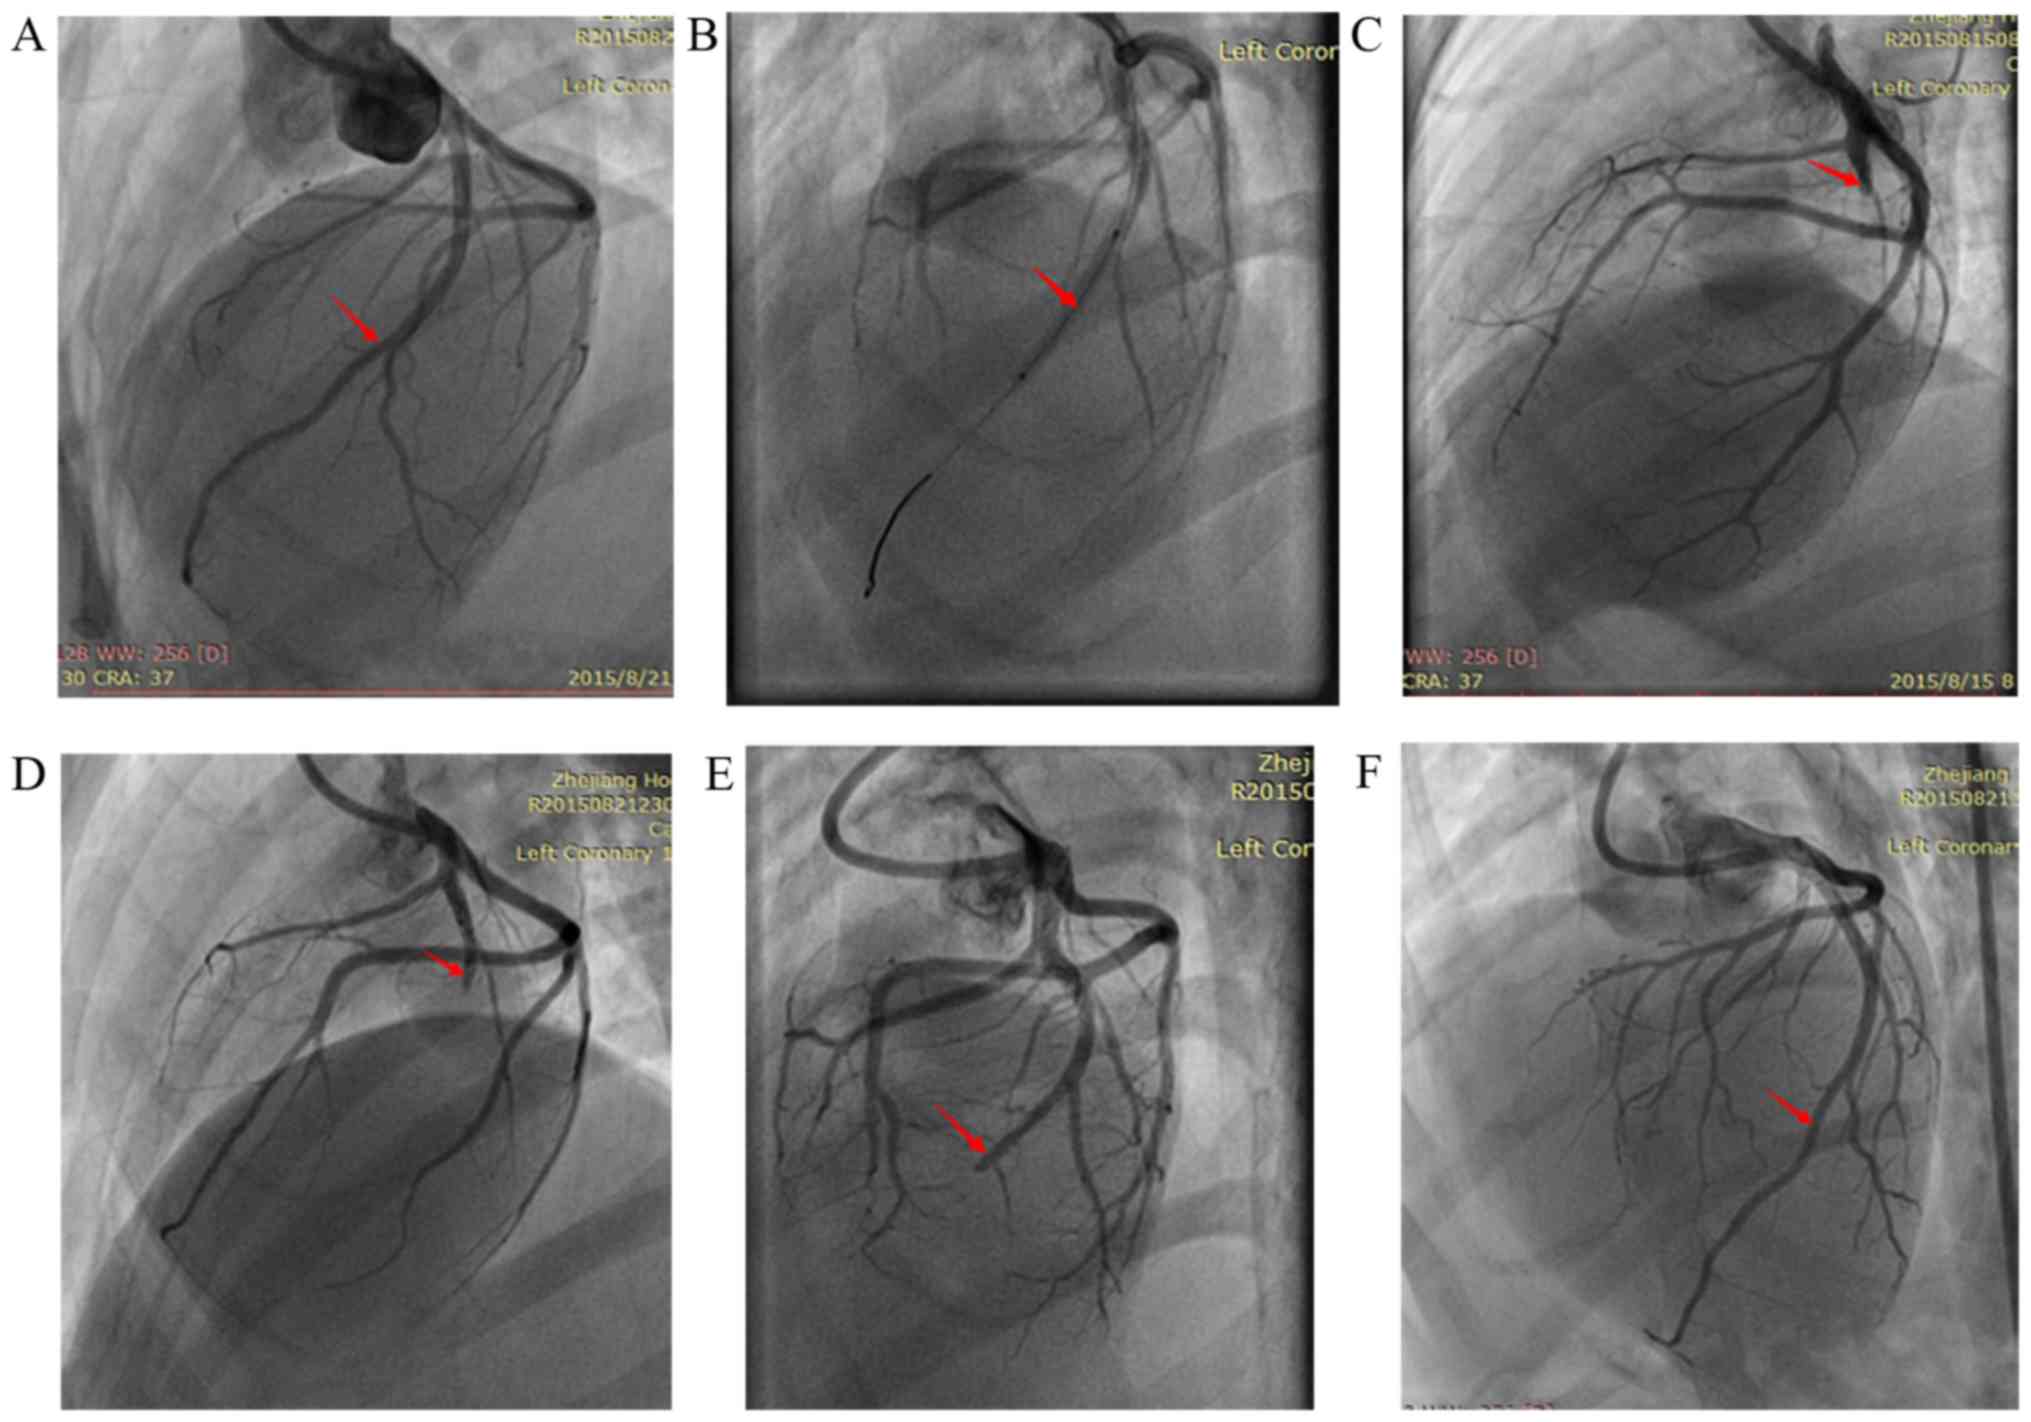
anesthesia was successful. The right femoral arteries of the
beagles were punctured for coronary angiography (Fig. 2A). First, the balloons were
inserted to the second diagonal branches, and then expanded every
30 sec for ischemic preconditioning (Fig. 2B). Subsequently, the balloons were
withdrawn and microcatheters were inserted to the second diagonal
branches. An equivalent of 2 ml of polyethylene microsphere
suspension was rapidly injected into the target vessel via
microcatheters, followed by the injection of 2 ml thrombin powder
formulation. After 5-10 min, the coronary angiography was repeated
to confirm the interruption of blood flow. Finally, the
microcatheters were withdrawn from the target vessel and the
surgery ended. The heart vessel angiograms were collected at 2, 3
and 6 h, and 3 days after MI (Fig.
2C-F). In cases in which a dog died, they were immediately
dissected to determine the cause of death. Following the injection
of 3% pentobarbital sodium (30 mg/kg) through the left venae
tibiales anteriores for anesthesia, all surviving dogs were
administered with 10% KCL (80 mg/kg) solution through the left
venae tibiales anteriores for sacrifice. The disappearance of blood
pressure and cardiac arrest were used for the confirmation of
animal death.
Serum protein sample preparation
A 20-ml volume of peripheral venous blood was
withdrawn into coagulation-promoting vacuum tubes (Zhejiang
Hospital) prior to MI model establishment (0 h) and at 1, 2 and 3 h
thereafter. The tubes were then rested for 30 min, following which
serum was obtained by centrifugation (15,00 g, 10 min, 4°C). The
serum protein solutions were concentrated by 10 kDa Vivaspin =500
(Sartorius AG, Göttingen, Germany). The protein concentration was
measured using the BCA Assay kit (Sigma; Merck KGaA, Darmstadt,
Germany). The compressed serum samples were stored at -80°C until
further analysis (9).
ITRAQ sample preparation
The ITRAQ reagent-8plex multiplex kit was purchased
from AB SCIEX (Washington, DC, USA). An equivalent of 30 μl
(100 mM) protein sample was mixed with dithiothreitol, and was
denatured in a boiling water bath for 5 min and cooled to room
temperature. The clarified supernatants were then transferred to 30
kDa ultrafiltration units. The filters were rinsed three times with
8 M urea followed by incubation with iodoacetamide for 30 min at
room temperature. Subsequently, three additional washes with 8 M
urea and three washes with dissolution buffer (AB SCIEX) were
performed.
All samples were digested with 40 μl trypsin
(4 μg trypsin in 40 μl dissolution buffer) at 37°C
overnight. Subsequently, the peptides were desalted with the C18
Cartridge (cat. no. 66872-U; Sigma; Merck KGaA), lyophilized, and
resolubilized in 40 μl dissolution buffer (10). The acquired peptides were then
labeled with the ITRAQ reagents as follows: 0 h group was labeled
with ITRAQ 113, 1 h group was labeled with ITRAQ 114, 2 h group was
labeled with ITRAQ 115, and 3 h group was labeled with ITRAQ 116.
All peptides were mixed for the subsequent step.
Strong cation exchange (SCX)
separation
The peptide mixture was diluted with the SCX buffer
A [10 mM KH2PO4 in 25% acetonitrile (ACN), pH
3.0]. Fractionation was performed using the AKTA Purifier 100 (GE
Healthcare Life Sciences, Little Chalfont, UK) equipped with a
polysulfoethyl column (4.6×100 mm, 5 μm, 200 A, PolyLC,
Inc., Columbia, MD, USA). The flow rate was 1 ml/min. The gradient
of the liquid phase was as follows: 0-22 min linear binary gradient
of SCX buffer B (10 mM KH2PO4 and 500 mM KCL
in 25% ACN, pH 3.0), 0-8%; 22-47 min the linear binary gradient of
SCX buffer B, 8-52%; 47-50 min of linear binary gradient of SCX
buffer B, 52-100%; 50-58 min of linear binary gradient of SCX
buffer B at 100%; 58-60 min of linear binary gradient of SCX buffer
B reset to 0%. The fractions were combined into 20 groups.
Liquid chromatographymass spectrometry
(LC-MS) analysis
All sample fractions were examined by
high-performance liquid chromatography using an Easy nLC system
(Thermo Fisher Scientific, Inc., Waltham, MA, USA). C18-A2
EASY-columns (10 cm, ID75 μm, 3 μm; Thermo Fisher
Scientific, Inc.) were used to separate the peptides. First, all
fractions were concentrated using a vacuum centrifuge concentrator
(Eppendorf Concentrator Plus, Eppendorf, Hamburg, Germany) and
solubilized buffer A (0.1% formic acid in water). The desalted
samples were loaded onto a nanoViper C18 column (100 μm × 2
cm, 3 μm, 100 A) by autosamplers (both Thermo Fisher
Scientific, Inc.) and fractionated in an EASY-column at a flow rate
of 300 nl/min.
The mobile phases consisted of 0.1% formic acid in
water (A) and 0.1% formic acid, 84% ACN in water (B) operated at
300 nl/min constant flow with a gradient profile over the course of
60 min, as follows (min:%B): 0:5, 50:35, 55:100, and 60:100.
Subsequently, the fractions were analyzed by
Q-Exactive (Thermo Fisher Scientific, Inc.), and the key parameters
of the first-class MS were as follows: Cation scanning; scan range,
300-1,800 m/z; resolution, 70,000 at 200 m/z; AGC target, 3e6;
first class maximum IT, 10 msec; one scan range; dynamic exclusion,
40.0 sec.
The mass-charge ratio of the polypeptide and
polypeptide fragments was as follows: Mode: MS2 scan; MS2
activation type: HCD; isolation window: 2 m/z.
The key parameters of MS/MS were as follows:
Resolution, 17,500 at 200 m/z; one microscan; second class MS
resolution, 60 msec; normalized collision energy, 30 eV.
Analysis of DEPs
The original data form was prepared in RAW. Mascot
2.2 (Matrix Science, Ltd., London, UK) and Proteome Discoverer 1.4
software (Thermo Fisher Scientific, Inc.) were used for peptide and
protein identification, and RAW files were converted to Mascot
Generic Format (MGF) files with preselected iTRAQ reporter ions.
The MGF files were searched against the
Uniprot_Canislupusfamiliaris_ 29014_ 20160822.fasta database
(http://www.uniprot.org) and the parameters were
as follows: Enzyme, trypsin; maximum missed cleavages, two; fixed
modifications, carbamidomethyl (C-terminal), ITRAQ 8 plex (N-term),
ITRAQ 8 plex (K); variable modification, oxidation (M), ITRAQ 8
plex (Y); peptide mass tolerance, ±20 ppm; fragment mass tolerance,
0.1 Da; database pattern, decoy; peptide false discovery rate
(FDR), ≤0.01.
Only proteins identified with confidence interval
values >95%, P<0.05 and expression ratio >1.2 or <0.83
were considered as DEPs.
Bioinformatics analysis
Functional annotation and enrichment analysis were
performed using Gene Ontology (GO) software online (http://www.geneontology.org). The significance of GO
terms was evaluated according to Fisher's exact test, and the
common GO terms satisfied P<0.05 in the three comparison groups.
All proteins in these common GO terms were defined as critical and
subjected to further analysis. A Venn diagram was produced using
Microsoft Office Excel 2007 (Microsoft Corporation, Redmond, WA,
USA). A heatmap was produced using Heatmap Illustrator 1.0.3.3
(http://hemi.biocuckoo.org/). The PPI
network including the key proteins was constructed using the online
STRING database (http://string-db.org/). GO and Kyoto Encyclopedia of
Genes and Genomes (KEGG) enrichment analyses were also performed
using STRING software, with those categories with FDR<0.05
listed.
Western blot analysis
In order to verify the ITRAQ results, three DEPs,
fibrinogen γ chain (FGG), ATP synthase F1 subunit β (ATP5B) and
integrator complex subunit 4 (INTS4), were selected for further
analysis by western blotting. Equivalent quantities of serum
protein sample (3 μl) were initially electrophoresed on 5%
stacking SDS-PAGE for 40 min under 60 V, then electrophoresed on
10% separating SDS-PAGE for 80 min under 80 V (cat. no. 161-0156;
Bio-Rad Laboratories, Inc., Hercules, CA, USA) and transferred onto
polyvinylidene fluoride membranes for 80 min under 80 V (cat. no.
IPVH00010; EMD Millipore, Billerica, MA, USA). Subsequently, the
membranes were blocked in 5% skim milk Tris-buffered saline
containing Tween-20 (TBST; Thermo Fisher Scientific, Inc.) at room
temperature for 1 h. The membranes were then washed with TBST three
times and probed with the following primary antibodies at 4°C
overnight: Rabbit anti-transferrin receptor 1 (TFRC) 1 antibody,
(1:1,000; cat. no. LS-C186620-100; LifeSpan BioSciences, Inc.,
Seattle, WA, USA), rabbit anti-INTS4 antibody, (1:1,000; cat.
no.ab182329), rabbit anti-FGG antibody (1:200; cat. no. ab62527),
rabbit anti-ATP5B antibody (1:1,000; cat. no. ab128743; all Abcam,
Cambridge, MA, USA). This was followed by incubation with
horseradish peroxidase-labeled secondary antibodies (goat
anti-rabbit IgG secondary antibodies; 1:5,000; cat. no. 31210;
Thermo Fisher Scientific, Inc.) at room temperature for 1 h.
Finally, the membranes were washed five times with TBST and
visualized using an ECL DualVue WB Marker (cat. no. RPN810; GE
Healthcare Life Sciences). The densities of the immunoreactive
bands were quantified on an X-ray film (Huadong Medicine Co., Ltd.,
Hangzhou, China) (11).
Statistics analysis
The ITRAQ data were analyzed in Perseus software
(http://www.coxdocs.org/doku.php?id=perseus:start#cite)
(12), other data were analyzed
in SPSS software for Windows, version 19.0 (IBM Corp., Armonk, NY,
USA). One way analysis of variance (ANOVA) was used to evaluate the
statistical significance among multiple groups during the
validation step; the differences between different time points were
analyzed using the Least Significant Difference test. Prior to one
way ANOVA, the normality was confirmed using the Shapiro-Wilk test
(P>0.05), and the homogeneity of variances using the F test
(P>0.05). P<0.05 was considered to indicate a statistically
significant difference.
Results
Coronary angiography images of beagle
dogs
All beagle dogs underwent left coronary angiography
successfully. Four beagle dogs presented with ventricular
fibrillation during surgery, three died, and one survived following
defibrillation and anti-arrhythmia therapy. Seven beagle dogs died
within 24 h after surgery and a total of nine died within the 2
weeks following surgery. Following postoperative death, the beagle
dogs were dissected, and bilateral lung congestion was detected.
Heart failure was considered to be the major factor associated with
the mortality of these dogs (image not shown).
Coronary angiography at 2 h post-embolization
suggested full closure of the proximal left coronary artery
(Fig. 2C). At 6 h
post-embolization, coronary angiography suggested that the blood
flow in the proximal left coronary artery was restored (Fig. 2E). At 3 days post-embolization,
coronary angiography suggested recanalization of the left anterior
descending (LAD) artery (Fig.
2F).
DEPs at different time points
In order to minimize the experimental error
generated during the experiment, the LC-MS analysis was repeated
twice. The results of the first analysis revealed 562 proteins,
whereas 554 proteins were detected in the second. Among these, 462
common proteins were identified in the two identifications. In
addition, the mass accuracy of all identified peptides was checked,
and it was found that only ~1% (42/4,542) of the peptides had a
molecular weight deviation >10 ppm, which indicates a high mass
accuracy in the study. Proteins with confidence interval values
>95% and P<0.05 were identified and considered as DEPs
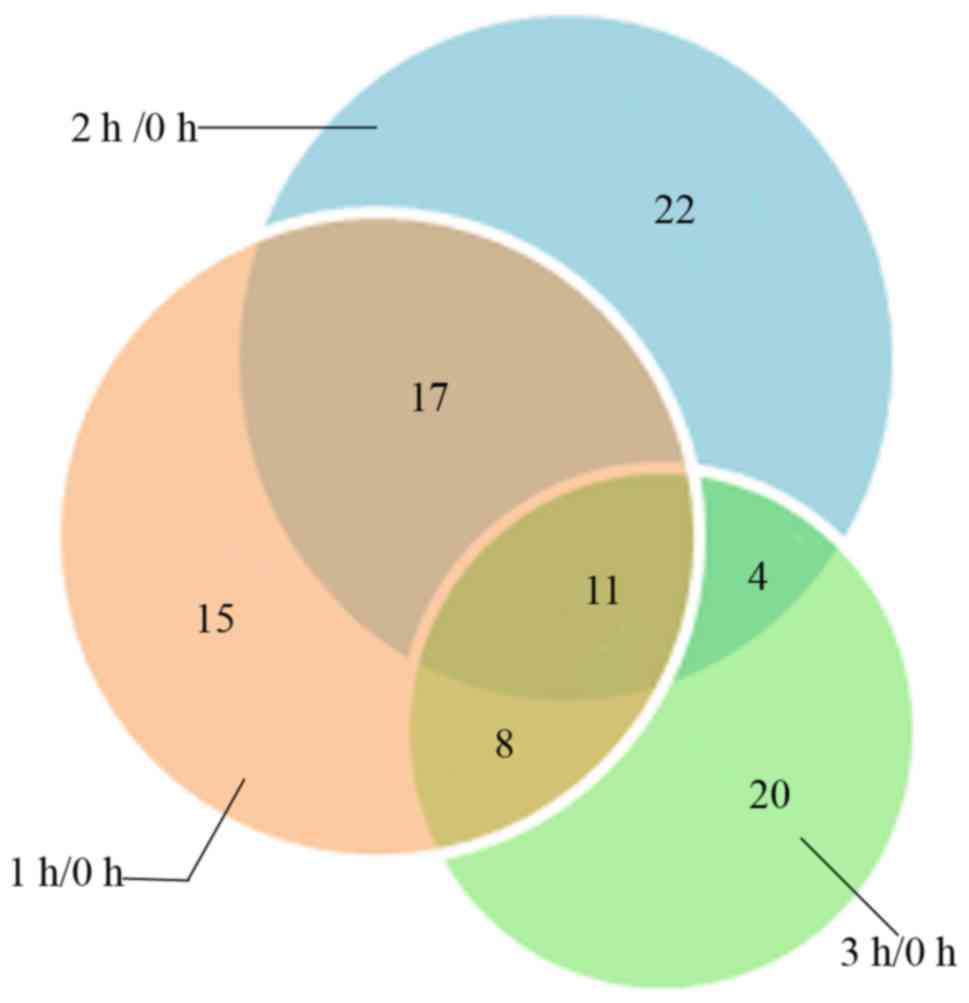
(Table SI). The number of DEPs
was 51 at 1 h post-MI compared with that at 0 h, including 28
upregulated and 23 downregulated proteins. The number of DEPs was
54 at 2 h post-MI compared with that at 0 h, including 28
upregulated and 26 downregulated proteins. The number of DEPs was
43 at 3 h post-MI compared with that at 0 h, including 24
upregulated and 19 downregulated proteins. A Venn diagram was
produced to clarify the association of DEPs among the three time
points (Fig. 3).
Biological function analysis of DEPs
The GO annotation analysis determined the biological
functions of the DEPs pre- and post-MI based on three aspects:
Biological process, molecular function and cellular component.
In the 1 h/0 h comparison (Table SII), 39 proteins were found to be
related to biological process; these were primarily involved in a
single-organism process (28 proteins, 72%), cellular process (26
proteins, 67%), metabolic process (19 proteins, 49%) and biological
regulation (13 proteins, 33%). The 43 proteins found to be related
to molecular function were mainly involved in binding (31 proteins,
72%) and catalytic activity (12 proteins, 28%), and the 41 proteins
related to cellular component were mainly distributed in the cell
(30 proteins, 72%) and organelle (20 proteins, 47%).
In the 2 h/0 h comparison (Table SIII), 43 proteins were related to
the biological process; these were mainly involved in the
single-organism process (32 proteins, 74%), cellular process (30
proteins, 74%), biological regulation (20 proteins, 47%) and
metabolic process (17 proteins, 40%). The 46 proteins related to
molecular function were primarily involved in binding (37 proteins,
80%) and catalytic activity (15 proteins, 46%), similar to the 1
h/0 h comparison. The 43 proteins related to the cellular component
were distributed in the cell (30 proteins, 70%) and organelle (21
proteins, 49%). In addition, the cell membranes also had a specific
number of DEPs (13 proteins, 30%).
In the 3 h/0 h comparison (Table SIV), 34 proteins were related to
the biological process, and primarily involved in the metabolic
process (20 proteins, 59%), cellular process (20 proteins, 59%),
single-organism process (18 proteins, 53%) and biological
regulation (12 proteins, 35%). A total of 36 proteins were related
to molecular function, and similar to the 1 h/0 h comparison, were
primarily involved in binding (24 proteins, 67%), catalytic
activity (16 proteins, 44%) and binding to organic cyclic compounds
(12 proteins, 34%). The 32 proteins related to the cellular
component were distributed in the cell (20 proteins, 63%) and
organelle (14 proteins, 44%). In addition, similar to the 2 h/0 h
comparison, the cell membranes had a specific number of DEPs (seven
proteins, 22%).
In order to compare the importance of different GO
terms pre- and post-MI, GO enrichment analysis was performed
(Table SV). According to the
enrichment analysis, a total of 10 common GO terms were found in
the three comparisons as follows: Oxygen transport, gas transport,
hemoglobin complex, oxygen binding, heme binding, tetrapyrrole
binding, protein complex, iron ion binding, cytosolic part, and
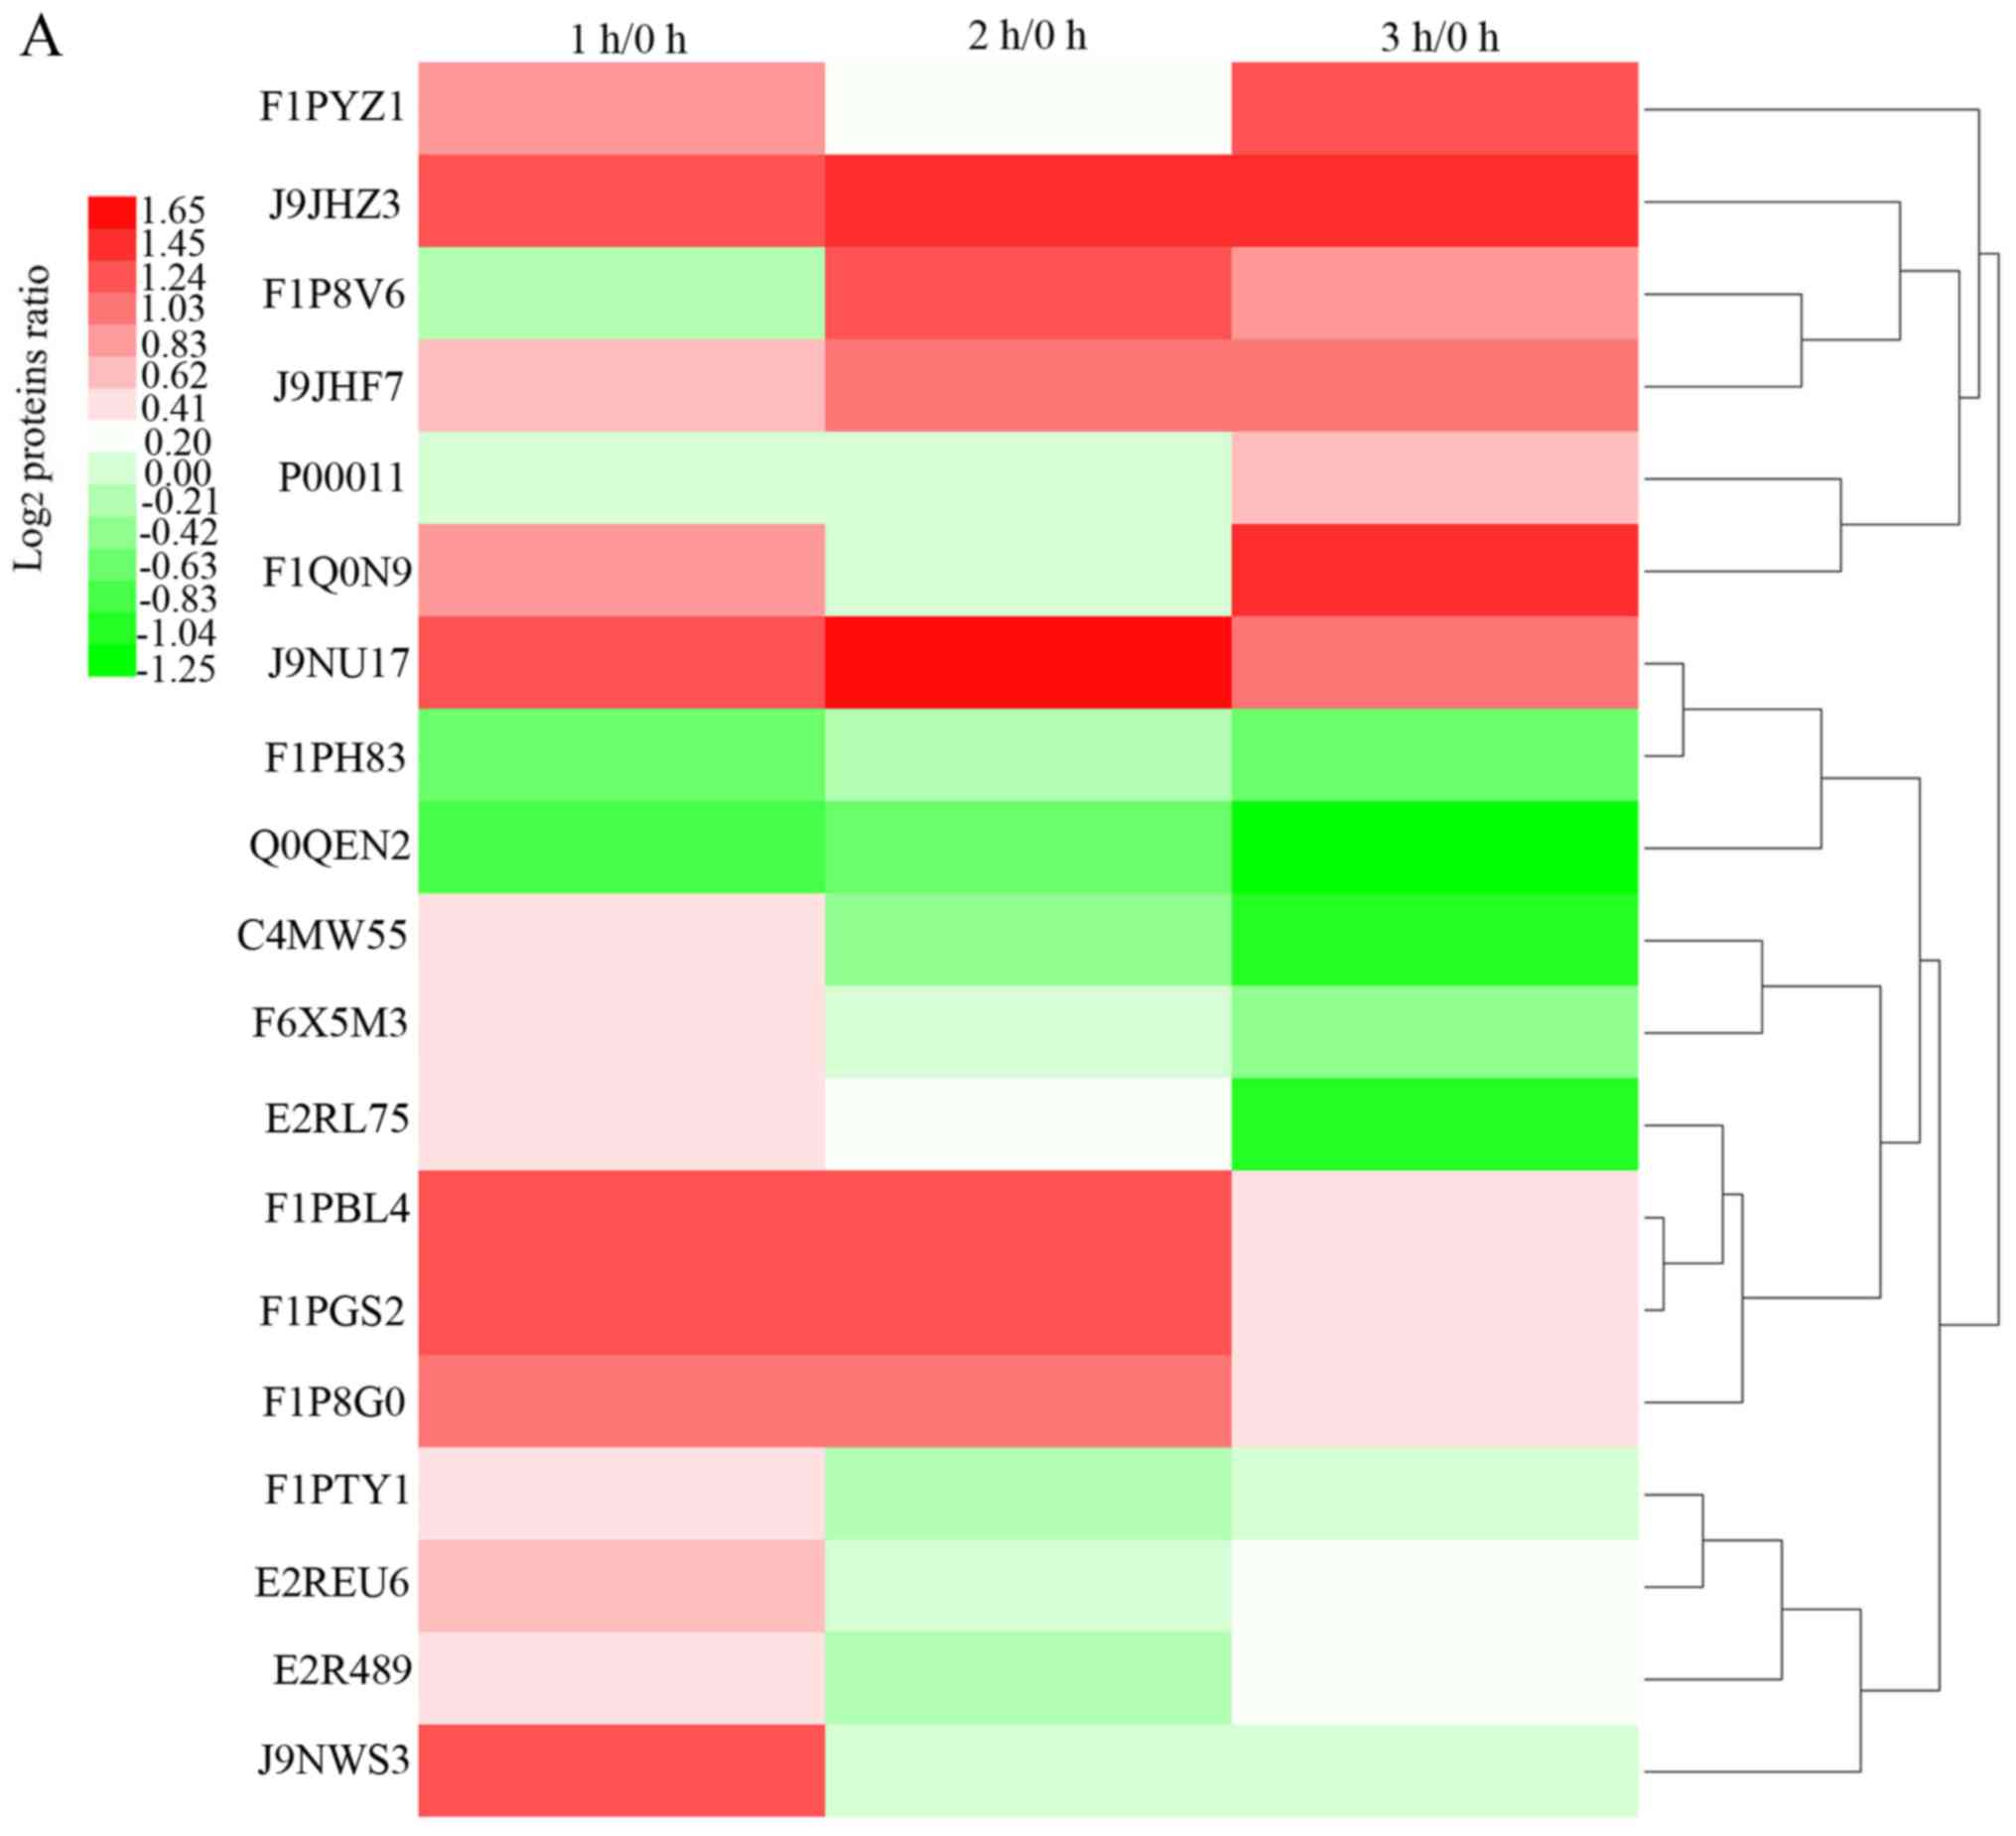
macromolecular. A total of 19 DEPs were selected from the 10 GO
terms and considered to be key proteins (Table I). Hierarchical clustering
analysis was used to analyze the expression of these 19 key
proteins at three different time points. The results are shown in a
heatmap (Fig. 4A). The data used
for the heatmap was the average of two repetitions. Each line in
the heatmap represents a protein with the mean upregulation (red)
or downregulation (green) in expression within the three time
points, no change in expression is indicated in white.
 | Table IBasic information of differentially
expressed proteins. |
Table I
Basic information of differentially
expressed proteins.
| Accession no. | Gene symbol | 1 h/0 h | 2 h/0 h | 3 h/0 h | Significant time
point (P<0.05) |
|---|
| J9JHF7 | LOC100855540 | 1.6132 | 2.33704 | 2.3493 | 1 h, 2 h, 3 h |
|
(ENSCAFG00000032615) | | | | |
| F1PYZ1 | LOC485255(HBD) | 2.0078 | 1.14914 | 2.6074 | 1 h, 2 h |
| J9JHZ3 | LOC476825 | 1.4238 | 1.51391 | 1.45468 | 1 h, 2 h |
| F1P8V6 | Mb | 0.8774 | 2.54093 | 1.8720 | 2 h, 3 h |
| P00011 | CYCS | 1.0814 | 1.05109 | 1.5515 | 3 h |
| J9NU17 | MYO1A | 2.5885 | 3.6345 | 2.1319 | 1 h, 2 h, 3 h |
| C4MW55 | COX2 | 1.4277 | 0.84775 | 0.5386 | 1 h, 3 h |
| F1PTY1 | KRT1 | 1.4629 | 0.90146 | 1.0768 | 1 h |
| E2RL75 | INTS4 | 1.3284 | 1.2349 | 0.5016 | 1 h, 3 h |
| E2REU6 | KRT18 | 1.6622 | 1.06858 | 1.2304 | 1 h |
| F1Q0N9 | KRT19 | 1.8121 | 1.13388 | 2.9467 | 1 h, 3 h |
| F1PH83 | COG7 | 0.7355 | 0.91037 | 0.6618 | 1 h |
| F6X5M3 | CLTB | 1.3703 | 1.1251 | 0.8135 | 1 h |
| E2R489 | KRT84 | 1.4417 | 0.95866 | 1.1761 | 1 h |
| J9NWS3 | KRT9 | 2.4965 | 1.04879 | 1.0036 | 1 h |
| Q0QEN2 | ATP5B | 0.5946 | 0.72595 | 0.4211 | 1 h, 2 h, 3 h |
| F1P8G0 | FGG | 2.0490 | 2.24377 | 1.3447 | 1 h, 2 h |
| F1PBL4 | FGA | 2.6063 | 2.67755 | 1.3737 | 1 h, 2 h |
| F1PGS2 | FGB | 2.4915 | 2.55351 | 1.3501 | 1 h, 2 h |
The hierarchical clustering analysis roughly divided
the 19 proteins into four main patterns (Fig. 4B). Proteins that increased between
0 and 1 h post-MI were in pattern 1, including F1PTY1 [keratin
(KRT)1], E2REU6 (KRT18), E2R489 (KRT84) and J9NWS3 (KRT9). KRT is
the main protein that constitutes the epidermis and fur hair
follicles (13); however, there
appears to be no evidence on the association between keratin and
AMI in the existing literature. In pattern 2, proteins were
significantly increased within 2 h post-AMI, but showed a downward
trend between 2 and 3 h, including F1PBL4 [FGA], F1PGS2 (FGB) and
F1P8G0 (FGG). FG is involved in the coagulation and platelet
activation pathway, and is important in the thrombus formation.
Several studies have reported on the association between FG and AMI
(14,15). In pattern 3, proteins decreased
significantly in the third hour, including E2RL75 (INTS4), F1PH83
[component of oligomeric golgi complex 7 (COG7)], Q0QEN2 (ATP5B),
C4MW55 [cytochrome c oxidase subunit 2 (COX2)] and F6X5M3
[clathrin light chain B (CLTB)]. A number of the proteins,
including ATP5B and COX2, are involved in the composition of the
electron transport chain (16).
COG-7, a subunit of the conserved oligomeric Golgi complex, is
involved in the further processing of intracellular synthetic
proteins (17), whereas CLTB is
important in the transport of small molecules, including
neurotransmitters and membrane proteins, in the human body
(18). The decline in the
expression of these proteins indicates that disorder of energy
metabolism may be an important factor in the early stages of AMI.
In pattern 4, proteins increased significantly in the third hour,
including F1PYZ1 (LOC485255), J9JHZ3 (LOC476825), F1P8V6 [myoglobin
(Mb)], J9JHF7 (LOC100855540), P00011 [cytochrome c (CYCS)],
F1Q0N9 (KRT19) and J9NU17 [myosin IA (MYO1A)]. LOC100855540,
LOC4852 55 and LOC476825 are corresponding gene symbols of
hemoglobin subunit α-like, hemoglobin subunit ε-2 and hemoglobin
subunit β of beagle dogs. They are considered to serve important
roles in the utilization of blood oxygen, however, no relevant
reports on these proteins in AMI are present in the literature.
MYO1A is involved in myokinesis (19), whereas CYCS is the electron
transport body in the process of biological oxidation (20). Although the proteins in this
pattern are involved in different biological processes, no common
features of the proteins in pattern 4 have been identified at
present.
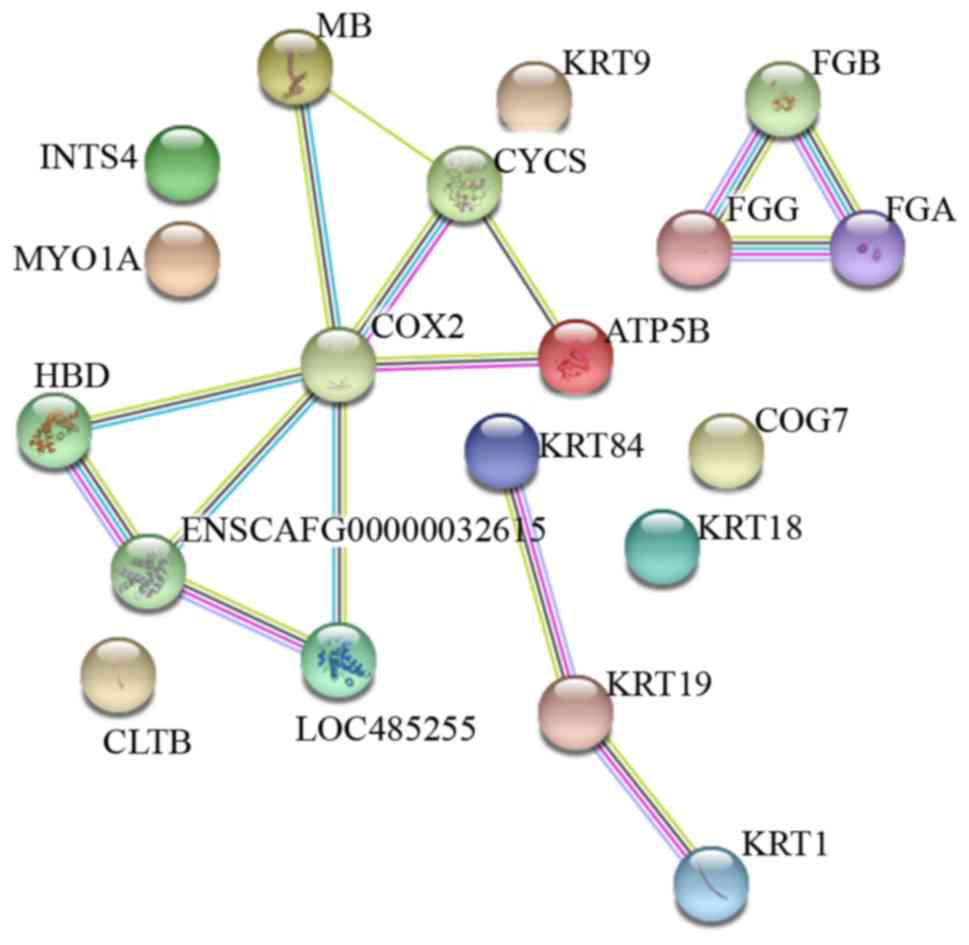
Further bioinformatics analyses of 19
selected DEPs
To further understand the potential mechanism
underlying these DEPs, a PPI regulatory network was analyzed using
STRING software. The PPI evidence-view was used, in which the line
color indicates the type of interaction evidence. The network
contained 19 nodes and 15 edges with an average node degree of 1.58
and local clustering coefficient of 0.558; the expected number of
edges was one (Fig. 5). The PPI
enrichment p-value was 4.11E-13 (<0.01), this means that there
are more interactions amongst the proteins than expected for a
random set of proteins of a similar size, drawn from the genome.
Such an enrichment p-value indicates that the proteins are at least
partially biologically connected, as a group. The PPI network
revealed that the interactions between the 19 DEPs were
interconnected and effectuated as a group.
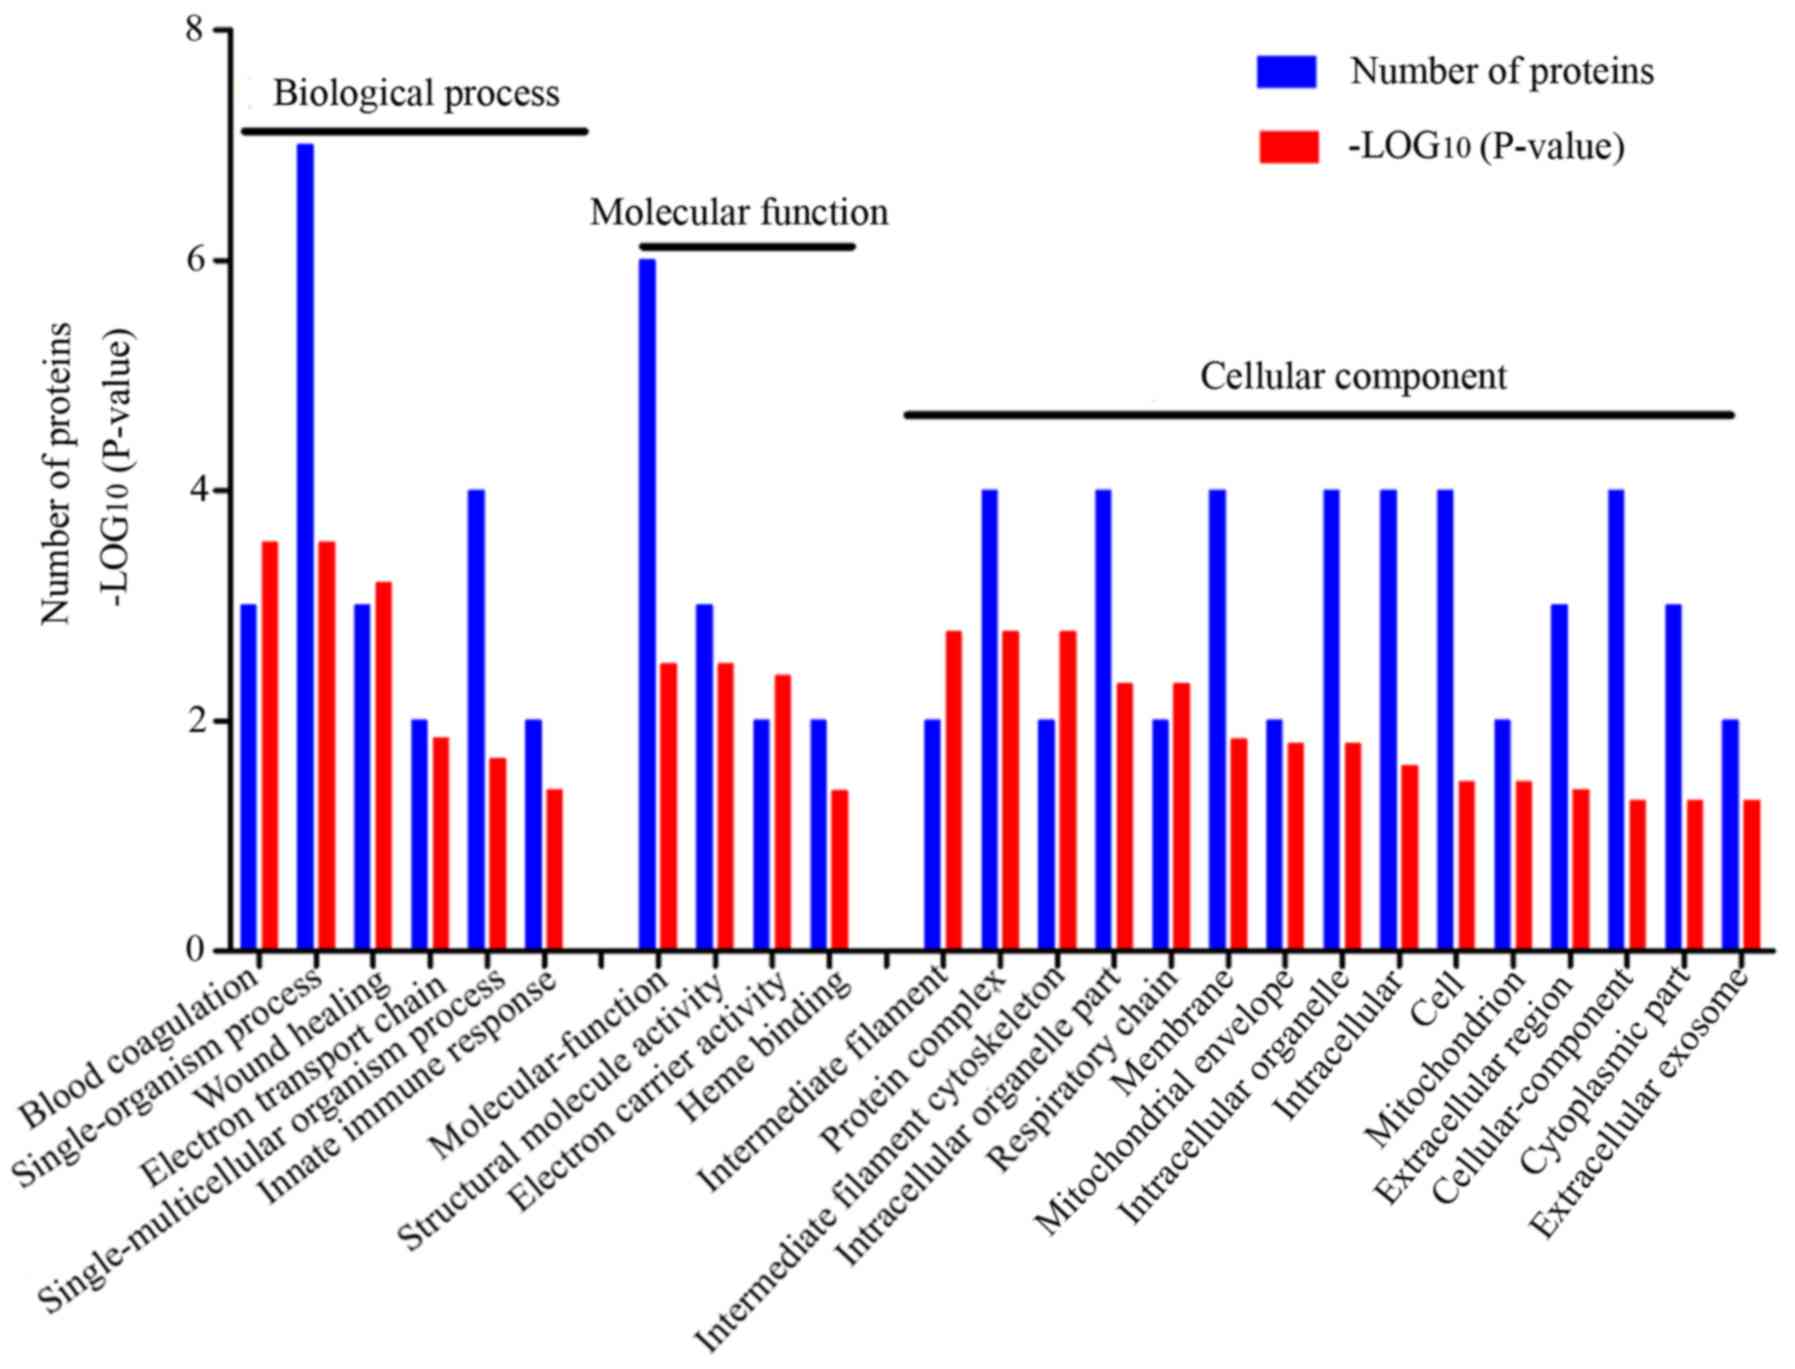
The functional enrichment analysis revealed that the
19 selected DEPs were involved in several significant GO terms
(Fig. 6). In the biological
process category, there were six GO terms, including blood
coagulation (GO:0007596, three proteins), single-organism process
(GO:0044699, seven proteins), wound healing (GO:0042060, three
proteins), electron transport chain (GO:0022900, two proteins),
single-multicellular organism process (GO:0044707, four proteins)
and innate immune response (GO:0045087, two proteins). In the
molecular function category, four GO terms included molecule
function (GO:0003674, six proteins), structural molecule activity
(GO:0005198, three proteins), electron carrier activity
(GO:0009055, two proteins) and heme binding (GO:0020037, two
proteins). The cellular component category comprised 15 GO terms
that mainly included intermediate filament (GO:0005882, two
proteins), protein complex (GO:0043234, four proteins),
intermediate filament cytoskeleton (GO:0045111, two proteins),
intracellular organelle part (GO:0044446, four proteins),
respiratory chain (GO:0070469, two proteins), membrane (GO:0016020,
four proteins), mitochondrial envelope (GO:0005740, two proteins).
These molecular functions were closely related to electron
transport and energy metabolism, which suggested that the energy
metabolism disorder of cardiomyocytes is the initial
pathophysiological feature of AMI. In addition, certain proteins
were distributed in the intermediate filament, which serves a major
role in the transfer of intracellular substances and maintains the
stability of cell morphology.
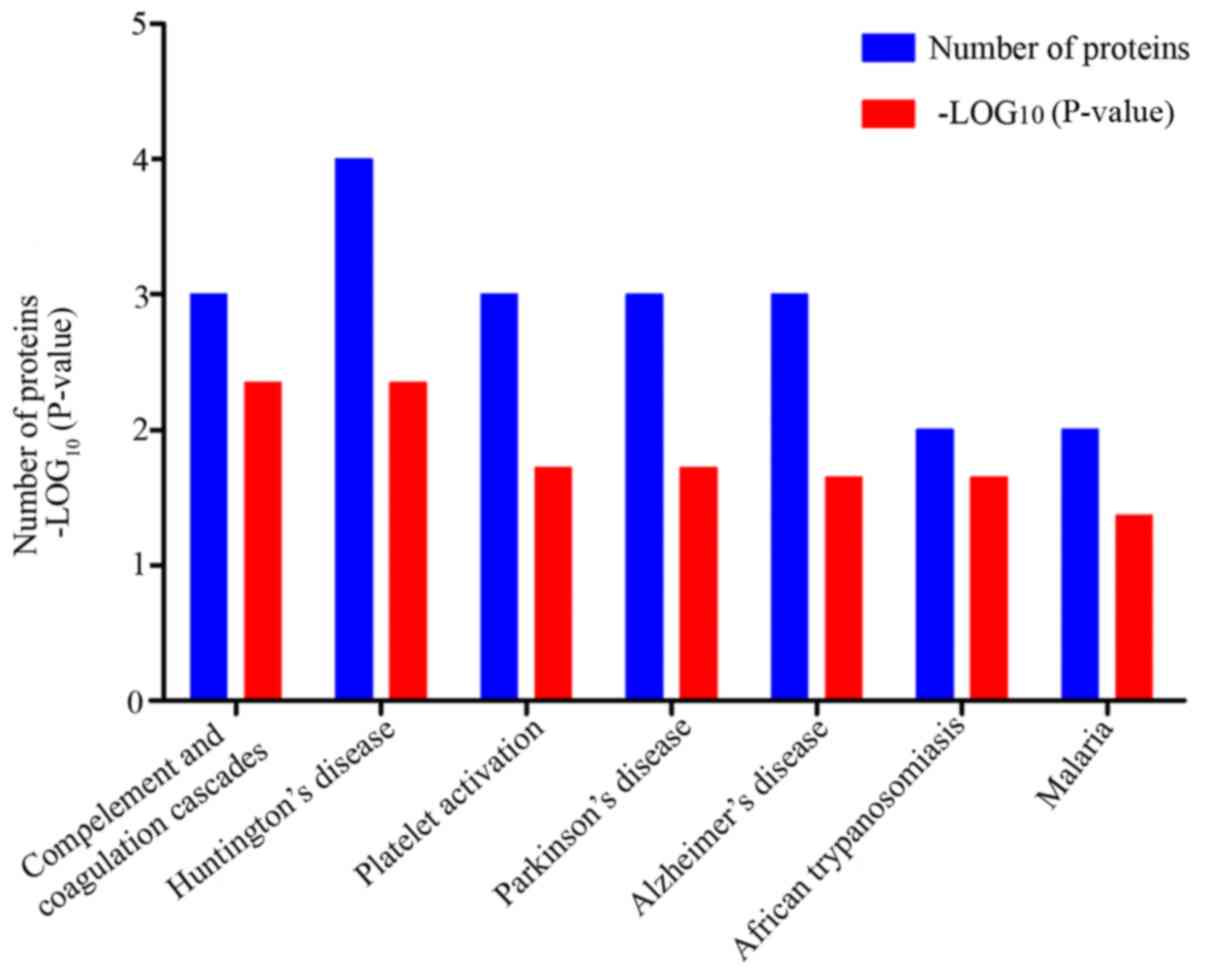
KEGG enrichment analysis was performed using the
STRING database (Fig. 7). A total
of seven pathways were considered significant. Biological functions
related to these proteins were obtained from the KEGG enrichment
analysis in Fig. 7. The
complement and coagulation cascades pathway consisted of three
proteins, FGA, FGB and FGG, and the composition of the platelet
activation pathway was consistent with the complement and
coagulation cascades pathway. These pathways suggested that
platelet activation and coagulation disorders may be triggers of
AMI, and related content has been confirmed in several studies
(21,22). Huntington's disease, Parkinson's
disease and Alzheimer's disease are common chronic progressive
neurodegenerative disorders, however, there are few reports
detailing the association between these three diseases and AMI.
ATP5B, CYCS and COX2 are involved in the formation of these
pathways; in addition, these proteins are involved in the electron
transport chain (23-25). In the process of oxidative stress,
the production of oxygen free radicals causes corresponding changes
in the expression of these proteins, eventually affecting the
metabolism of energy (26).
African trypanosomiasis and malaria are parasitic diseases, and
reports on the associations between the two disorders and MI are
also lacking. The proteins that make up these two pathways were
found to be identical (HBD and ENSCAFG-00000032615); it was
hypothesized that this may be associated with the destruction of
red blood cells caused by oxygen free radicals. Unfortunately,
there is currently no relevant literature to confirm this. The link
between these pathways and AMI remains to be fully elucidated and
necessitates further investigation.
Validation analysis by western blot
analysis
The validation of the candidate biomarkers was
critical. As mentioned above, according to the heatmap and PPI
network, all proteins were roughly divided into four groups. The
first group included FGA, FGB and FGG, which are monomers that make
up fibrinogen. In the ITRAQ results, the expression of the three
proteins within 3 h was similar (Table I). This appears to illustrate the
similarity of the three proteins, and FGG was selected for further
verification. The second group included ATP5B, COX2 and CYCS, which
are mainly involved in the electron transport chain and energy
generation. Although COX2 was at the core of the cluster, it was
not possible to obtain the corresponding beagles' primary
antibody.
According the results of ITRAQ [1 h/0 h: 0.59; 2 h/0
h: 0.73, 3 h/0 h: 0.42] (Table
I), the expression of ATP5B decreased at all three time points.
It was anticipated that the protein used for verification is
ideally detected sooner (within 1 h) and stabilizes for a period of
time (at least 3 h). ATP5B fully met the requirements and was
selected for further verification. The third group included KRT1,
KRT19 and KRT84; there are no data suggesting a link between KRT1,
KRT19, KRT84 and MI, therefore, none of these proteins were
selected for further verification. There were also other proteins
that are not involved in the composition of the network. These
scattered proteins were classified into one group and INTS4 was
selected for further verification, as the corresponding beagle
primary antibody was obtained and the expression of INTS4 altered
significantly within 1 h. Based on the above results, INTS4, FGG
and ATP5B were selected for further validation according to western
blot analysis. These proteins were selected as the association
between them and MI had not been established so far. In addition,
the corresponding beagle antibody was available to purchase. They
cover a considerable proportion of the important biological
processes that the 19 key proteins involved in. In addition, the
expression of TFRC 1 was relatively stable according the ITRAQ
results, as the internal reference of the experiment. Serum samples
from 10 beagle dogs were collected and interesting results were
obtained from the images. As shown in Fig. 8, with the expression of TFRC 1 at
0 h as '1', the expression of TFRC did not alter significantly at
the three points [1 h/0 h: 0.95±0.12 (P>0.05); 2 h/0 h:
1.03±0.10 (P>0.05), 3 h/0 h: 1.05±0.10 (P>0.05), Fig. 8A and B]. The results of the
western blotting were basically consistent with the ITRAQ results
[1 h/0 h: 1.11±0.15 (P>0.05); 2 h/0 h: 1.12±0.11 (P>0.05), 3
h/0 h: 1.10±0.12 (P>0.05); Table
SI]. There were no statistically significant differences
between the 2 h/0 h and 1 h/0 h groups, 2 h/0 h and 3 h/0 h groups,
or 1 h/0 h and 3 h/0 h groups (P>0.05). With the expression of
ATP5B/TFRC at 0 h as '1', the expression of ATP5B decreased
significantly at all three time points [1 h/0 h: 0.58±0.06
(P<0.01); 2 h/0 h: 0.56±0.09 (P<0.01), 3 h/0 h: 0.35±0.08
(P<0.01), Fig. 8C]. With the
exception of marginal differences in drop trends, this was
consistent with the ITRAQ results [1 h/0 h: 0.59±0.10 (P<0.01);
2 h/0 h: 0.73±0.14 (P<0.05), 3 h/0 h: 0.42±0.06 (P<0.01)].
There was no statistically significant difference between 1h/0h and
2 h/0 h (P>0.05), however, the expression of ATP5B decreased
significantly at 3 h/0 h compared with that at 2 h/0 h and 1 h/0 h
(P<0.05). With the expression of FGG/TFRC at 0 h as '1', it was
increased at 2 h and 3 h [1 h/0 h: 1.07±0.21 (P>0.05); 2 h/0 h:
1.72±0.21 (P<0.01), 3 h/0 h: 1.51±0.18 (p<0.01), Fig. 8D]. Although the expression of FGG
was elevated at all three time points, it differed from the results
of ITRAQ [1 h/0 h: 2.05±0.34 (P<0.01); 2 h/0 h: 2.24±0.42
(P<0.01); 3 h/0 h: 1.34±0.31 (P>0.05)]. With the expression
of INTS4/TFRC at 0 h as '1', it was increased at all three time
points [1 h/0 h: 2.12±0.41 (P<0.01); 2 h/0 h: 1.99±0.35
(P<0.01), 3 h/0 h: 2.20±0.25 (P<0.01), Fig. 8E] and differed from the ITRAQ
results [1 h/0 h: 1.33±0.21 (P<0.05); 2 h/0 h: 1.23±0.17
(P>0.05), 3 h/ 0h: 0.50±0.11 (P<0.05)]. There were no
statistically significant differences between the 2 h/0 h and 1 h/0
h groups, 2 h/0 h and 3 h/0 h groups, or 1 h/0 h and 3 h/0 h groups
(P>0.05). Although the results from the western blotting did not
completely coincide with those of ITRAQ, ATP5B may serve as a
biomarker of MI within 3 h.
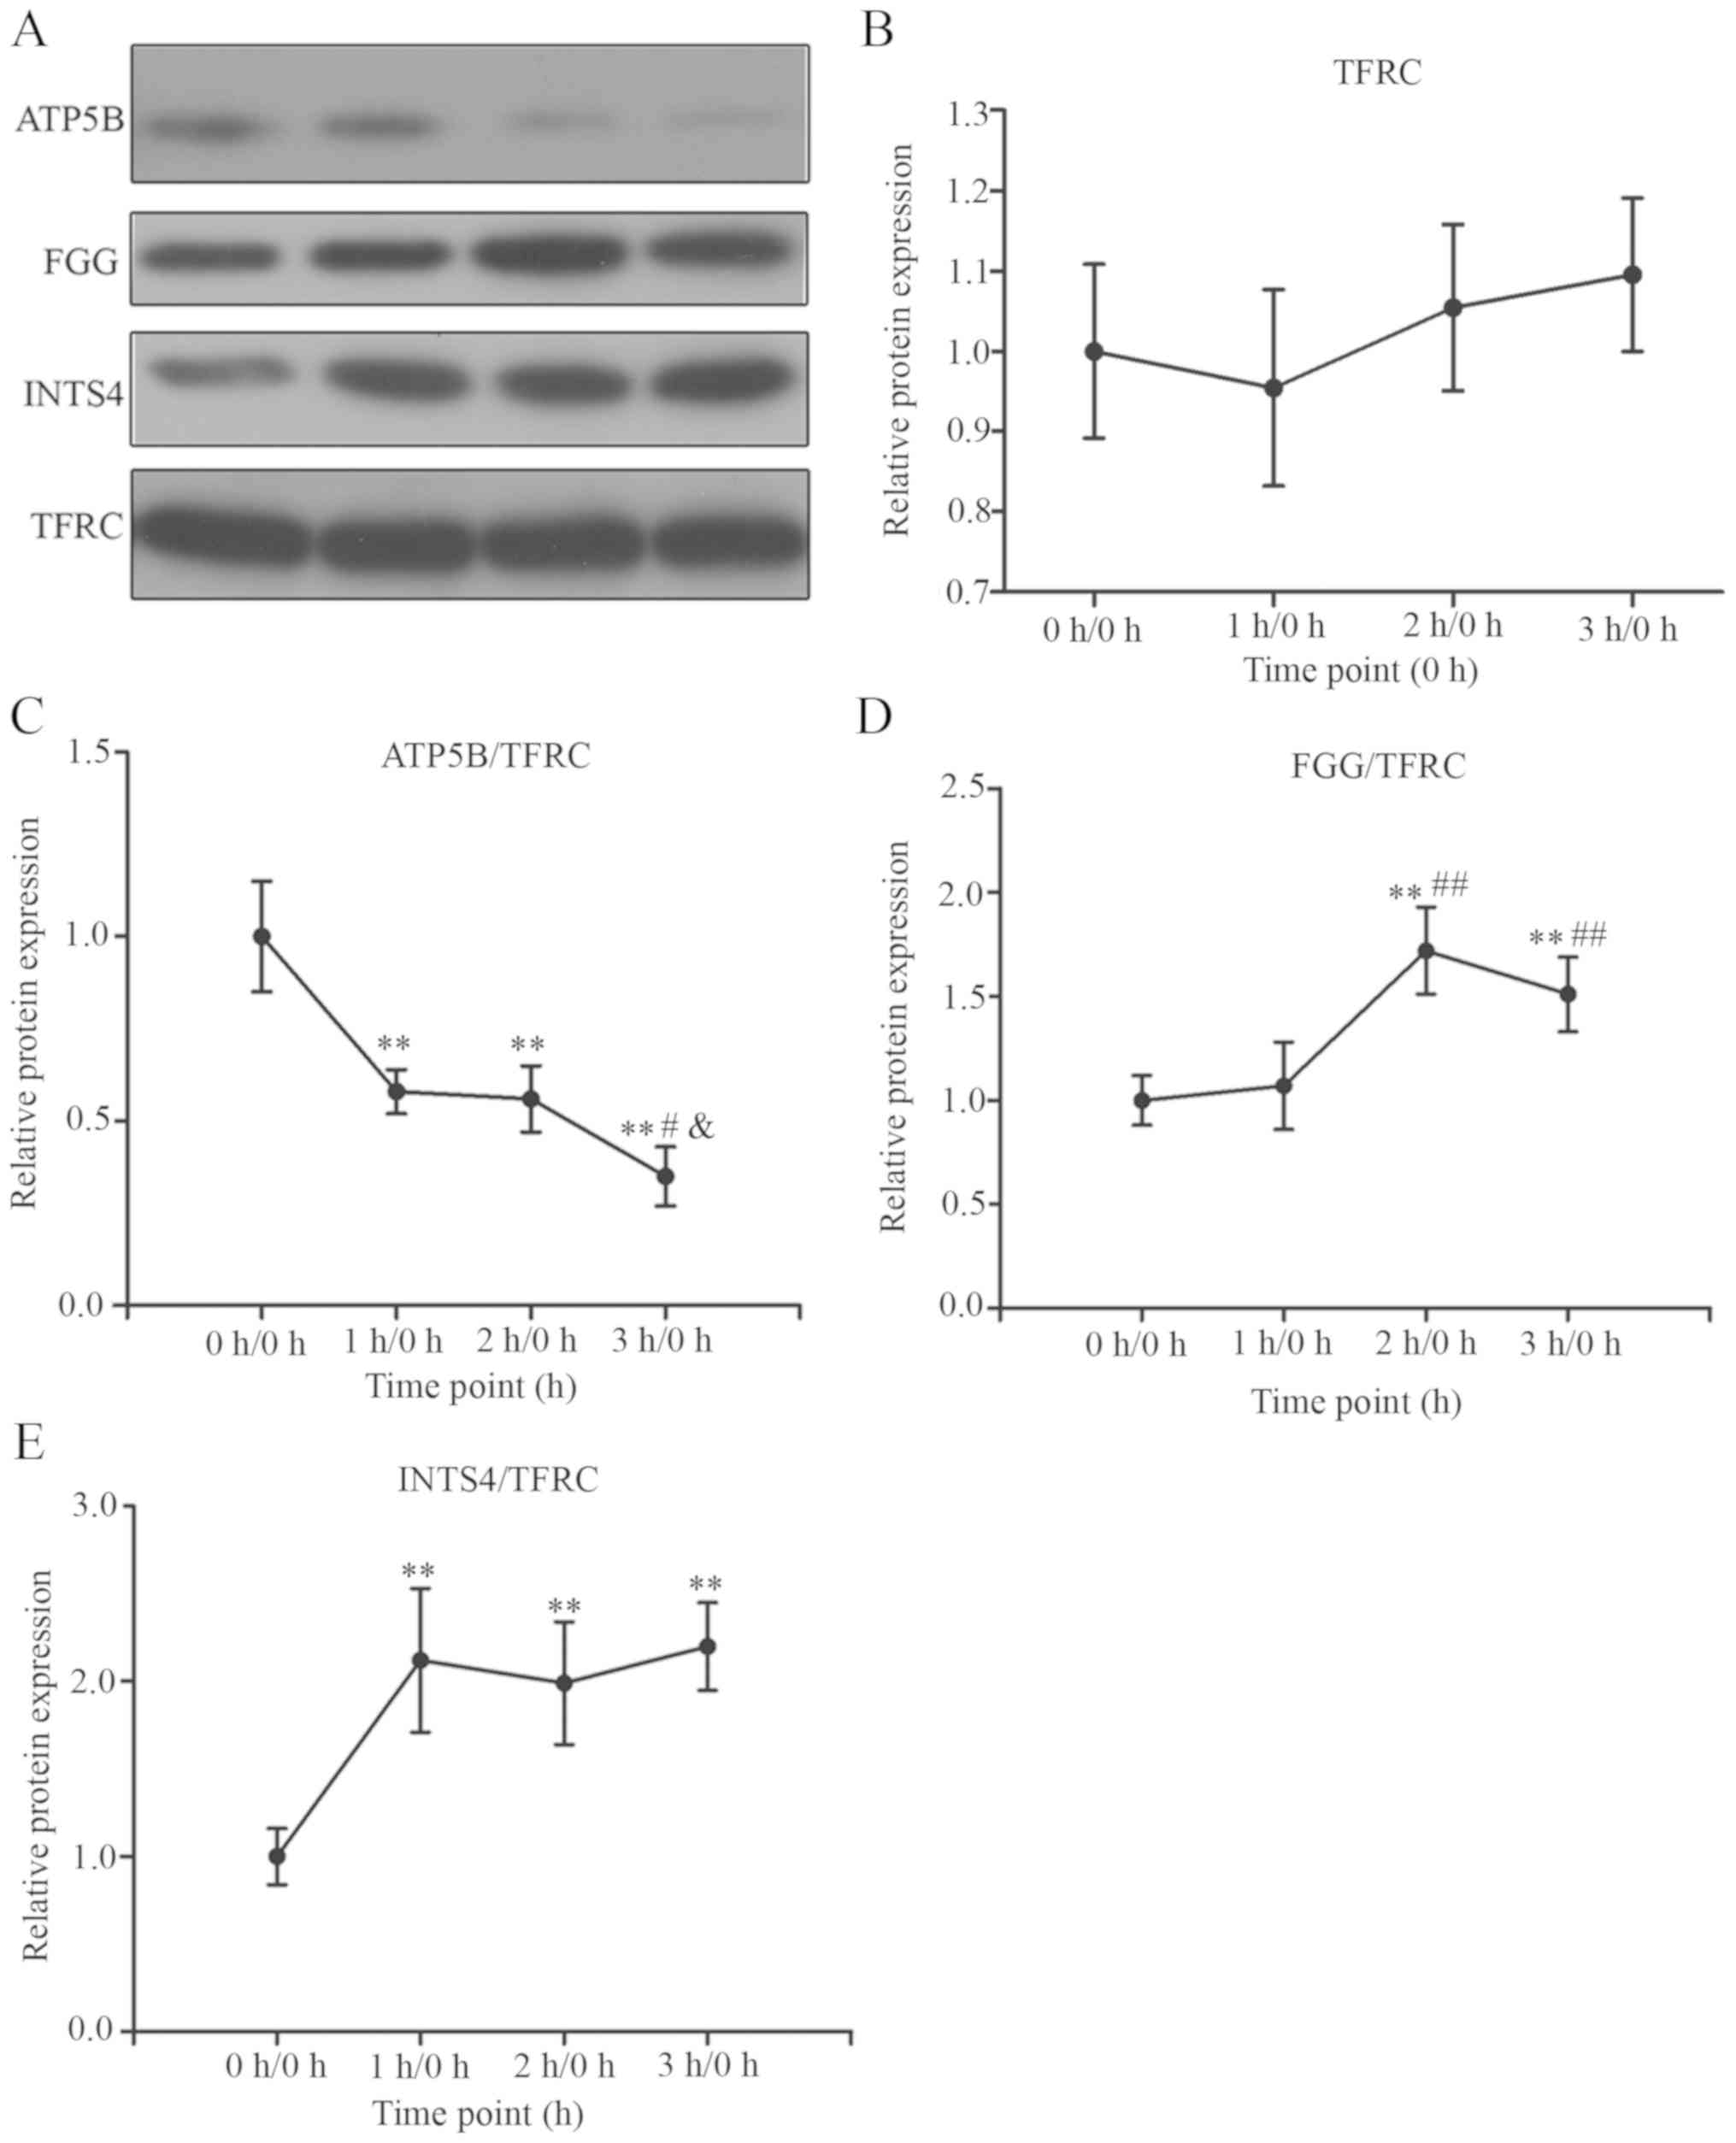 | Figure 8Validation of the expression of TFRC,
INTS4, FGG and ATP5B by western blot analysis. The serum levels of
TFRC, INTS4, ATP5B and FGG were determined by western blot analysis
prior to MI model establishment (0 h) and following MI model
establishment at 1, 2 and 3 h (mean ± standard error of the mean,
n=10). P-values of multiple groups was calculated using one-way
analysis of variance, and pairwise comparison within was performed
using the Least Significant Difference test. (A) Representative
bands of different proteins at different time points. (B) Relative
expression of TFRC at the three time points, 1 h/0 h: 0.95±0.12
(P>0.05); 2 h/0 h: 1.03±0.10 (P>0.05), 3 h/0 h: 1.05±0.10
(P>0.05). (C) Relative expression of ATP5B at the three time
points, 1 h/0 h: 0.58±0.06 (P<0.01); 2 h/0 h: 0.56±0.09
(P<0.01), 3 h/0 h: 0.35±0.08 (P<0.01). (D) Relative
expression of FGG at the three time points, 1 h/0 h: 1.07±0.21
(P>0.05); 2 h/0 h: 1.72±0.21 (P<0.01), 3 h/0 h: 1.51±0.18
(P<0.01). (E) Relative expression of INTS4 at the three time
points, 1 h/0 h: 2.12±0.41 (P<0.01); 2 h/0 h: 1.99±0.35
(P<0.01), 3 h/0 h: 2.20±0.25 (P<0.01).
**P<0.01, vs. 0 h/0 h group; #P<0.05
and ##P<0.01, vs. 1 h/0 h group;
&P<0.05, vs. 2 h/0 h group. MI, myocardial
infarction; ATP5B, ATP synthase F1 subunit β; FGG, fibrinogen γ
chain; INTS4, integrator complex subunit 4; TFRC, transferrin
receptor 1. |
Discussion
The diagnosis of AMI is a major issue in cardiology
as no specific diagnostic criteria are available for MI within 3 h.
In the present study, several DEPs were identified according to
ITRAQ technology and 19 were selected based on the GO enrichment
analysis.
Among the19 DEPs, Mb has been used as a biomarker
clinically, its diagnosis has a high sensitivity after 2 h of AMI
(27,28). Although Mb was one of the clinical
biomarkers, its elevation following AMI has high sensitivity but
lacks specificity. It is of certain value in eliminating the
diagnosis of MI, but is not the preferred standard for clinically
determining MI (29,30). However, in a previous study,
myoglobin generally rose after 2-4 h of AMI and took 8-12 h to
reach its peak (4 h: 169.74±38.54 μg/l, 12 h: 193.42±47.82
μg/l, 24 h: 189.54±44.63 μg/l, 72 h: 153.42±33.75
μg/l) (31). The ITRAQ
results for Mb in the present study were similar with these
previous data [ITRAQ results: 1 h/0 h: 0.88 (P>0.05), 2 h/0 h:
2.54 (P<0.01), 3 h/0 h: 1.87 (P<0.01)] (Table I). Furthermore, STRING database
analysis revealed the PPI network between these proteins. INTS4,
FGG and ATP5B were selected for additional confirmatory
experiments. These proteins were selected as only limited data are
available with respect to the correlation between these proteins
and MI in the current literature, and the corresponding beagle
dogs' antibodies were available for purchase. In the present study,
data were as follows: ATP5B [1 h/0 h: 0.59 (P<0.01), 2 h/0 h:
0.73 (P<0.01), 3 h/0 h: 0.42 (P<0.01)]; FGG [1 h/0 h: 2.05
(P<0.05); 2 h/0 h: 2.24 (P<0.05), 3 h/0 h: 1.34 (P>0.05)];
INTS4 [1 h/0 h: 1.33 (P<0.01); 2 h/0 h: 1.23 (P>0.05), 3 h/0
h: 0.50 (P<0.01)] (Table I).
The expression of ATP5B was significantly decreased at the three
time points. It appears that ATP5B was superior to Mb, as the
change in ATP5B appeared earlier than that for Mb. FGG increased
significantly at 1 and 2 h, but not at 3 h. INTS4 increased
significantly at 1 and 3 h, from the perspective of speed, FGG and
INTS4 were superior to Mb (with the latter increasing significantly
at the second hour), however, the increased expression of Mb lasted
longer and was easier to detect. Finally, it was concluded that
ATP5B may be a potential specific diagnostic biomarker for AMI
within 3 h. This provided in-depth insight into the occurrence and
development of MI, thereby providing a novel direction for MI
treatment.
The PPI network revealed that COX2 was at the core
of the network. The ITRAQ results showed that the expression of
COX2 increased at 1 h and decreased at 3 h significantly. COX, a
terminal enzyme on the electron transport chain, serves a vital
role in the oxidative phosphorylation process of organisms. It can
catalyze the transfer of electrons from cytochrome c to
oxygen molecules and restore it to water (32). COX in eukaryotes consists of 13-15
subunits; consecutively, the prokaryotic COX contains 3-5 subunits.
Subunits 1-3 are encoded by mitochondrial DNA, which are highly
conserved sequences and known as core subunits. However, only
subunits 1 and 2 can exert complete electron transport activity
(33,34). As a key enzyme in energy
metabolism, the functional impairment of COX is associated with
numerous neurological diseases and tumors, including Alzheimer's
disease (35,36), encephalomyopathy (37), muscular dystrophy (38) and colorectal cancer (39). Previous studies have examined the
connection between COX2 and MI. Chen et al found that
diminazene, an antiparasitic drug, significantly reduced the
expression of COX2 and the infarct area (40). Kim et al revealed that
ischemic preconditioning (IPC) exerted a protective effect on MI
and ischemia-reperfusion (I/R) injury, and further genetic analysis
revealed that most differentially expressed genes were associated
with the generation and transformation of energy. In addition, IPC
significantly improved the expression of COX2 and COX3 compared
with that in the I/R injury group (41). Due to the lack of COX2 antibodies
of beagles, it was not possible to verify the expression of key
factors in the present study, therefore, further investigations are
essential for elucidating the correlation between MI and COX2.
Notably, in the present study, the expression of
MYO1A increased at the three time points; however, MYO1A was not
selected for further experiments due to the lack of beagle MYO1A
antibody. MYO1A, also known as brush border myosin I, is one of the
most noted monomeric motor proteins. MYO1A is associated with
several diseases, including autosomal recessive hearing loss
(42), Charcot-Marie tooth
disease, and gastroenteric tumors (43,44). It serves a critical role in the
interface between membrane and cytoskeleton, contains a motor
domain that can bind actin and promote constriction between actin
and a tail homology 1 (TH-1) domain connected to the membrane
(45); however, currently, the
function of the TH-1 domain remains to be fully elucidated. MYO1A
is also the most prominent plus-end directed motor, and can bind to
MYO6 (the sole minus-end directed motor); both motors exert
opposing tension and are required for trafficking and ion transport
on the brush border (46).
Currently, there are no reports describing the association between
MYO1A and MI. The change in MYO1 within 3 h of MI requires further
investigation.
The integrator complex is a newly identified
multifunctional protein complex. It contains at least 12 subunits
(INTS1-INTS12). Takata et al found that the INTS4 was
required for the integrity of Cajal bodies (47). The Cajal body is a complex
intranuclear organelle that is crucial for the production of snRNP,
maintenance of telomere length and proliferation of cells (48). Other studies have indicated that
Cajal bodies are involved in the occurrence and development of
tumors (49,50). The association between MI and
INTS4 remains to be fully elucidated. The ITRAQ results found that
the expression of INTS4 increased at 1 h and decreased at 3 h
significantly. However, the western blotting revealed that INTS4
increased at the three time points, and further investigations with
large sample sizes are required.
ATP5B encodes the expression of ATP synthase subunit
β that catalyzes the rate-limiting step in ATP synthesis. It is the
key protein in the oxidative phosphorylation pathway. The
overexpression or silence of ATP5B can influence not only the
energy metabolism but also the other pathophysiological process.
Zuo et al found that the expression of ATP5B increased in
patients with asthma, and may be the vital factor of airway
remodeling (51). Xu et al
found that during the liver surgery-induced hepatic I/R injury, the
expression of ATP5B was decreased. These studies concluded that
ATP5B was regulated by the IPC process and may serve as the
protective factor in I/R injury (52). In addition, ATP5B is associated
with prostate cancer metastasis (53), colorectal cancer (54), clear cell renal cell carcinoma
(55) and female thyroid cancer
(56). These studies illustrate
that the expression of ATP5B alters significantly in the metabolism
of different tumor types. ATP5B may provide a potential direction
for the diagnosis and treatment of tumors. However, the relevance
of the association between ATP5B and MI has not described
previously. The ITRAQ results showed that the expression of ATP5B
decreased at all the three time points. In addition, the validation
findings were consistent with those of ITRAQ. These results
suggested that ATP5B may be a biomarker of MI within 3 h, and the
potential mechanisms require further investigation.
Several DEPs (ATP5B, COX2 and CYCS) obtained from
the ITRAQ results were closely associated with the function of
mitochondria. These DEPs are mainly distributed in the electron
transport chain of the inner mitochondrial membrane, suggesting
that disordered energy metabolism is the initial pathophysiological
characteristic of MI. Several studies have examined the connection
between MI and energy metabolism. Wang et al stated that the
mitochondrial function was impaired in the ischemic myocardium of
rat models. Applying Shenmai formula, a traditional Chinese
medicine, effectively decreased the damage of mitochondrial
function (57). Sun and Yang
found that metformin improved the myocardial function of mice with
heart failure following MI according to regulation of the
expression of SIRT3 and PGC-1α in the mitochondrial inner membrane
(58). However, mitochondrial
dysfunction is not unique to MI; energy metabolism barriers can
also occur in acute cerebral ischemia (59), renal ischemia (60), liver ischemia (61) and other ischemic diseases. This
provides a novel direction in order to understand the process of
MI, and further investigations are required.
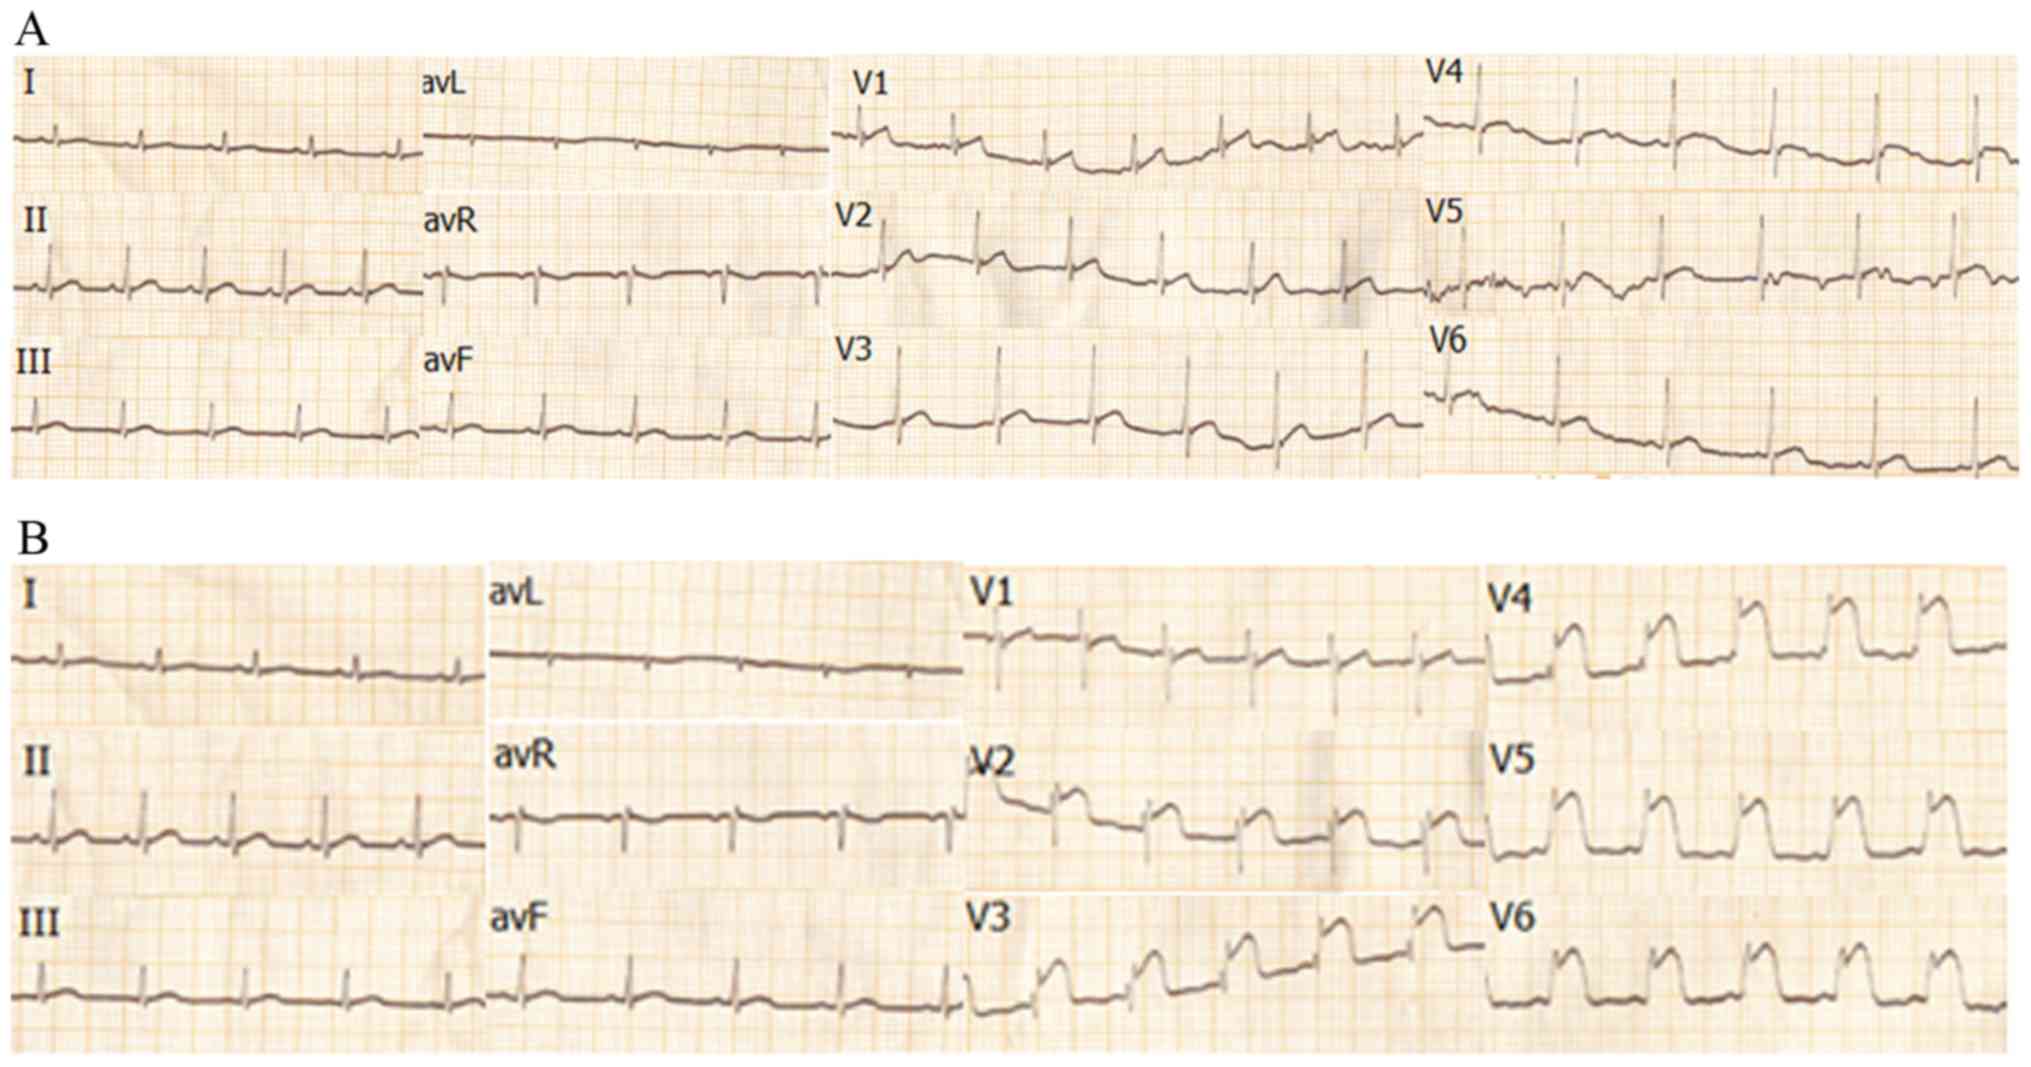
The sensitivity and specificity of the ischemic
process, including ECG and myocardial enzyme measurements were also
examined, and the relevant results were published previously
(62). It has previously been
demonstrated that the changes of myocardial enzymes and cTnI in
beagle dogs resembled those in humans; cTnI increased significantly
at 6 h post-surgery [18.13±5.09 (6 h), vs. 0.02±0.04 μg/ml
(0 h), P<0.01], peaked at ~12 h (78.68±2.08 μg/ml, vs. 0
h, P<0.01, vs. 6 h P<0.01), and maintained the peak after 24
h (79.12±0.04 μg/ml, vs. 0 h P<0.01, vs. 6 h, P<0.01,
vs. 12 h P>0.05); cTnI in humans began to increase at 2 h
post-MI, peaked at ~12 h and began to decline at 24 h post MI
(4). Similar results were
obtained for the remaining enzymes associated with MI, including
aspartate aminotransferase, alanine aminotransferase and CK-MB. In
the ECG, the ST segment of the V2-V6 leads in the beagle dogs
showed marked elevation at 3 h post-surgery, which was consistent
with the expected blocking of the LAD artery. There was no obvious
abnormality in the ECG the of the beagle dogs prior to surgery
(Fig. 9A and B). These detections
confirmed that the dog MI model established was successful,
following surgery, the cardiomyocytes were in an ischemic state.
Unfortunately, the ECG and cTnI of beagle dogs was not detected
within 3 h of MI. Details are described in a previous study
(62).
ITRAQ technology provides a platform for the
examination of protein biomarkers. However, the present study has
certain limitations. Firstly, it was not possible to collect a
large number of serum samples from MI patients for confirmatory
experiments as a majority of the patients suffered MI for >3 h,
and informed consent was not obtained at an appropriate time. In
addition, no ITRAQ was performed with normal subjects to compare
with normal beagle dogs; only if the observed MI-DEPs are not
present in the DEP between human and beagle can they serve as
biomarkers in humans. Without any data from human samples from real
patients, interpretation of the results presented here requires
caution. Furthermore, the ITRAQ results were verified for
consistency only with western blotting, and hence, additional
investigations are essential for further substantiation.
In conclusion, the present study used proteomic
analysis to identify the potential early biomarkers of MI in dogs.
The experimental results identified a variety of DEPs, providing
novel insight for the diagnosis of early MI. However, the specific
pathophysiological mechanisms underlying these DEPs in early-stage
MI necessitate further investigation.
Supplementary Materials
Funding
The present study was supported by the grants from
the Major Research and Development Projects for the Zhejiang
Science and Technology Agency (grant no. 2017C03034), the Natural
Science Foundation of Zhejiang province (Project for Young
Scientists, grant no. LQ13H020004), the National Natural Science
Foundation of China (grant no. 81500284), the Scientific and
Technological Projects for Medicine and Health of Zhejiang Province
(grant no. 2015128660) and Zhejiang Medicine and Health Science
Technology Projects (grant no. 2014KYB012).
Availability of data and materials
All data generated or analyzed during this study are
included in this published article.
Authors' contributions
CD and YW analyzed the data and wrote the
manuscript. JL was responsible for raising the animals. GZ, XL and
HJ were responsible for performing coronary angiography for all
dogs. SL was responsible for separating serum. LT was responsible
for the conception and experimental guidance of the experiment. All
authors read and approved the final manuscript.
Ethics approval and consent to
participate
Ethics approval was obtained prior to the start of
the study. All animal procedures were performed in accordance with
the Animal Care Committee of Zhejiang Hospital.
Patient consent for publication
Not applicable.
Competing interests
The authors declare that they have no competing
interests.
Acknowledgments
The ITRAQ experiment was completed by the Shanghai
Genechem company.
References
|
1
|
Menon V and Hochman JS: Management of
cardiogenic shock complicating acute myocardial infarction. Heart.
88:531–537. 2002. View Article : Google Scholar : PubMed/NCBI
|
|
2
|
Gupta ED and Sakthiswary R: Myocardial
infarction false alarm: Initial electrocardiogram and cardiac
enzymes. Asian Cardiovasc Thorac Ann. 22:397–401. 2014. View Article : Google Scholar : PubMed/NCBI
|
|
3
|
Wei M, Wu X and Li J: Value of measuring
TpP, hs-CRP, CKMB and cTnI in patients with acute myocardial
infarction. Chin J Cardiouascular Rev. 3:86–87. 2005.
|
|
4
|
Aldous SJ, Richards AM, Cullen L and Than
MP: Early dynamic change in high-sensitivity cardiac troponin T in
the investigation of acute myocardial infarction. Clin Chem.
57:1154–1160. 2011. View Article : Google Scholar : PubMed/NCBI
|
|
5
|
Young GP, Gibler WB, Hedges JR, Hoekstra
JW, Slovis C, Aghababian R, Smith M, Rubison M and Ellis J: Serial
creatine kinase-MB results are a sensitive indicator of acute
myocardial infarction in chest pain patients with nondiagnostic
electrocardiograms: The second Emergency Medicine Cardiac Research
Group Study. Acad Emerg Med. 4:869–877. 1997. View Article : Google Scholar : PubMed/NCBI
|
|
6
|
Latosinska A, Vougas K, Makridakis M,
Klein J, Mullen W, Abbas M, Stravodimos K, Katafigiotis I,
Merseburger AS, Zoidakis J, et al: Comparative Analysis of
Label-Free and 8-Plex iTRAQ Approach for Quantitative Tissue
Proteomic Analysis. PLoS One. 10:e01370482015. View Article : Google Scholar : PubMed/NCBI
|
|
7
|
Zieske LR: A perspective on the use of
iTRAQ reagent technology for protein complex and profiling studies.
J Exp Bot. 57:1501–1508. 2006. View Article : Google Scholar : PubMed/NCBI
|
|
8
|
Karp NA, Huber W, Sadowski PG, Charles PD,
Hester SV and Lilley KS: Addressing accuracy and precision issues
in iTRAQ quantitation. Mol Cell Proteomics. 9:1885–1897. 2010.
View Article : Google Scholar : PubMed/NCBI
|
|
9
|
Tvarijonaviciute A, Gutiérrez AM, Miller
I, Razzazi-Fazeli E, Tecles F and Ceron JJ: A proteomic analysis of
serum from dogs before and after a controlled weight-loss program.
Domest Anim Endocrinol. 43:271–277. 2012. View Article : Google Scholar : PubMed/NCBI
|
|
10
|
Niu R, Liu Y, Zhang Y, Zhang Y, Wang H,
Wang Y, Wang W and Li X: iTRAQ-Based Proteomics Reveals Novel
Biomarkers for Idiopathic Pulmonary Fibrosis. PLoS One.
12:e01707412017. View Article : Google Scholar : PubMed/NCBI
|
|
11
|
Li F, Zhao D, Yang S, Wang J, Liu Q, Jin X
and Wang W: ITRAQ-Based Proteomics Analysis of Triptolide On Human
A549 Lung Adenocarcinoma Cells. Cell Physiol Biochem. 45:917–934.
2018. View Article : Google Scholar : PubMed/NCBI
|
|
12
|
Tyanova S, Temu T, Sinitcyn P, Carlson A,
Hein MY, Geiger T, Mann M and Cox J: The Perseus computational
platform for comprehensive analysis of (prote)omics data. Nat
Methods. 13:731–740. 2016. View Article : Google Scholar : PubMed/NCBI
|
|
13
|
Chu PG and Weiss LM: Keratin expression in
human tissues and neoplasms. Histopathology. 40:403–439. 2002.
View Article : Google Scholar : PubMed/NCBI
|
|
14
|
Chiumiento A, Lamponi S and Barbucci R:
Role of fibrinogen conformation in platelet activation.
Biomacromolecules. 8:523–531. 2007. View Article : Google Scholar : PubMed/NCBI
|
|
15
|
Dobrovolsky AB, Laguta PS, Guskova EV,
Yarovaya EB, Titaeva EV, Storozhilova AN and Panchenko EP: Effect
of fibrinogen on platelet reactivity measured by the VerifyNow
P2Y12, assay. Biochemistry (Mosc). 81:439–444. 2016.
View Article : Google Scholar
|
|
16
|
Gendelman M and Roth Z: Incorporation of
coenzyme Q10 into bovine oocytes improves mitochondrial features
and alleviates the effects of summer thermal stress on
developmental competence. Biol Reprod. 87:1182012.PubMed/NCBI
|
|
17
|
Wu X, Steet RA, Bohorov O, Bakker J,
Newell J, Krieger M, Spaapen L, Kornfeld S and Freeze HH: Mutation
of the COG complex subunit gene COG7 causes a lethal congenital
disorder. Nat Med. 10:518–523. 2004. View
Article : Google Scholar : PubMed/NCBI
|
|
18
|
Ponnambalam S, Jackson AP, LeBeau MM,
Pravtcheva D, Ruddle FH, Alibert C and Parham P: Chromosomal
location and some structural features of human clathrin light-chain
genes (CLTA and CLTB). Genomics. 24:440–444. 1994. View Article : Google Scholar : PubMed/NCBI
|
|
19
|
Kostrominova TY: Role of myokines in the
maintenance of whole-body metabolic homeostasis. Minerva
Endocrinol. 41:403–420. 2016.PubMed/NCBI
|
|
20
|
Welchen E and Gonzalez DH: Cytochrome c, a
hub linking energy, redox, stress and signaling pathways in
mitochondria and other cell compartments. Physiol Plant.
157:310–321. 2016. View Article : Google Scholar : PubMed/NCBI
|
|
21
|
Steppich BA, Demetz G, Schulz S, von Wedel
J, Pogatsa-Murray G, Braun SL, Stein A, Kastrati A, Schömig A and
Ott I: Effects of G- CSF on systemic inflammation, coagulation and
platelet activation in patients with acute myocardial infarction.
Thromb Res. 127:119–121. 2011. View Article : Google Scholar
|
|
22
|
Chan HC, Ke LY, Chu CS, Lee AS, Shen MY,
Cruz MA, Hsu JF, Cheng KH, Chan HC, Lu J, et al: Highly
electronegative LDL from patients with ST-elevation myocardial
infarction triggers platelet activation and aggregation. Blood.
122:3632–3641. 2013. View Article : Google Scholar : PubMed/NCBI
|
|
23
|
Fliedner SM, Yang C, Thompson E, Abu-Asab
M, Hsu CM, Lampert G, Eiden L, Tischler AS, Wesley R, Zhuang Z, et
al: Potential therapeutic target for malignant paragangliomas: ATP
synthase on the surface of paraganglioma cells. Am J Cancer Res.
5:1558–1570. 2015.PubMed/NCBI
|
|
24
|
Shen XL, Zhang Y, Xu W, Liang R, Zheng J,
Luo Y, Wang Y and Huang K: An iTRAQ-based mitoproteomics approach
for profiling the nephrotoxicity mechanisms of ochratoxin A in HEK
293 cells. J Proteomics. 78:398–415. 2013. View Article : Google Scholar
|
|
25
|
Kuhn J and Binder S: RT-PCR analysis of 5'
to 3'-end-ligated mRNAs identifies the extremities of cox2
transcripts in pea mitochondria. Nucleic Acids Res. 30:439–446.
2002. View Article : Google Scholar : PubMed/NCBI
|
|
26
|
Nordström G, Säljö A and Hasselgren PO:
Studies on the possible role of oxygen-derived free radicals for
impairment of protein and energy metabolism in liver ischemia. Circ
Shock. 26:115–126. 1988.PubMed/NCBI
|
|
27
|
Castaldo AM, Ercolini P, Forino F, Basevi
A, Vrenna L, Castaldo P, D'Ambrosio V and Castaldo A: Plasma
myoglobin in the early diagnosis of acute myocardial infarction.
Eur J Clin Chem Clin Biochem. 32:349–353. 1994.PubMed/NCBI
|
|
28
|
Tucker JF, Collins RA, Anderson AJ, Hess
M, Farley IM, Hagemann DA, Harkins HJ and Zwicke D: Value of serial
myoglobin levels in the early diagnosis of patients admitted for
acute myocardial infarction. Ann Emerg Med. 24:704–708. 1994.
View Article : Google Scholar : PubMed/NCBI
|
|
29
|
De Winter RJ, Koster RW, Sturk A and
Sanders GT: Value of myoglobin, troponin T, and CK-MBmass in ruling
out an acute myocardial infarction in the emergency room.
Circulation. 92:3401–3407. 1995. View Article : Google Scholar : PubMed/NCBI
|
|
30
|
McCord J, Nowak RM, McCullough PA,
Foreback C, Borzak S, Tokarski G, Tomlanovich MC, Jacobsen G and
Weaver WD: Ninety-minute exclusion of acute myocardial infarction
by use of quantitative point-of-care testing of myoglobin and
troponin I. Circulation. 104:1483–1488. 2001. View Article : Google Scholar : PubMed/NCBI
|
|
31
|
Chen L: The clinical significance of serum
myoglobin, troponin and high sensitivity C-reactive protein levels
in the dynamic monitoring of patients with acute myocardial
infarction. Anhui Med J. 9:1224–1226. 2012.
|
|
32
|
Kadenbach B and Hüttemann M: The subunit
composition and function of mammalian cytochrome c oxidase.
Mitochondrion. 24:64–76. 2015. View Article : Google Scholar : PubMed/NCBI
|
|
33
|
Yoshikawa S and Shimada A: Reaction
mechanism of cytochrome c oxidase. Chem Rev. 115:1936–1989. 2015.
View Article : Google Scholar : PubMed/NCBI
|
|
34
|
Yoshikawa S, Shimada A and Shinzawaitoh K:
Respiratory conservation of energy with dioxygen: cytochrome C
oxidase. Metal Ions Life Sci. 15:89–130. 2015.
|
|
35
|
Lee HJ, Korshavn KJ, Kochi A, Derrick JS
and Lim MH: Cholesterol and metal ions in Alzheimer's disease. Chem
Soc Rev. 43:6672–6682. 2014. View Article : Google Scholar : PubMed/NCBI
|
|
36
|
Cadonic C, Sabbir MG and Albensi BC:
Mechanisms of mitochondrial dysfunction in Alzheimer's disease. Mol
Neurobiol. 53:6078–6090. 2016. View Article : Google Scholar : PubMed/NCBI
|
|
37
|
Gurgel-Giannetti J, Oliveira G, Brasileiro
Filho G, Martins P, Vainzof M and Hirano M: Mitochondrial
cardioence-phalomyopathy due to a novel SCO2 mutation in a
Brazilian patient: Case report and literature review. JAMA Neurol.
70:258–261. 2013. View Article : Google Scholar : PubMed/NCBI
|
|
38
|
Kostrominova TY, Reiner DS, Haas RH,
Ingermanson R and McDonough PM: Automated methods for the analysis
of skeletal muscle fiber size and metabolic type. Int Rev Cell Mol
Biol. 306:275–332. 2013. View Article : Google Scholar : PubMed/NCBI
|
|
39
|
Módis K, Bos EM, Calzia E, van Goor H,
Coletta C, Papapetropoulos A, Hellmich MR, Radermacher P, Bouillaud
F and Szabo C: Regulation of mitochondrial bioenergetic function by
hydrogen sulfide. Part II. Pathophysiological and therapeutic
aspects. Br J Pharmacol. 171:2123–2146. 2014. View Article : Google Scholar :
|
|
40
|
Chen J, Cui L, Yuan J, Zhang S, Ma R, Sang
H, Liu Q and Shan L: Protective effect of diminazene attenuates
myocardial infarction in rats via increased inflammation and ACE2
activity. Mol Med Rep. 16:4791–4796. 2017. View Article : Google Scholar : PubMed/NCBI
|
|
41
|
Kim HK, Kang SW, Jeong SH, Kim N, Ko JH,
Bang H, Park WS, Choi TH, Ha YR, Lee YS, et al: Identification of
potential target genes of cardioprotection against
ischemia-reperfusion injury by express sequence tags analysis in
rat hearts. J Cardiol. 60:98–110. 2012. View Article : Google Scholar : PubMed/NCBI
|
|
42
|
Talebi F, Ghanbari Mardasi F, Mohammadi
Asl J, Tizno S and Najafvand Zadeh M: Identification of Novel PTPRQ
and MYO1A Mutations in An Iranian Pedigree with Autosomal Recessive
Hearing Loss. Cell J. 20:127–131. 2018.PubMed/NCBI
|
|
43
|
Mazzolini R, Rodrigues P, Bazzocco S,
Dopeso H, Ferreira AM, Mateo-Lozano S, Andretta E, Woerner SM,
Alazzouzi H, Landolfi S, et al: Brush border myosin Ia inactivation
in gastric but not endometrial tumors. Int J Cancer. 132:1790–1799.
2013. View Article : Google Scholar
|
|
44
|
Mazzolini R, Dopeso H, Mateo-Lozano S,
Chang W, Rodrigues P, Bazzocco S, Alazzouzi H, LandolfiS Hernández-
Losa J, Andretta E, et al: Brush border myosin Ia has tumor
suppressor activity in the intestine. Proc Natl Acad Sci USA.
109:1530–1535. 2012. View Article : Google Scholar : PubMed/NCBI
|
|
45
|
Mazerik JN, Kraft LJ, Kenworthy AK and
Tyska MJ: Motor and tail homology 1 (Th1) domains antagonistically
control myosin-1 dynamics. Biophys J. 106:649–658. 2014. View Article : Google Scholar : PubMed/NCBI
|
|
46
|
Kravtsov DV, Caputo C, Collaco A, Hoekstra
N, Egan ME, Mooseker MS and Ameen NA: Myosin Ia is required for
CFTR brush border membrane trafficking and ion transport in the
mouse small intestine. Traffic. 13:1072–1082. 2012. View Article : Google Scholar : PubMed/NCBI
|
|
47
|
Takata H, Nishijima H, Maeshima K and
Shibahara K: The integrator complex is required for integrity of
Cajal bodies. J Cell Sci. 125:166–175. 2012. View Article : Google Scholar : PubMed/NCBI
|
|
48
|
Machyna M, Heyn P and Neugebauer KM: Cajal
bodies: Where form meets function. Wiley Interdiscip Rev RNA.
4:17–34. 2013. View Article : Google Scholar
|
|
49
|
Palanca A, Casafont I, Berciano MT and
Lafarga M: Reactive nucleolar and Cajal body responses to
proteasome inhibition in sensory ganglion neurons. Biochim Biophys
Acta. 1842:848–859. 2014. View Article : Google Scholar
|
|
50
|
Carrero ZI, Velma V, Douglas HE and Hebert
MD: Coilin phosphomutants disrupt Cajal body formation, reduce cell
proliferation and produce a distinct coilin degradation product.
PLoS One. 6:e257432011. View Article : Google Scholar : PubMed/NCBI
|
|
51
|
Zuo J, Lei M, Wen M, Chen Y and Liu Z:
Overexpression of ATP5b promotes cell proliferation in asthma. Mol
Med Rep. 16:6946–6952. 2017. View Article : Google Scholar : PubMed/NCBI
|
|
52
|
Xu C, Zhang X, Yu C, Lu G, Chen S, Xu L,
Ding W, Shi Q and Li Y: Proteomic analysis of hepatic
ischemia/reperfusion injury and ischemic preconditioning in mice
revealed the protective role of ATP5β. Proteomics. 9:409–419. 2009.
View Article : Google Scholar : PubMed/NCBI
|
|
53
|
Li W and Li Y, Li G, Zhou Z, Chang X, Xia
Y, Dong X, Liu Z, Ren B, Liu W and Li Y: Ectopic expression of the
ATP synthase β subunit on the membrane of PC-3M cells supports its
potential role in prostate cancer metastasis. Int J Oncol.
50:1312–1320. 2017. View Article : Google Scholar : PubMed/NCBI
|
|
54
|
Cai Q, Lin J, Zhang L, Lin J, Wang L, Chen
D and Peng J: Comparative proteomics-network analysis of proteins
responsible for ursolic acid-induced cytotoxicity in colorectal
cancer cells. Tumour Biol. 39:10104283176950152017. View Article : Google Scholar : PubMed/NCBI
|
|
55
|
Brüggemann M, Gromes A, Poss M, Schmidt D,
Klümper N, Tolkach Y, Dietrich D, Kristiansen G, Müller SC and
Ellinger J: Systematic analysis of the expression of the
mitochondrial ATP synthase (Complex V) subunits in clear cell renal
cell carcinoma. Transl Oncol. 10:661–668. 2017. View Article : Google Scholar : PubMed/NCBI
|
|
56
|
Lee HS, Kang Y, Tae K, Bae GU, Park JY,
Cho YH and Yang M: Proteomic biomarkers for bisphenol A-early
exposure and women's thyroid cancer. Cancer Res Treat. 50:111–117.
2018. View Article : Google Scholar
|
|
57
|
Wang Y, Zhao Y, Jiang W, Zhao X, Fan G,
Zhang H, Shen P, He J and Fan X: ITRAQ-based proteomic analysis
reveals recovery of impaired mitochondrial function in ischemic
myocardium by Shenmai formula. J Proteome Res. 17:794–803. 2018.
View Article : Google Scholar : PubMed/NCBI
|
|
58
|
Sun D and Yang F: Metformin improves
cardiac function in mice with heart failure after myocardial
infarction by regulating mitochondrial energy metabolism. Biochem
Biophys Res Commun. 486:329–335. 2017. View Article : Google Scholar : PubMed/NCBI
|
|
59
|
Liu X, Tao Y, Wang F, Yao T, Fu C, Zheng
H, Yan Y, Liang X, Jiang X and Zhang Y: Kudiezi injection mitigates
myocardial injury induced by acute cerebral ischemia in rats. BMC
Complement Altern Med. 17:82017. View Article : Google Scholar : PubMed/NCBI
|
|
60
|
Lin M, Li L, Li L, Pokhrel G, Qi G, Rong R
and Zhu T: The protective effect of baicalin against renal
ischemia-reperfusion injury through inhibition of inflammation and
apoptosis. BMC Complement Altern Med. 14:192014. View Article : Google Scholar : PubMed/NCBI
|
|
61
|
Cavalcante FP, Coelho AM, Machado MC,
Sampietre SN, Patzina RA, Diniz MA, Chaib E and D'Albuquerque LA:
Mechanisms of the beneficial effect of sevoflurane in liver
ischemia/reperfusion injury. Acta Cir Bras. 30:749–755. 2015.
View Article : Google Scholar : PubMed/NCBI
|
|
62
|
Jiangjie L, Guangzhong Z, Xiaowei L, et
al: Establish an animal model of acute myocardial infarction in
Beagle dog via injecting microvulsant ball and thrombin powder in
coronary artery. J Clin Cardiol. 11:1058–1062. 2017.
|