Introduction
Ophiobolins are secondary metabolites belonging to
the family of sesterterpenoid compounds and are produced by
phytopathogenic fungi, mainly of the genus Bipolaris. Their
discovery filled the gap between diterpenes (C20), which have four
isoprene units and triterpenes (C30), which have six isoprene units
(1). Ophiobolin A was the first
member of the group to be isolated and characterized in the
mid-1960s (2,3). Currently, 25 biogenic ophiobolins
have been identified and marine-derived fungal ophiobolins were
recently identified and demonstrated to inhibit the biofilm
formation of Mycobacterium species (4).
Ophiobolin-producing terrestrial fungi attack
several crops, such as rice, maize and sorghum, by causing brown
spot lesions on the leaves. These fungi mainly attack
monocotyledons, but they can also attack various herbaceous
dicotyledon species, although grass weeds proved to be more
sensitive to the phytotoxins (5).
The interest in Bipolaris spp. and their bioactive
metabolites derives from their previous implication in two
devastating plant disease epidemics: the Bengal rice famine in
India in 1943 and the Southern corn leaf blight epidemic in the USA
in 1972 (1).
Ophiobolins can lead to cell death in plants through
multiple mechanisms of action, including inhibition of root and
coleoptile growth in wheat seedlings, inhibition of seed
germination, changes in cell membrane permeability, stimulation of
β-cyanin leakage, releases of electrolytes and glucose from the
roots and decreases in photosynthetic CO2-fixation,
which cause respiratory changes and enhance stomatal opening
(reviewed in ref. 1). Ophiobolin A
is able to inhibit protein and nucleic acid synthesis or act as an
inhibitor of β-1,3-glucan synthetase in plant cells (1).
While a body of information on the deleterious
effects of ophiobolin A in plants is already available, only a few
of these reports mention the anticancer effects of ophiobolin A and
these reports are limited to in vitro studies. Cytotoxic
effects were reported for ophiobolin A (6,7) and
ophiobolin O (8) but not for
ophiobolin I (6) in various cancer
cell lines.
The present study further aims to characterize
ophiobolin A-mediated effects on cell proliferation versus cell
death in normal plant (tobacco) versus normal mammalian cells and
then in mammalian cancer cells.
Materials and methods
Ophiobolin A production and
stability
Fungus
A strain of Drechslera gigantea (Heald &
Wolf) was used to produce ophiobolin A. This fungus is stored in
the Fungal Collection at the Institute of Sciences of Food
Production in Bari, Italy (# ITEM 7004) and it was previously
reported to produce ophiobolin A (5). The fungus was grown and maintained on
Petri dishes containing PDA (potato-dextrose-agar, Oxoid, UK).
Production, extraction and
purification of ophiobolin A
Ophiobolin A was produced by growing the fungus,
extracted from the fungal culture, purified and its identity
confirmed as described previously (5). The ophiobolin A purity (>95%) was
confirmed by RP-HPLC-UV. HPLC analyses were performed on an Agilent
1100 series HPLC system (Agilent, Diegem, Belgium). The
chromatographic system was a C8 SunFire 150×4.6-mm I.D.,
3.5-μm particle size (Waters, Milford, MA, USA). The
solvents were CH3OH:TFA 0.1% in water (65:35), with a
flow rate of 0.75 ml/min and λ = 240 nm.
Physicochemical stability measurements
for ophiobolin A
The stability of ophiobolin A was assayed by using
the same conditions used for the growth of both mammalian and plant
cells. A 10−3 M solution of ophiobolin A was prepared
from a stock solution in DMSO (10−2 M) diluted in
minimal essential cell culture medium (MEM) (Invitrogen, Merelbeke,
Belgium) and used for growing mammalian cells. After 7 days of
incubation at 37°C, the solution was diluted with the appropriate
solvent (see below) to a final concentration of 10−5 M;
it was analyzed by LC-MS and compared to freshly prepared
ophiobolin A (10−5 M) and
3-anhydro-6-epi-ophiobolin (10−5 M) solutions,
this latter being a degradation product of the main metabolite. The
LC-MS analyses were performed using an Agilent RRLC-UV-VIS 1200
series coupled to a quadrupole time-of-flight mass spectrometer
(Q-TOF) 6520 (Palo Alto, CA, USA). The LC conditions were the same
as for the purity test described above. ESI-Q-TOF parameters were
as follows: positive mode; high resolution acquisition mode (4
GHz); gas temperature of 350°C; drying gas flow rate of 11 l/min;
nebulizer pressure of 50 psig; capillary voltage of 4500 V; skimmer
voltage of 150 V; MS scan range and rate, 50–1,700 at 2 spectra/s.
The data were acquired and analyzed using the Mass Hunter
Acquisition® and Qualitative Analysis® software,
respectively (Agilent Technologies).
The ophiobolin A stability in tobacco cell culture
media was monitored for 4 days. Solutions of 5×10⁻⁶ M
and 10−5 M ophiobolin A were incubated in the same
conditions as the plant cell culture (modified Linsmaier and Skoog
media on a rotary shaker at 130 rpm at 27°C in the dark; see below
for details). At one-day intervals, the stability of ophiobolin A
and the generation of degradation products were assayed as
described below. The chromatograms were recorded on Agilent
Technologies 1200 series UV-VIS detector. The column used was C18
HD 250×4.6-mm I.D. Nucleosil 100-5 (Macherey-Nagel, GmbM & Co.
KG, Duren, Germany). The solvents were
CH3OH:H2O (8:2), with a flow rate of 0.5 ml/
min and λ = 240 nm.
Ophiobolin A and plant cells
Growing conditions, mitotic index and
viability of plant cells
A suspension of tobacco (Nicotiana tabacum L.
cv Bright-Yellow 2) cells, hereafter referred to as TBY-2 cells,
was routinely propagated and cultured at 27°C, according to Nagata
et al (9). A stationary
culture was diluted 4:100 (v:v) and cultured for 3 days as
described by Vacca et al (10). An ethanolic solution of ophiobolin
A was used for the treatments. The final concentration of ethanol
in the media never exceeded 0.2%.
Cell growth was evaluated by optical density at 600
nm (11) and by package cell
volume (PCV), which is the ratio between the cell volume after
centrifugation at 250 × g for 6 min and the total suspension volume
(12).
TBY-2 cell viability was measured using trypan blue
staining and cell morphology was investigated by means of a phase
contrast light microscope, as described previously (13).
The mitotic index was calculated as the percentage
of cells undergoing mitosis. For this assay, TBY-2 cells were
stained with Hoechst 33258, as reported in Houot et al
(14) and visualized using a
fluorescence microscope (DMLS, Leica, Wetzlar, Germany) with an
excitation filter of 340–380 nm and a barrier filter of 410 nm.
Nuclear morphology and DNA
fragmentation analysis
The nuclear morphology of the TBY-2 cells was
analyzed by staining the cells with Hoechst 33258 and visualized as
previously described (14). The
DNA from the TBY-2 cells was isolated according to the CTAB method
described by Edwards et al (15). DNA fragments were separated by
electrophoresis on a 1.5% (w/v) agarose gel and then visualized by
staining with ethidium bromide as detailed previously (16).
H2O2 production
in plant cells
The extracellular release of hydrogen peroxide
(H2O2) was determined by measuring the
absorbance at 560 nm of the Fe3+-xylenol orange complex,
according to Locato et al (13). The intracellular production of
H2O2 was also observed by staining the cells
with the fluorescent probe dihydrorhodamine (DHR) 123 (17) and visualized using a fluorescence
microscope with an excitation filter of 450–490 nm and a barrier
filter of 510 nm.
Ophiobolin A and mammalian cells
Determination of in vitro
growth-inhibitory activity in normal human cells
Normal human adult keratinocytes were isolated and
grown as detailed previously (18). At ∼40% culture confluence, the
keratinocytes were grown under autocrine conditions by excluding
all of the growth factors from the culture media; 2 days later,
hyperproliferating undifferentiated cultures were analyzed while
still subconfluent (SC). After four additional days of incubation,
the cultures had become confluent (C) and were analyzed as
differentiating cultures; in these culture conditions, confluent
cultures are growth-arrested and express suprabasal markers of
epidermal differentiation (19,20).
The in vitro global growth levels of SC
versus C keratinocytes that were left untreated (control) or
treated with ophiobolin A were determined by means of the MTT
colorimetric assay, as detailed below.
Determination of the in vitro
growth-inhibitory activity in mouse and human cancer cells
Three human and one mouse cancer cell lines were
obtained from the American Type Culture Collection (ATCC, Manassas,
VA, USA) and from the Deutsche Sammlung von Mikroorganismen und
Zellkulturen (DSMZ, Braunschweig, Germany). The three human cancer
cell lines were the A549 non-small cell lung cancer cell line
(NSCLC; DSMZ code ACC107), the SKMEL-28 melanoma cell line (ATCC
code HTB-72) and the Hs683 oligodendroglioma (ATCC code HTB-138)
cell line; the mouse cancer cell line used was the B16F10 melanoma
(ATCC code CRL-6475) model, which was also assayed in vivo
as detailed below. The cells were cultured in RPMI (Invitrogen)
media supplemented with 10% heat-inactivated fetal calf serum
(Invitrogen), 4 mM glutamine, 100 μg/ml gentamicin and
penicillin-streptomycin (200 U/ml and 200 μg/ml;
Invitrogen). The overall growth level of each cell line was
determined using the colorimetric MTT
(3-[4,5-dimethylthiazol-2yl]-2,5-diphenyltetrazolium bromide,
Sigma, Belgium) assay as previously described (18,21).
The data are presented as the means ± SD values obtained from three
experiments, each of which was performed on six replicates.
Multidrug resistant (MDR) cancer cell
cultures
Human cell lines and their chemoresistant sub-lines
used in this study were obtained as described below. The
pro-myelocytic leukemia HL60 cell line and its P-glycoprotein
overexpressing sub-lines that have been rendered resistant to
adriamycin (HL60/adr), vincristine (HL60/vinc) or mitoxantrone
(HL60/mx) (22,23) were generously donated by Dr M.
Center (Kansas State University, Manhattan, KS, USA). The A2780
ovarian carcinoma cell line and its variant that is resistant to
cisplatin were obtained from Sigma-Aldrich. The small cell lung
carcinoma cell line GLC4 and its MRP1- and LRP-overexpressing
adriamycin-resistant sub-line GLC4/ADR (24,25)
were generously donated by Dr E.G. deVries (Groningen, The
Netherlands). The human colon cancer HCT116 p53 wild-type cell line
and its p53 (−/−) delete clone (26) were generously donated by Dr B.
Vogelstein (John Hopkins University, Baltimore, MD, USA).
Immunoblotting validation of overexpressed ABC transporters and p53
deletion are available upon request. All cell lines were cultured
in RPMI-1640 media supplemented with 10% fetal bovine serum, with
the exception of HCT116 cells, which were grown in McCoy's media.
In case of the resistant sub-lines, the respective selective drug
was added as detailed previously (23,25).
For the cell viability assays, 2×10³
cells in 100 μl were plated into individual wells in 96-well
plates and allowed to attach for 24 h. Appropriate concentrations
of ophiobolin A were added to the wells in another 100 μl of
growth media for 72 h. The proportion of viable cells at the end of
the treatment was then determined by means of the MTT assay
colorimetric assay, as in the previous section.
Computer-assisted phase-contrast
microscopy analyses
Direct visualization of ophiobolin A-induced effects
on the cell proliferation and morphology of human Hs683 glioma
cells was performed by means of time-lapse computer-assisted phase
contrast microscopy, i.e., quantitative videomicroscopy, as
detailed previously (27,28).
Characterization of in vivo ophiobolin
A-mediated anticancer activity
B16F10 melanoma pulmonary pseudometastases were
obtained by i.v. (lateral tail vein) injection of
2.5×10⁵ B16F10 cells (200 μl), as we detailed
previously (29). The B16F10
melanoma cells used for these in vivo experiments were also
assayed in vitro with respect to ophiobolin A-mediated
growth-inhibitory effects (Table
II). As we only had limited amounts of ophiobolin A available,
we referred to the published data to select the doses to be
administered to the mice. The LD50 doses of ophiobolin A
for mice are 238 mg/kg when administered subcutaneously, 21 mg/kg
when administered intraperitoneally, 12 mg/kg when administered
intravenously and 73 mg/kg when administered orally (1). A suspension of microcrystalline
ophiobolin A in 0.9% NaCl was intraperitoneally administered at 5
and 10 mg/kg to the B16F10 melanoma-bearing mice three times a week
(Monday, Wednesday, Friday) for three consecutive weeks. Treatments
began on the 5th day after the tumor grafting procedure. Each
experimental group included 10 mice. Mouse survival was checked
daily, while mouse weight was recorded three times per week
(Monday, Wednesday, Friday). Each B16F10 melanoma-bearing mouse was
sacrificed either when it had lost 20% of its weight compared to
its weight at the time of the tumor graft or if it was suffocating.
The animal experiment used 6-week-old female B6D2F1 mice (18–22 g;
Charles Rivers, Arbresle, France) and was performed on the basis of
authorization no. LA1230568 from the Animal Ethics Committee of the
Federal Department of Health, Nutritional Safety and the
Environment (Belgium).
 | Table II.Characterization of the in
vitro growth-inhibitory activity (MTT colorimetric assay) of
ophiobolin A and 3-anhydro-6-epi ophiobolin A on four cancer
cell lines.a |
Table II.
Characterization of the in
vitro growth-inhibitory activity (MTT colorimetric assay) of
ophiobolin A and 3-anhydro-6-epi ophiobolin A on four cancer
cell lines.a
| Compound | Mean
IC50in vitro growth inhibitory concentration
(μM) ± SD | Global mean
IC50 ± SD |
|---|
|
|---|
| Cancer cells
displaying various levels of resistance to pro-apoptotic
stimuli | Cancer cells
displaying actual sensitivity to pro-apoptotic stimuli |
|---|
|
|
|---|
| A549 | SKMEL28 | Hs683 | B16F10 |
|---|
| Ophiobolin A | 0.42±0.01 | 0.37±0.03 | 0.62±0.04 | 0.29±0.05 | 0.4±0.1 |
|
3-anhydro-6-epi ophiobolin A | 30±1 | 27.0±0.4 | 30±3 | 22±3 | 27±4 |
Statistical analyses
Survival analyses were carried out by means of
Kaplan-Meier curves, which were compared with the log-rank test.
All the statistical analyses were performed using Statistica
(StatSoft, Tulsa, OK, USA). The data from the in vitro
experiments were statistically analyzed via the one-way ANOVA test
using the Sigma Plot software (Systat Software Inc., San Jose, CA,
USA).
Results
Characterization of ophiobolin A
stability
The physicochemical stability of ophiobolin A was
analyzed in the two culture conditions in order to establish
whether the different sensitivities of plant and animal cells to
ophiobolin A were due to the compound itself or to its degradation
product(s) in the culture media used for animal and plant cell
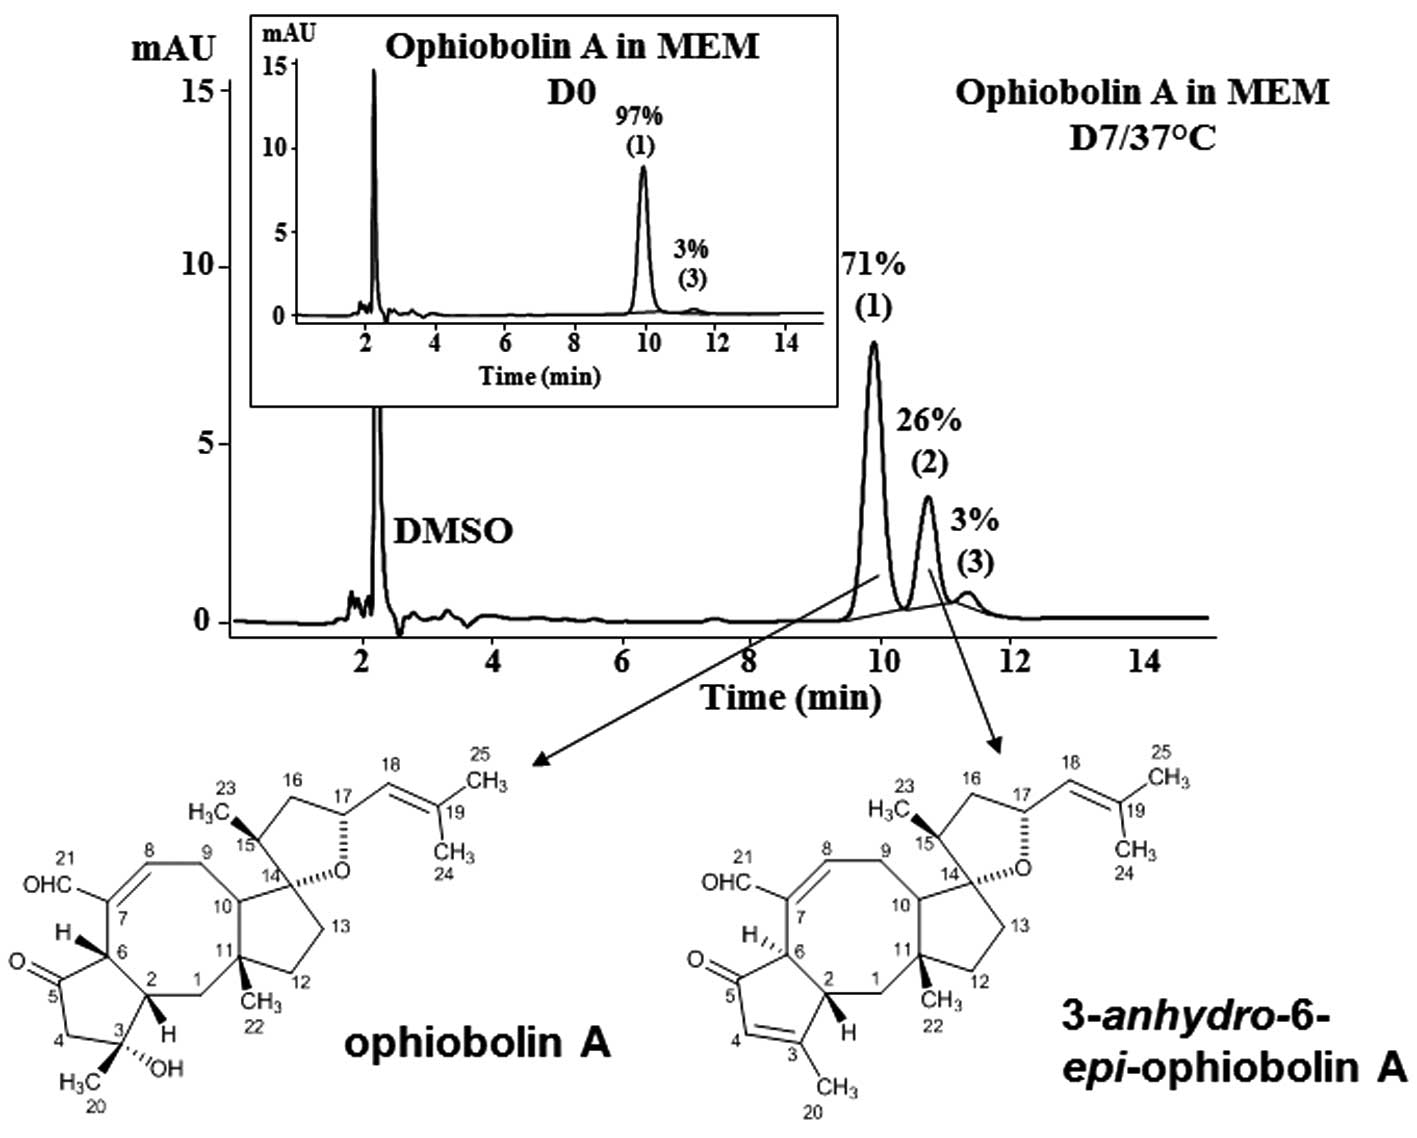
growth. The data show that ophiobolin A can be almost completely
recovered immediately after its dissolution in MEM as a major peak
corresponding to 97% of the sesterterpenoid (peak 1; Fig. 1). One major degradation product was
obtained when ophiobolin A was maintained for 7 days at 37°C in MEM
culture media (peak 2; Fig. 1);
this product has been identified as
3-anhydro-6-epi-ophiobolin A (Fig. 1) by means of TLC (with comparisons
to the available standards), ESI-MS, EI-MS and NMR analyses,
according to the previously reported spectroscopic data (5). HPLC analyses revealed that 71% of
ophiobolin A remained after one week (D7) at 37°C in MEM (Fig. 1). A minor peak of 3% was observed
at D0 and remained stable up to 7 days. This minor peak corresponds
to an unidentified compound; however, the ophiobolin A used in the
present study was 97% pure.
The degradation of ophiobolin A was faster in TBY-2
plant cell culture media (Table I)
than in mammalian MEM (Fig. 1).
Indeed, after 4 days of incubation, ∼40% of the ophiobolin A was
degraded to 3-anhydro-6-epi-ophiobolin A (Table I).
| Table I.Ophiobolin A stability in TBY-2 plant
cell culture media over time.a |
Table I.
Ophiobolin A stability in TBY-2 plant
cell culture media over time.a
| Time (days) | Starting solution 5
μM | Starting solution
10 μM |
|---|
|
|
|---|
| Ophiobolin A |
3-anhydro-6-epi-ophi-A | Ophiobolin A |
3-anhydro-6-epi-ophi-A |
|---|
| 1 | 93±1 | 7±1 | 92±1 | 7±2 |
| 2 | 78±2 | 22±1 | 76±1 | 24±1 |
| 3 | 72±1 | 27±1 | 71±2 | 29±2 |
| 4 | 59±2 | 41±2 | 57±1 | 43±1 |
Plant cell sensitivity to ophiobolin
A
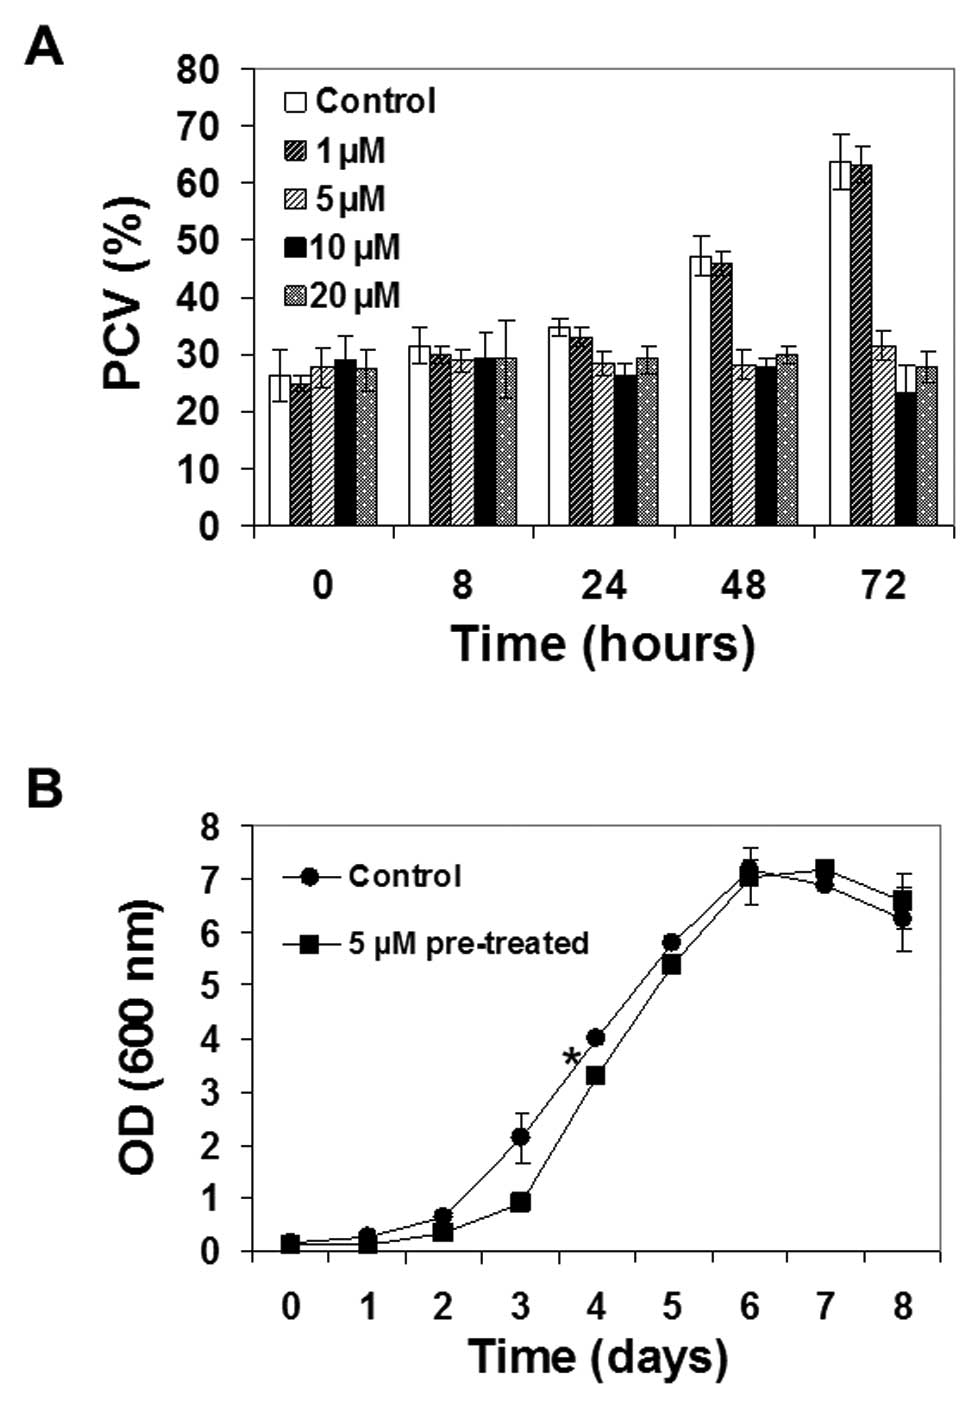
Ophiobolin A affected plant cell growth, with 5
μM being the lowest concentration required for altering
culture growth (Fig. 2A). At this
concentration, ophiobolin A completely blocked the growth of TBY-2
cells, as the package cell volume (PCV) remained unchanged over
time, while lower ophiobolin A concentrations did not alter TBY-2
growth (Fig. 2A). Similar results
were obtained by measuring cell culture growth via monitoring the
increase in optical density (OD) at 600 nm of the cell suspension
(data not shown). Analysis of the mitotic index confirmed that 5
μM ophiobolin A blocked cell division, reducing the number
of cells undergoing mitosis by 69±5% 24 h post-treatment.
TBY-2 cells regained their proliferative ability
when they were washed and cultured in ophiobolin A-free media after
24 h of 5 μM ophiobolin A treatment, even if a weak but
nevertheless statistically significant delay in reaching the
exponential phase was observed (*p<0.05; Fig. 2B). Higher concentrations of
ophiobolin A (10 and 20 μM) showed similar effects on cell
growth when compared to treatment with 5 μM ophiobolin A but
also caused cell death, as detailed below.
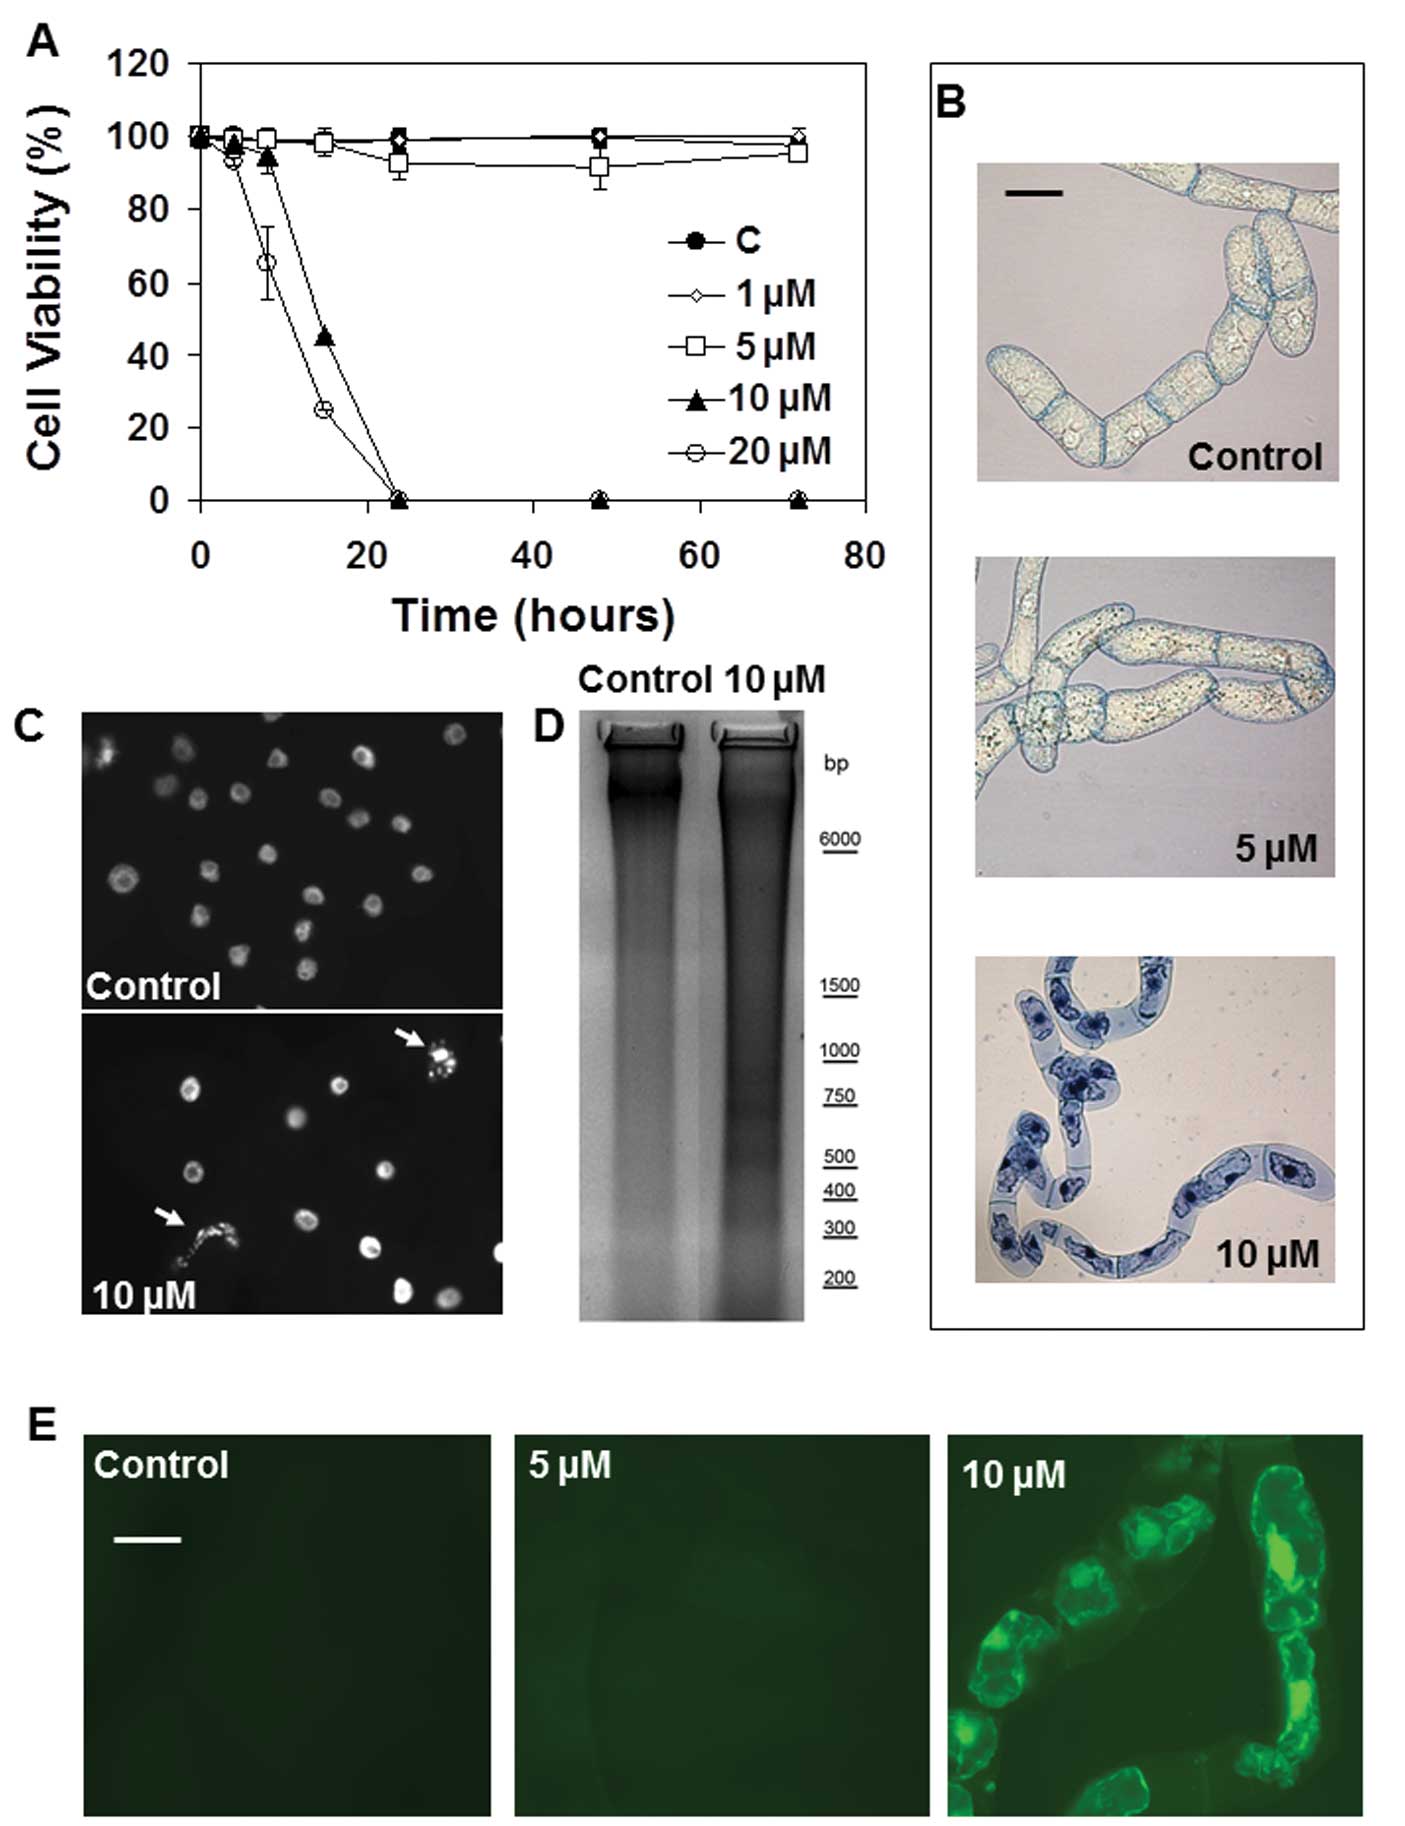
The effects of ophiobolin A and its degradation
product 3-anhydro-6-epi-ophiobolin A on TBY-2 plant cell
viability were analyzed using the trypan blue assay, as the trypan
blue dye selectively enters dead cells. The data from this analysis
revealed that ophiobolin A was lethal for TBY-2 cells at
concentrations ≥10 μM (Fig.
3A). Indeed, TBY-2 cell viability was almost negligible 24 h
after treatments with 10 and 20 μM ophiobolin A, whereas
treatment with 1 or 5 μM ophiobolin A did not induce any
decrease in cell viability until 72 h after the treatments
(Fig. 3A). Furthermore,
3-anhydro-6-epi-ophiobolin had no effect on the TBY-2 cells;
neither the growth nor the viability of the cells were altered,
even after 72 h of treatment and at concentrations ≤10 μM of
3-anhydro-6-epi-ophiobolin (data not shown).
Cytoplasm shrinkage has been recognized as a useful
hallmark to distinguish programmed cell death (PCD) from the
necrotic processes in plant cell cultures (30). Fig.
3B shows that treatment with 10 μM ophiobolin A induced
cytoplasm shrinkage in nearly all trypan blue-positive cells,
suggesting that the compound induced apoptosis-like cell death in
the TBY-2 plant cells. No cellular shrinkage was detected in the
control cells or in cells treated with 5 μM ophiobolin A
(Fig. 3B).
The analysis of the nuclear morphology of the cells
further supports the activation of PCD in cells treated with 10
μM ophiobolin A because the micronuclei formation that
typically occurs in apoptotic-like plant cell death was observed in
TBY-2 cells undergoing ophiobolin A-dependent cell death (Fig. 3C). In contrast, nuclei from TBY-2
cells treated with 5 μM ophiobolin A had the same morphology
as those from the control cells (data not shown). DNA laddering
induced by the activation of endonucleases during the PCD process
was also evident in TBY-2 cells treated with 10 μM
ophiobolin A but was not apparent in either cells subjected to 5
μM ophiobolin treatment (data not shown) or the control
cells (Fig. 3D).
It is well known that early
H2O2 production acts as a signal to activate
PCD-dependent defense mechanisms in plant cells (30). Under ophiobolin A treatment,
H2O2 production only occurred in tobacco
cells when PCD had already been activated (Table III). Indeed,
H2O2 accumulation was observed only in dying
cells (Fig. 3E).
H2O2 production was not detectable in either
the control cells or the cells treated with 5 μM ophiobolin
A over all the analyzed periods (Fig.
3E).
| Table III.The extracellular release of
H2O2 by TBY-2 cells after 10 μM
ophiobolin A treatment.a |
Table III.
The extracellular release of
H2O2 by TBY-2 cells after 10 μM
ophiobolin A treatment.a
| Time after
treatment (h) | Cell viability
(%) |
H2O2
(μM) |
|---|
| 0 | 100.0±0.1 | ND |
| 4 | 98±2 | ND |
| 8 | 95±5 | 0.3±0.2 |
| 15 | 42±10 | 9±2 |
Effects of ophiobolin A and its
degradation product on mammalian cells
Three human cancer cell lines and one mouse cancer
cell line were used to determine the in vitro
growth-inhibitory effects induced by ophiobolin A and its
degradation product 3-anhydro-6-epi-ophiobolin A (Table II). The data obtained revealed that
the mean IC50 growth inhibitory concentrations for
3-anhydro-6-epi-ophiobolin A were approximately 60 times
higher than those for ophiobolin A (Table II). We thus pursued our
investigations with ophiobolin A only.
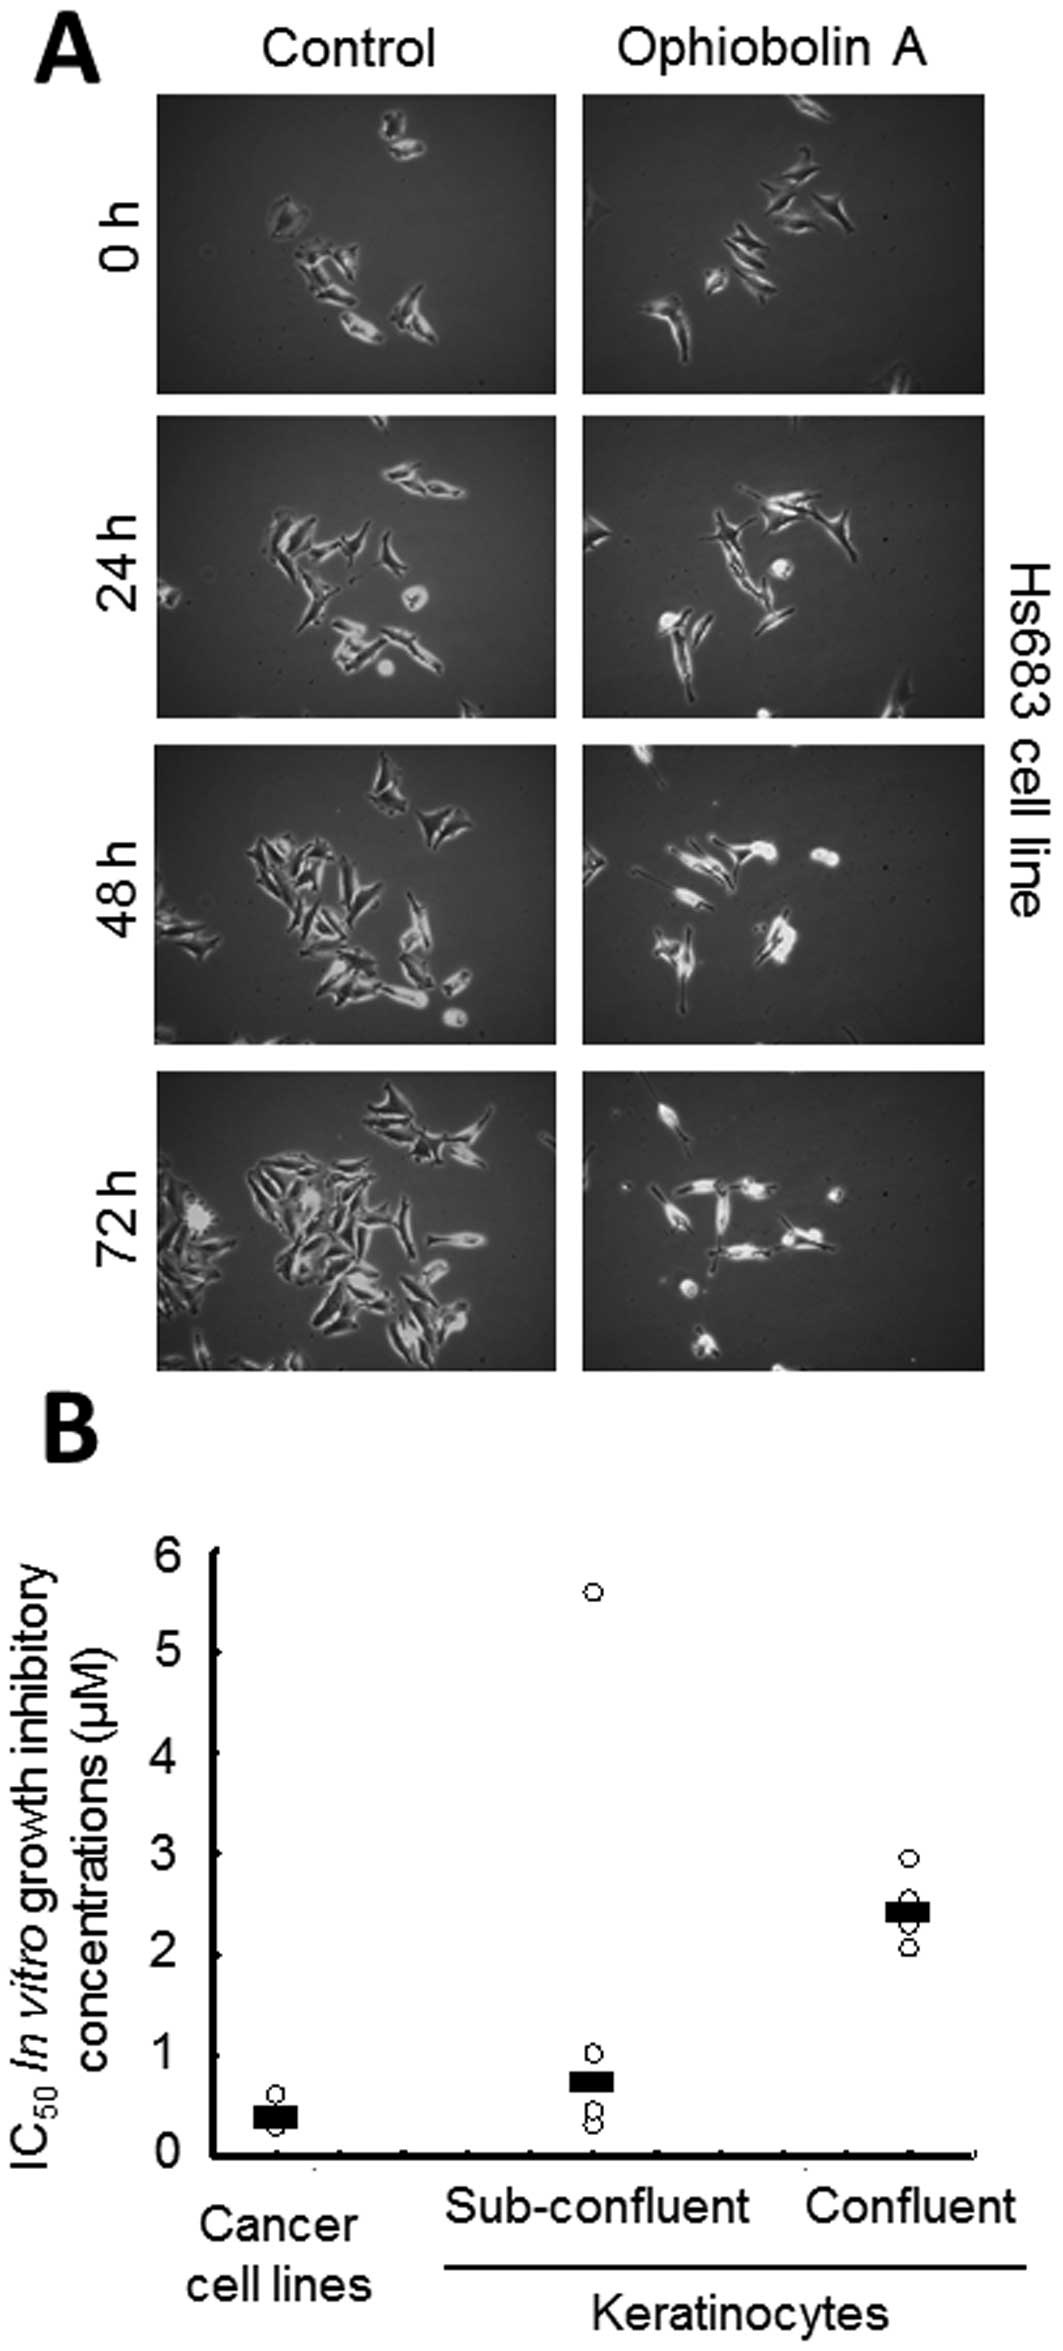
Ophiobolin A delays cell proliferation
in both normal and cancer mammalian cells
Treatment with 1 μM ophiobolin A was found to
decrease the cell proliferation of human Hs683 oligodendroglioma
cells during the first 72 h of treatment, as revealed by
quantitative videomicroscopy analyses (Fig. 4A). However, in contrast to the
TBY-2 plant cells, the human Hs683 cancer cells did not regain
growth potential when the cancer cells were cultured for 24 h with
1 μM ophiobolin A and then washed and cultured in ophiobolin
A-free media (data not shown).
The data shown in Fig.
4A suggest that ophiobolin A might exert cytostatic effects,
such as delaying cell proliferation, rather than cytotoxic effects,
such as directly killing cells, during the first 24 h of contact
with Hs683 cancer cells. We thus investigated whether the global
growth rates of mammalian cell populations could influence the
growth-inhibitory effects of ophiobolin A, at least in
vitro. We used four primo-cultures of keratinocytes and each
primoculture was analyzed both while highly proliferating (in a
subconfluent stage) and while weakly or non-proliferating (in a
confluent stage), as detailed in Materials and Methods. The data
revealed that the non-proliferating keratinocytes displayed 5–10
times less sensitivity to the ophiobolin A-induced
growth-inhibitory effects than the cancer cells, while the
subconfluent keratinocytes displayed intermediate sensitivity
(Fig. 4B).
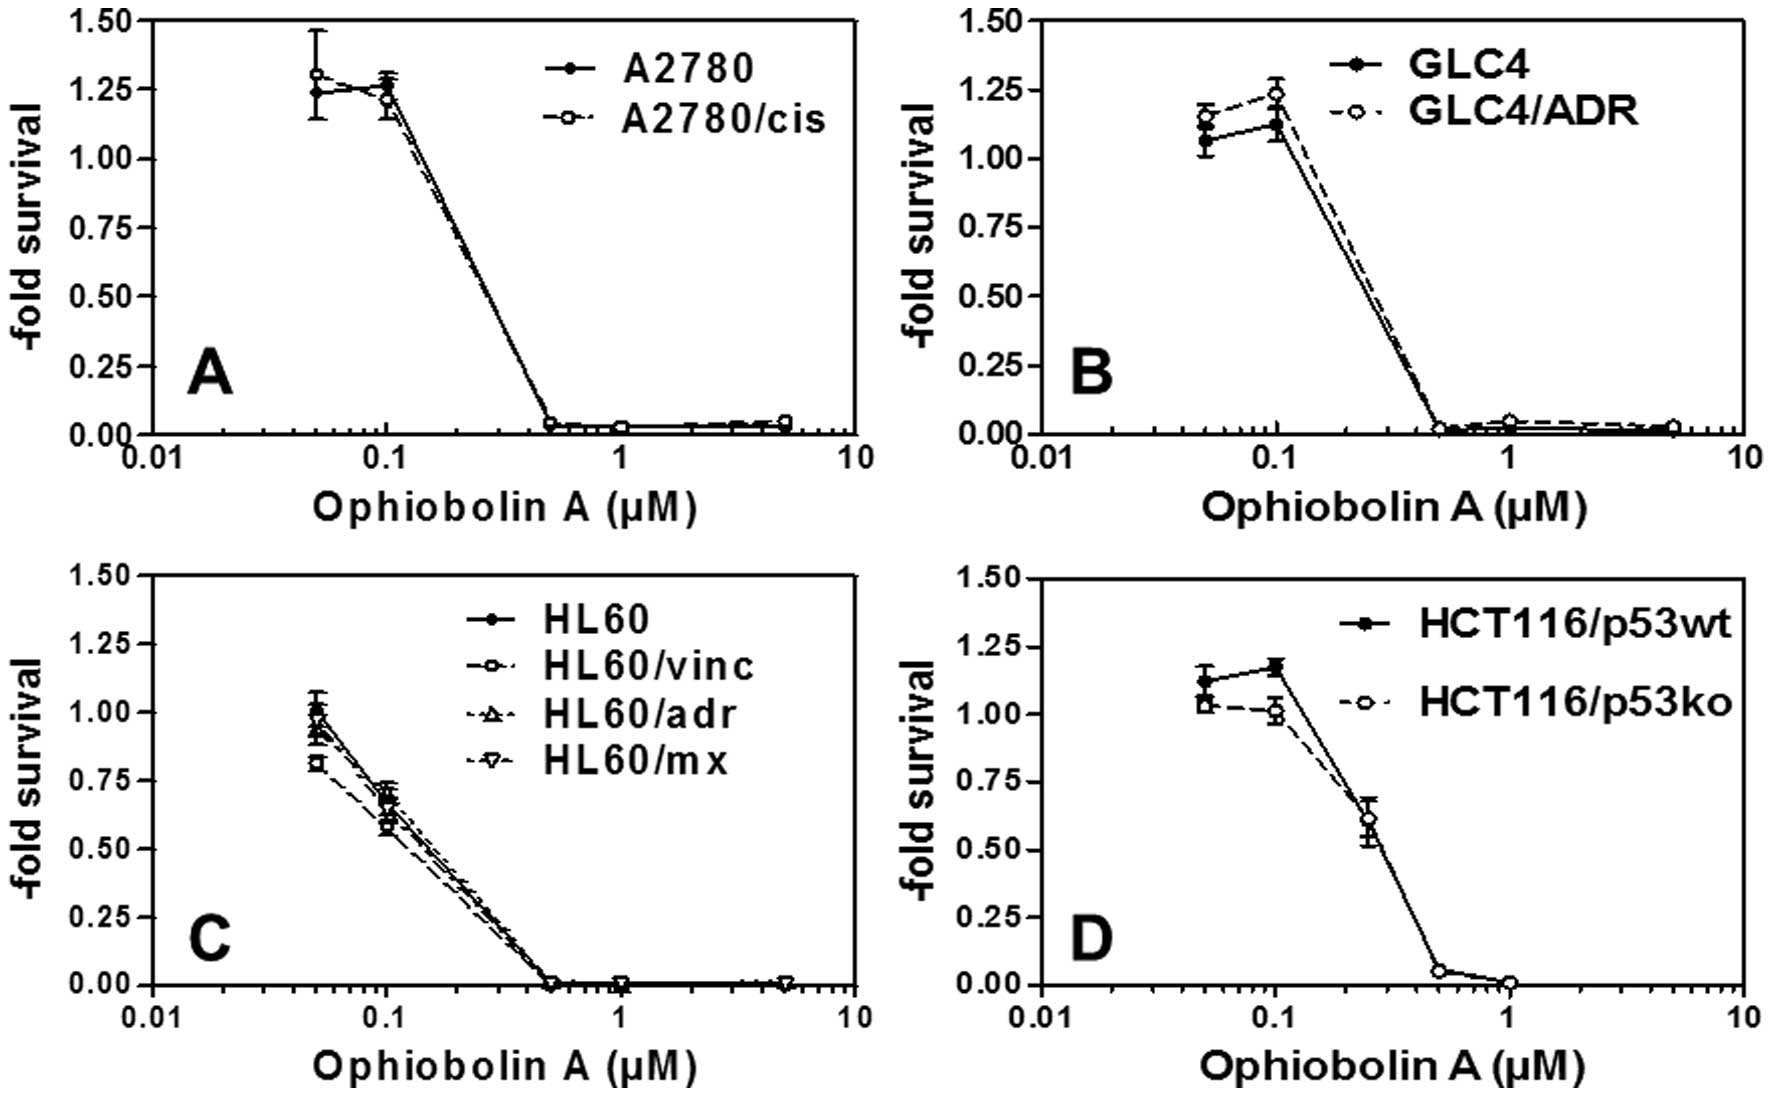
Ophiobolin A is active in vitro
against MDR cancer cells
While ophiobolin A induces growth-inhibitory
effects in submolar concentrations in various cancer cell lines
(Table II), it is not a substrate
for MDR-related efflux pumps. Indeed, the data obtained clearly
show that ophiobolin A displays similar in vitro
growth-inhibitory activity in ovarian cancer cells that are either
sensitive or resistant to cisplatin (Fig. 5A), in GLC-4 small cell lung cancer
cells that are either sensitive or resistant to adriamycin
(Fig. 5B) and in leukemia cells
that are either sensitive or resistant to mitoxantrone, vincristine
or adriamycin (Fig. 5C). These
cell lines are known to overexpress also other resistance mechanism
key ABC transporter proteins important for MDR such as ABCB1
[HL60/vinc (22,23)], ABCCs [HL60/adr (22,23)], GLC4/ADR (24,25)
and ABCG2 [HL60/mx (22,23)]. The efficiency of ophiobolin A in
terms of growth-inhibitory activity also remained similar in
HCT-116 colon cancer cells that displayed either functional or
deficient p53 (26) (Fig. 5D).
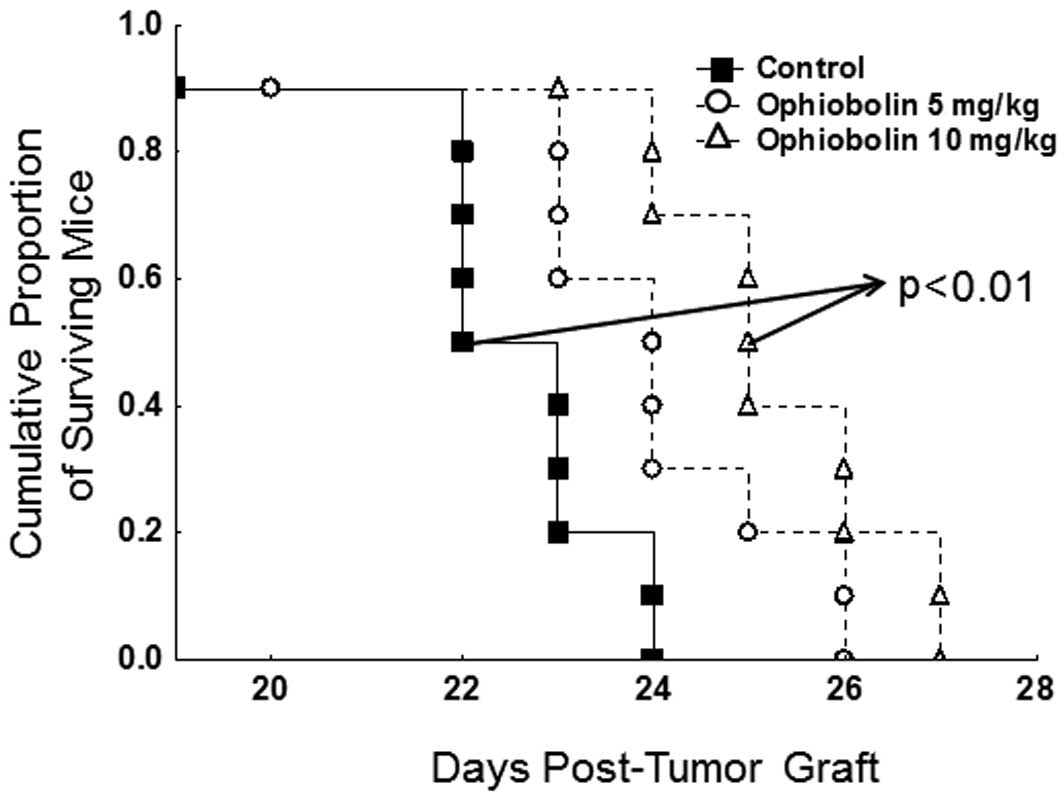
Ophiobolin A displays in vivo
anticancer activity
At first glance, the data illustrated in Fig. 4B might seem to suggest that
ophiobolin A could be weakly bioselective and thus toxic, between
normal mammalian cells and cancer cells. We thus transplanted in
vivo the B16F10 melanoma cell line that displayed actual in
vitro sensitivity to the growth-inhibitory effects of
ophiobolin A (Table II) to
determine whether ophiobolin A could represent a potential
anticancer agent; i.v. injection of the B16F10 melanoma cells into
the tail vein of mice leads to the development of highly aggressive
lung pseudometastases in 100% of the injected mice (29).
As detailed in Materials and methods, the in
vivo dosages used for ophiobolin A (5 and 10 mg/kg chronically
administered intraperitoneally three times a week over three
consecutive weeks) induced no apparent toxicity as assessed by
monitoring the behavior (daily) and weight (twice a week) of the
mice (data not shown). In contrast, we observed a significant
(p<0.01) increase in the survival periods of the B16F10
melanoma-bearing mice that were chronically treated with 10 mg/kg
(but not with 5 mg/kg) ophiobolin A (Fig. 6).
Discussion
The data from the present study reveal that plant
cells are less sensitive to ophiobolin A-induced growth-inhibitory
effects in vitro than mammalian cells and that slowly
proliferating mammalian cells are less sensitive to these
ophiobolin A-induced growth-inhibitory effects than highly
proliferative ones.
Morphological effects in terms of coleoptile growth
and the inhibition of seed germination have been reported in
monocot-susceptible plants (1).
The data obtained in this study suggest that this inhibitory effect
could be correlated with the ability of ophiobolin A to inhibit
cell division. At a threshold concentration (5 μM in TBY-2
cells, as shown in the present study), ophiobolin A is able to
block cell proliferation without affecting viability. At higher
concentrations (>10 μM), ophiobolin A induces cell death
and displays PCD hallmarks, suggesting that the compound is able to
activate an apoptosis-like process, depending on the applied dose.
In plants, PCD is activated in specific cells during normal
developmental processes or as a consequence of stress (13,31).
Interestingly, PCD is also part of the hypersensitive response
(HR), a defense response activated against pathogens by resistant
plants to block the penetration of pathogens by surrounding them
with a barrier of dead tissue (32). The activation of PCD in tobacco
cells by ophiobolin A suggests the ability to activate defense
responses against ophiobolin-producing fungi, which is consistent
with the fact that dicot plants have been reported to be more
resistant than monocots to Bipolaris spp. (5). In addition, the plant cell wall is
endowed with a plethora of enzymatic systems aimed at degrading
pathogen-produced molecules and using them as signal molecules for
activating HR or other defense responses (33). During biotic stress, the production
of reactive oxygen species (ROS) occurs via the activation of a
plasma membrane NADPH oxidase and/or cell wall enzymes. This ROS
overproduction is used to promote pathogen killing, to strengthen
the cell wall by means of peroxidative crosslinking reactions and
to induce the PCD signaling pathway (30). Among ROS,
H2O2 has been reported as the pivotal signal
molecule because of its ability to cross cell membranes and its
long half-life relative to those of the radical ROS (34). Consistently, a biphasic production
of H2O2 characterizes HR, with the first peak
occurring very early after infection, before any morphological
symptoms of cell death are evident (35). Surprisingly, the ophiobolin
A-dependent PCD was not preceded by any H2O2
production; only a late H2O2 increase was observed after
the death process was already well evident. Recently, an uncommon
model of PCD has been demonstrated to be induced by fumonisin B1
and AAL toxin, which are mycotoxins produced by phytopathogenic
fungi; in this case, it has been demonstrated that PCD activation
was not dependent on H2O2 production
(36). As these molecules are not
chemically related to ophiobolin A and because they are both
produced by phytopathogenic fungi, our data suggest that
H2O2-independent PCD could be a plant
response to pathogens that occur with a certain frequency. Further
studies are required to identify the signaling pathway leading to
this H2O2-independent PCD.
The fact that plant cells are less sensitive than
mammalian cells to the growth-inhibitory effects of ophiobolin A,
at least in vitro, could be related to two facts: i) when
their viability is not affected, plant cells appear to be able to
degrade ophiobolin A, while mammalian cells cannot, and ii) plant
cells have been reported to be more resistant to apoptosis-inducing
stimuli than mammalian cells (37).
Ophiobolin A was described as an apoptosis-inducer
in leukemia cells (38) and more
recently, this feature was observed for ophiobolin O in MCF-7
mammary cancer cells (8). Both
leukemia and MCF-7 mammary cancer cells are highly sensitive to
pro-apoptotic stimuli. In addition, in the four cancer cell lines
examined here, the IC50 growth inhibitory concentrations
were in the same range as those reported in the literature for the
ovarian cancer cell line OVCAR3 (6). An interesting feature revealed by the
present study is that, of the four cancer cell lines analyzed, the
A549 NSCLC and the SKMEL-28 melanoma cell lines displayed various
levels of resistance to pro-apoptotic stimuli (39), while the human Hs683
oligodendroglioma (40) and the
mouse B16F10 melanoma (41) cell
lines displayed actual sensitivity to pro-apoptotic stimuli. No
differences in the sensitivity to ophiobolin A were observed
between these four cancer cell lines in the MTT assay colorimetric
(Table II); it is therefore
unlikely that ophiobolin A would mainly exert its growth-inhibitory
effects through pro-apoptotic signals in all of these cancer cell
lines. Accordingly, we performed flow cytometry analyses of
ophiobolin A-induced apoptosis in human cancer cell lines and we
indeed observed that ophiobolin A at IC50 concentrations
induced only weak, if any, pro-apoptotic signals (data not shown).
Furthermore, the efficiency of ophiobolin A in terms of
growth-inhibitory activity remained similar to that of HCT-116
colon cancer cells that display either functional or deficient p53
(Fig. 5D).
While ophiobolin A induces cytotoxic effects in
cancer cells after 72 h (Fig. 4A),
it is not a substrate for MDR-related efflux pumps. We used a panel
of MDR cancer cell lines exhibiting numerous MDR phenotypes,
including the resistant HL60 leukemia cell line that is associated
with the ABCC1, ABCB1 and ABCG2 MDR phenotypes (23,25)
and the resistant GLC-4 cell line associated with the ABBC1 (MRP1)
and LRP MDR phenotypes (25).
Ophiobolin A has already been shown to exert weak but nevertheless
significant inhibitory effects on P-glycoprotein-mediated
transports of drugs (42).
An in vitro interaction of ophiobolin A with
maize calmodulin has been reported, which supports the hypothesis
that the latter could be the target for ophiobolin A in plant cells
(43,44). Calmodulin, which acts as a
regulator of cell cycle progression, is the principal
Ca2+ sensor in eukaryotes and is essential for the
activation of the cell cycle machinery involved in cell cycle
progression (45). The
concentration of ophiobolin A required to reach the half-maximal
inhibition of calmodulin-dependent cyclic nucleotide
phosphodiesterase activity is ∼10 μM (43), which is a lethal dose for the plant
cells used in the present study. In addition, the concentration
required for in vitro experiments to reach 50% of the
maximum inhibition of the calmodulin-dependent pathways (10
μM) (43) is much higher
than either the IC50 growth inhibitory concentrations
observed in cancer cells (0.3–0.6 μM) or the concentration
that completely blocks plant cell growth (<5 μM). More
detailed studies are required to determine whether the responses
triggered by ophiobolin A in mammalian and plant cells could be
closely related to the inhibitory activity of the toxin toward
calmodulin.
The fact that ophiobolin A is not a simple
poisonous fungal metabolite is evidenced by its ability to increase
the survival of mice bearing very aggressive lung pseudometastases,
even though the experimental schedule and dosing used to assay the
ophiobolin A-mediated in vivo antitumor effects were not
optimized because of the limited amounts of the compound that were
available. These data are encouraging because the B16F10 melanoma
model displays a limited response (e.g., no single mouse can be
cured) to potent anticancer agents, including temozolomide,
cisplatin, adriamycin, irinotecan and taxol (29).
In conclusion, ophiobolin A is a fungal metabolite
that has been considered to be a phytotoxin for decades. The
present study indeed shows that ophiobolin A causes tobacco plant
cell death at certain concentrations but decreases only tobacco
plant cell proliferation, not viability, at lower concentrations.
The capacity of ophiobolin A to affect either plant cell
proliferation or plant viability, according to its concentration,
makes it an interesting tool for the study of the different
responses of the plant-microorganism interaction. Moreover, this
study reports additional evidence supporting the hypothesis that
H2O2 production might not be implicated in
all types of plant PCD.
Mammalian cancer cells appear to be more sensitive
to the ophiobolin A-induced growth-inhibitory effects in
vitro and this fungal metabolite displays antitumor activity
in vivo for mice bearing lung pseudometastases. While the
growth-inhibitory effects mediated by ophiobolin A in plant cells
seem related to the activation of apoptotic processes, in mammalian
cancer cells, ophiobolin A treatment causes similar activity in
both apoptosis-sensitive and apoptosis-resistant cancer cells and
also in cancer cells displaying various MDR phenotypes. Current
investigations aimed at deciphering the mechanisms of action
through which ophiobolin A exerts its anticancer effects are
ongoing.
Abbreviations:
|
CTAB
|
hexadecyltrimethylammonium
bromide;
|
|
DHR
|
dihydrorhodamine;
|
|
EI-MS
|
electron ionization mass
spectrometry;
|
|
ESI-MS
|
electrospray ionization mass
spectrometry;
|
|
HPLC
|
high-performance liquid
chromatography;
|
|
HR
|
hypersensitive response;
|
|
MDR
|
multidrug resistance;
|
|
LC-MS
|
liquid chromatography-mass
spectroscopy;
|
|
MEM
|
minimal essential media;
|
|
MTT
|
3-(4,5-dimethylthiazol-2-yl)-2,5-diphenyltetrazolium bromide;
|
|
NMR
|
nuclear magnetic resonance;
|
|
NSCLC
|
non-small cell lung cancer;
|
|
OD
|
optical density;
|
|
PCD
|
programmed cell death;
|
|
PCV
|
package cell volume;
|
|
SD
|
standard deviation;
|
|
TBY-2
|
Nicotiana tabacum L. cv.
Bright-Yellow 2;
|
|
TLC
|
thin layer chromatography
|
Acknowledgements
Esther Novo-Uzal received a grant
from the Fundación Barrié de la Maza, Spain. Marina Bury holds a
grant from the FRIAFNRS (Fonds National de la Recherche
Scientifique, Belgium) and Robert Kiss, a director of research with
the FNRS. The authors warmly thank Françoise Herphelin and Thierry
Gras for their excellent technical contributions to the
keratinocyte and cancer cell culture processes, respectively.
References
|
1.
|
Au TK, Chick WSH and Leung PC: The biology
of ophiobolins. Life Sci. 67:733–742. 2000. View Article : Google Scholar
|
|
2.
|
Canonica L, Fiecchi A, Kienle MG and Scala
A: The constitution of cochliobolin. Tetrahedron Lett.
11:1211–1218. 1966. View Article : Google Scholar
|
|
3.
|
Nozoe S, Morisaki M, Tsuda K, Takahashi N,
Tamura S, Ishibashi K and Shirasaka M: The structure of ophiobolin,
a C25 terpenoid having a novel skeleton. J Am Chem Soc.
87:4968–4970. 1965. View Article : Google Scholar : PubMed/NCBI
|
|
4.
|
Arai M, Niikawa H and Kobayashi M:
Marine-derived sesterterpenes, ophiobolins, inhibit biofilm
formation of Mycobacterium species. J Nat Med. 67:271–275.
2013. View Article : Google Scholar : PubMed/NCBI
|
|
5.
|
Evidente A, andolfi A, Cimmino A, Vurro M,
Fracchiolla M and Charudattan R: Herbicidal potential of
ophiobolins produced by Drechslera gigantea. J Agric Food
Chem. 54:1779–1783. 2006. View Article : Google Scholar : PubMed/NCBI
|
|
6.
|
De Vries-van Leeuwen IJ,
Kortekaas-Thijssen C, Nzigou Mandouckou JA, Kas S, Evidente A and
de Boer AH: Fusicoccin-A selectively induces apoptosis in tumor
cells after interferon-alpha priming. Cancer Lett. 293:198–206.
2010.PubMed/NCBI
|
|
7.
|
Shen X, Krasnoff SB, Lu SW, Dunbar CD,
O'Neal J, Turgeon BG, Yoder OC, Gibson DM and Hamann MT:
Characterization of 6-epi-3-anhydroophiobolin B from
Cochliobolus heterostrophus. J Nat Prod. 62:895–897.
1999.
|
|
8.
|
Yang T, Lu Z, Meng L, Wei S, Hong K, Zhu W
and Huang C: The novel agent ophiobolin O induces apoptosis and
cell cycle arrest of MCF-7 cells through activation of MAPK
signaling pathways. Bioorg Med Chem Lett. 22:579–585. 2012.
View Article : Google Scholar : PubMed/NCBI
|
|
9.
|
Nagata T, Nemoto Y and Hasezawa S: Tobacco
BY-2 cell line as the ‘HeLa’ cell in the cell biology of higher
plants. Int Rev Cytol. 132:1–30. 1992.
|
|
10.
|
Vacca RA, de Pinto MC, Valenti D,
Passerella S, Marra E and De Gara L: Reactive oxygen species
production, impairment of glucose oxidation and cytosolic ascorbate
peroxidase are early events in heat-shock-induced programmed cell
death in tobacco BY-2 cells. Plant Physiol. 134:1100–1112. 2004.
View Article : Google Scholar
|
|
11.
|
Pellny TK, Locato V, Vivancos PD, Markovic
J, De Gara L, Pallardó FV and Foyer CH: Pyridine nucleotide cycling
and control of intracellular redox state in relation to poly
(ADP-ribose) polymerase activity and nuclear localization of
glutathione during exponential growth of Arabidopsis cells in
culture. Mol Plant. 2:442–456. 2009. View Article : Google Scholar
|
|
12.
|
Locato V, Balestrazzi A, De Gara L and
Carbonera D: Reduced expression of top1b gene induces
programmed cell death and alters ascorbate metabolism in Daucus
carota cultured cells. J Exp Bot. 57:1667–1676. 2006.
|
|
13.
|
Locato V, Gadaleta C, De Gara L and de
Pinto MC: Production of reactive species and modulation of
antioxidant network in response to heat shock: a critical balance
for cell fate. Plant Cell Environ. 31:1606–1619. 2008. View Article : Google Scholar : PubMed/NCBI
|
|
14.
|
Houot V, Etienne P, Petitot AS, Barbier S,
Blein JP and Suty L: Hydrogen peroxide induces programmed cell
death features in cultured tobacco BY-2 cells in a dose-dependent
manner. J Exp Bot. 52:1721–1730. 2001. View Article : Google Scholar : PubMed/NCBI
|
|
15.
|
Edwards K, Johnstone C and Thompson A: A
simple and rapid method for the preparation of plant genomic DNA
for PCR analysis. Nucleic Acids Res. 19:13491991. View Article : Google Scholar : PubMed/NCBI
|
|
16.
|
de Pinto MC, Paradiso A, Leonetti P and De
Gara L: Hydrogen peroxide, nitric oxide and cytosolic ascorbate
peroxidase at the crossroad between defense and cell death. Plant
J. 48:784–795. 2006.PubMed/NCBI
|
|
17.
|
Royall JA and Ischiropoulos H: Evaluation
of 2′,7′-dichlorofluorescin and dihydrorhodamine 123 as fluorescent
probes for intracellular H2O2 in cultured
endothelial cells. Arch Biochem Biophys. 302:348–355. 1993.
|
|
18.
|
Le Calvé B, Lallemand B, Perrone C,
Lenglet G, Depauw S, Van Goietsenoven G, Bury M, Vurro M, Herphelin
F, andolfi A, Zonno MC, Mathieu V, Dufrasne F, Van Antwerpen P,
Poumay Y, David-Cordonnier MH, Evidente A and Kiss R: In vitro
anti-cancer activity, toxicity and structure-activity relationships
of phyllostictine A, a natural oxazatricycloalkenone produced by
the fungus Phyllosticta cirsii. Toxicol Appl Pharmacol. 254:8–17.
2011.
|
|
19.
|
Atanasova G, Jans R, Zhelev N, Mitev V and
Poumay Y: Effects of the cyclin-dependent kinase inhibitor CYC202
(R-roscovitine) on the physiology of cultured human keratinocytes.
Biochem Pharmacol. 70:824–836. 2005. View Article : Google Scholar : PubMed/NCBI
|
|
20.
|
Minner F, Herphelin F and Poumay Y:
Epidermal cells methods and protocols. Methods in Molecular
Biology. 2nd edition. Turksen K: Humana Press; New York, NY: 585.
pp. 71–82. 2010, PubMed/NCBI
|
|
21.
|
Janssen T, Darro F, Petein M, Raviv G,
Pasteels JL, Kiss R and Schulman CC: In vitro characterization of
prolactin-induced effects on proliferation in the neoplastic LNCaP,
DU145 and PC-3 models of the human prostate. Cancer. 77:144–149.
1996. View Article : Google Scholar : PubMed/NCBI
|
|
22.
|
McGrath T and Center MS: Mechanisms of
multidrug resistance in HL60 cells: evidence that a surface
membrane protein distinct from P-glycoprotein contributes to
reduced cellular accumulation of drug. Cancer Res. 48:3959–3963.
1988.
|
|
23.
|
Heffeter P, Pongratz M, Steiner E, Chiba
P, Jakupec MA, Elbling L, Marian B, Körner W, Sevelda F, Micksche
M, Keppler BK and Berger W: Intrinsic and acquired forms of
resistance against the anticancer ruthenium compound KP1019
(indazolium trans-[tetrachlorobis(1H-indazole)ruthenate (III)
(FFC1A4)). J Pharmacol Exp Ther. 312:281–289. 2005.PubMed/NCBI
|
|
24.
|
Zijlstra JG, de Vries EG and Mulder NH:
Multifactorial drug resistance in an adriamycin-resistant human
small cell lung carcinoma cell line. Cancer Res. 47:1780–1784.
1987.PubMed/NCBI
|
|
25.
|
Heffeter P, Jakupec MA, Korner W, Chiba P,
Pirker C, Dornetshuber R, Elbling L, Sutterlüty H, Micksche M,
Keppler BK and Berger W: Multidrug-resistant cancer cells are
preferential targets of the new antineoplastic lanthanum compound
KP772 (FFC24). Biochem Pharmacol. 73:1873–1886. 2007. View Article : Google Scholar : PubMed/NCBI
|
|
26.
|
Bunz F, Fauth C, Speicher MR, Dutriaux A,
Sedivy JM, Kinzler KW, Vogelstein B and Lengauer C: Targeted
inactivation of p53 in human cells does not result in aneuploidy.
Cancer Res. 62:1129–1133. 2002.PubMed/NCBI
|
|
27.
|
Delbrouck C, Doyen I, Belot N,
Decaestecker C, Ghanooni R, de Lavareille A, Kaltner H, Choufani G,
Danguy A, Vandenhoven G, Gabius HJ, Hassid S and Kiss R: Galectin-1
is overexpressed in nasal polyps under budesonide and inhibits
eosinophil migration. Lab Invest. 82:147–158. 2002. View Article : Google Scholar : PubMed/NCBI
|
|
28.
|
Mégalizzi V, Mathieu V, Mijatovic T,
Gailly P, Debeir O, De Neve N, Van Damme M, Bontempi G, Haibe-Kains
B, Decaestecker C, Kondo Y, Kiss R and Lefranc F: 4-IBP, a sigma1
receptor agonist, decreases the migration of human cancer cells,
including glioblastoma cells, in vitro and sensitizes them in vitro
and in vivo to cytotoxic insults of proapoptotic and proautophagic
drugs. Neoplasia. 9:358–369. 2007.
|
|
29.
|
Mathieu V, Le Mercier M, De Neve N,
Sauvage S, Gras T, Roland I, Lefranc F and Kiss R: Galectin-1
knockdown increases sensitivity to temozolomide in a B16F10 mouse
metastatic melanoma model. J Invest Dermatol. 127:2399–2410. 2007.
View Article : Google Scholar : PubMed/NCBI
|
|
30.
|
de Pinto MC, Locato V and De Gara L: Redox
regulation in plant programmed cell death. Plant Cell Environ.
35:234–244. 2012.PubMed/NCBI
|
|
31.
|
Paradiso A, de Pinto MC, Locato V and De
Gara L: Galactone-γ-lactone-dependent ascorbate biosynthesis alters
wheat kernel maturation. Plant Biol. 14:652–658. 2012.
|
|
32.
|
Mur LAJ, Kenton P, Lloyd AJ, Ougham H and
Prats E: The hypersensitive response; the centenary is upon us but
how much do we know? J Exp Botany. 59:501–520. 2008. View Article : Google Scholar : PubMed/NCBI
|
|
33.
|
Dodds PN and Rathjen JP: Plant immunity:
towards an integrated view of plant-pathogen interactions. Nat Rev
Genet. 11:539–548. 2010. View Article : Google Scholar : PubMed/NCBI
|
|
34.
|
Gechev TS and Hille J: Hydrogen peroxide
as a signal controlling plant programmed cell death. J Cell Biol.
168:17–20. 2005. View Article : Google Scholar : PubMed/NCBI
|
|
35.
|
Levine A, Tenhaken R, Dixon R and Lamb C:
H2O2 from the oxidative burst orchestrates
the plant hypersensitive disease resistance response. Cell.
79:583–593. 1994.
|
|
36.
|
Lachaud C, Da Silva D, Amelot N, Béziata
C, Briére C, Cotelle V, Graziana A, Grata S, Mazars C and Thuleau
P: Dihydrosphingosine-induced programmed cell death in tobacco BY-2
cells is independent of H2O2 production. Mol
Plant. 4:310–318. 2011. View Article : Google Scholar : PubMed/NCBI
|
|
37.
|
De Gara L, Locato V, Dipierro S and de
Pinto MC: Redox homeostasis in plants. The challenge of living with
endogenous oxygen production. Respir Physiol Neurobiol. 173(Suppl):
S13–S19. 2010.PubMed/NCBI
|
|
38.
|
Fujiwara H, Matsunaga K, Kumagai H,
Ishizuka M and Ohizumi Y: Ophiobolin A, a novel apoptosis-inducing
agent from fungus Strain f-7438. Pharm Pharmacol Commun. 6:427–431.
2000. View Article : Google Scholar
|
|
39.
|
Shen L, Kondo Y, Ahmed S, Boumber Y,
Konishi K, Guo Y, Chen X, Vilaythong JN and Issa JP: Drug
sensitivity prediction by CpG island methylation profile in the
NCI-60 cancer cell line panel. Cancer Res. 67:11335–11343. 2007.
View Article : Google Scholar : PubMed/NCBI
|
|
40.
|
Dittmann LM, Danner A, Gronych J, Wolter
M, Stühler K, Grzendowski M, Becker N, Bageritz J, Goidts V, Toedt
G, Felsberg J, Sabel MC, Barbus S, Reifenberger G, Lichter P and
Tews B: Downregulation of PRDX1 by promoter hypermethylation is
frequent in 1p/19q-deleted oligodendroglial tumours and increases
radio- and chemosensitivity of Hs683 glioma cells in vitro.
Oncogene. 31:3409–3418. 2012. View Article : Google Scholar : PubMed/NCBI
|
|
41.
|
de Lange J, Ly LV, Lodder K, Verlaan-de
Vries M, Teunisse AF, Jager MJ and Jochemsen AG: Synergistic growth
inhibition based on small-molecule p53 activation as treatment for
intraocular melanoma. Oncogene. 31:1105–1116. 2012.PubMed/NCBI
|
|
42.
|
Yoshida N, Koizumi M, Adachi I and
Kawakami J: Inhibition of P-glycoprotein-mediated transport by
terpenoids contained in herbal medicines and natural products. Food
Chem Toxicol. 44:2033–2039. 2006. View Article : Google Scholar : PubMed/NCBI
|
|
43.
|
Leung PC, Taylor WA, Wang JH and Tipton
CL: Ophiobolin A. A natural product inhibitor of calmodulin. J Biol
Chem. 259:2742–2747. 1984.PubMed/NCBI
|
|
44.
|
Leung PC, Taylor WA, Wang JH and Tipton
CL: Role of calmodulin inhibition in the mode of action of
ophiobolin A. Plant Physiol. 77:303–308. 1985. View Article : Google Scholar : PubMed/NCBI
|
|
45.
|
Kahl CR and Means AR: Regulation of cell
cycle progression by calcium/calmodulin-dependent pathways. Endocr
Rev. 24:719–736. 2003. View Article : Google Scholar : PubMed/NCBI
|