Contents
Introduction
Large-scale datasets from cell line panels
Systematic analysis of multi-level omics and
chemical screening data
Perspectives
Introduction
Cancer cells exhibit varied responses to anticancer
agents (1). Fast high-throughput
determinations of genome-wide genetic alteration, gene expression
and protein regulation patterns in large collection of cancer cell
lines are currently becoming key technologies with which to link
the heterogenic properties of cancer cells to varied drug
responses. The currently available large diverse cancer cell line
collections are considered surrogate systems that can efficiently
represent the complexities of primary tumor samples. Parallel
datasets of common cell line panels have been widely created and
analyzed to identify association patterns between phenotypes (e.g.,
drug responses) and intracellular signatures (e.g., mutations, gene
expression or protein regulation) (2,3).
Several statistical frameworks have been reported for cell line
modeling, and these are mainly focused on fast determinations of
mutational or molecular signatures to explain or predict unexpected
drug responses in cancer subtypes (4,5).
Recent studies have shown that cell line modeling could potentially
predict in vivo anticancer drug responses or optimize target
treatment windows in clinical trials.
The goals of this review are to survey the major
types of cell line-based high-throughput datasets and highlight
their applications in the systematic modeling of selective drug
responses in cancer samples. This review focuses on several
representative types of large datasets, including genotyping, gene
and protein regulation, and chemical screening from well-defined
cancer cell line panels. The major analytical efforts conducted
with these representative datasets will be described, together with
systematic approaches to integrate the multi-level omics and drug
data. We expect that the present review will provide clear insights
into the future impact of in vitro cell line modeling in
translational cancer studies.
Large-scale datasets from cell line
panels
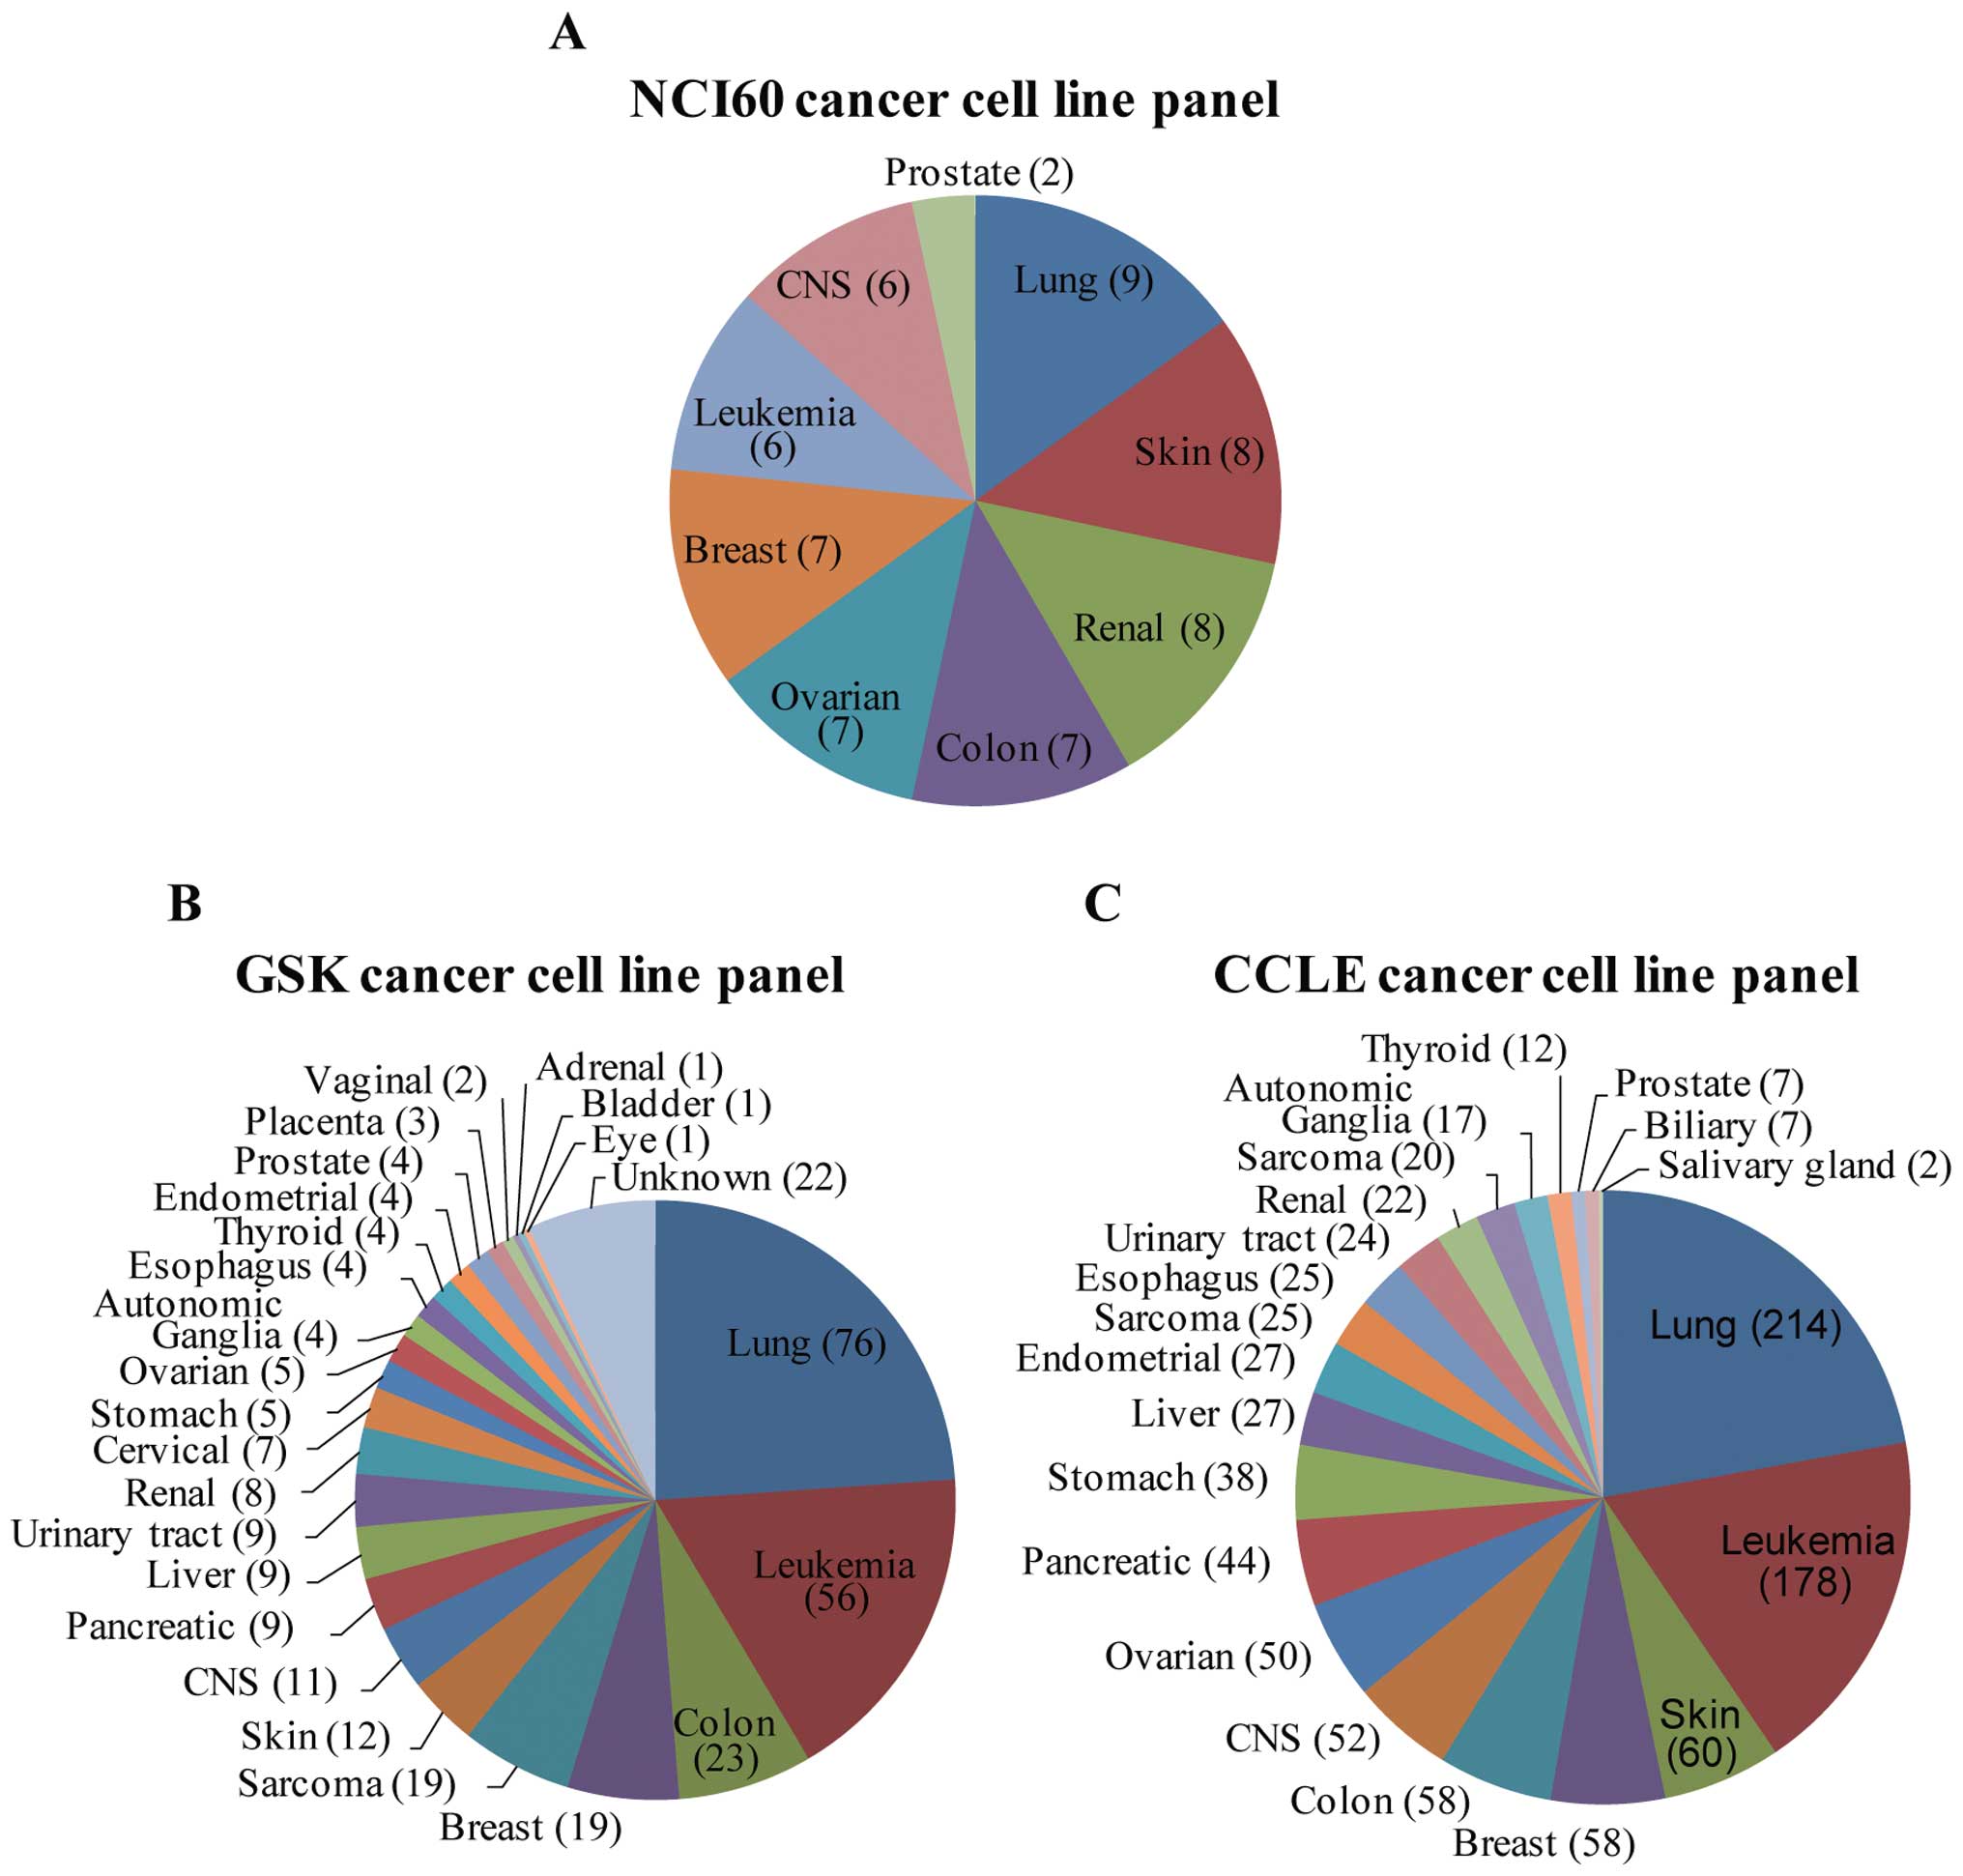
Several cancer cell line panels have been organized
to perform large-scale chemical screening and multi-level omics
data profiling. For example, the National Cancer Institute (NCI)
developed a panel of 60 well-characterized cancer cell lines from
diverse tumor types for the purpose of chemical screening against
heterogeneous cancer subtypes (6).
This panel, the NCI60 cancer cell line panel, includes cell lines
from the 9 most frequent cancer lineage types (Fig. 1A). This panel has long been used as
a standard platform, on which >40,000 chemicals were screened
over the last few decades. Recently, multiple efforts have been
exerted to generate genome-wide genetic variation, transcription
and translational regulation data for the NCI60 cell lines.
Together with these newly created omics data, the large amount of
accumulated chemical screening data from the NCI60 panel are
recognized as valuable resources with which to understand varied
chemical responses and their underlying mechanisms.
More recently, the sizes of cell line panels for
chemical screening and omics data generation have greatly
increased. For example, GlaxoSmithKline (GSK) released various
genomic profiling datasets from a panel of >300 cancer cell
lines that comprised 24 different cancer lineages (Fig. 1B) (7). In particular, cell lines from lung
and leukemia cancers comprised 42% of the panel. In addition to
omics profile data, many important cancer drugs and drug candidates
have been screened against this panel. The extended size of this
cell line panel enables further analyses of drug responses and
cancer signature regulation with regard to cancer subtypes and
detailed genotypes. Another large dataset, The Cancer Cell Line
Encyclopedia (CCLE) is a compilation of genomic profiling and
chemical screening data launched by Novartis and the Broad
Institute (3). This collection of
nearly 1,000 cancer cell lines encompasses 21 cancer types and thus
includes most of the well-characterized cell lines available in
public resources (Fig. 1C). We
expect that the GSK and CCLE datasets will synergize with the
traditional NCI60 datasets with respect to emerging trends in
cancer cell line modeling to facilitate an understanding and
predictions of cancer progression and drug responses. Details of
the current efforts conducted with these three large datasets and
other cell line resources will be described and discussed
below.
Genotype profiling
Genotypic variation among cancer cells is the major
cause of inconsistency in anticancer drug responses. The prospect
of targeted cancer therapies relies mainly on extensive information
on the genetic variations observed in diverse cancer types. Recent
efforts based on high-throughput PCR and sequencing technologies
have generated reliable annotations of genome-wide genetic
alterations in large cancer cell line and tissue sample collections
(8,9). For example, the COSMIC (Catalogue of
Somatic Mutations in Cancer) Sanger database was designed to
provide information on somatic mutations in human cancers (10). All the cancer mutation data were
manually curated from the scientific literature, together with
experimental data from the Cancer Genome Project at the Sanger
Institute. The recent version of the COSMIC database (version 66),
released in July, 2013, describes >1,524,000 coding mutations in
approximately 909,000 cancer samples and contains both patient
tumor samples and most well-known cancer cell lines (Table I). This database provides
well-organized information regarding the established and annotated
somatic mutations as well as previously unknown genetic alterations
in potentially oncogenic factors. The cell line genotypes included
in screening panels such as the GSK and CCLE datasets were, in
practice, retrieved from COSMIC database.
 | Table I.Databases of cancer sample genotype
profiles. |
Table I.
Databases of cancer sample genotype
profiles.
In addition to somatic mutations in coding regions,
SNPs and copy number alterations in cancer cells have been proven
to be of significant importance for understanding of cancer
progression and therapies. For example, cancer subtype-specific SNP
markers or CNA exhibited powerful predictions regarding drug
responses, clinical prognostics and oncogenic factor identification
(11,12). In 2005, whole genome-based SNP and
copy number alteration data were generated from the NCI60 cell
lines (13). These data determined
the genotypes of >124,000 SNP alleles, which can be downloaded
from the NCI DTP website (Table
I). In association studies of these genetic alteration data
from NCI60 cell lines, several reports identified novel cancer
targets (13) and signature genes
responsible for drug sensitivity or resistance (14). Detailed information regarding
genome-wide genetic alteration profiles in multiple cell lines can
be applied to studies of diverse tumorigenic and survival
mechanisms across heterogenic cancer subtypes (15,16).
Furthermore, whole-exome sequencing data were recently released for
the NCI60 cell lines (Table I)
(17). Together with the diverse
genomic variants displayed among the tumor types, 16 cancer genes
were newly discovered during this large-scale exome sequencing.
Furthermore, coding variant- specific drug response profiling
suggested novel hypotheses that were applicable to the
identification of previously unknown pharmacogenomic correlations.
This extensive genotypic information on the NCI60 panel is expected
to play a critical role in interpreting the large amounts of
chemical screening data from the same cell lines.
Gene expression profiling
Gene expression analysis in cancers has provided
considerable information on diagnostic or prognostic marker
signatures and potential drug targets. DNA microarray experiments
have generated substantial transcriptome-wide gene expression
profile information in various cancer samples. A DNA microarray
dataset of the NCI60 cell lines was initially generated to explore
the expression of approximately 8,000 unique genes (Table II) (18). This dataset was applied to analyze
gene expression patterns in cancer type classifications (19). More recently, extensive profiles of
>25,000 genes were generated from the NCI60 cell lines. These
data have been used to predict target gene signatures and identify
unique gene signatures with respect to cancer mechanisms,
regulatory pathways and functional categories (20). We expect that the gene expression
data from NCI60 panel will be useful for identifying gene
signatures of drug sensitivity or resistance.
| Table II.Representative cell line-based
datasets with large gene expression, protein regulation and
chemical screening data profiles. |
Table II.
Representative cell line-based
datasets with large gene expression, protein regulation and
chemical screening data profiles.
| Cell line panel | Data type | Description |
|---|
| NCI60 | Gene expression (DNA
microarray) |
-
Expression profiles of 9703 genes in 60 cell lines
(NCI cDNA array)
-
Expression profiles of 54,613 gene probes in 60 cell
lines (Affymetrix U133 version 2)
|
| Protein expression
and phosphorylation (RPPA experiment) |
-
NCI DTP dataset (RPPA experiment)
-
MDA_class dataset
-
MDA_pilot dataset
|
| Chemical
screening | GI50 of >50,000
chemicals in 60 cell lines |
| CCLEa | Gene expression (DNA
microarray) | Expression profile of
54,613 gene probes on 967 cell lines (Affymetrix U133 v2) |
| Chemical
screening | GI50 of 24
chemicals on 479 cell lines |
| GSKa | Gene expression
(DNA microarray) | Expression profiles
of 54,613 gene probes in 318 cell linesb (Affymetrix U133 version
2) |
| Protein expression
and phosphorylation (RPPA experiment) | Profiles of 115
proteins in 170 cell lines (77 expression and 38
phospho-antibodies) |
| Chemical
screening |
-
GI50 of 19 drugs and drug candidates in 311 cell
lines
-
GI50 of 14 kinase inhibitors in 500 cell lines
|
| CGPa | Chemical
screening | GI50 of 130
chemicals in 639 cell lines |
Cancer transcriptome expression profiles were also
generated for the GSK and CCLE cell lines. The GSK dataset includes
gene expression data for >300 cell lines, each in triplicate,
thus providing a robust statistical analysis (7) (Table
II). This dataset enabled many different types of association
studies such as those of subtype- or mutation-dependent gene
expression patterns in various cancer lineages (1). These association studies revealed
that the expression levels of some drug target genes were
associated with previously unknown mutational status in several
lineage groups. The CCLE cell line panel microarray dataset was
analyzed in combination with genotype profiling and chemical
screening data (3) (Table II). During this combined analysis,
the AHR gene was identified as a predictor of mutation-based drug
sensitivity. AHR gene expression was associated with sensitivity to
a MEK inhibitor in NRAS-mutant cells. This facilitated the
establishment of a preclinical cancer cell line model (3). The GSK and CCLE panels include large
numbers of cell lines, thus enabling sub-classifications of cancer
lineages and mutation types in statistical analyses. Clearly,
transcriptome data from GSK and CCLE will be applied to a
systematic understanding of cancer progression and drug responses
in diverse genetic backgrounds.
Protein expression and activation
profiling
Although large-scale gene expression studies have
yielded useful information for cancer biomarker identification and
targeted cancer therapy development, high-throughput protein
expression and activation level screening are required in order to
better understand cellular signaling in the contexts of
tumorigenesis and drug response. Reverse-phase protein array (RPPA)
technologies, which are based on sample spot arrays for specific
antibody reactions, allow fast, quantitative measurements of
protein expression or phosphorylation in a large cancer sample
panel (21). More than 200 general
expression or phospho-antibodies for major cancer signaling
molecules have been used to develop an HTS-format RPPA experiment.
Several studies have shown that RPPA technology can effectively map
intracellular signaling networks in various cancer sample panels,
including the NCI60 (4) and GSK
(1) panels (Table II). RPPA datasets that were
generated from the NCI60 panel demonstrated an association between
cancer subtypes and particular protein expression or
phosphorylation patterns and thus provided new insights into
subtype-specific signaling networks. The RPPA data revealed 5 major
clusters of cell lines and 5 principal proteomic signatures. Cell
lines with PTEN, PIK3CA, BRAF and APC mutations were found to be
significantly associated with proteomic clusters (4). Additionally, RPPA data for >150
cell lines in the GSK panel enabled a mutation-oriented analysis of
protein regulation in cancers (1).
This analysis found that the major signaling network-specific
signatures were well-clustered in a mutation-based cell line
classification. Specifically, the analysis revealed that the MEK1,
MAPK and p90RSK signatures in the MAPK/Erk signaling networks had
distinct regulatory patterns in BRAF-mutant cell lines. The
application of RPPA experiments to target core signaling proteins
in cancers provides unprecedented opportunities for a system-level
understanding of the molecular signaling mechanisms in cancer
progression and drug responses. The increased diversity of
appropriate antibodies for RPPA experiments will further contribute
to cell line modeling technologies, together with transcriptome
data.
Chemical and drug screening - GI50
profiling
A panel of well-characterized cancer cell lines,
exhibiting diverse cancer types and varied genetic alterations,
have provided a platform for chemical screening and prediction of
cancer subtype-specific drug responses. A large number of
anti-cancer agents have been screened on well-defined sets of
cancer cell lines (Table II). The
NCI60 project was the first large-scale and systematic approach to
anticancer chemical screening (22). This project has accumulated GI50
profiles for >50,000 compounds screened against a panel of 60
cell lines. These screening data, together with chemical
structures, are freely available through the project website
(http://dtp.nci.nih.gov/index.html).
This is the largest dataset for studies of structure-activity
relationships between anticancer agents and diverse cancer
subtypes. The COMPARE program is a useful tool with which to search
for compounds with similar patterns of cellular sensitivity in the
NCI60 panel (23). By extensively
using the COMPARE program, it is possible to compare the expression
(or activation) patterns of a gene (or protein) to GI50 data from
60 cell lines (24).
More extensive sets of cell lines, compared to
NCI60, were also used to screen major classes of cancer drugs and
developmental candidates. The dataset provided by McDermott et
al (25) included the GI50
profiles of 14 selective kinase inhibitors against 500 human cancer
cell lines (Table II). This
dataset provided new hypotheses for discoveries of sensitive
genotypes for a given kinase inhibitor, in addition to
lineage-dependent compound responses. The GSK dataset provided
screening data for 19 target-defined compounds against 311 diverse
human cancer cell lines (7)
(Table II). An analysis of this
dataset showed that major cancer genes played critical roles in the
dose-dependent inhibition of cell proliferation by selective kinase
inhibitors (26). An integrated
analysis of these two large datasets distinguished the major cancer
lineages and genotypes that were selectively sensitive to given
kinase inhibitors (1). Another
large-scale drug screening dataset includes 130 anticancer agents
screened against 639 cell lines (Table
II). This dataset was used to identify and develop sensitive
cancer therapeutic biomarkers (27). The CCLE panel was also used to
build a model that showed single and complex gene-drug associations
in order to explain the range of drug sensitivities across cell
lines (3). This model included
screening data for 24 anticancer agents across 479 cancer cell
lines (Table II).
Additionally, in silico molecular modeling
technology, coupled with the increased availability of cell line
screening profiles, has created new opportunities for novel
selective cancer drug design. For example, systematic analyses,
using 2D and/or 3D-structure chemical descriptors, attempted to
accurately classify compounds to predict their varied responses
against diverse cancer cell lines (28). Cell line panels that are annotated
with both genetic alterations and compound screening data provide
an unprecedented surrogate tool for the prediction of compound
sensitivity specific to narrow cancer subtype ranges. The
generation of chemical screening data against large numbers of cell
lines has provided robust statistical analysis for systematic
analyses of the relationships between drug responses and cancer
genetic markers.
Systematic analysis of multi-level omics and
chemical screening data
The availability of diverse datasets from cell line
panels presents new approaches to predictions of drug sensitivity
or resistance that are based on the genetic alteration status,
lineage types and gene or protein markers of the cell lines. Many
attempts have been made to use integrated system-level analyses of
omics and drug response datasets from cell line panels. The NCI60
cell line panel has accumulated large amounts of chemical screening
data, together with multi-level omics data that include genome-wide
genetic alterations, gene expression and protein regulation. Thus,
the NCI60 datasets have been widely used for integrated systematic
analyses of drug responses and cancer progression mechanisms.
Typical association studies with linear correlation patterns
attempted to identify relationships among chemical responses,
genetic alterations, mRNA expression and protein regulation in 60
cell lines (2). Compared to the
chemical response data, observed pattern similarities in omics
datasets can be interpreted as underlying molecular cellular
response mechanisms to the chemicals.
The genotypic variations in cancer cell lines
provide a basis on which to understand variability in chemical
responses and predictive biomarker identification (29). Integrated proteomic data analyses
revealed protein expression or activation signatures that could
explain mutation-specific chemical sensitivity among heterogeneous
cancer cell lines (4). A
‘Connectivity Map’ has been created to quantitatively explain the
connections between genome-wide gene expression patterns and drug
responses in a cell line (5).
Another statistical framework, the cell line enrichment analysis
(CLEA), was introduced to integrate multi-level omics datasets and
chemical screening data from a cell line panel (1). In cases such as the GSK or CCLE
datasets, which included a large number of cell lines, it was
possible to generate significant statistical confidence in
association studies between the datasets by using refined cell line
classification categories such as multiple mutation types or
mutation-lineage combinations. The CLEA study presented many gene
or protein signatures associated with specific chemical responses
in the double mutation or mutation-lineage combination categories
(1). The Cancer Genome Project
(CGP) (27) and CCLE (3) datasets include chemical screening
data against larger cancer cell line panels than NCI60 (Table II). The CGP revealed unexpected
relationships, including the marked sensitivity of Ewing’s sarcoma
cells that harbor EWS-FLI1 gene translocation to PARP inhibitors.
In the case of CCLE, incorporated analyses of drug responses, gene
expression, copy number sequencing and genomic cell line
characterizations were used to identify several novel drug
sensitivity predictors. This system-level integration of cell line
datasets provides new tools for understanding the diversity of
cancer progression and to develop synergistic drug combinations for
target cancer subtypes.
Perspectives
The availability of large-scale, multi-level omics
and chemical screening datasets for well-characterized cell lines
will accelerate system-level studies of cancer progression and the
development of improved therapeutics. In particular, the recent
explosion of genome-wide exome sequencing and RNA sequencing data
further contributes to the refined characterization of diverse
cancer cell lines and better interpretation of chemical screening
data obtained using these lines. The Cancer Genome Atlas (TCGA) is
another exciting project that has extended ideas about cell line
modeling to human cancer tissue samples. An increasingly large
collection of clinical cancer samples are directly used to generate
multi-level omics data, thus revealing a comprehensive landscape of
genetic alterations and transcriptional regulation in each cancer
subtype (30). A recent study
identified de novo sets of genes through a correlation
analysis of gene expression profiles from the NCI60 and TCGA
datasets (31). Together with
patient history information, including drug treatments and
metastases, TCGA datasets have synergistically contributed to cell
line modeling applications for the prediction of drug responses and
molecular signatures in cancers.
Together with systematic cell line modeling using
large omics datasets, RNAi screening data were recently generated
to identify the target genes associated with changes in cancer
phenotypes. For example, a kinome-based shRNA screening study was
performed to determine the mechanism of resistance against BRAF
inhibitors in colon cancers that harbored an activating mutation in
the BRAF oncogene (32). Feedback
EGFR activation, along with BRAF inhibition, was identified as the
key factor behind the resistance. Another shRNA screening study
identified target genes that effectively cooperated with MEK
inhibitors in KRAS-mutant cancers, suggesting a therapeutic
potential for a combination of MEK and BCL-XL inhibitors (33). Integrative analyses of siRNA
screening and proteomic RPPA data from the NCI60 cell lines
revealed diverse kinase signaling network connectivity (34). This approach revealed a novel
interaction between GSK3 and AKT phosphorylation in cancers.
Acknowledgements
This research was supported by
Sookmyung Women’s University Research Grant 1-1203-0226.
References
|
1.
|
Kim N, He N, Kim C, et al: Systematic
analysis of genotype-specific drug responses in cancer. Int J
Cancer. 131:2456–2464. 2012. View Article : Google Scholar : PubMed/NCBI
|
|
2.
|
Bussey KJ, Chin K, Lababidi S, et al:
Integrating data on DNA copy number with gene expression levels and
drug sensitivities in the NCI-60 cell line panel. Mol Cancer Ther.
5:853–867. 2006. View Article : Google Scholar : PubMed/NCBI
|
|
3.
|
Barretina J, Caponigro G, Stransky N, et
al: The Cancer Cell Line Encyclopedia enables predictive modelling
of anticancer drug sensitivity. Nature. 483:603–607. 2012.
View Article : Google Scholar : PubMed/NCBI
|
|
4.
|
Park ES, Rabinovsky R, Carey M, et al:
Integrative analysis of proteomic signatures, mutations, and drug
responsiveness in the NCI 60 cancer cell line set. Mol Cancer Ther.
9:257–267. 2010. View Article : Google Scholar : PubMed/NCBI
|
|
5.
|
Lamb J: The Connectivity Map: a new tool
for biomedical research. Nat Rev Cancer. 7:54–60. 2007. View Article : Google Scholar : PubMed/NCBI
|
|
6.
|
Shoemaker RH, Monks A, Alley MC, et al:
Development of human tumor cell line panels for use in
disease-oriented drug screening. Prog Clin Biol Res. 276:265–286.
1988.PubMed/NCBI
|
|
7.
|
Greshock J, Bachman KE, Degenhardt YY, et
al: Molecular target class is predictive of in vitro response
profile. Cancer Res. 70:3677–3686. 2010. View Article : Google Scholar : PubMed/NCBI
|
|
8.
|
Bignell GR, Huang J, Greshock J, et al:
High-resolution analysis of DNA copy number using oligonucleotide
microarrays. Genome Res. 14:287–295. 2004. View Article : Google Scholar : PubMed/NCBI
|
|
9.
|
Zhao X, Weir BA, LaFramboise T, et al:
Homozygous deletions and chromosome amplifications in human lung
carcinomas revealed by single nucleotide polymorphism array
analysis. Cancer Res. 65:5561–5570. 2005. View Article : Google Scholar
|
|
10.
|
Forbes SA, Bindal N, Bamford S, et al:
COSMIC: mining complete cancer genomes in the Catalogue of Somatic
Mutations in Cancer. Nucleic Acids Res. 39:D945–D950. 2011.
View Article : Google Scholar : PubMed/NCBI
|
|
11.
|
Weir BA, Woo MS, Getz G, et al:
Characterizing the cancer genome in lung adenocarcinoma. Nature.
450:893–898. 2007. View Article : Google Scholar : PubMed/NCBI
|
|
12.
|
Mullighan CG, Goorha S, Radtke I, et al:
Genome-wide analysis of genetic alterations in acute lymphoblastic
leukaemia. Nature. 446:758–764. 2007. View Article : Google Scholar : PubMed/NCBI
|
|
13.
|
Garraway LA, Widlund HR, Rubin MA, et al:
Integrative genomic analyses identify MITF as a lineage survival
oncogene amplified in malignant melanoma. Nature. 436:117–122.
2005. View Article : Google Scholar : PubMed/NCBI
|
|
14.
|
Savas S, Briollais L, Ibrahim-zada I, et
al: A whole-genome SNP association study of NCI60 cell line panel
indicates a role of Ca2+ signaling in selenium
resistance. PLoS One. 5:e126012010. View Article : Google Scholar : PubMed/NCBI
|
|
15.
|
Rantala JK, Edgren H, Lehtinen L, et al:
Integrative functional genomics analysis of sustained polyploidy
phenotypes in breast cancer cells identifies an oncogenic profile
for GINS2. Neoplasia. 12:877–888. 2010.PubMed/NCBI
|
|
16.
|
Cheung HW, Cowley GS, Weir BA, et al:
Systematic investigation of genetic vulnerabilities across cancer
cell lines reveals lineage-specific dependencies in ovarian cancer.
Proc Natl Acad Sci USA. 108:12372–12377. 2011. View Article : Google Scholar
|
|
17.
|
Abaan OD, Polley EC, Davis SR, et al: The
exomes of the NCI-60 panel: a genomic resource for cancer biology
and systems pharmacology. Cancer Res. 73:4372–4382. 2013.PubMed/NCBI
|
|
18.
|
Scherf U, Ross DT, Waltham M, et al: A
gene expression database for the molecular pharmacology of cancer.
Nat Genet. 24:236–244. 2000. View
Article : Google Scholar : PubMed/NCBI
|
|
19.
|
Ross DT, Scherf U, Eisen MB, et al:
Systematic variation in gene expression patterns in human cancer
cell lines. Nat Genet. 24:227–235. 2000. View Article : Google Scholar : PubMed/NCBI
|
|
20.
|
Dan S, Tsunoda T, Kitahara O, et al: An
integrated database of chemosensitivity to 55 anticancer drugs and
gene expression profiles of 39 human cancer cell lines. Cancer Res.
62:1139–1147. 2002.PubMed/NCBI
|
|
21.
|
Spurrier B, Ramalingam S and Nishizuka S:
Reverse-phase protein lysate microarrays for cell signaling
analysis. Nat Protoc. 3:1796–1808. 2008. View Article : Google Scholar : PubMed/NCBI
|
|
22.
|
Zubrod CG: Origins and development of
chemotherapy research at the National Cancer Institute. Cancer
Treat Rep. 68:9–19. 1984.PubMed/NCBI
|
|
23.
|
Paull KD, Shoemaker RH, Hodes L, et al:
Display and analysis of patterns of differential activity of drugs
against human tumor cell lines: development of mean graph and
COMPARE algorithm. J Natl Cancer Inst. 81:1088–1092. 1989.
View Article : Google Scholar : PubMed/NCBI
|
|
24.
|
Deeken JF, Robey RW, Shukla S, et al:
Identification of compounds that correlate with ABCG2 transporter
function in the National Cancer Institute Anticancer Drug Screen.
Mol Pharmacol. 76:946–956. 2009. View Article : Google Scholar : PubMed/NCBI
|
|
25.
|
McDermott U, Sharma SV, Dowell L, et al:
Identification of genotype-correlated sensitivity to selective
kinase inhibitors by using high-throughput tumor cell line
profiling. Proc Natl Acad Sci USA. 104:19936–19941. 2007.
View Article : Google Scholar : PubMed/NCBI
|
|
26.
|
Karaman MW, Herrgard S, Treiber DK, et al:
A quantitative analysis of kinase inhibitor selectivity. Nat
Biotechnol. 26:127–132. 2008. View
Article : Google Scholar : PubMed/NCBI
|
|
27.
|
Garnett MJ, Edelman EJ, Heidorn SJ, et al:
Systematic identification of genomic markers of drug sensitivity in
cancer cells. Nature. 483:570–575. 2012. View Article : Google Scholar : PubMed/NCBI
|
|
28.
|
He N, Wang X, Kim N, Lim JS and Yoon S: 3D
shape-based analysis of cell line-specific compound response in
cancers. J Mol Graph Model. 43:41–46. 2013. View Article : Google Scholar : PubMed/NCBI
|
|
29.
|
Ma Q and Lu AY: Pharmacogenetics,
pharmacogenomics, and individualized medicine. Pharmacol Rev.
63:437–459. 2011. View Article : Google Scholar : PubMed/NCBI
|
|
30.
|
Comprehensive molecular characterization
of clear cell renal cell carcinoma. Nature. 499:43–49. 2013.
View Article : Google Scholar : PubMed/NCBI
|
|
31.
|
Zeeberg BR, Kohn KW, Kahn A, et al:
Concordance of gene expression and functional correlation patterns
across the NCI-60 cell lines and the Cancer Genome Atlas
glioblastoma samples. PLoS One. 7:e400622012. View Article : Google Scholar : PubMed/NCBI
|
|
32.
|
Prahallad A, Sun C, Huang S, et al:
Unresponsiveness of colon cancer to BRAF(V600E) inhibition through
feedback activation of EGFR. Nature. 483:100–103. 2012. View Article : Google Scholar : PubMed/NCBI
|
|
33.
|
Corcoran RB, Cheng KA, Hata AN, et al:
Synthetic lethal interaction of combined BCL-XL and MEK inhibition
promotes tumor regressions in KRAS mutant cancer models. Cancer
Cell. 23:121–128. 2013. View Article : Google Scholar : PubMed/NCBI
|
|
34.
|
Lu Y, Muller M, Smith D, et al: Kinome
siRNA-phosphoproteomic screen identifies networks regulating AKT
signaling. Oncogene. 30:4567–4577. 2011. View Article : Google Scholar : PubMed/NCBI
|