Introduction
Tenosynovial giant cell tumors (TSGCT) usually occur
in tendon sheaths and in the synovia of joints and bursae (1). The tumor is also known under a
variety of other names including pigmented villonodular synovitis
(PVNS) (1,2). TSGCT is more common in women than in
men, may occur at any age, and may be more or less diffuse in
growth pattern (3). The localized
tumors are the most common, they are found predominantly in
fingers, develop slowly over years, and manifest themselves as
small, circumscribed tumors that recur in 10–20% of the cases. Most
diffuse TSGCT are larger than their localized counterparts, occur
in large joints (in particular the knee), have an expansive growth
pattern, and up to 50% recur locally. TSGCT are often moderately
cellular with mononuclear cells, scattered giant cells, xanthoma
cells and some degree of collagenization.
The pathogenetic mechanisms underlying TSGCT have
been debated; some authors see them as inflammatory in nature
(1,4), whereas the predominating view at
present holds that they are neoplastic (2,3,5),
something that also concurs with the opinion held by the original
describers of the entity (6). The
description of TSGCT-like lesions after injection of
pro-inflammatory agents (7) and
the finding of polyclonality in lyonization studies (8,9)
argue for an inflammatory disease mechanism, whereas the finding of
monoclonality in another X-inactivation study (10) as well as the detection of recurrent
clonal chromosomal aberrations (11–15)
suggest a neoplastic pathogenesis. Partly because of the
uncertainty regarding the nature of this disease, the existence of
malignant TSGCT has been questioned, but it seems that such tumors
do exist, rare though they are (16–18).
The preferred treatment for TSGCT is surgery with free margins to
avoid recurrence, and the prognosis is good (3). At present, no adjuvant therapy is
recommended for most lesions.
It seems that over 50% of TSGCT have an abnormal
karyotype, but this can of course be a misrepresentation because
there is a general tendency towards reporting abnormal findings
more often than normal ones (19).
Most TSGCT with chromosomal aberrations are near-diploid or
pseudodiploid and ∼50% carry balanced chromosomal rearrangements.
So far, 28 cases of the diffuse type and 18 localized TSGCT have
been reported with chromosomal aberrations (http://cgap.nci.nih.gov/Chromosomes/Mitelman).
Gains of chromosome 7 and/or chromosome 5 have been the most common
numerical aberrations by karyotyping but only in the diffuse type
of TSGCT. Structural rearrangements preferably involve chromosomal
areas 1p11–13, 2q35–37, and 16q22–24 (14) and two distinct subgroups of TSGCT
can be recognized based on the above-mentioned structural
aberrations: those with 1p11–13 rearrangements and those with
16q22–24 rearrangements. Several translocation partners have
participated in the changes affecting 1p11–13 (http://cgap.nci.nih.gov/Chromosomes/Mitelman) of which
2q35–37 is the most common (14).
These results were confirmed in a study by West et al
(20) who additionally identified
the colony-stimulating factor-1 (CSF1 or M-CSF1)
locus at 1p13 as a molecular target of chromosomal rearrangements
in 20 of 23 TSGCT. Chromosome 2 was the translocation partner in a
subset (3 of 10) of tumors and collagen type VI α-3 (COL6A3)
was then identified as the partner gene involved at 2q37. Moreover,
combined interphase FISH and CSF1 immunohistochemistry demonstrated
that only a minority (2–16%) of the cells in the tumor samples
carried the t(1;2)(p13;q37) and that only those cells expressed
CSF1, while tissue microarray analyses showed that the CSF1
receptor gene CSF1R is highly overexpressed in TSGCT
(20). To explain these findings,
it was suggested that the translocation involving CSF1 and
COL6A3 results in a high level of CSF1 expression in
the neoplastic parenchyma cells, which in turn recruit also
non-neoplastic CSF1R-expressing cells. In the words of West
et al (20): ‘The
CSF1-COL6A3 translocation in TSGCT and PVNS is reminiscent
of the translocation that defines DFSP (dermatofibrosarcoma
protuberans). In this malignancy, t(17;22) brings PDGF-B
under control of the strong COL1A1 promoter. The
posttranslationally processed form of the fusion protein is a fully
functional PDGF-B protein that may stimulate oncogenesis through
its receptor, PDGFRB. The PDGFRB receptor is also
upregulated in DFSP, suggesting an autocrine loop’. Based on the
suggestion that a fusion of these genes through the translocation
would result in overexpression of CSF1 due to a strong
COL6A3 promoter, Möller et al (21) performed RT-PCR on six TSGCT cases
with t(1;2) to search for a putative COL6A3-CSF1 fusion
gene. Such fusion transcripts were detected in three cases and in
one of them it was in-frame. In all cases, however, the breakpoints
in CSF1 appeared downstream of exon 5, indicating that the
amino-terminal part of CSF1, which interacts with its receptor
CSF1R, was not encoded by the identified chimeric transcripts
(21,22). The authors concluded that ‘the
COL6A3-CSF1 fusion transcripts identified in the present
study are unlikely to produce a functional protein containing the
receptor-binding part of CSF1, which is required for the mechanism
described earlier’ (21). In
another study, Cupp et al (23) examined 57 TSGCT/PVNS and in all of
them found expression of CSF1 mRNA and/or CSF1 protein,
including 22 tumors (39%) that lacked a CSF1 translocation,
suggesting that alternative mechanisms may lead to upregulation of
CSF1.
In the present study we performed RNA-sequencing of
three TSGCT in an attempt to elicit more information on the
mechanisms of altered CSF1 expression in this tumor
type.
Materials and methods
Ethics statement
The study was approved by the regional ethics
committee (Regional komité for medisinsk forskningsetikk Sør-Øst,
Norge, http://helseforskning.etikkom.no), and written
informed consent was obtained from the patients.
Patients
Case 1 was a localized TSGCT. Cases 2 and 3 were
both diffuse type tumors and were previously reported (11). Culturing and cytogenetic analysis
were done as previously described (11).
High-throughput paired-end
RNA-sequencing
Total RNA was extracted from the three tumors using
TRIzol reagent according to the manufacturer’s instructions
(Invitrogen, Life Technologies, Oslo, Norway) and its quality was
checked by Experion (Bio-Rad Laboratories, Oslo, Norway). Total RNA
(3 μg) was sent for high-throughput paired-end
RNA-sequencing to the Norwegian Sequencing Centre at Ullevål
Hospital (http://www.sequencing.uio.no/). The Illumina software
pipeline was used to process image data into raw sequencing data
and only sequence reads marked as ‘passed filtering’ were used in
the downstream data analysis. A total of 60 million reads were
obtained. The FASTQC software was used for the quality control of
the raw sequence data (http://www.bioinformatics.babraham.ac.uk/projects/fastqc/).
The software FusionMap and the associated pre-built Human B37 and
RefGene from the FusionMap website were used for the discovery of
fusion transcripts (24), release
date 2012-04-16 (http://www.omicsoft.com/fusionmap/).
PCR and 3′-RACE
The primers used for PCR amplification and
sequencing are listed in Table I.
The Human Universal Reference Total RNA was used as control
(Clontech Laboratories, Takara Bio Group, France). According to the
company’s information it is a ‘mixture of total RNAs from a
collection of adult human tissues, chosen to represent a broad
range of expressed genes. Both male and female donors are
represented’. Expression analysis was performed using the human
cell line MTC panel (Clontech Laboratories, Takara Bio Group),
which contains cDNA from the cell lines Ad5, SKOV-3, Saos2, A431,
Du145, H1299, HeLa, and MCF7.
 | Table I.Primers used for PCR amplifications
and sequencing. |
Table I.
Primers used for PCR amplifications
and sequencing.
| Oligo name | Sequence
(5′→3′) |
|---|
| CSF1-1886F | GCA GCT CCA GGA GTC
TGT CTT CCA C |
| CSF1-2006F | GGA TTC TCC CTT GGA
GCA ACC AGA |
| CSF1-2057F | ACA GGT GGA ACT GCC
AGT GTA GA |
| CSF1-2176R | AGC TCT GGT GGA GGG
CAG ACC A |
|
CSF1-3end-R1out | ATT CAC AGA CCA ACA
AAT GCT GCC A |
|
CSF1-trans4-2130R | GCT GGG CGT CAC ATT
TTC AGA GG |
|
CSF1-3end-R2out | TGG GAT GTT TGC AGA
ATC CTT GTC A |
|
CSF1-trans1-2123R | GTG GAC GCC CCA TAA
TGT CTC |
|
CSF1-trans4-2120R | CAC ATT TTC AGA GGG
ACA TTG ACA |
|
CSF1-transNew-Rq | ACA CCA TGC TCA TGG
GGT TTA G |
| S100A10-555F | TTC ACA AAT TCG CTG
GGG ATA AAG G |
| S100A10-664R | TCC AGG TCC TTC ATT
ATT TTG TCC |
| S100A10-809R | TAT CAG GGA GGA GCG
AAC TGC TCA T |
| S100A10-840R | GAT TCC TTA AGC GAC
CCT TTG GGA C |
| A3RNV-RACE | ATC GTT GAG ACT CGT
ACC AGC AGA GTC ACG AGA GAG ACT ACA CGG TAC TGG TTT TTT TTT TTT
TTT |
| A3R-1New | TCG TTG AGA CTC GTA
CCA GCA GAG TCA C |
| A3R-2New | GAG TCA CGA GAG AGA
CTA CAC GGT ACT GGT T |
Total RNA (2 μg) was reverse-transcribed in a
20 μl reaction volume using iScript Advanced cDNA Synthesis
kit for RT-qPCR according to the manufacturer’s instructions
(Bio-Rad Laboratories, Oslo, Norway). The cDNA was diluted to 20 ng
equivalent of RNA/μl and 2 μl were used as templates
in subsequent PCR assays. The 25-μl PCR volume contained
12.5 μl of Premix Taq (Takara-Bio), 2 μl of diluted
cDNA (or 2 μl of cDNA from the cDNA panels which corresponds
to 4 ng of cDNA), and 0.4 μM of each of the forward and
reverse primers. The PCRs were run on a C-1000 Thermal cycler
(Bio-Rad Laboratories). The PCR conditions were: an initial
denaturation at 94˚C for 30 sec followed by 35 cycles of 7 sec at
98˚C, 120 sec at 68˚C and a final extension for 5 min at 68˚C.
For detection of the CSF1-S100A10 fusion
transcript the primer set CSF1-1886F/S100A10-840R was used. For the
amplification of the new CSF1 transcript (transcript 5, see
below) the primer set CSF1-1886F/CSF1-3end-R1out was used. For the
amplification of CSF1 transcript 1 (NM_000757) the primer
set CSF1-1886F/CSF1-2176R was used. This primer combination and the
primer set CSF1-2057F and CSF1-trans1-2123R (which is used for
real-time PCR) also detect the transcript variant 2 (NM_172210)
which lacks an alternate in-frame segment in exon 6 compared to
transcript 1, resulting in a shorter isoform b compared to isoform
a. No investigation was done for the expression of transcript 2,
and for simplicity we refer in this report to primer set
CSF1-1886F/CSF1-2176R as amplifying transcript 1 (in reality 1 and
2). For the amplification of CSF1 transcript 4 (NM_172212),
the primer set CSF1-1886F/CSF1-trans4-2130R was used. For
amplification of S100A10 wild-type transcript, the primer
set S100A10-555F/S100A10-840R was used.
For 3′-RACE, 1 μg of total RNA was
reverse-transcribed in a 20 μl reaction volume with the
A3RNV-RACE primer (Table I) using
iScript Select cDNA Synthesis kit according to the manufacturer’s
instructions (Bio-Rad Laboratories). A 1 μl template was
amplified using the outer primer combination CSF1-1886F/A3R-1New.
The amplified products were diluted 1:1,000 and 1 μl of the
diluted amplified PCR product was used as template in nested PCR
with the primers CSF1-2006F/A3R-2New. For both PCRs the 25
μl reaction volume contained 12.5 μl of Premix Taq
(Takara-Bio), template, and 0.4 μM of each of the forward
and reverse primers. PCR cycling consisted of an initial step of
denaturation at 94˚C for 30 sec followed by 35 cycles of 7 sec at
98˚C, 30 sec at 60˚C, 3 min at 72˚C (2 min for nested PCR), and a
final extension for 5 min at 72˚C.
PCR products (4 μl) was stained with GelRed
(Biotium), analyzed by electrophoresis through 1.0% agarose gel and
photographed. The amplified fragments were purified using the
NucleoSpin Gel and PCR clean-up kit (Macherey-Nagel), and direct
sequencing was performed using the light run sequencing service of
GATC Biotech (http://www.gatcbiotech.com/en/sanger-services/lightrun-sequencing.html).
The BLAST (http://blast.ncbi.nlm.nih.gov/Blast.cgi) and BLAT
(http://genome.ucsc.edu/cgi-bin/hgBlat) programs were
used for computer analysis of sequence data.
Real-time PCR
To quantify the expression of CSF1 transcript
1 (NM_000757), CSF1 transcript 4 (NM_172212), the new
CSF1 transcript described here, and the CSF1-S100A10
fusion transcript, SYBR Green-based gene expression real-time PCR
was used. The 20 μl reaction volume contained 1X SsoAdvanced
SYBR Green supermix (Bio-Rad), 0.5 μM of each of the forward
and reverse primers, and 2 μl cDNA (40 ng equivalent of
RNA). Four replicates of each sample were used to ensure
statistical representativity. For CSF1 transcript 1 the
primer set was CSF1-2057F and CSF1-trans1-2123R, for CSF1
transcript 4 the primer set was CSF1-2057F and CSF1-trans4-2120R,
for the newly identified CSF1 transcript 5 the primer set
was CSF1-2057F and CSF1-transNew-Rq, and for the
CSF1-S100A10 fusion transcript the primer set was CSF1-2057F
and S100A10-664R. To evaluate the efficiency of the real-time PCR
reactions, standard curves were generated using serial dilutions of
purified PCR products which were amplified with Premix Taq and the
primer set described above in ‘PCR and 3′-RACE’. To generate
standard curves seven 10-fold dilutions were prepared for each PCR
product starting with 0.1 ng. The efficiency (E), correlation
coefficient (R^2), slope and y-intercept are given in Table II.
| Table II.Standard curve analyses of the
real-time PCR for the quantification of the expression of
CSF1 transcripts 1, 4 and 5, and CSF1-S100A10. |
Table II.
Standard curve analyses of the
real-time PCR for the quantification of the expression of
CSF1 transcripts 1, 4 and 5, and CSF1-S100A10.
| Template (purified
PCR) product |
Gene-transcript | Accession no. | Primer set for
real-time PCR | Efficiency (E
%) | Correlation
coefficient (R^2) | Slope | y-intercept |
|---|
|
CSF1-1886F/CSF1-2176R |
CSF1-transcript 1 | NM_000757 version
5 |
CSF1-2057F/CSF1-trans1-2123R | 107.1 | 0.998 | 3.164 | 29.532 |
|
CSF1-1886F/CSF1-trans4-2130R |
CSF1-transcript 4 | NM_172212 version
2 |
CSF1-2057F/CSF1-trans4-2120R | 98.3 | 0.997 | 3.364 | 29.690 |
|
CSF1-1886F/CSF1-3end-R1out |
CSF1-transcript 5 | - |
CSF1-2057F/CSF1-transNew-Rq | 97.6 | 0.997 | 3.380 | 30.662 |
|
CSF1-1886F/S100A10-840R |
CSF1-S100A10 | - |
CSF1-2057F/S100A10-664R | 110.1 | 0.991 | 3.102 | 29.282 |
Real-time PCR was run on CFX96 Touch™
Real-Time PCR Detection system (Bio-Rad). The thermal cycling
included an initial step at 95˚C for 30 sec, followed by 40 cycles
of 10 sec at 95˚C and 30 sec at 60˚C. Melting curve analysis at the
end of the PCR was performed in order to confirm whether or not a
single product was amplified and that no primer dimers interfered
with the reaction. There was an initial denaturation step at 95˚C
followed by temperature rising from 65 to 95˚C with 0.5˚C increment
for 0.05 sec. The data were analyzed using the Bio-Rad CFX Manager
Software (Bio-Rad).
For quantification of the expression of CSF1
and CSF1R transcript two assays were performed which were
supplied by Applied Biosystems. Assay Hs00174164_m1 was used for
the expression of CSF1. This assay was specific for exon 4/5
boundary and detects all the four reported transcripts of
CSF1 (accession nos. NM_000757, NM_172210, NM_172211 and
NM_172212). Assay Hs00911250_m1 was used for CSF1R end of
the transcript and was specific for exon 20/21 boundary
(NM_005211). The assay Hs99999901_s1 18S (Applied Biosystems) was
used as endogenous control for relative gene expression
quantification. Four replicates of each sample and endogenous
control were again used to ensure statistical representativity. The
20 μl reaction volume contained 1X TaqMan Universal Mix, 1X
20X TaqMan Gene Expression Mix and 2 μl cDNA (40 ng
equivalent of RNA). Real-time PCR was run on CFX96 Touch™ Real-Time
PCR Detection system (Bio-Rad). The thermal cycling included an
initial step at 50˚C for 2 min, followed by 10 min at 95˚C and 40
cycles of 15 sec at 95˚C and 1 min at 60˚C. The data were analyzed
using the Bio-Rad CFX Manager Software (Bio-Rad).
Results
The cytogenetic analysis of case 1 showed that there
were two unrelated abnormal clones:
46,XX,dic(2;13)(q11;p11),der(11)
t(2;11)(q11;p15)[3]/46,XX,r(11)[2]/46,XX[33]. The karyotypes of cases
2 and 3 were reported previously (11). Case 2 had the karyotype
46,XY,t(1;22)(p13;q12)[20], while the karyotype of case 3 was
46,XX,t(1;1)(q21;p11)[9]/47,XX,+7[2]/46,XX[14].
Using the FusionMap on the raw sequencing data
obtained from the Norwegian Sequencing Centre, the
CSF1-S100A10 fusion transcript, ranked 1st with 599 seed
counts, was found in case 3, which carried the translocation
t(1;1)(q21;p11), whereas no CSF1 fusion transcript was found
in the other two tumors. Because CSF1 and S100A10 map
to chromosome bands 1p13.3 and 1q21.3, respectively, we decided to
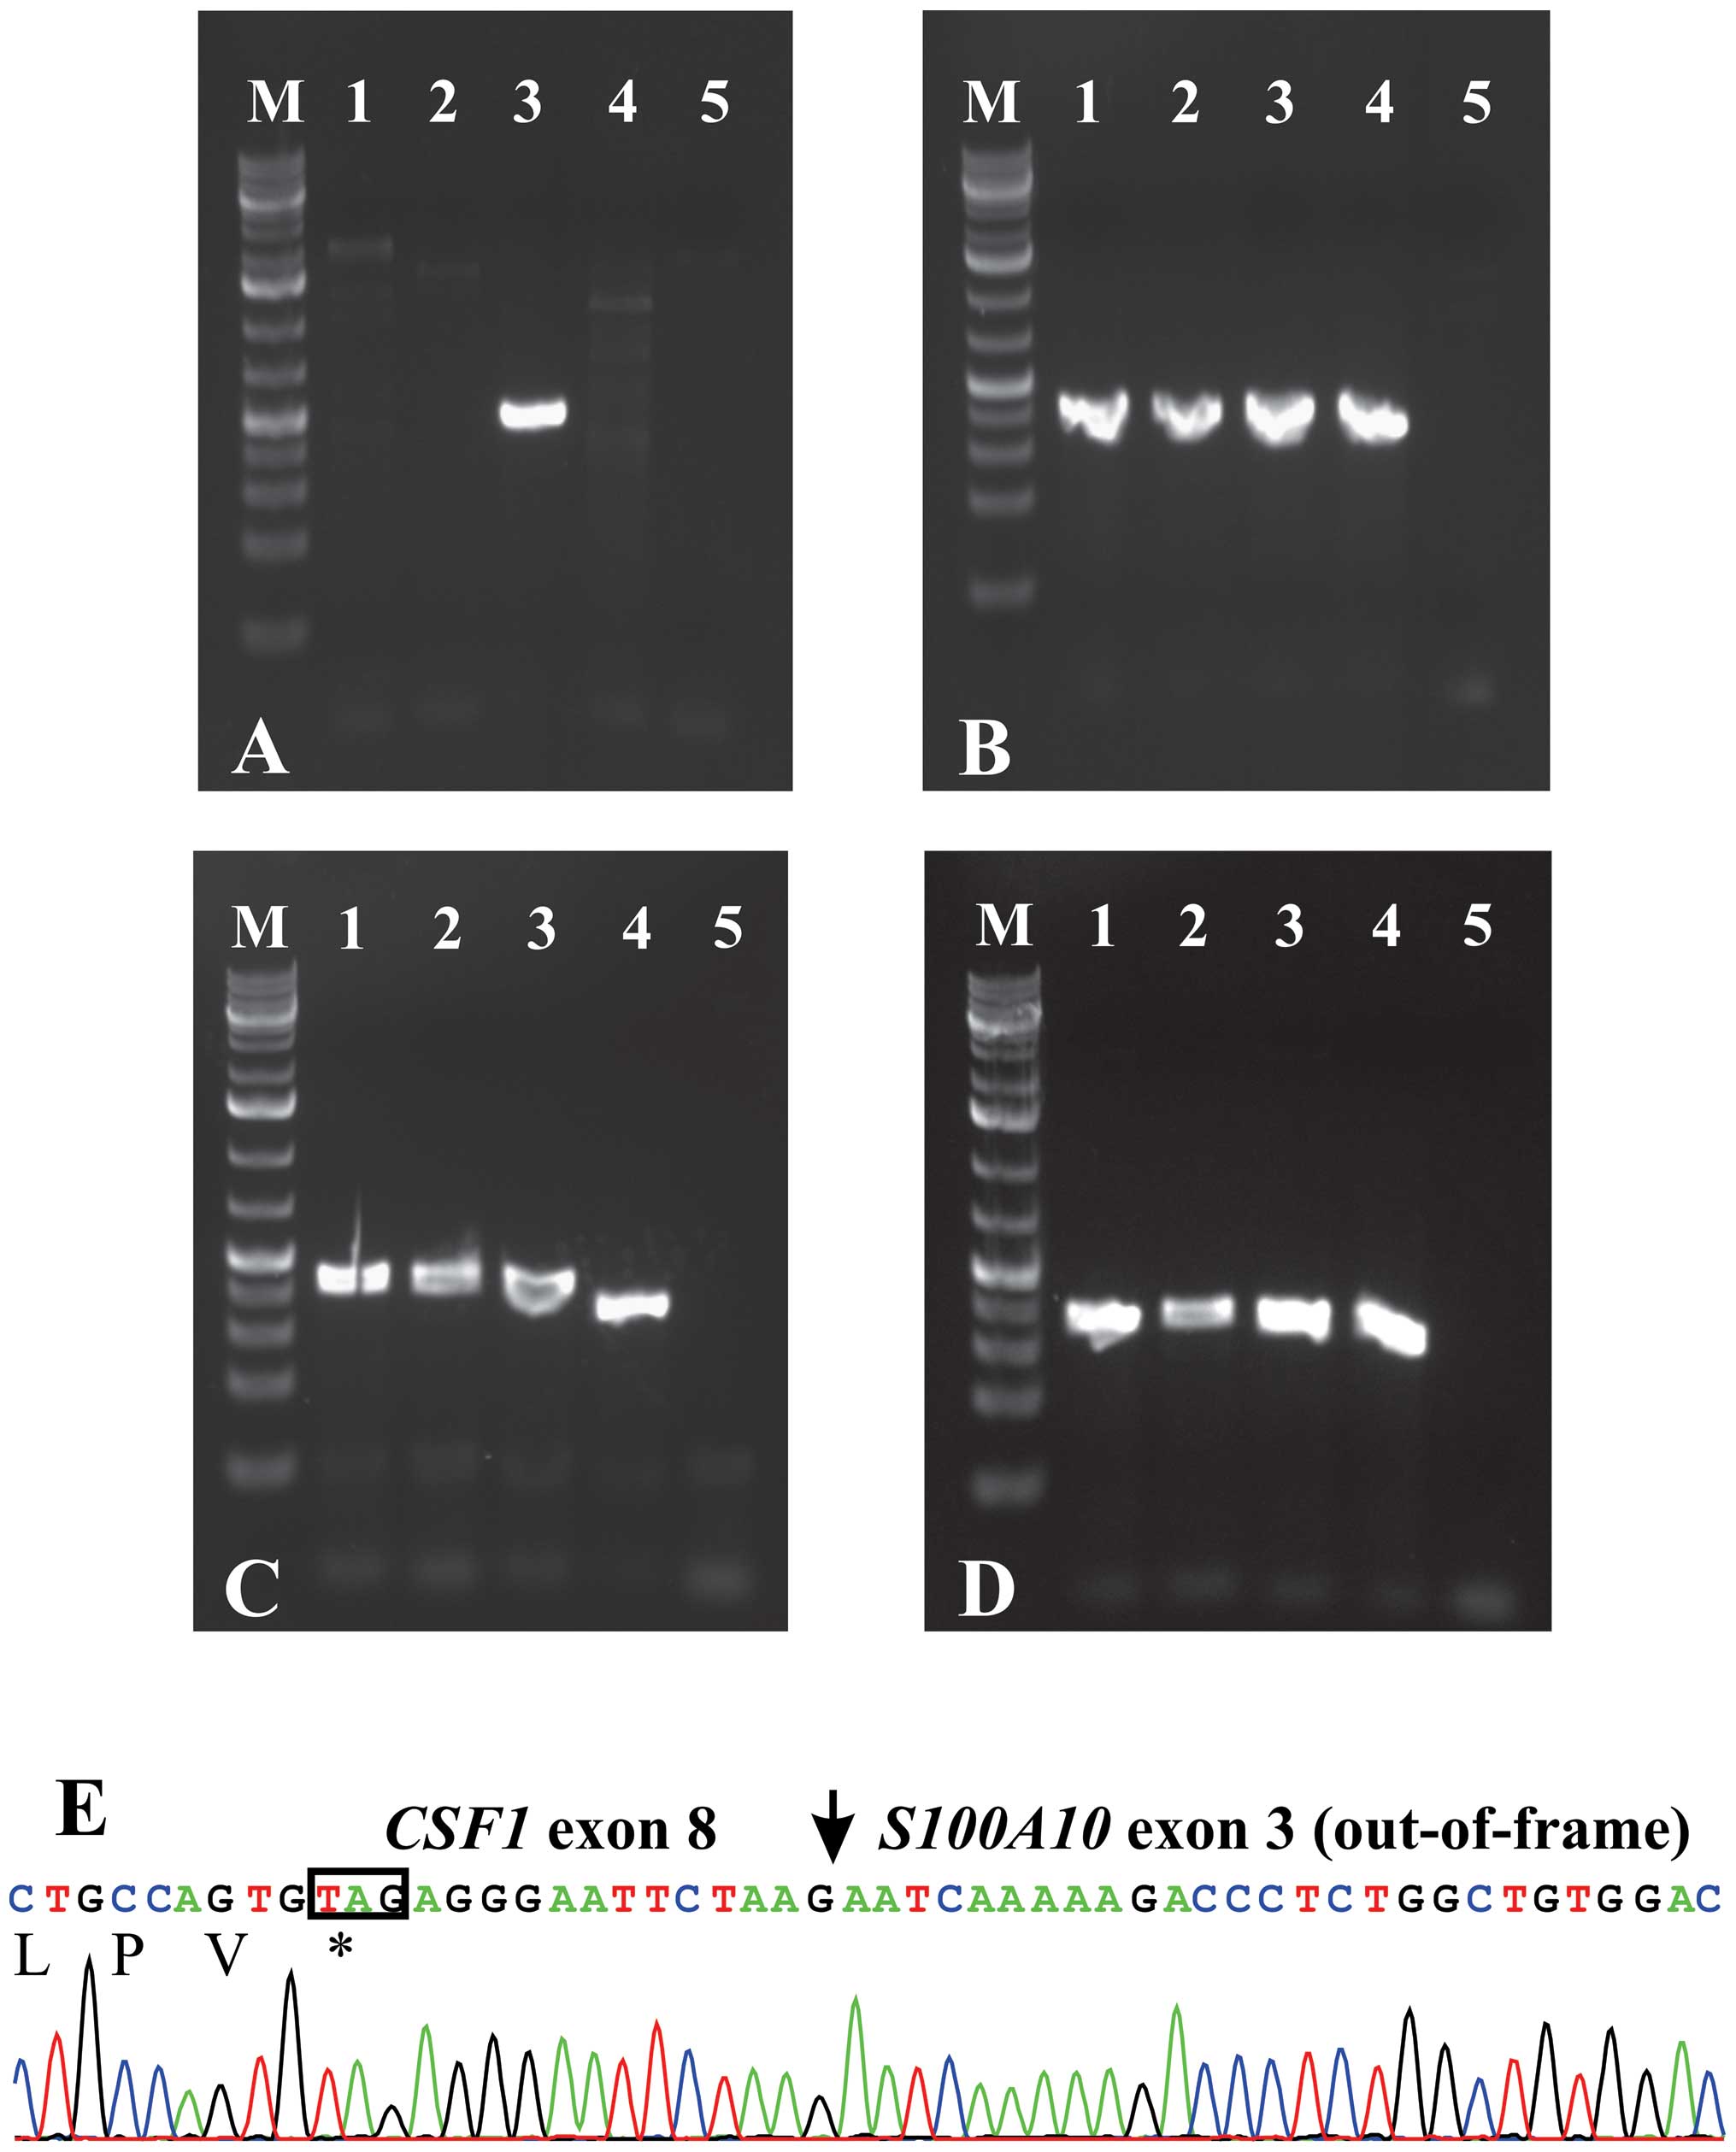
study the CSF1-S100A10 fusion transcript. RT-PCR with the
CSF1-1886F/S100A10-840R primer combination amplified a single cDNA
fragment in case 3, but not in cases 1 and 2 (Fig. 1A). The wild-type S100A10
cDNA, the CSF1 transcript 1 (NM_000757) and the CSF1
transcript 4 (NM_172212) were amplified in all cases (Fig. 1B–D). Sequencing of the fragment
amplified with the CSF1-1886F/S100A10-840R primer combination
showed that exon 8 of CSF1 (nt 2091 in sequence with
accession no. NM_000757 version 5) was fused to exon 3 of
S100A10 (nt 641 in sequence with accession no. NM_002966
version 2) (Fig. 1E).
Because Cupp et al (23) found expression of CSF1 in
all studied TSGCT, including those that lacked the CSF1
translocation, we decided to investigate further the expression of
CSF1 in cases 1 and 2 which did not have CSF1-fusion
transcripts. No other fusion transcripts or genes were examined. We
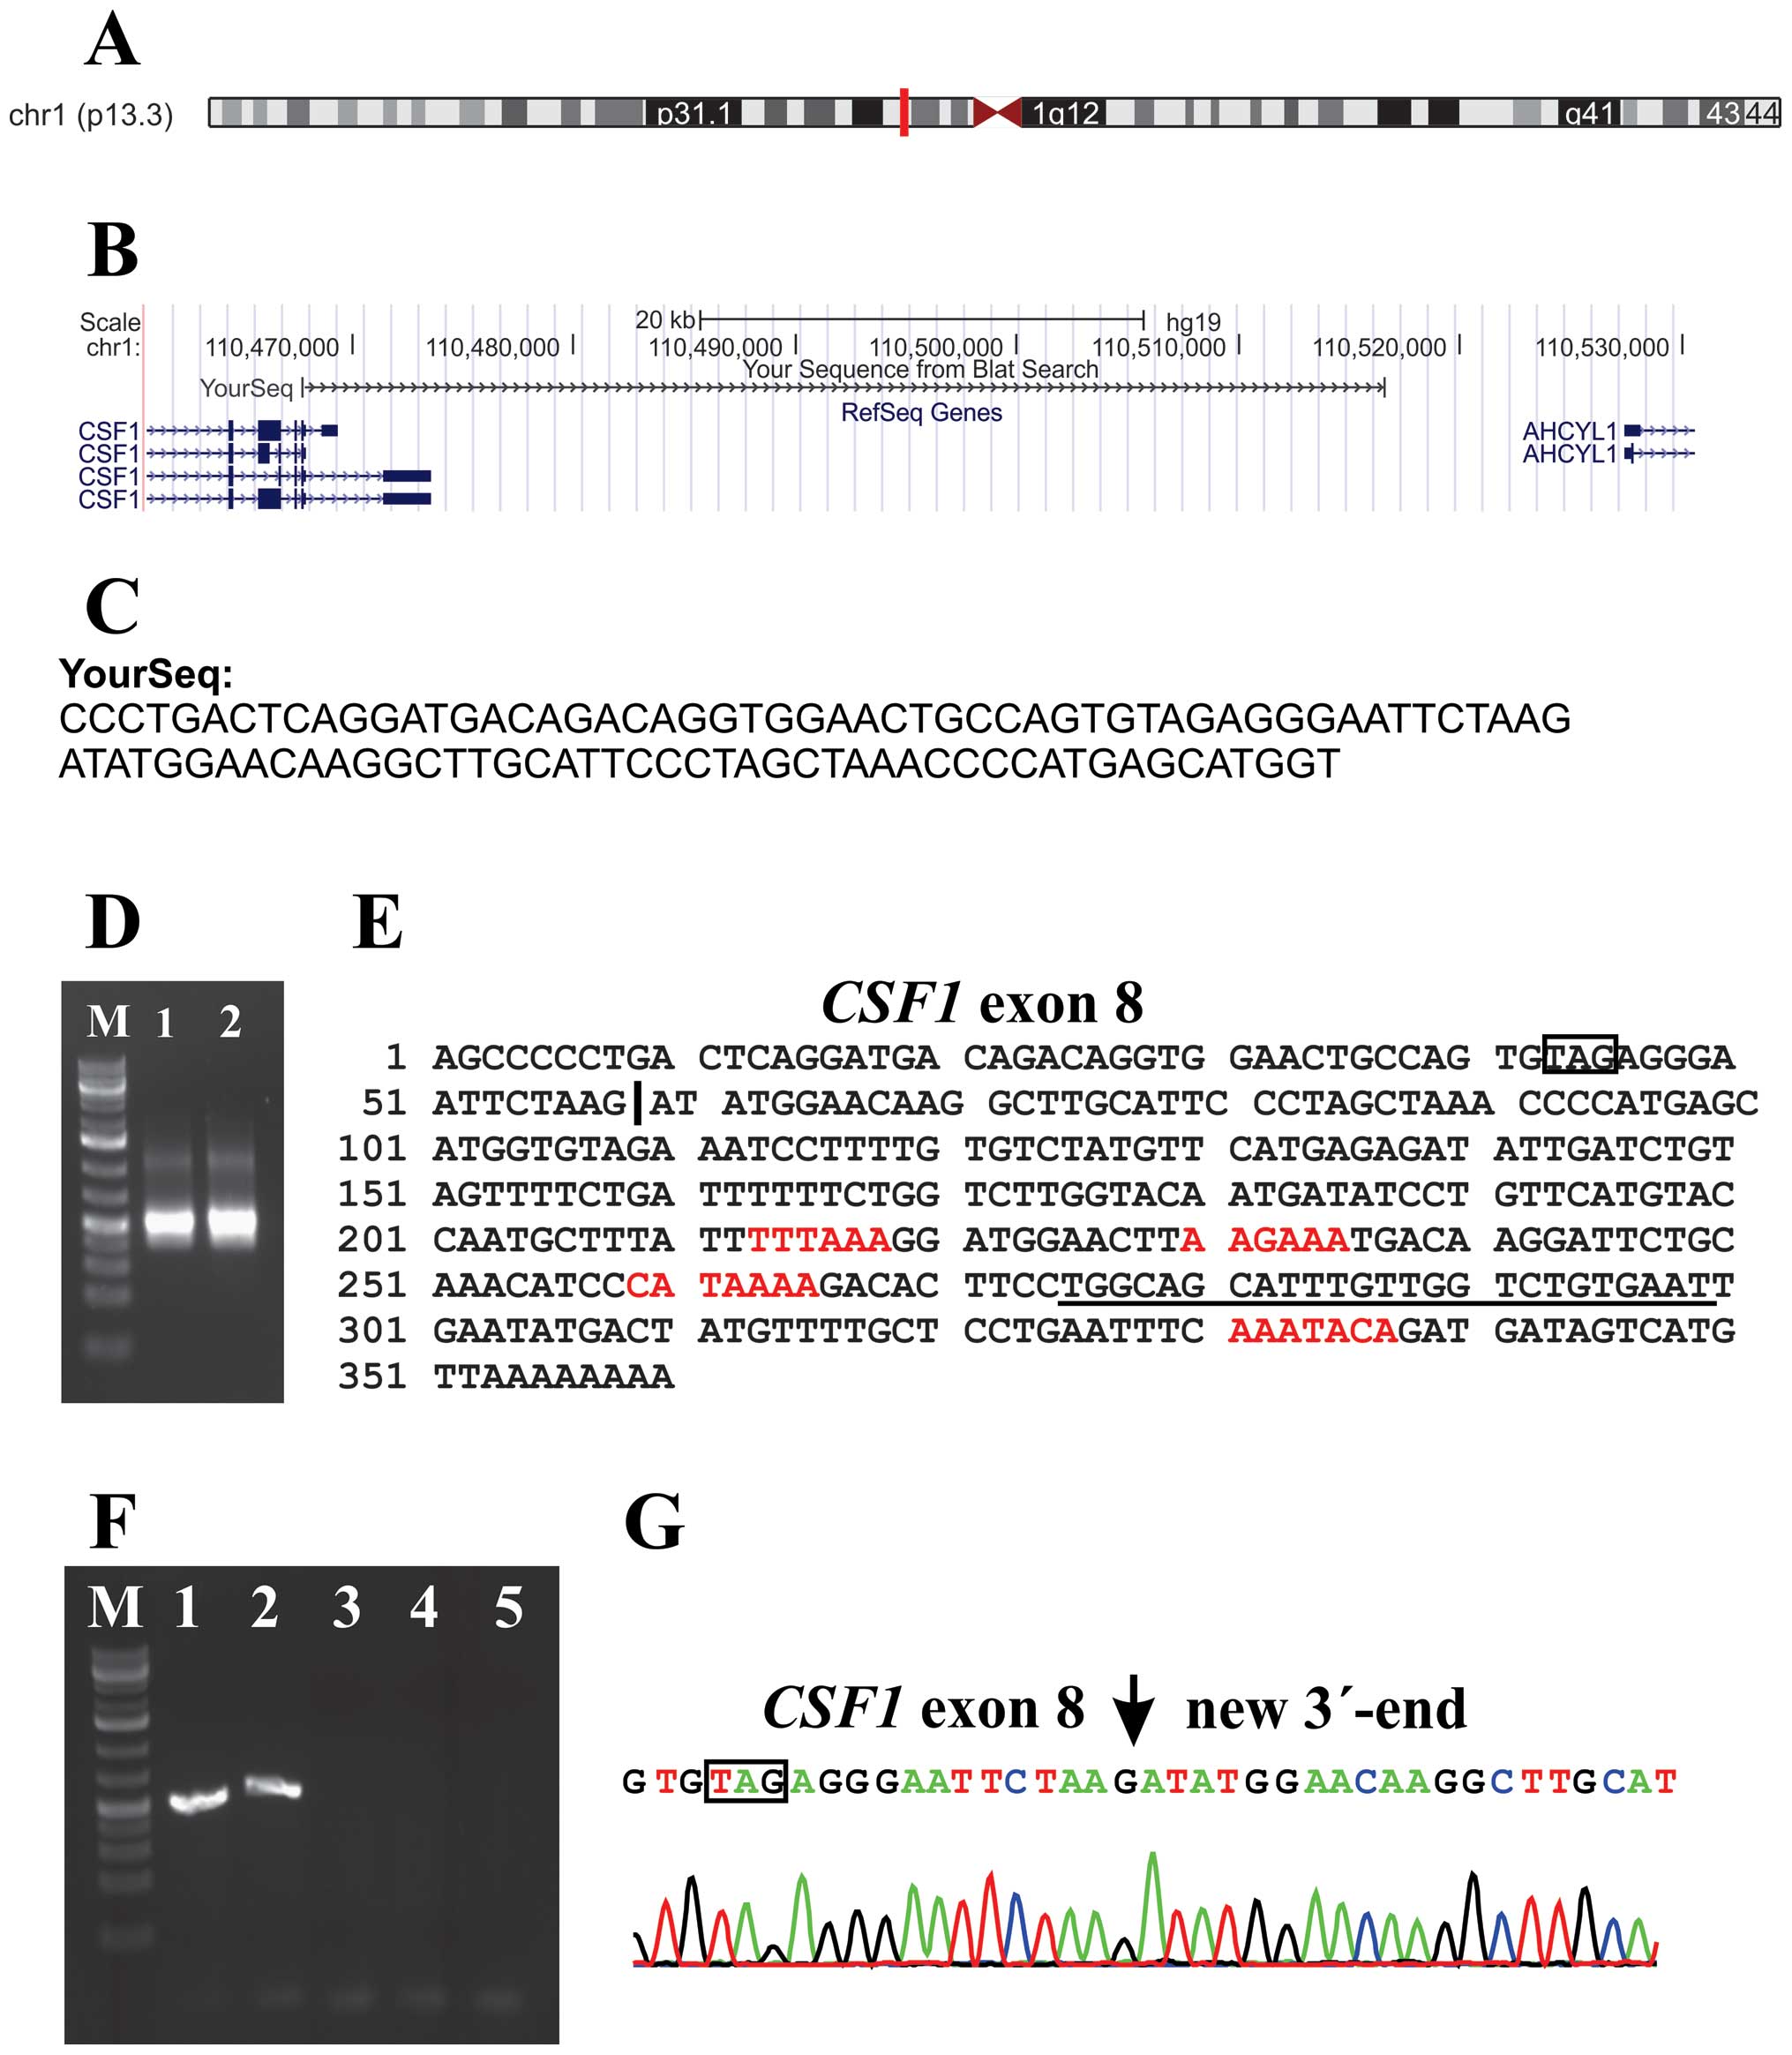
retrieved reads from the raw sequencing data which contained the
last 20 nt of exon 8 of CSF1 (agtgtagag ggaattctaag; nt
2072–2091 in sequences with accession nos. NM_000757 and NM_172212)
from both cases 1 and 2 and performed a database search by applying
the BLAST and BLAT algorithms (Fig. 2A
and B). The analyses showed that exon 8 of CSF1 was
fused to a sequence with features, according to BLAST, ‘48731 bp at
5′ side: macrophage colony-stimulating factor 1 isoform a precursor
and 11081 bp at 3′ side: putative adenosylhomocysteinase 2 isoform
a’ (Fig. 2C). 3′-RACE amplified a
single fragment in cases 1 and 2 (Fig.
2C). Sanger sequence analysis of the amplified fragment
verified the data obtained by RNA-Seq, i.e., the fusion of
CSF1 exon 8 with the new sequence, and showed that the
latter had a poly-adenylation signal, AAATACA, close to the polyA
tail (Fig. 2E). Three other
poly-adenylation signals were found in this sequence (Fig. 2E). PCR with the
CSF1-1886F/CSF1-3end-R1out primer combination (Table I) amplified a single cDNA fragment
in cases 1 and 2 (Fig. 2F).
Sequence analysis of these fragments verified the results obtained
by RNA-Seq and 3′-RACE (Fig. 2G).
Expression analysis of 8 cell lines showed that none of them
expressed the new CSF1 transcript whereas both transcripts 1 and 4
were expressed (Fig. 3). Because
the new non-genic sequence fused to exon 8 of CSF1 is 48 kb
downstream of the currently known CSF1 locus, we consider it
as a new alternative exon and we call this novel sequence
CSF1 transcript 5.
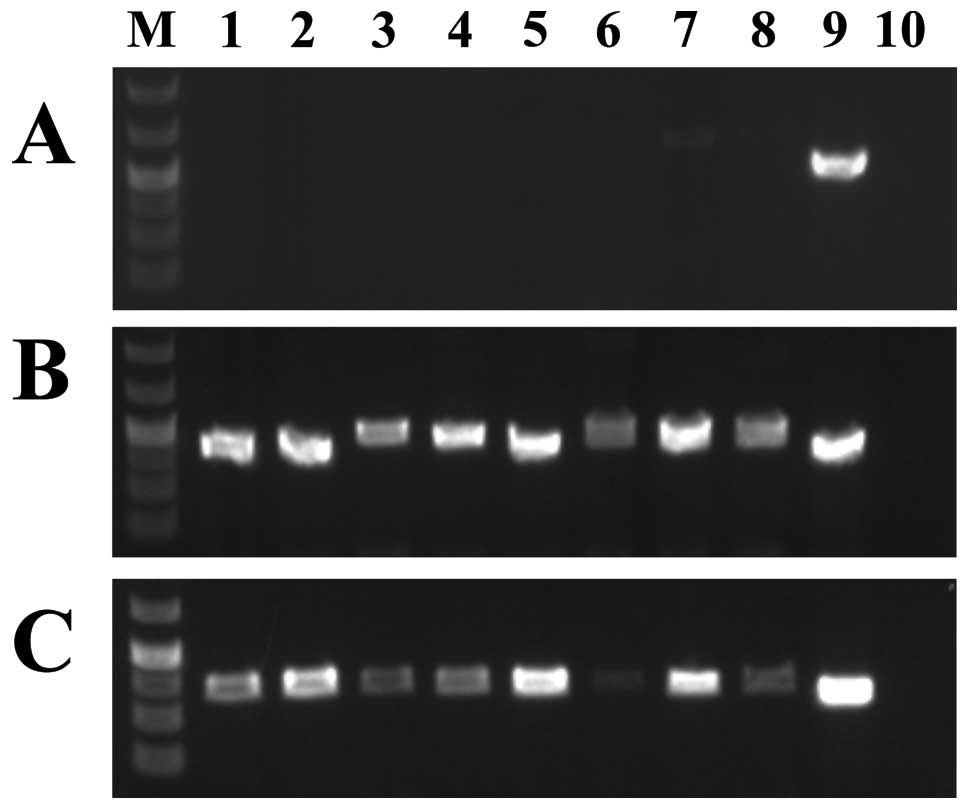 | Figure 3.Expression analysis of the various
CSF1 transcripts in a cDNA panel of eight cell lines. (A)
Expression of CSF1 transcript 5. (B) Expression of
CSF1 transcript 1. (C) Expression of CSF1 transcript
4. Expression analysis was performed using the human cell line MTC
cDNA panel (Clontech). Lane 1, Ad5 cell line; lane 2, SKOV-3; lane
3, Saos2; lane 4, A431; lane 5, Du145; lane 6, H1299; lane 7, HeLa;
lane 8, MCF7; lane 9, case 1 which was used as positive control;
lane 10, blank (no RNA in cDNA). Lane M is 1 kb Plus DNA ladder
(GeneRuler, Fermentas). |
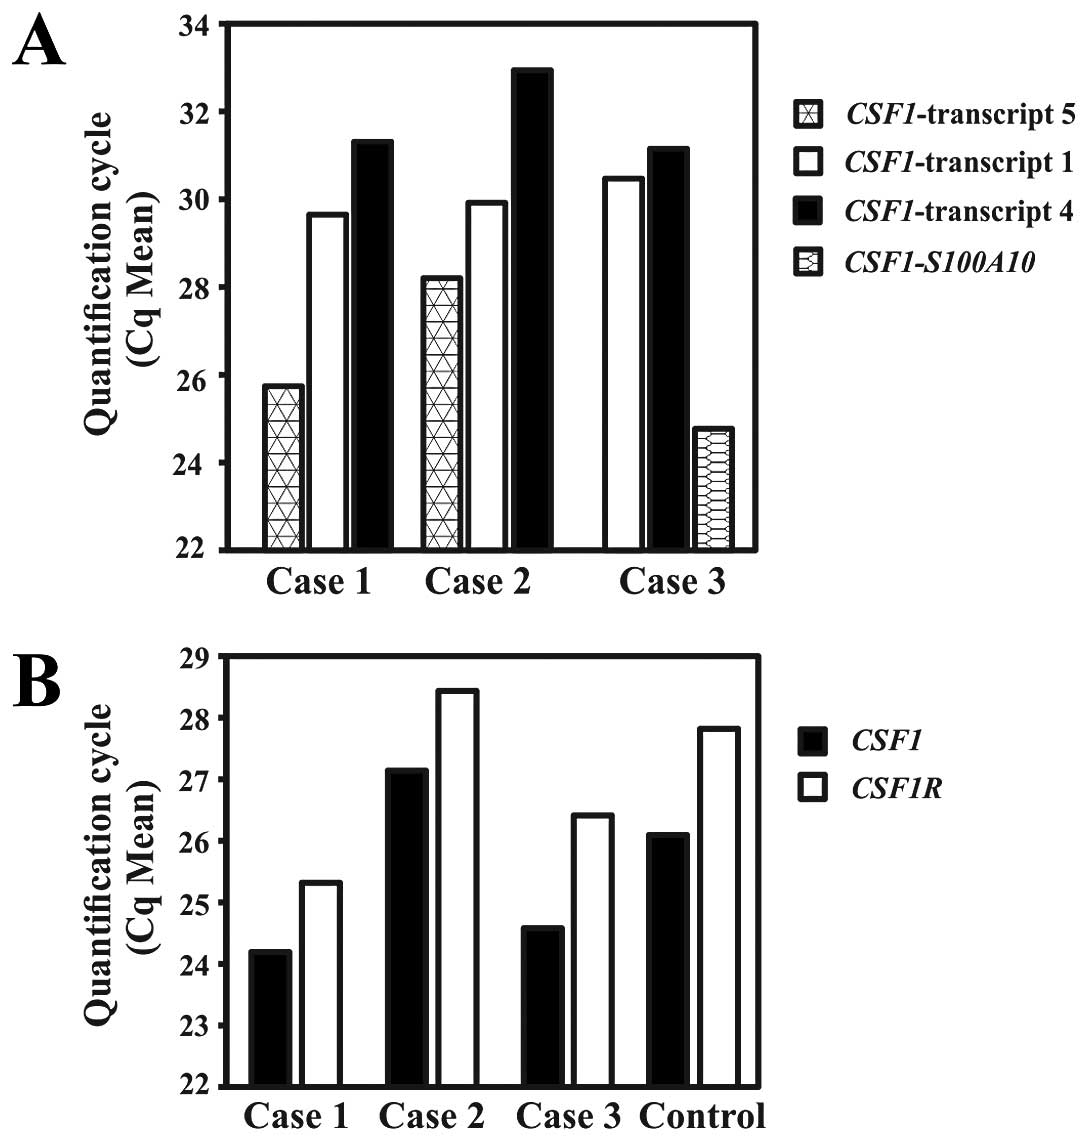
Real-time PCR to quantify the expression of the
CSF1 transcripts and CSF1-S100A10 showed that in
cases 1 and 2, the new transcript 5 was the most highly expressed
followed by transcripts 1 and 4 (Fig.
4A). In case 1, the mean quantification cycle (Cq mean) was
25.74, 29.65 and 31.31 for transcript 5, transcript 1 and
transcript 4, respectively. In case 2, the respective values for Cq
mean were 28.2, 29.92, and 32.94. In case 3, the highest expression
was observed for the fusion CSF1-S100A10 transcript (Cq mean
= 24.77) followed by CSF1 transcripts 1 (Cq mean = 30.47)
and 4 (Cq mean = 31.15).
Real-time PCR to quantify the expression of
CSF1 (all transcripts) and CSF1R showed that
CSF1 was slightly higher expressed than CSF1R in all
cases, including the control Human Universal Reference Total RNA.
The Cq means for CSF1/CSF1R were 24.19/25.32, 27.1/28.44,
24.58/26.41 and 26.09/27.82 for cases 1, 2, 3 and the control,
respectively (Fig. 3B).
Discussion
We have identified a novel CSF1-S100A10
fusion gene in a TSGCT carrying the translocation t(1;1)(q21;p11).
In this fusion gene, the part of CSF1 coding for the CSF1
protein (exons 1–8 in sequences with accession nos. NM_000757 and
NM_172212) is fused to the 3′-part of S100A10. Since the
stop codon TAG of CSF1 is present in the fusion gene
(Fig. 1C), the consequence of the
CSF1-S100A10 seems to be replacement of the 3′-untranslated
region (UTR) of CSF1 (exon 9; nt 2092–4234 in sequence with
accession no. NM_000757 or nt 2092–2772 in NM_172212) by the 3′-end
of S100A10 (exon 3; nt 641–1055 in sequence with accession
no. NM_002966).
The CSF1-S100A10 fusion gene is reminiscent
of the HMGA2-fusions in benign connective tissue tumors.
Chromosomal rearrangements involving 12q13–15 and targeting
HMGA2 result in mostly out-of-frame fusion genes in which a
stop codon is encountered quickly so that only a few amino acids
are added to the AT-hook of HMGA2 (25). The fusion also has another result,
namely the removal of the 3′-UTR of HMGA2 which contains
multiple let-7 binding sites. Let-7 miRNA might act as a repressor
of HMGA2 and miRNA-directed repression of an oncogene could
provide a mechanism of tumorigenesis (25).
S100A10 has been reported as the 3′-partner
gene in the HDGF/S100A10 fusion gene which was found in the
UACC-812 breast cancer cell line (26). S100A10 codes for a member of
the S100 family of proteins containing 2 EF-hand calcium-binding
motifs. S100 proteins are located in the cytoplasm and/or nucleus
of a wide range of cells and are involved in the regulation of a
number of cellular processes such as cell cycle progression and
differentiation. S100 genes include at least 13 members which are
located as a cluster in chromosome band 1q21 (http://www.ncbi.nlm.nih.gov/gene/6281).
S100A10 plays a role in oncogenesis by regulating the plasmin
proteolytic activity of cancer cells and by regulating the
migration of macrophages to the tumor site (27).
In the other two TSGCT we were able to examine, no
fusions of CSF1 with known genes were found. Instead, a
novel fusion of the coding region of CSF1 with a roughly 300
bp sequence located 48 kb downstream of the CSF1 locus was
detected, identical in both cases. Based on the location of the new
sequence which is fused to exon 8 of CSF1 (48 kb downstream
of the currently known CSF1 locus), we call this novel
sequence CSF1 transcript 5. However, the possibility that
this transcript is a product of the chromosome aberrations of case
1 and the chromosome translocation t(1;22) found in case 2 cannot
be ruled out. Similar to the CSF1-S100A10 fusion gene, the
novel CSF1 transcript 5 has the 3′-UTR of CSF1 (exon
9; nt 2092-4234 in sequence with accession no. NM_000757 or nt
2092–2772 in NM_172212) replaced by a new exon located 48 kb
downstream of CSF1 and 11 kb upstream of AHCYL1
(adenosylhomocysteinase-like 1) (Fig.
2C). The novel CSF1 transcript 5 was not found in the
Human Universal Reference Total RNA which is a mixture of total
RNAs from adult human tissues and a panel of 8 well known cell
lines (Figs. 2F and 3). At the moment, both its frequency and
its specificity for TSGCT are unknown.
Cupp et al (23) described two groups of TSGCT/PVNS
defined by CSF1 biology. The first group had CSF1
rearrangements and high levels of CSF1 RNA expression. In
the second group of TSGCT, there were no CSF1 rearrangements
as determined by FISH, but the same characteristic CSF1 RNA
and CSF1 protein expression pattern was nevertheless present. Thus,
an alternative mechanism must exist leading to CSF1
upregulation in this tumor subset. An altered CSF1-CSF1R signaling
pathway still appears to be a critical tumorigenic event in these
TSGCT/PVNS, but the putative translocation or mutation seems to
involve a gene whose product leads to upregulation of CSF1.
An alternative mechanism for at least some cases could be the novel
CSF1 transcript presented here.
Although we studied only 3 TSGCT, a common
pathogenetic theme is discernible shared by the CSF1-S100A10
fusion gene and the novel CSF1 transcript: the replacement
of the 3′-UTR of CSF1 with new sequences. This replacement
results in expression of the protein-coding part of CSF1.
Thus, the reported t(1;2) found in TSGCT might not bring
CSF1 under control of the promoter of COL6A3 as has
been proposed (20,21) but might instead result in the
replacement of the 3′-UTR of CSF1 with sequences from
COL6A3 in a similar way to what we describe here.
While there is no information on the 3′-UTR of
CSF1 transcript 4 (sequence with accession no. NM_172212),
there is ample information on the 3′-UTR region of CSF1
transcript 1 (sequence with accession no. NM_000757). The exon 9 of
CSF1 mRNA (accession no. NM-000575) contains microRNA
targets (miRNA), a non-canonical G-quadruplex, and AU-rich elements
(AREs) which control the expression of CSF1 (28–31).
It has at least 14 miRNA sites (30) and it was shown that both miRNA-128
and miRNA-152 downregulate the expression of CSF1 and its
protein (30). Two other miRNAs,
miR-130a and miR-301a, in the presence of a nucleolin also
downregulate the expression of CSF1 (29). AREs are known to dictate mRNA
(32). For the AREs of CSF1,
glyceraldehyde-3-phosphate dehydrogenase was shown to bind to the
AU-rich elements and regulates the stability and decay of
CSF1 mRNA (28,31). Recently, Woo et al (29) showed that 3′-UTR of CSF1
contains a non-canonical G-quadruplex which is involved in the
post-transcriptional regulation of CSF1 and that nucleolin
is the interacting protein. In the same study, using a luciferase
reporter system fused to CSF1 mRNA 3′-UTR, they showed that
the disruption of the miRNA target region, G-quadruplex, and AREs
together dramatically increased reporter RNA levels, suggesting
important roles for these cis-acting regulatory elements in
the downregulation of CSF1 mRNA.
The CSF1-CSF1R signaling pathway seems to be
critically involved in TSGCT/PVNS tumorigenesis something that has
led to the trial of alternative therapies based on tyrosine kinase
inhibition with imatinib mesylate. In addition to its inhibitory
activity on BCR-ABL, KIT, and PDGFRA, imatinib mesylate has been
reported to block CSF1R activation at therapeutic concentrations
(33). After the first report of
complete response obtained with imatinib in a single patient with
TSGCT (34), imatinib mesylate has
been tried in several patients who were affected with locally
advanced and/or metastatic TSGCT, and the response has been
promising (34–36). Also for this reason a better
understanding of the mechanisms of CSF1 activation in TSGCT
and the role played by the CSF1-CSF1R signaling pathway are
important. More tumors must be studied in order to determine the
frequency and specificity of the new transcript as well as the
possible ubiquity of the replacement of the 3′-UTR of CSF1
in aberrations targeting the CSF1 gene.
Acknowledgements
The authors thank Jim Thorsen for
help with bioinformatics. This study was supported by grants from
the Norwegian Cancer Society and The South-Eastern Norway Regional
Health Authority.
References
|
1.
|
Jaffe HL, Lichtestein L and Sutro CJ:
Pigmented villonodular synovitis, bursitis and tenosynovitis. A
discussion of the synovial and bursal equivalents of the
tenosynovial lesion commonly denoted as xanthoma, xanthogranuloma,
giant cell tumor or myeloplaxoma of the tendon sheath, with some
consideration of this tendon sheath lesion itself. Arch Pathol.
31:731–764. 1941.
|
|
2.
|
Somerhausen NS and Fletcher CD:
Diffuse-type giant cell tumor: clinicopathologic and
immunohistochemical analysis of 50 cases with extraarticular
disease. Am J Surg Pathol. 24:479–492. 2000. View Article : Google Scholar : PubMed/NCBI
|
|
3.
|
Weiss SW and Goldblum JR: Enzinger and
Weiss’s Soft Tissue Tumors. Mosby; St. Louis, MO: 2001
|
|
4.
|
Myers BW and Masi AT: Pigmented
villonodular synovitis and tenosynovitis: a clinical epidemiologic
study of 166 cases and literature review. Medicine. 59:223–238.
1980. View Article : Google Scholar
|
|
5.
|
Fletcher CDM, Bridge JA, Hogendoorn PCW
and Mertens F: WHO Classification of Tumours of Soft Tissue and
Bone (Fourth edition). 2013.
|
|
6.
|
Chassaignac CME: Cancer de la gaine des
tendons. Gaz Hosp Civ Milit. 47:185–186. 1852.
|
|
7.
|
Singh R, Grewal DS and Chakravarti RN:
Experimental production of pigmented villonodular synovitis in the
knee and ankle joints of rhesus monkeys. J Pathol. 98:137–142.
1969. View Article : Google Scholar : PubMed/NCBI
|
|
8.
|
Sakkers RJ, de Jong D and van der Heul RO:
X-chromosome inactivation in patients who have pigmented
villonodular synovitis. J Bone Joint Surg Am. 73:1532–1536.
1991.PubMed/NCBI
|
|
9.
|
Vogrincic GS, O’Connell JX and Gilks CB:
Giant cell tumor of tendon sheath is a polyclonal cellular
proliferation. Hum Pathol. 28:815–819. 1997. View Article : Google Scholar : PubMed/NCBI
|
|
10.
|
Choong PF, Willen H, Nilbert M, et al:
Pigmented villonodular synovitis. Monoclonality and metastasis - a
case for neoplastic origin? Acta Orthop Scand. 66:64–68. 1995.
View Article : Google Scholar : PubMed/NCBI
|
|
11.
|
Brandal P, Bjerkehagen B and Heim S:
Molecular cytogenetic characterization of tenosynovial giant cell
tumors. Neoplasia. 6:578–583. 2004. View Article : Google Scholar : PubMed/NCBI
|
|
12.
|
Fletcher JA, Henkle C, Atkins L, Rosenberg
AE and Morton CC: Trisomy 5 and trisomy 7 are nonrandom aberrations
in pigmented villonodular synovitis: confirmation of trisomy 7 in
uncultured cells. Genes Chromosomes Cancer. 4:264–266. 1992.
View Article : Google Scholar : PubMed/NCBI
|
|
13.
|
Mertens F, Orndal C, Mandahl N, et al:
Chromosome aberrations in tenosynovial giant cell tumors and
nontumorous synovial tissue. Genes Chromosomes Cancer. 6:212–217.
1993. View Article : Google Scholar : PubMed/NCBI
|
|
14.
|
Nilsson M, Hoglund M, Panagopoulos I, et
al: Molecular cytogenetic mapping of recurrent chromosomal
breakpoints in tenosynovial giant cell tumors. Virchows Arch.
441:475–480. 2002. View Article : Google Scholar : PubMed/NCBI
|
|
15.
|
Sciot R, Rosai J, Dal Cin P, et al:
Analysis of 35 cases of localized and diffuse tenosynovial giant
cell tumor: a report from the Chromosomes and Morphology (CHAMP)
study group. Mod Pathol. 12:576–579. 1999.PubMed/NCBI
|
|
16.
|
Bertoni F, Unni KK, Beabout JW and Sim FH:
Malignant giant cell tumor of the tendon sheaths and joints
(malignant pigmented villonodular synovitis). Am J Surg Pathol.
21:153–163. 1997. View Article : Google Scholar : PubMed/NCBI
|
|
17.
|
Layfield LJ, Meloni-Ehrig A, Liu K,
Shepard R and Harrelson JM: Malignant giant cell tumor of synovium
(malignant pigmented villonodular synovitis). Arch Pathol Lab Med.
124:1636–1641. 2000.PubMed/NCBI
|
|
18.
|
Ushijima M, Hashimoto H, Tsuneyoshi M,
Enjoji M, Miyamoto Y and Okue A: Malignant giant cell tumor of
tendon sheath. Report of a case. Acta Pathol Jpn. 35:699–709.
1985.PubMed/NCBI
|
|
19.
|
Mitelman F, Mertens F and Johansson B:
Prevalence estimates of recurrent balanced cytogenetic aberrations
and gene fusions in unselected patients with neoplastic disorders.
Genes Chromosomes Cancer. 43:350–366. 2005. View Article : Google Scholar
|
|
20.
|
West RB, Rubin BP, Miller MA, et al: A
landscape effect in tenosynovial giant-cell tumor from activation
of CSF1 expression by a translocation in a minority of tumor cells.
Proc Natl Acad Sci USA. 103:690–695. 2006. View Article : Google Scholar : PubMed/NCBI
|
|
21.
|
Möller E, Mandahl N, Mertens F and
Panagopoulos I: Molecular identification of COL6A3-CSF1 fusion
transcripts in tenosynovial giant cell tumors. Genes Chromosomes
Cancer. 47:21–25. 2008.PubMed/NCBI
|
|
22.
|
Kawasaki ES and Ladner MB: Molecular
biology of macrophage colony.stimulating factor. Colony Stimulating
Factors: Molecular and Cellular Biology. Dexter TM, Garland JM and
Testa NG: Marcel Dekker; New York, NY: pp. 155–176. 1990
|
|
23.
|
Cupp JS, Miller MA, Montgomery KD, et al:
Translocation and expression of CSF1 in pigmented villonodular
synovitis, tenosynovial giant cell tumor, rheumatoid arthritis and
other reactive synovitides. Am J Surg Pathol. 31:970–976. 2007.
View Article : Google Scholar : PubMed/NCBI
|
|
24.
|
Ge H, Liu K, Juan T, Fang F, Newman M and
Hoeck W: Fusion Map: detecting fusion genes from next-generation
sequencing data at base-pair resolution. Bioinformatics.
27:1922–1928. 2011. View Article : Google Scholar : PubMed/NCBI
|
|
25.
|
Cleynen I and Van de Ven WJ: The HMGA
proteins: a myriad of functions (Review). Int J Oncol. 32:289–305.
2008.PubMed/NCBI
|
|
26.
|
Asmann YW, Hossain A, Necela BM, et al: A
novel bioinformatics pipeline for identification and
characterization of fusion transcripts in breast cancer and normal
cell lines. Nucleic Acids Res. 39:e1002011. View Article : Google Scholar
|
|
27.
|
Madureira PA, O’Connell PA, Surette AP,
Miller VA and Waisman DM: The biochemistry and regulation of
S100A10: a multifunctional plasminogen receptor involved in
oncogenesis. J Biomed Biotechnol. 2012:3536872012. View Article : Google Scholar : PubMed/NCBI
|
|
28.
|
Bonafé N, Gilmore-Hebert M, Folk NL, Azodi
M, Zhou Y and Chambers SK: Glyceraldehyde-3-phosphate dehydrogenase
binds to the AU-Rich 3′ untranslated region of colony-stimulating
factor-1 (CSF-1) messenger RNA in human ovarian cancer cells:
possible role in CSF-1 posttranscriptional regulation and tumor
phenotype. Cancer Res. 65:3762–3771. 2005.
|
|
29.
|
Woo HH, Baker T, Laszlo C and Chambers SK:
Nucleolin mediates microRNA-directed CSF-1 mRNA deadenylation but
increases translation of CSF-1 mRNA. Mol Cell Proteomics.
12:1661–1677. 2013. View Article : Google Scholar : PubMed/NCBI
|
|
30.
|
Woo HH, Laszlo CF, Greco S and Chambers
SK: Regulation of colony stimulating factor-1 expression and
ovarian cancer cell behavior in vitro by miR-128 and miR-152. Mol
Cancer. 11:582012. View Article : Google Scholar : PubMed/NCBI
|
|
31.
|
Zhou Y, Yi X, Stoffer JB, et al: The
multifunctional protein glyceraldehyde-3-phosphate dehydrogenase is
both regulated and controls colony-stimulating factor-1 messenger
RNA stability in ovarian cancer. Mol Cancer Res. 6:1375–1384. 2008.
View Article : Google Scholar
|
|
32.
|
Bakheet T, Frevel M, Williams BR, Greer W
and Khabar KS: ARED: human AU-rich element-containing mRNA database
reveals an unexpectedly diverse functional repertoire of encoded
proteins. Nucleic Acids Res. 29:246–254. 2001. View Article : Google Scholar : PubMed/NCBI
|
|
33.
|
Dewar AL, Cambareri AC, Zannettino AC, et
al: Macrophage colony-stimulating factor receptor c-fms is a novel
target of imatinib. Blood. 105:3127–3132. 2005. View Article : Google Scholar : PubMed/NCBI
|
|
34.
|
Blay JY, El Sayadi H, Thiesse P, Garret J
and Ray-Coquard I: Complete response to imatinib in relapsing
pigmented villonodular synovitis/tenosynovial giant cell tumor
(PVNS/TGCT). Ann Oncol. 19:821–822. 2008. View Article : Google Scholar
|
|
35.
|
Cassier PA, Gelderblom H, Stacchiotti S,
et al: Efficacy of imatinib mesylate for the treatment of locally
advanced and/or metastatic tenosynovial giant cell tumor/pigmented
villonodular synovitis. Cancer. 118:1649–1655. 2012. View Article : Google Scholar : PubMed/NCBI
|
|
36.
|
Stacchiotti S, Crippa F, Messina A, et al:
Response to imatinib in villonodular pigmented synovitis (PVNS)
resistant to nilotinib. Clin Sarcoma Res. 3:82013. View Article : Google Scholar : PubMed/NCBI
|