Introduction
Breast cancer is one of the most commonly diagnosed
cancers in women around the world. Ductal and lobular carcinomas
are the two most frequent types of breast cancer. They can be
either non-invasive, referred to as in situ carcinoma, or
invasive infiltrating carcinoma (1). According to the US National Cancer
Institute, breast cancer can be classified into five progressive
stages. Stage 0 is referred to as carcinoma in situ, which
can be either ductal carcinoma in situ (DCIS) or lobular
carcinoma in situ (LCIS). DCIS may become invasive in later
stages of the tumor and spread to other tissues (2,3).
Invasive breast carcinoma can be classified into progressive stages
I–IV depending on its size and its presence or absence at secondary
sites, mainly the lymph nodes.
Cell motility is a complex multistep process that
integrates multiple intracellular signaling and regulatory
pathways. Therefore, slight modifications in any step may
dramatically affect normal cellular functions and result in
cellular transformation and carcinogenesis. It is known that cell
motility is essential for metastasis and without it tumors would be
easily eradicated and/or surgically removed (1). The acquisition of a motile phenotype
is a critical step towards carcinogenesis and is required for a
cell to gain metastatic competence. Thus, further descriptions of
the molecular mechanisms regulating cancer cell motility would
facilitate the development of specific and effective therapeutic
treatments against metastasis and tumor cell invasion (1,4).
Members of the Rho-family GTPases are small
GTP-binding proteins (GTPases) that range between 20–40 kDa in
size. Almost all aspects of tumor cell proliferation, motility and
invasion including cellular polarity, cytoskeletal re-organization,
and signal transduction pathways are controlled through the
interplay between the Rho-GTPases (5,6).
Frequent studies have shown that the Rho family GTPases regulate
cell motility in breast cancer through their ability to mediate the
remodeling of the actin cytoskeleton as well as translating
cellular signals from the plasma membrane receptors to regulate
focal adhesion, cell polarity, vesicular trafficking and gene
expression (6). Approximately 30%
of human tumors possess a specific mutation in Ras oncogene leading
to its protein level overexpression or constitutive activation. In
contrast to Ras, no mutation in any of the Rho GTPases has been
identified in breast cancer. Rather, these GTPases are often either
overexpressed or hyperactive in breast cancer tissue. The
variations in the levels of these Rho proteins might directly
correlate with the advancement of breast cancer (7,8). The
three most characterized members of the Rho GTPases are Rho, Rac
and Cdc42 which were found to be distinct in function from the
other Rho proteins (9). Rho
GTPases are negatively regulated by Rho GTPases activating proteins
(GAPs). These proteins inhibit Rho GTPases by activating their
intrinsic GTPase activity. This leads to the hydrolysis of the
bound GTP into GDP converting Rho GTPases back to their inactive
conformation (10). In addition to
activating GTP hydrolysis, GAPs may function as effectors of Rho
GTPases to mediate other downstream effector functions (6,11)
DLC2 gene was first identified by Ching et
al (12). It is located on
position 13q12.3 and was found to be underexpressed in
hepatocellular carcinoma (12).
DLC2 is commonly known as steriodogenic acute regulatory
protein-related lipid transfer domain-containing protein 13
(StarD13). StarD13 shares 64% homology with DLC1, another member of
the DLC family (13). StarD13 has
an N-terminal SAM motif and a C-terminal START domain. It also
harbors a RhoGAP domain, which is important to its function
(12–14). Overexpression of StarD13 was found
to associate with significant decrease in cell growth and
proliferation in hepatocellular carcinoma (12). Moreover, DLC1, a closely related
protein is found to be underexpressed in many types of cancer
including lung, prostate, kidney, colon, breast, uterus and stomach
(15). Also, previous data in
astrocytoma suggest a potential role of StarD13 as a tumor
suppressor (16).
In this study we aimed at characterizing StarD13 in
breast cancer in terms of its level of expression and its role in
cellular proliferation, motility and invasion. The level of
expression of StarD13 was determined in patient tissues
representing different grades of breast cancer compared to normal
tissues. The effect on cellular proliferation, viability and cell
cycle progression upon manipulating the level of StarD13 expression
was then studied in addition to investigating its RhoGAP activity
in cancer cell motility as well as its effect on cellular invasion
in vitro.
Materials and methods
Cell culture
Human breast cancer cell lines (MCF-7 and
MDA-MB-231) obtained from ATCC, were cultured in DMEM medium
supplemented with 10% FBS and 100 U penicillin/streptomycin at 37˚C
and 5% CO2 in a humidified chamber.
Antibodies and reagents
Goat polyclonal anti-StarD13 antibody was obtained
from Santa Cruz Biotechnology. Mouse monoclonal anti-RhoA, mouse
monoclonal anti-Rac1, and mouse monoclonal anti-paxillin antibodies
were purchased from Upstate Biotechnology (Lake Placid, NY, USA).
Anti-goat and anti-mouse HRP-conjugated secondary antibodies were
obtained from Promega. Fluorescent secondary antibodies (AlexaFluor
488) were obtained from Invitrogen. To visualize the actin
cytoskeleton, cells were stained with Rhodamine phalloidin
(Invitrogen). DAPI was also used to stain nuclei.
Cell transfection with siRNA
Goat FlexiTube siRNA for StarD13, RhoA, and Rac1
were obtained from Qiagen. The siRNAs used had the following target
sequences: StarD13: 5′-CCCGCAATACGCTCAGTTATA-3′, RhoA: 5′-TTCGGAA
TGATGAGCACACAA-3′, and Rac1: 5′-ATGCATTTCCTG GAGAATATA-3′. The
cells were transfected with the siRNA at a final concentration of
10 nM using HiPerfect (Qiagen) as described by the manufacturer.
Control cells were transfected with siRNA sequences targeting GL2
Luciferase (Qiagen). After 72 h, protein levels in total cell
lysates were analyzed by western blotting using the appropriate
antibodies or the effect of the corresponding knockdown was
assayed.
Cell transfection with vectors
Cells were transfected with 5 μg GFP-StarD13,
dominant active RhoA, or control empty control vectors using
Lipfectamine LTX with Plus reagent (Invitrogen) as described by the
manufacturer. Cells were incubated with the transfection complexes
for 4 h then refed with DMEM supplied with 30% FBS. The experiments
were carried on 24 h following transfection. The GFP-StarD13 and
the RhoA constructs were generous gifts from respectively Dr
Hitoshi Yagisawa from the University of Hyogo, Japan and Dr Hideki
Yamaguchi from the Albert Einstein College of Medicine, NY,
USA.
The constructs were transformed into One Shot TOP10
chemically competent E. coli (Invitrogen), which were grown
on a selective medium containing the appropriate antibiotic. The
vectors were then extracted using MaxiPrep plasmid extraction kit
from Qiagen. The mCherry-tagged RhoA-DA construct was a generous
gift from Dr Louis Hodgson from Albert Einstein College of Medicine
Yeshiva University, NY, USA.
Western blotting
Cell lysates were prepared by scraping the cells in
a sample buffer consisted of 4% SDS, 10% β-mercaptoethanol, 20%
glycerol, 0.004% bromophenol blue, and 0.125 M Tris-HCl at a pH
6.8. The resulting lysates were boiled for 5 min. Protein samples
were separated by SDS-PAGE on 8% (for StarD13) or 15% (for RhoA and
Rac) gels and transferred to PVDF membranes overnight at 30 V. The
membranes were then blocked with 5% non-fat dry milk in PBS
containing 0.1% Tween-20 for 1 h at room temperature and incubated
with primary antibody at a concentration of 1:100 for 2 h at room
temperature. After the incubation with the primary antibody, the
membranes were washed and incubated with secondary antibody at a
concentration of 1:1,000 for 1 h at room temperature. The membranes
were then washed, and the bands visualized by treating the
membranes with western blotting chemiluminescent reagent ECL (GE
Healthcare). The results were obtained on X-ray film (Agfa
Healthcare). The levels of protein expression were compared by
densitometry using ImageJ software.
RT-PCR
Cells were grown in 6-well plate at density of
1×10⁶ cells/ml and were transfected by either control or
StarD13 siRNA for 72 h. Total RNA was extracted performed RNeasy
extraction kit (Qiagen) according to the manufacturer’s
instructions. Reverse transcriptase polymerase chain reaction
(RT-PCR) was used to amplify RNA of StarD13. RNA (2 μg) was
converted to cDNA using the OneStep RT-PCR kit (Qiagen) as
described by the manufacturer. Briefly, gene-specific primers
designed to detect cDNA were obtained from TIB-MolBiol with the
following sequences: forward, 5′-AGC CCCTGCCTCAAAGTATT-3′; reverse,
5′-AGCCCCTGCCTC AAAGTATT-3′. β-actin was used as a control with
primers obtained from Sigma-Aldrich having the following sequences:
forward, 5′-ATGAAGATCCTGACCGAGCGT-3′; reverse,
5′-AACGCAGCTCAGTAACAGT-CCG-3′. Primers were used at a final
concentration of 0.6 μM. Primers were added to 5X Qiagen
OneStep RT-PCR buffer providing a final concentration of 2.5 mM
MgCl2 in the reaction mix. A final concentration of 400
μM of each dNTP was added along with 2.0 μl/reaction
of enzyme mix. Final mastermix volume was adjusted to 50 μl
using RNase-free water. Thermal cycler conditions, for both reverse
transcription and PCR, was programmed as follows: reverse
transcription at 50˚C for 30 min, initial PCR activation step at
95˚C for 15 min, followed by 25 cycles of denaturation at 94˚C for
1 min, annealing at 52˚C for 1 min and extension at 72˚C for 1 min
followed by a final extension step at 72˚C for 10 min. The PCR
products (10 μl) were run on 0.8% agarose gel stained with
ethidium bromide at 100 V for 30 min. The resulting bands were
visualized under UV light and photographed. β-actin was used as a
loading control.
Antigen retrieval and
immunohistochemistry
Permission for tissue collection was granted by the
Committee on Human Subjects in Research (CHSR) at the Lebanese
American University (approval given March 26, 2010, CHSR tracking
no. NSMS26032010-1). Human breast cancer tissues different grades
were provided by Dr Selim Nasser from Clemenceau Medical Center
(CMC), Beirut, Lebanon. Tissue blocks were paraffin-embedded and
sectioned to 8-μm sections using a tissue microtome.
Sections were deparaffinized in two changes of xylene 5 min each
then hydrated in two changes of 95% alcohol 2 min each followed by
2 changes of 50% alcohol 2 min each. Antigen retrieval was then
performed in pre-heated Citra Plus (Biogenex) solution. Tissues
were then fixed with 4% paraformaldehyde for 10 min, and
permeabilized with 0.5% Triton-X100 for 10 min. To decrease
background fluorescence, tissues were rinsed with 0.1 M glycine
then incubated with 0.1 M glycine for 10 min. For blocking, tissues
were incubated 4 times with 1% BSA, 1% FBS in PBS for 5 min.
Samples were stained with StarD13 primary antibody for 2 h and with
a fluorophore-conjugated secondary antibody for 2 h. Tissue
fluorescent images were taken using a 10X objective on a
fluorescent microscope. For image analysis, all digital images were
imported in ImageJ software (National Institutes of Health, MA,
USA). The total fluorescence intensity of a fixed area from ≥10
different frames from each tissue was determined.
Trypan blue exclusion method
Cells were grown in 24-well plates (growth area: 2
cm2) at a density of 2×10⁶ cells/ml.
Depending on the experiment, cells were transfected with either
StarD13 siRNA or GFP-StarD13 construct. Following treatment period,
the supernatant from each well was collected, cells were washed
with PBS, and the PBS washes were added to the supernatant of each
well. Cells were then trypsinized and collected separately from the
well contents and PBS. From each collection tube 20 μl was
mixed with 20 μl of trypan blue, 10 μl of this
mixture was placed in a counting chamber under the microscope, and
the number of living and dead cells was recorded accordingly. For
each well, two countings were done separately, PBS washes/well
supernatant and trypsinized cells. Under the microscope, dead cells
appear blue, since they are permeable to trypan blue, while viable
cells exclude the stain and thus appear bright. The percentage of
dead cells was reported.
Cell proliferation reagent (WST-1)
Cells were seeded in 96-well plates (growth area:
0.6 cm2) at a concentration of 1×10⁶
cells/ml. Depending on the experiment, cells were transfected with
either StarD13 siRNA or GFP-StarD13 construct with appropriate
controls. Following treatment period, 10 μl of cell
proliferation reagent (WST-1; Roche, Germany) was added to each
well. The plates were incubated at in a humidified incubator (37˚C)
in 95% air and 5% CO2 for 2 h. WST-1 is a tetrazolium
salt that on contact with metabolically active cells is cleaved to
produce formazan dye by mitochondrial dehydrogenases. Quantitation
of formazan is done colorimetrically at 450 nm. The absorbance of
the each blank well was subtracted from the corresponding sample
well. The results were normalized to the corresponding controls,
and the percent of cell proliferation was reported.
Pull-down assay
Cells were either transfected with GFP-StarD13
construct or an empty GFP construct as a control. Following
treatment period, cells were lysed and the pull-down assay
performed using the RhoA/Rac1/Cdc42 Activation Assay Combo Kit
(Cell BioLabs) following the manufacturer’s instructions. Briefly,
cell lysates were incubated with GST-RBD (for RhoA) or GST-PAK (for
Rac1/Cdc42) for 1 h at 4˚C with gentle agitation. Then, the samples
were centrifuged, and the pellet washed for several times. After
the last wash, the pellets were resuspended with sample buffer and
boiled for 5 min. GTP-RhoA and GTP-Rac1/Cdc42 were detected by
western blotting using anti-RhoA, anti-Rac1 and anti-Cdc42
antibodies provided in the kit. Total proteins were collected prior
to the incubation with GST beads and used as a loading control.
Cell cycle analysis
Treated cells were placed into 15 ml Falcon tubes
and centrifuged at 1,500 rpm for 5 min. The pellet was then washed
and resuspended in 1 ml of ice-cold 1X phosphate-buffered saline
(PBS) followed by 4 ml of 70% ethanol. Cells were then left
overnight at −20˚C. The following day, cells were pelleted and
washed with 1X PBS. The pellet was resuspended in 500 μl of
1X binding buffer and then stained with 10 μl of propidium
iodide (PI) for 10 min in the dark. Cells were analyzed using an
Accuri C6 flow cytometer (Ann Arbor, MI, USA), which indicated the
distribution of the cells into their respective cell cycle phases
based on their DNA content determined by the CFlow®
software. G0/G1 cells were 2n, S-phase cells were >2n but <4n
while G2/M cells were 4n.
Immunostaining assay
The cells were plated on cover slips, and the
appropriate treatment was applied. Cells were fixed with 4%
paraformaldehyde for 10 min, and permeabilized with 0.5%
Triton-X100 for 10 min. To decrease background fluorescence, cells
were rinsed with 0.1 M glycine then incubated with 0.1 M glycine
for 10 min. For blocking, cells were incubated 4 times with 1% BSA,
1% FBS in PBS for 5 min. Samples were stained with primary
antibodies for 2 h and with fluorophore-conjugated secondary
antibodies for 2 h. Fluorescent images were taken using a 60X
objective on a fluorescent microscope. Average adhesion size was
obtained by thresholding the image on ImageJ software that
calculates the average area and size.
Wound healing
Cells were grown to confluence on culture plates and
a wound was made in the monolayer with a sterile pipette tip. After
wounding, the cells were washed twice with PBS to remove debris and
new medium was added. Phase-contrast images of the wounded area
were taken at 0 and 16 h after wounding. Wound widths were measured
at 11 different points for each wound, and the average rate of
wound closure was calculated in μm/h using the ImageJ
software in pixels/h and then converted to μm/h by
multiplying by the the pixel size corresponding the objective used
in these experiments.
Motility assay
For motility analysis, images of cells moving
randomly in serum were collected every 60 sec for 2 h using a 20X
objective. During imaging, the temperature was controlled using a
Nikon heating stage which was set at 37˚C. The medium was buffered
using HEPES and overlayed with mineral oil. The speed of cell
movement was quantified using the ROI tracker plugin in the ImageJ
software, which was used to calculate the total distance travelled
by individual cells. The speed is then calculated by dividing this
distance by the time (120 min) and reported in μm/min. The
speed of ≥15 cells for each condition was calculated. The net
distance travelled by the cell was calculated by measuring the
distance travelled between the first and the last frames.
Adhesion assay
96-well plates were coated with collagen using
Collagen Solution, Type I from rat tail (Sigma) overnight at 37˚C
then washed with washing buffer (0.1% BSA in DMEM). The plates were
then blocked with 0.5% BSA in DMEM at 37˚C in a CO2
incubator for 1 h. This was followed by washing the plates and
chilling them on ice. Meanwhile, the cells were trypsinized and
counted to 4×10⁵ cell/ml. Cells (50 μl) were
added in each well and incubated at 37˚C in a CO2
incubator for 30 min. The plates were then shaken and washed 3
times. Cells were then fixed with 4% paraformaldehyde at room
temperature for 10 min, washed, and stained with crystal violet (5
mg/ml in 2% ethanol) for 10 min. Following the staining with
crystal violet, the plates were washed extensively with water, and
left to dry completely. Crystal violet was solubilized by
incubating the cells with 2% SDS for 30 min. The absorption of the
plates was read at 550 μm using a plate reader.
Invasion assay
MDA-MB-231 cells were transfected with either
control or StarD13 siRNAs and invasion assay was performed 48 h
following treatment period using the collagen-based invasion assay
(Millipore) according to the manufacturer’s instructions. Briefly,
24 h prior to assay, cells were starved with serum-free medium.
Cells were harvested, centrifuged and then resuspended in quenching
medium (without serum). Cells were then brought to a concentration
of 1×10⁶ cells/ml. In the meantime, inserts were
prewarmed with 300 μl of serum-free medium for 30 min at
room temperature. After rehydration, 250 μl of media was
removed from inserts and 250 μl of cell suspension was
added. Inserts were then placed in a 24-well plate, and 500
μl of complete media (with 10% serum) was added to the lower
wells. Plates were incubated for 24 h at 37˚C in a CO2
incubator. Following incubation period, inserts were stained for 20
min at room temperature with 400 μl of cell stain provided
with the kit. Stain was then extracted with extraction buffer (also
provided). Extracted stain (100 μl) was then transferred to
a 96-well plate suitable for colorimetric measurement using a plate
reader. Optical density was then measured at 560 μm.
Statistical analysis
All the results reported represent average values
from three independent experiments. The error estimates are given
as ± SEM. The p-values were calculated by t-tests or chi-square
tests depending on the experiment using the VassarStats: Website
for Statistical Computation (http://vassarstats.net/).
Results
Level of expression of StarD13 in breast
cancer
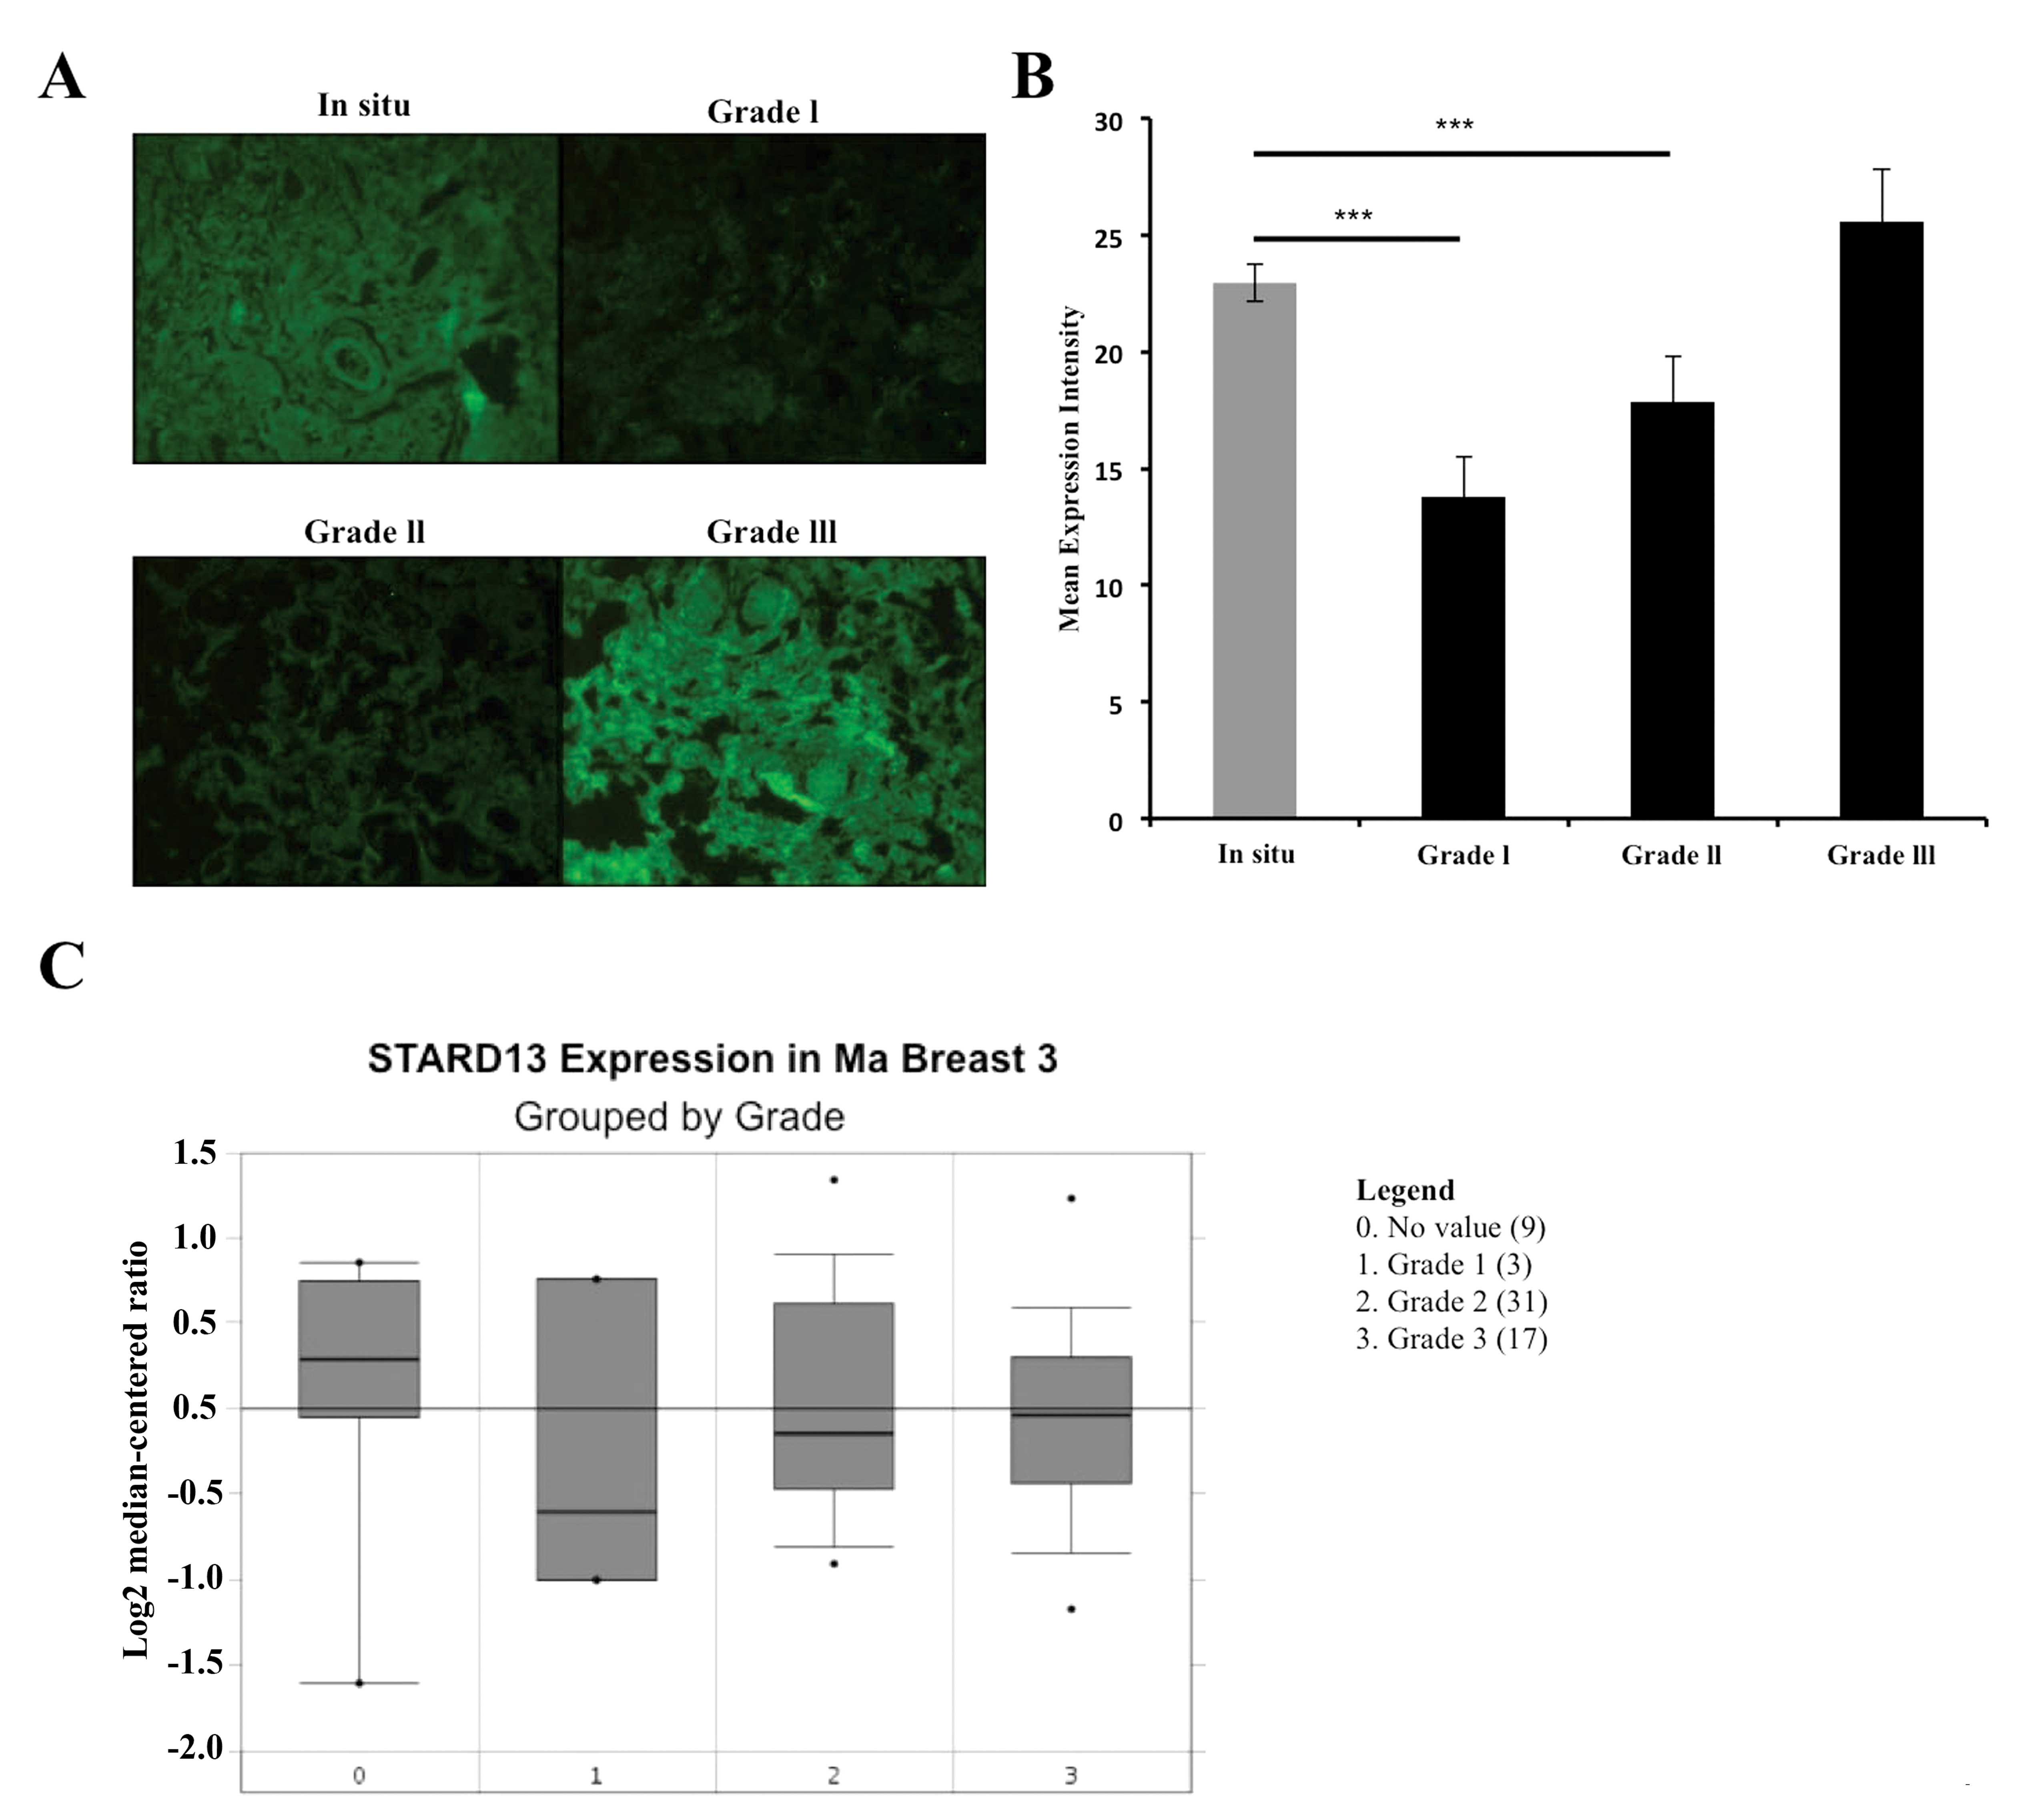
Before studying the role of StarD13 in breast cancer
cells, we first wanted to investigate its level of expression in
human breast cancer tissues. For this, breast cancer tissue
sections were obtained from patients representing different grades.
We performed immunohistochemistry using an anti-StarD13 antibody
(Fig. 1A). The mean fluorescent
intensity was then measured using the ImageJ software. StarD13
showed a high expression level in non-invasive in situ
carcinoma. Then, its level of expression decreased in grades I and
II; however, as we moved on to higher grades of the tumor, StarD13
showed a significant increase in its level of expression (Fig. 1B).
In order to supplement our results, we mined the
oncomine database for microarray analysis where they measured
StarD13 mRNA expression levels from 60 breast cancer samples
grouped by grade. The results showed that StarD13 is underexpressed
in tumor tissues relative to non-tumor (grade 0). Moreover, StarD13
mRNA levels are relatively higher when compared to levels in lower
grade tumors 1 and 2 (Fig. 1C).
This was consistent with our IHC results.
StarD13 effect on cell viability and
proliferation
The surprising increase in StarD13 expression level
in higher grades of breast cancer lead us to investigate whether
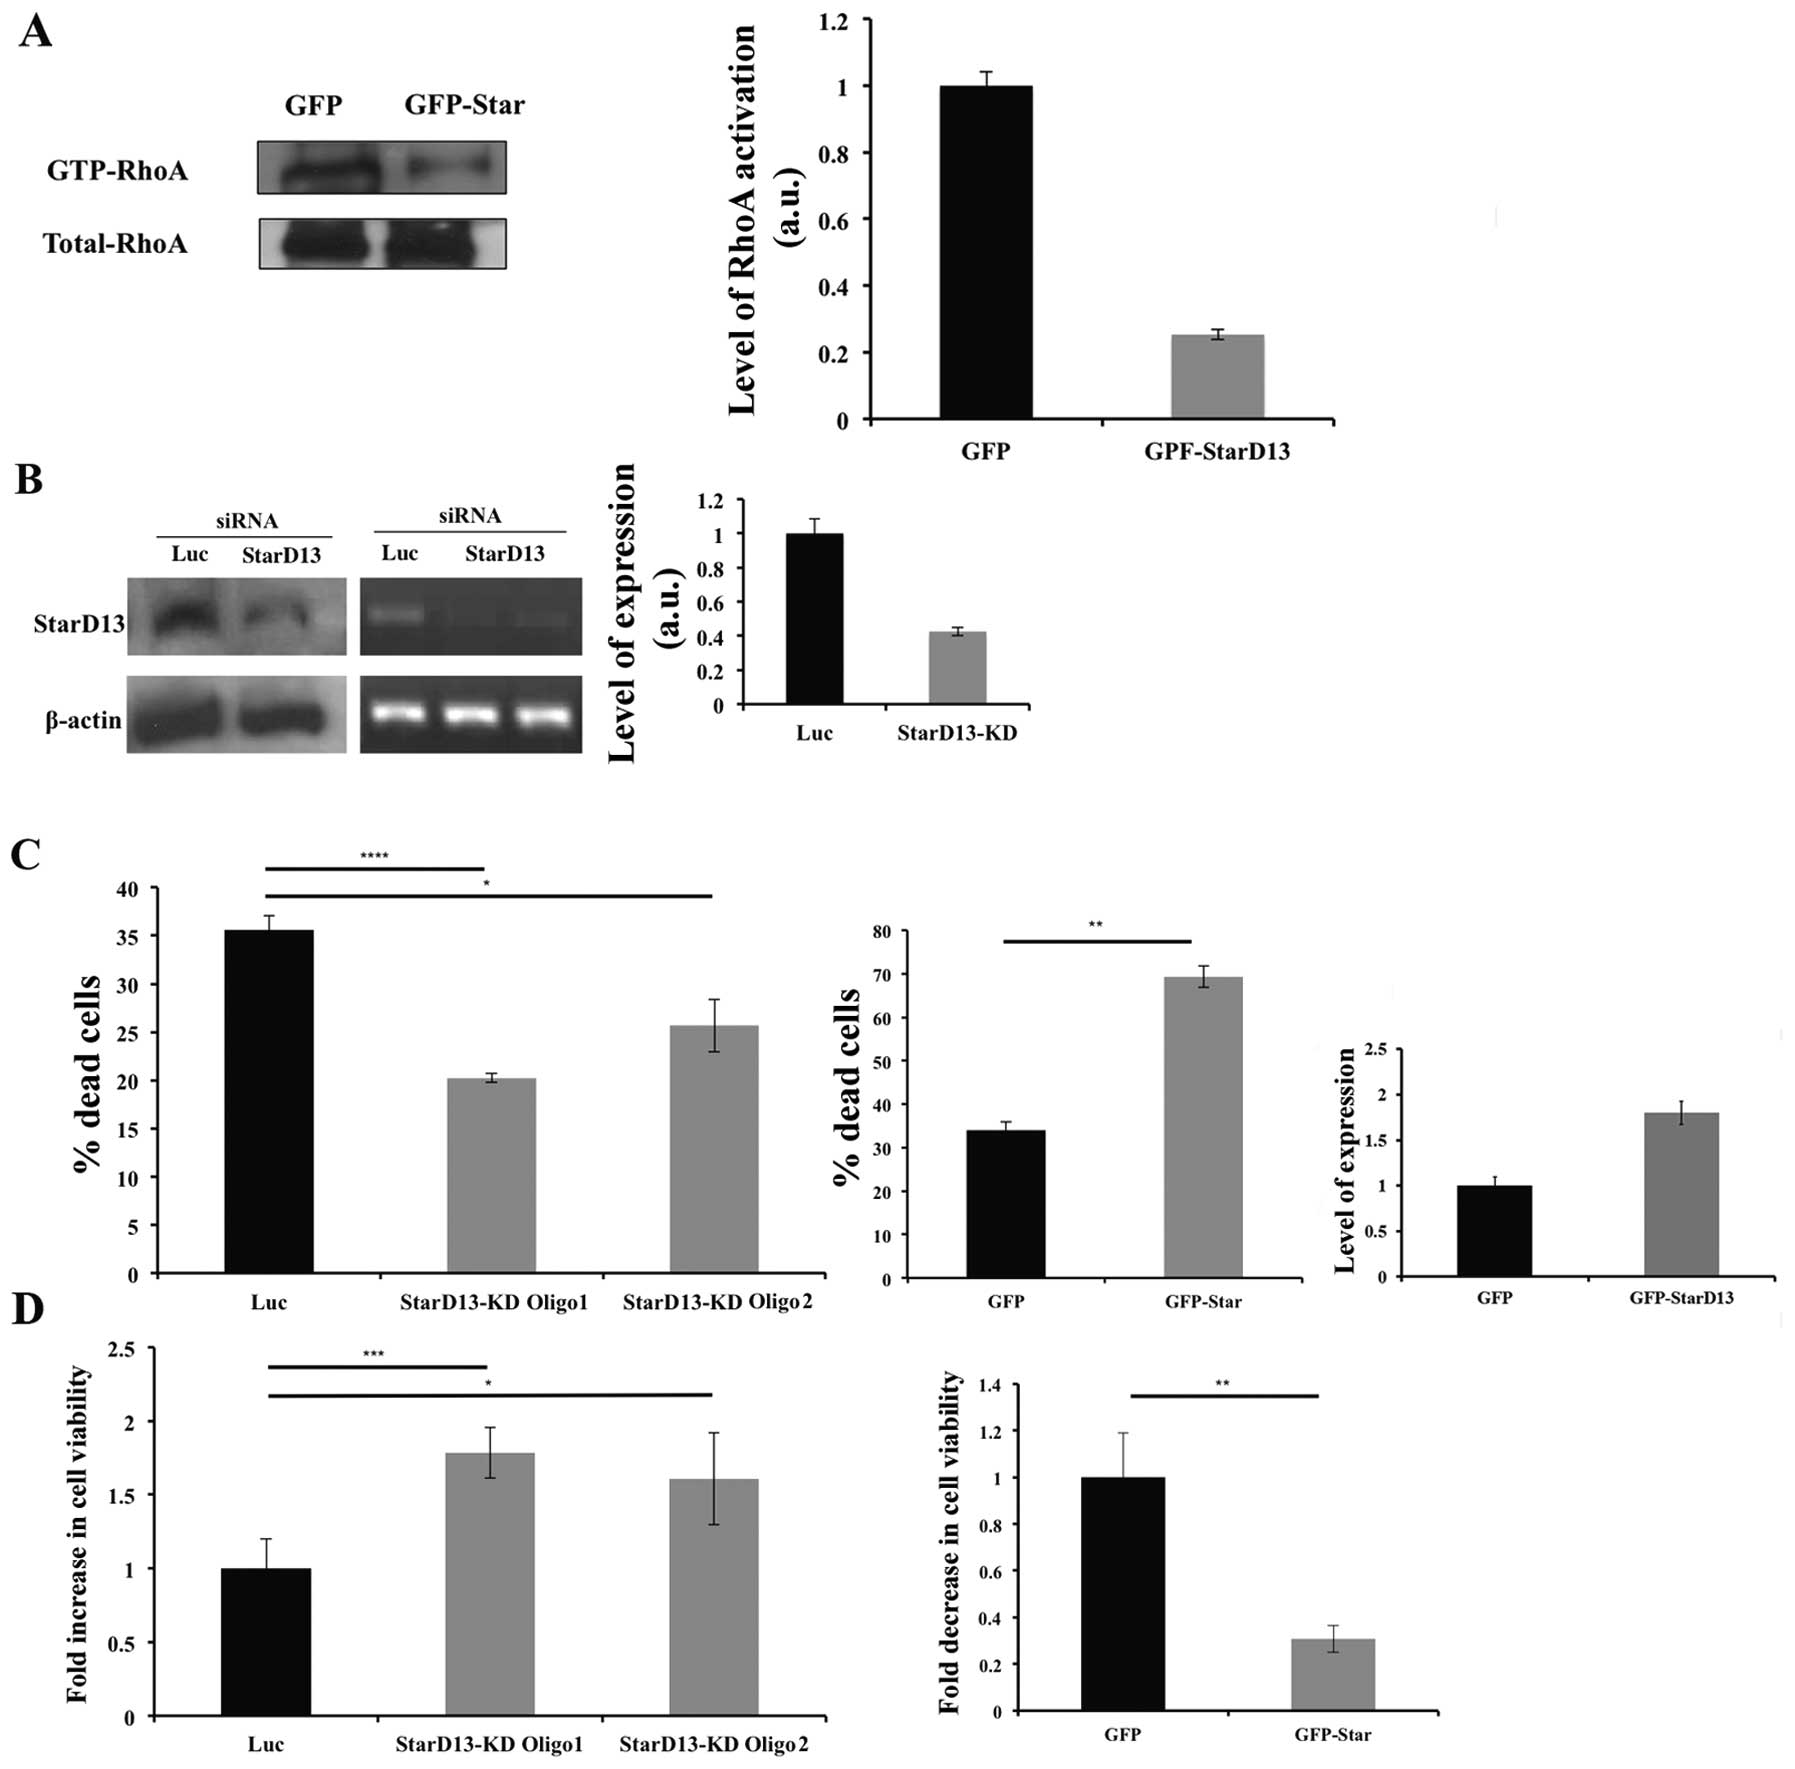
StarD13 is indeed a tumor suppressor in our cells. Next, we wanted
to investigate the role of StarD13 on cellular proliferation and
viability. After confirming its GAP activity on RhoA and Cdc42
(Fig. 2A) by pull-down assay, we
looked at the effect of StarD13 on proliferation. StarD13 was
knocked down using small interfering siRNA in MDA-MB-231 cells. The
resulting inhibition in the level of StarD13 was determined using
western blotting and RT-PCR in cells transfected with 2 different
StarD13 siRNA oligos as compared to control cells transfected with
non-specific siRNA where β-actin was used as a loading control
(Fig. 2B). A 60% knockdown has
been observed in western blotting (Fig. 2B). StarD13 knockdown resulted in a
40% decrease of dead cells as determined by trypan blue exclusion
method (Fig. 2C).
On the other hand, as a second approach, cells were
transfected with a GFP-StarD13 construct and the resulting cell
viability was determined as compared to cells transfected with GFP
vector alone. Cells overexpressing StarD13 showed a drastic
increase in the percentage of dead cells as compared to control
cells as determined using trypan blue (Fig. 2C).
Moreover, this was reflected as an increase in cell
viability in cells transfected with StarD13 siRNA by 18% as opposed
to control cells as determined using Wst-1 reagent. In contrary,
there was a dramatic decrease in cell viability in cells
overexpressing StarD13 (Fig.
2D).
StarD13 effect on the cell cycle
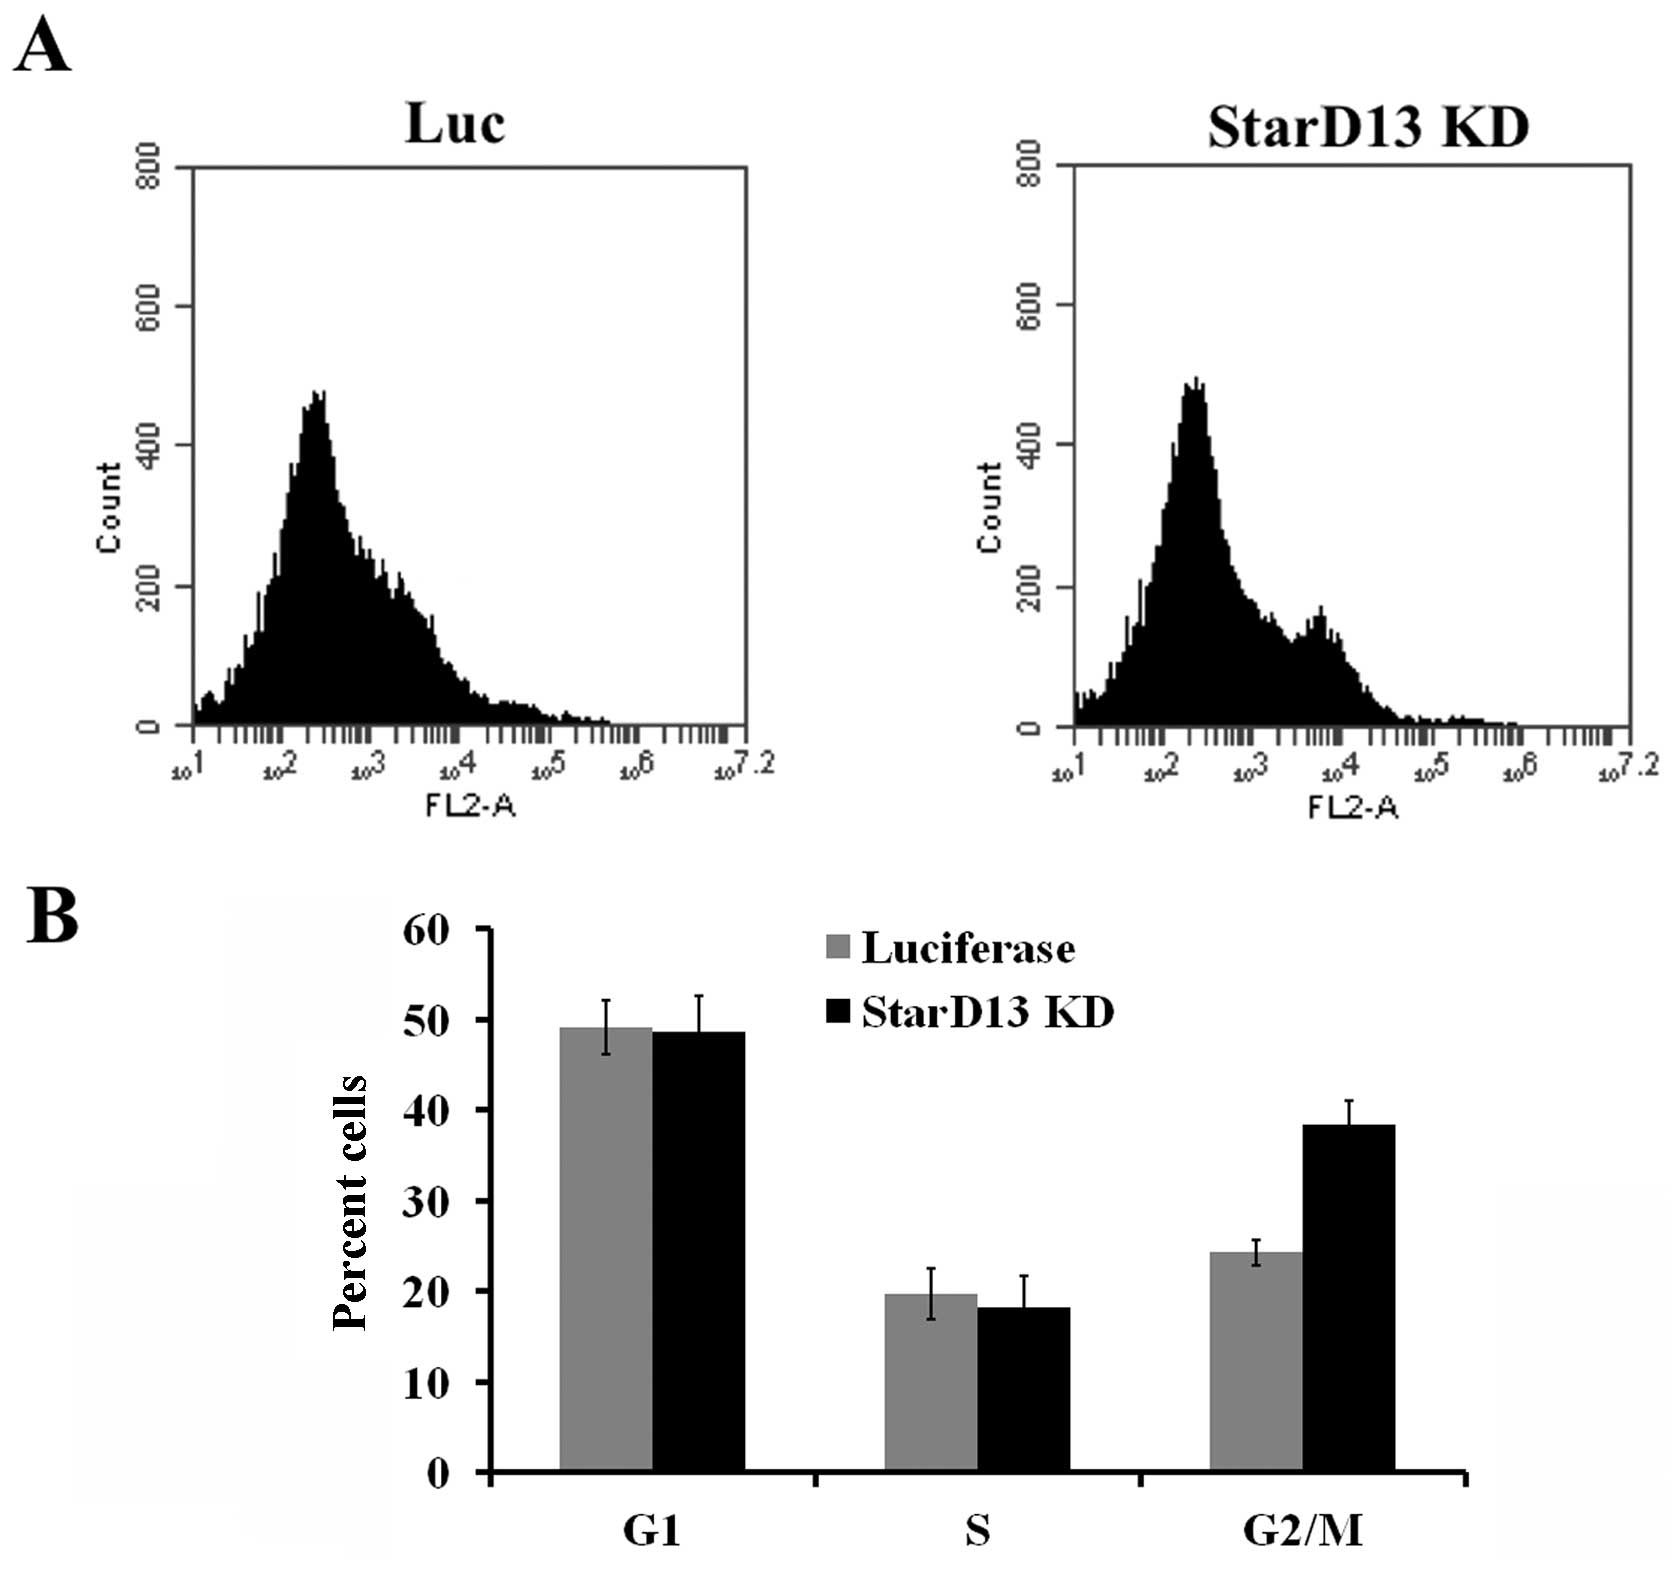
Analysis of the cell cycle where cells were stained
with propidium iodide alone showed that upon StarD13 knockdown,
cells seem to undergo more cell division. This is apparent in the
increase in the percentage of cells in the G2/M phase (38%) as
opposed to control cells (28%) (Fig.
3).
StarD13 is needed for breast cancer cell
motility
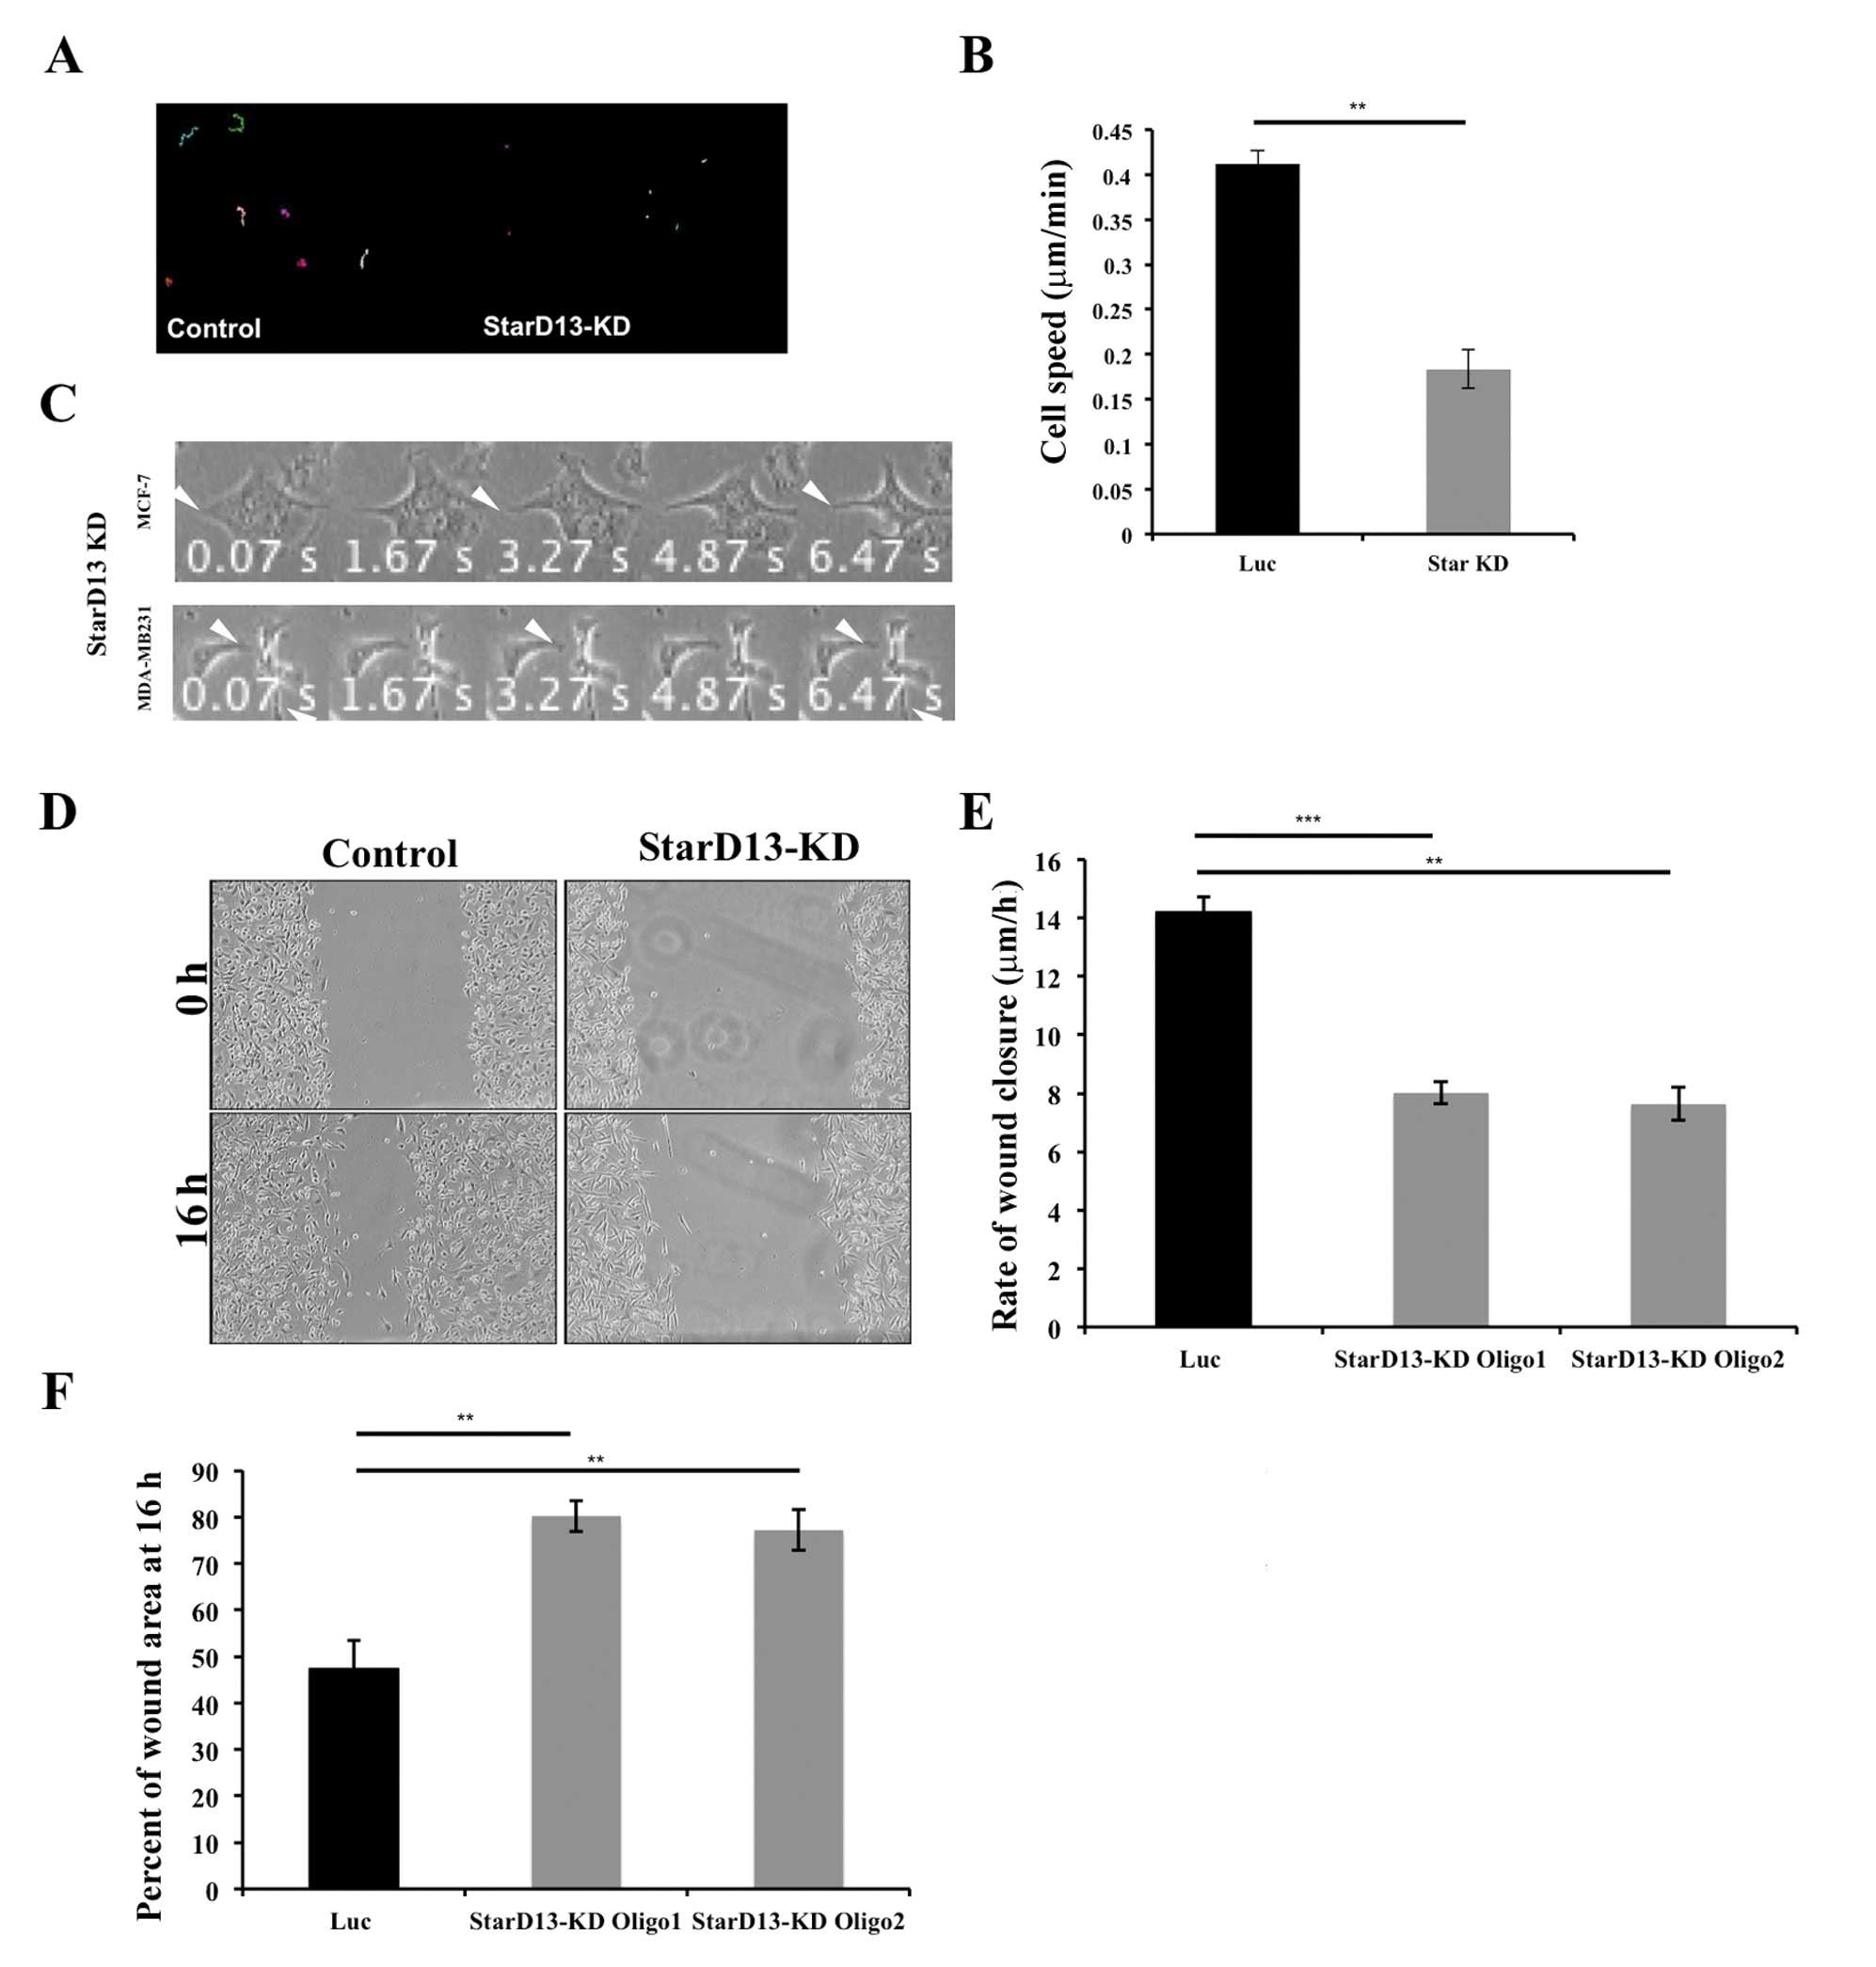
We were then interested in investigating the role of
StarD13 in breast cancer cell motility. For this reason, StarD13
was knocked down using siRNA oligonucleotides (Fig. 2A). Results show that StarD13
knockdown significantly decreased the average speed of individual
cells from 0.41 to 0.20 μm/min as determined by time-lapse
motility movies (Fig. 4B). Looking
at the morphology, both cell lines MCF-7 and MDA-MB-231 were
observed to be stuck and not able to detach their tail in order to
move forward (Fig. 4C). Moreover,
StarD13 knockdown decreased the rate of wound closure from 14
μm/h to ∼7 μm/h in both oligos tested (Fig. 4D and E). Also, the area of the
wounds were calculated at 16 h following the formation of the
wounds. The results show that in control cells only 47% of the
initial wound area is left as opposed to StarD13 knockdown cells
where the wounds areas did not appear to change after 16 h, 80% for
oligo1 and 77.16% for oligo2 (Fig.
4F). These results indicate that the knockdown of StarD13
inhibits breast cancer cell motility.
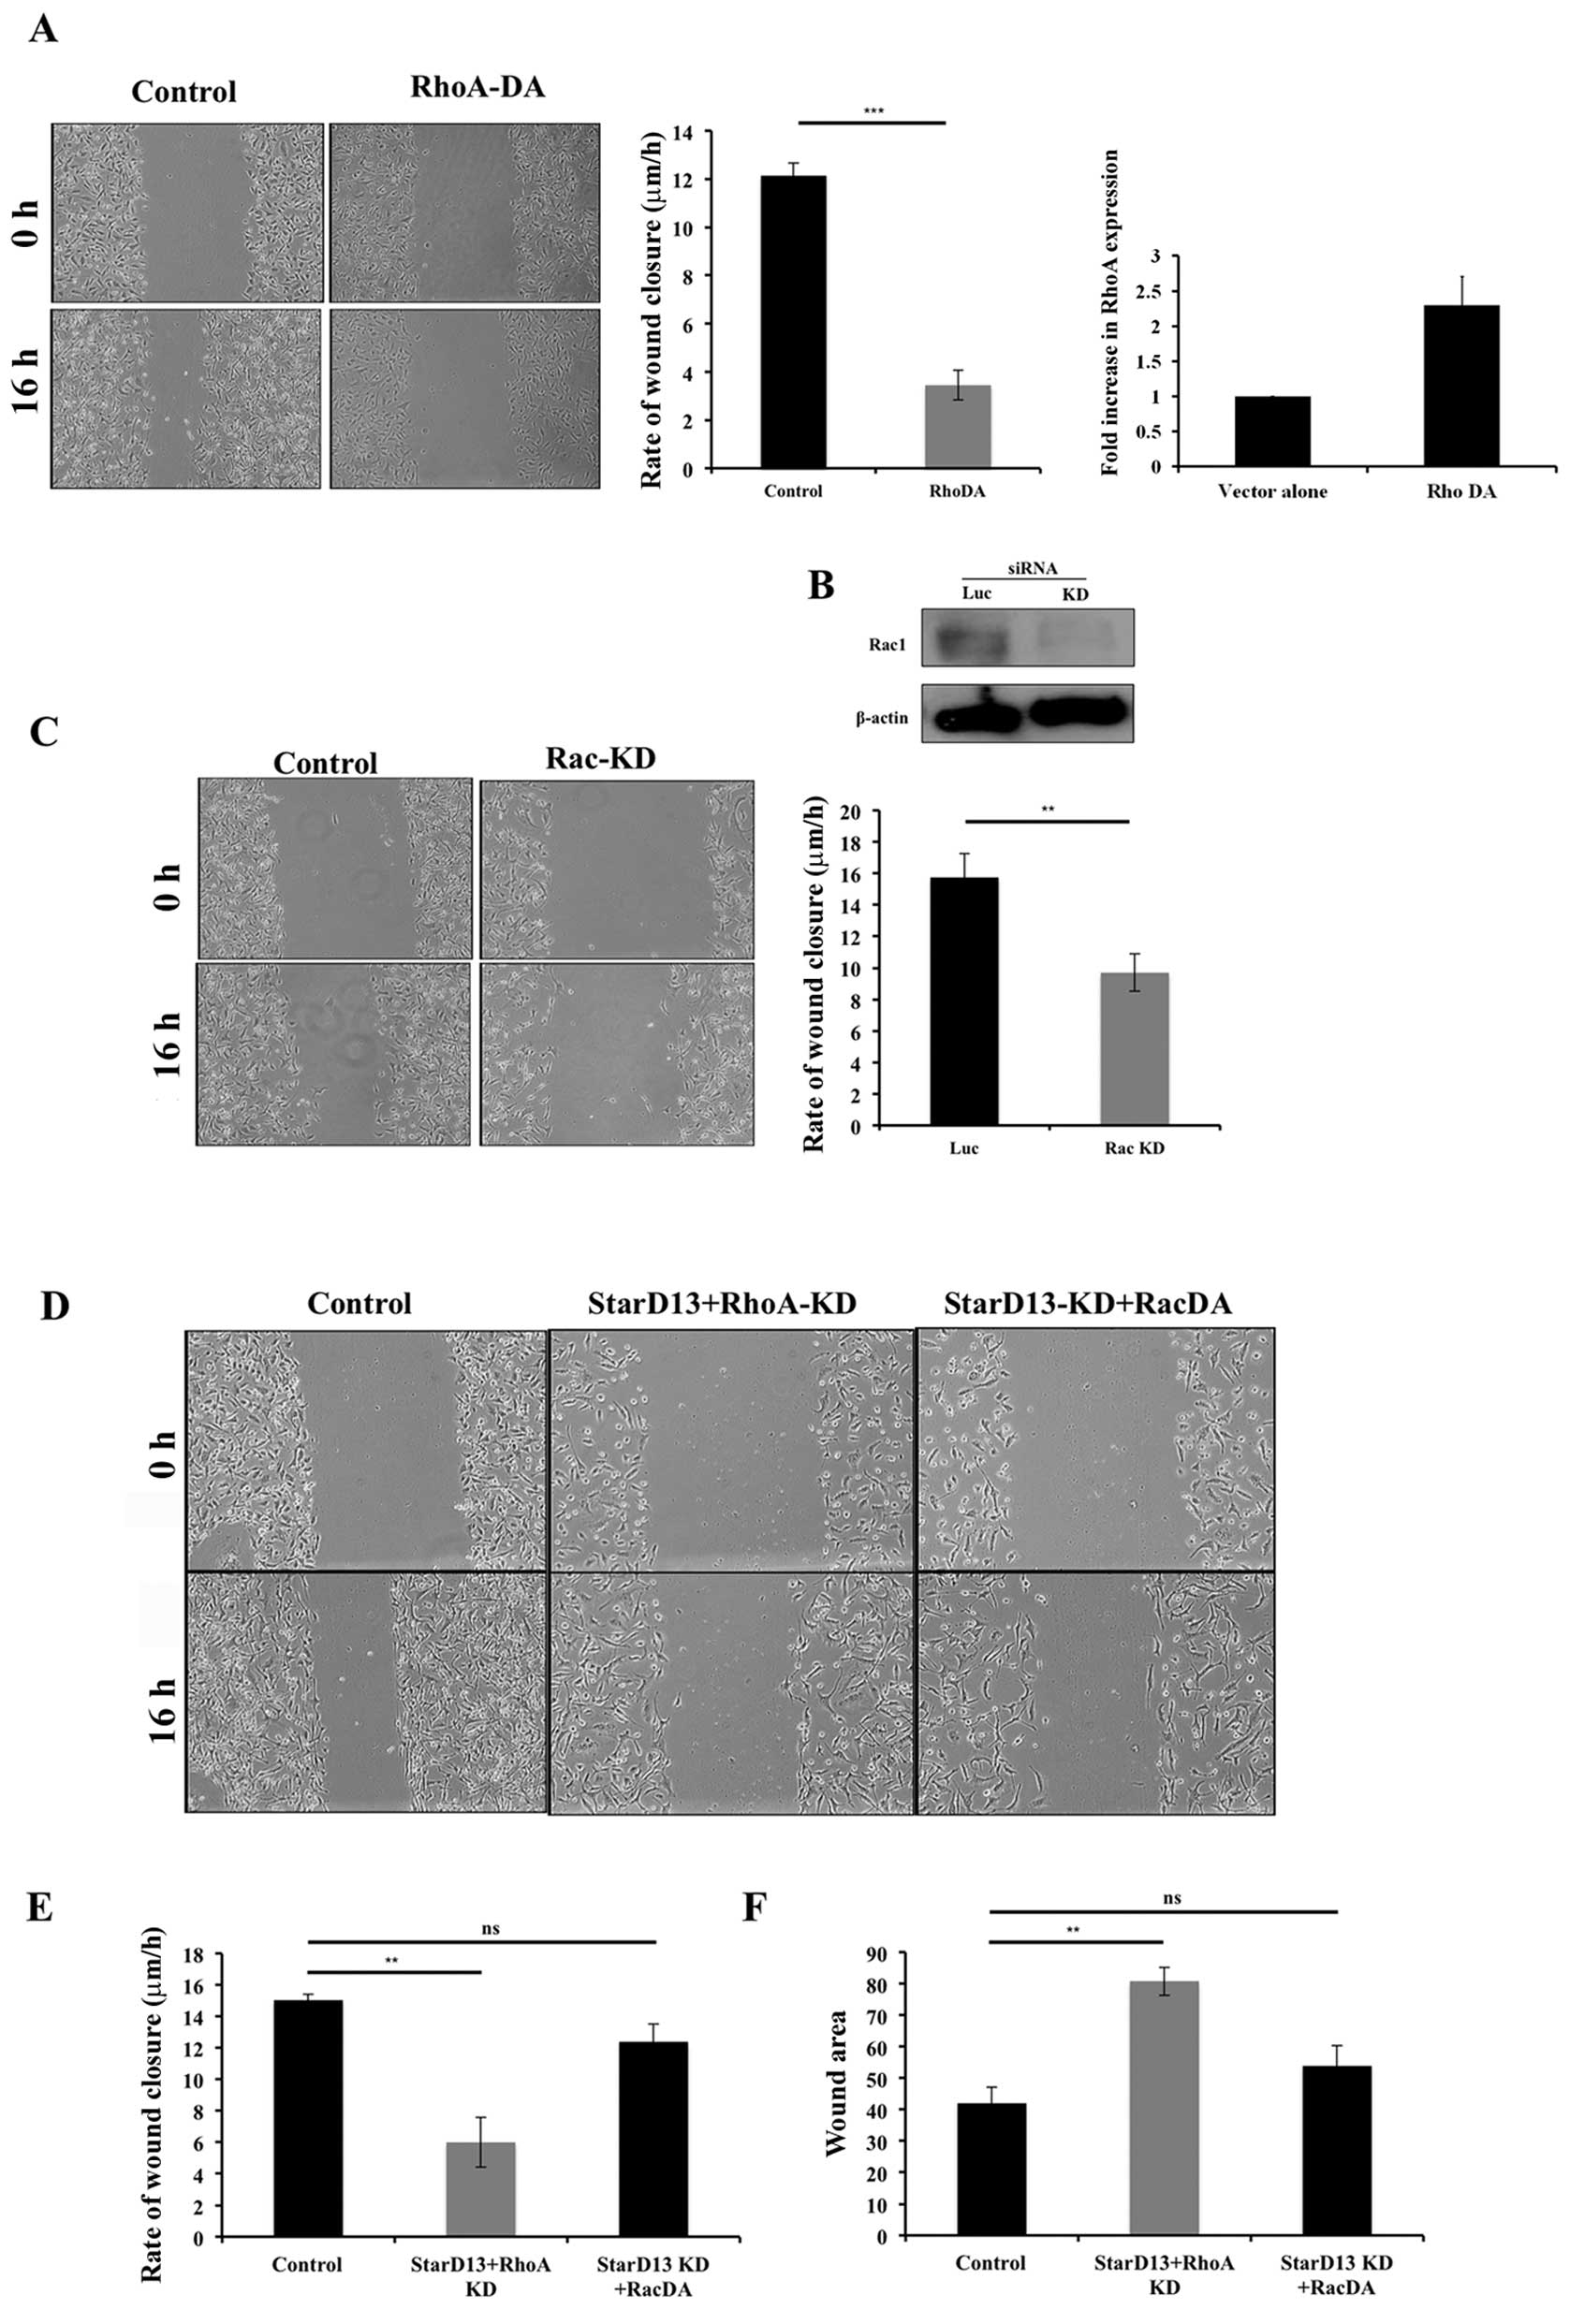
Regulation of RhoA and Rac activations is
necessary for cell movement
After showing that RhoA knockdown inhibits cell
motility (data not shown) and that StarD13 knockdown, where RhoA is
kept active, also inhibits cell motility (Fig. 4) it was of great interest to us to
determine the effect of overexpressing a constitutively active form
of RhoA. Thus, similar to StarD13 knockdown, dominant active RhoA
suppressed cellular motility. This was observed through wound
healing assay where the rate of wound closure was decreased from
12.3 to 3.4 μm/h (Fig. 5A).
Knowing that Rac1 plays a major role in breast cancer motility and
adhesion formation and knowing the antagonistic effect of Rho and
Rac (20), we also opted to
investigate the role of Rac1 in breast cancer cell motility. For
this purpose, Rac1 was knocked down using a specific siRNA. The
resulting expression level was detected by western blotting in
cells transfected with Rac1 siRNA as compared to control cells
transfected with non-specific siRNA (Fig. 5B). Results showed a decrease in the
rate of wound closure in cells transfected with Rac1 siRNA to 9.4
μm/h as compared to control cells (15.7 μm/h)
(Fig. 5C). Since StarD13 knockdown
results in continuous activation of RhoA, we next looked at the
effect StarD13 and RhoA double knockdown. In this case, the rate of
wound closure observed was 6 μm/h (Fig. 5D and E) and almost 80% of the wound
area remained after 16 h of wound formation (Fig. 5F). We also looked at the effect of
StarD13 knockdown coupled with the expression of constitutively
activated Rac1. This resulted in a 12.39 μm/h rate of wound
closure as compared to 15.05 μm/h in control cells, thus
indicating a rescuing effect.
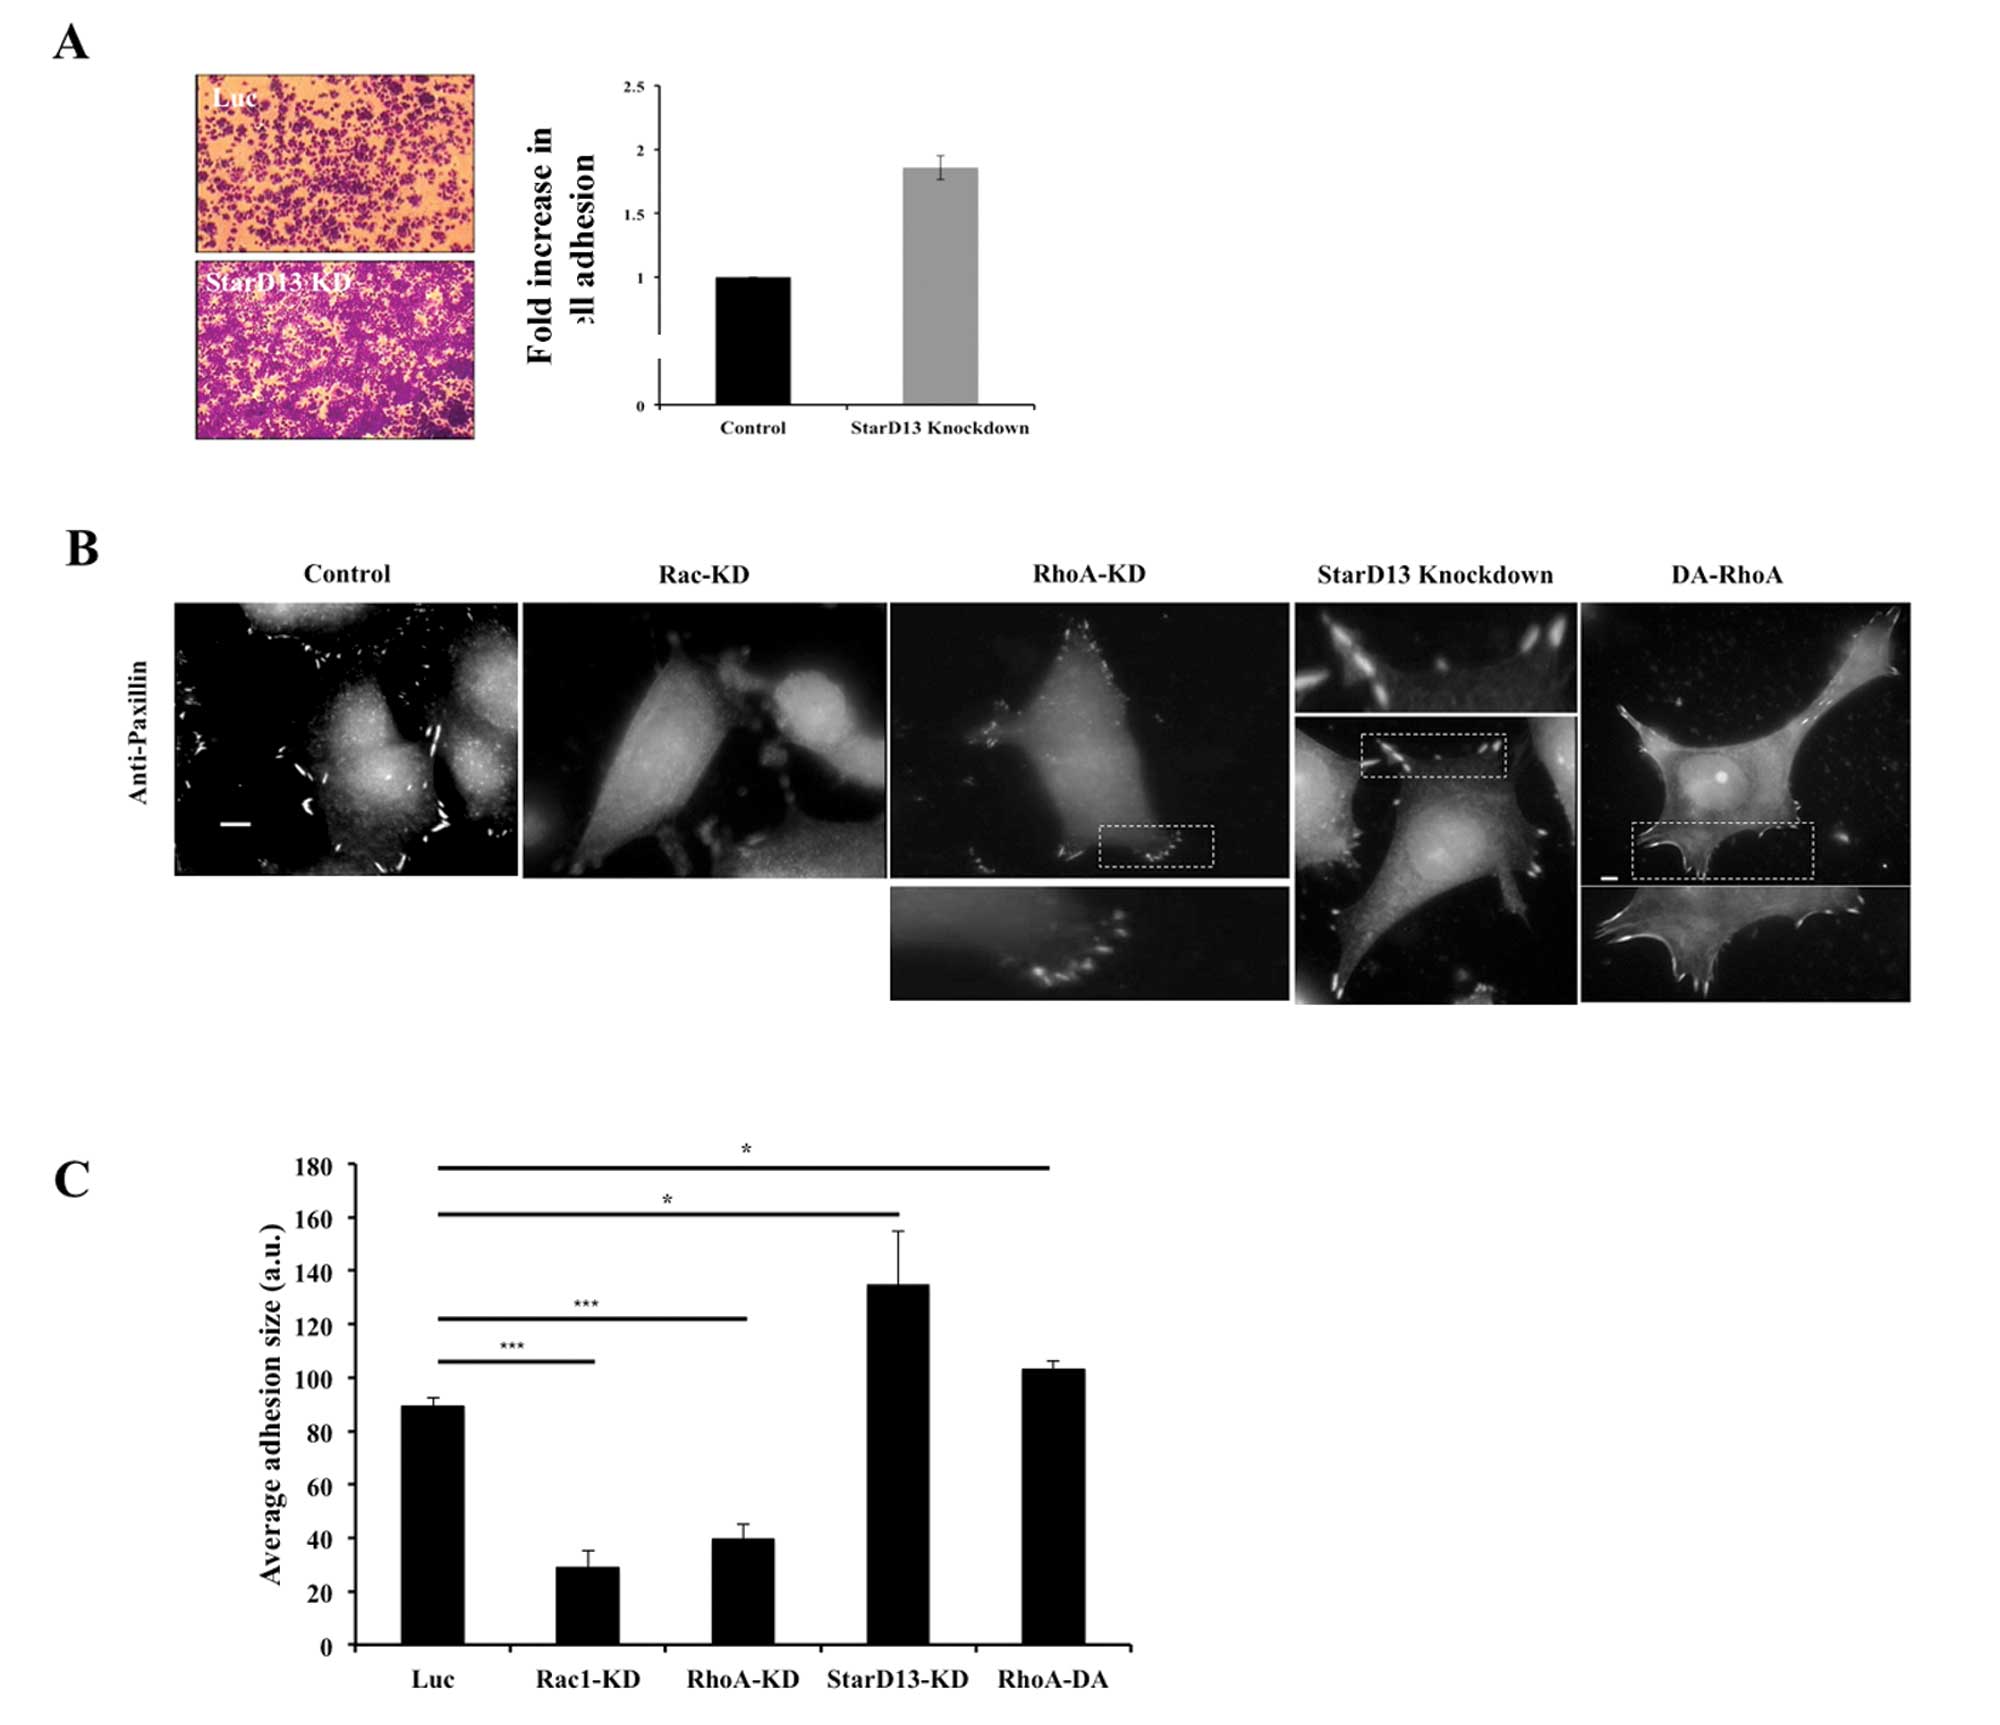
StarD13 exerts its effects on RhoA and
Rac in focal adhesions
Looking at the effect of StarD13 knockdown on the
adhesion of breast cancer cells to collagen, our results show that
cells with StarD13 knockdown have increased adhesion to collagen by
>2-fold as compared to control cells (Fig. 6A).
After showing the effect of StarD13 on cell
motility, we were interested in looking directly at focal adhesion
under conditions where cells are deficient in Rac1 levels as well
RhoA and StarD13. For this reason, we immunostained for Paxillin, a
component of both focal complexes and focal adhesions (17) using anti-paxillin antibody.
In cells with Rac1 knockdown, neither focal
complexes nor focal adhesions were visible at the cell edge
(Fig. 6B), which is correlated
with reduced migration (Fig. 5C).
This is in accordance with previous studies that have shown that
Rac1 is needed for the initial formation of focal contacts
(22). In cells with RhoA
knockdown, focal adhesions were less prevalent compared to control
cells; instead small punctate structures were highly present
representing immature focal complexes (Fig. 6C). This was reflected in a 67%
reduction in the average adhesion size as compared to control cells
in the case of Rac1-knockdown and 55% reduction in cells with RhoA
knockdown (Fig. 6C). In cells with
StarD13-KD; however, focal adhesions were more prominent and more
pronounced especially at the cell edges as compared to control
cells (Fig. 6B). Quantitatively,
the average adhesion increased by ∼34% compared to control cells
(Fig. 6C). Consistent with our
StarD13 siRNA knockdown, we found that transfecting the cells with
a dominant active form of RhoA lead to the stabilization of focal
adhesions (Fig. 6B). This was also
reflected by a 13.5% increase in average adhesion size in cells
transfected with a dominant active form of RhoA as compared to
control cells (Fig. 6C).
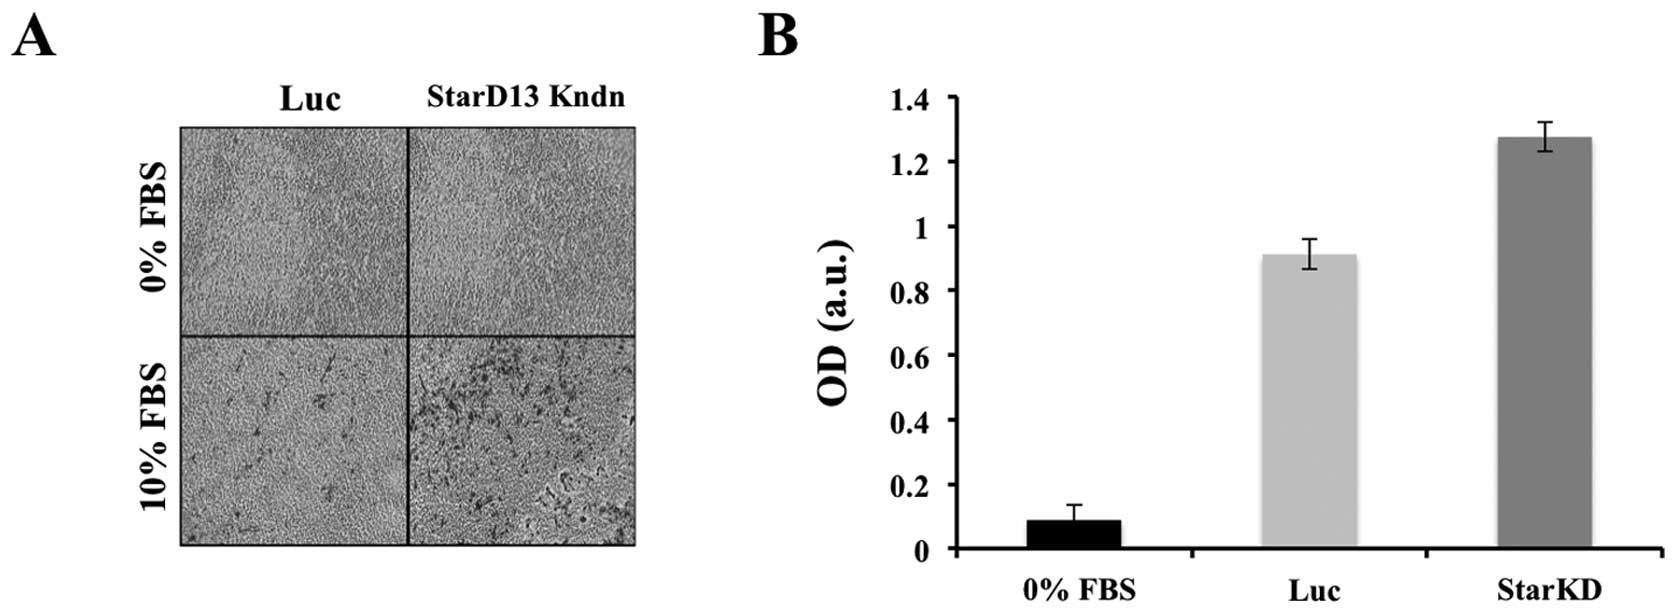
StarD13 increases cellular invasion
After establishing the role of StarD13 in 2D cell
migration, we were interested in determining its role in 3D cell
invasion. For this reason, we performed an in vitro
collagen-based invasion assay using FBS as a chemo-attractant. A
chamber with serum-free media in both wells was used as negative
control. To our surprise, unlike its effect in 2D, there was nearly
a half-fold increase in cell invasion in cells with StarD13
knockdown as compared to control cells (Fig. 7).
Proposed model for StarD13
regulation
Our results showed that StarD13 negatively affects
cellular proliferation. However, having a RhoGAP activity and
localizing to focal adhesions of the cell, we showed that StarD13
actually plays an essential role in cellular motility. This
correlated to the increase in its expression in metastatic forms of
the tumor. In this context, looking at the dynamics of focal
adhesion, StarD13 seemed to be involved in the inhibition of RhoA
following the maturation of FAs that results in the detachment and
forward movement of the cell. Upon silencing StarD13 using siRNA,
cells showed elongated tail morphology with stabilized focal
adhesions and inhibitory cellular motility. However, this was not
correlated in 3D mode, where we saw that cells with StarD13
knockdown seemed to have an enhanced invasive ability.
Discussion
In the present study, we opted to characterize
StarD13 in breast cancer in terms of expression, effect on cell
proliferation and viability, GAP activity and role in motility and
invasion. Previous studies by Ching et al (12) identified StarD13 as a tumor
suppressor gene in hepatocellular carcinoma cells. In the present
study, we examined the role of StarD13 in breast cancer cell
proliferation and motility. Looking at its level of expression by
IHC we revealed that StarD13 is highly expressed in non-tumor in
situ form of breast cancer and it is downregulated in grades I
and II, suggesting the potential role of StarD13 as a tumor
suppressor in breast cancer. This was in accordance with previous
studies where StarD13 was found to be underexpressed in several
cancer types including lung, colon, gastric, ovarian, uterine,
renal and rectal tumors (13).
However, StarD13 showed a relatively high expression in highly
metastatic forms of breast cancer. This was supplemented by data
obtained from Oncomine database in which mRNA levels of StarD13
were reduced in grades I and II as compared to normal, however,
were shown to increase in higher grades of the tumor. This was in
accordance with a previous study in astrocytoma where StarD13 was
shown to be overexpressed in grades III and IV as compared to
grades I and II of the tumor (16).
We also showed that StarD13 has an
anti-proliferative effect on breast cancer cells. This was evident
when the overexpression of StarD13 dramatically increased cell
death. In contrast, silencing StarD13 using specific siRNAs led to
a decrease in cell death and an increase in cellular viability.
Although no effect was apparent on apoptosis upon knocking down
StarD13 these cells, further analysis of the cell cycle showed that
silencing StarD13 lead to slight increase in dividing cells. This
is consistent with its role as a tumor suppressor. Therefore,
consistent with the literature, StarD13 seems to function as a
tumor suppressor in breast cancer.
While examining the role of StarD13 in cell
motility, we found that the knockdown of StarD13 in breast cancer
cell lines inhibited cell motility. This may explain the increase
of StarD13 expression in grades III obtained in IHC. Hence although
being a tumor suppressor, this protein is needed for motility.
Indeed, looking at their morphology, StarD13 knockdown cells were
immobilized and unable to detach their tail in order to retract
their cell body and move forward. This was also reflected by an
increase in cellular attachment through the stabilization of focal
adhesions.
RhoA has been extensively proven to be indispensable
for the formation of focal adhesions and for cell motility in
several systems (18,19). Our data show that knockdown of RhoA
leads to inhibition of cellular motility. As a RhoA-GAP, StarD13
knockdown is hypothesized to result in continuous activation of
RhoA. This surprisingly also led to an inhibition of cell motility.
StarD13 and RhoA double knockdown also resulted in a dramatic
inhibition of the cells ability to migrate. These experiments show
that, while required for motility, consistent RhoA activation
inhibits it suggesting that RhoA needs to go through cycles of
activation and inactivation. On the other hand, cells with StarD13
knockdown coupled with the expression of constitutively activated
Rac1 showed increased migration ability in wound healing similar to
StarD13 knockdown cells indicating a rescuing effect. This could be
explained by the antagonistic relationship between RhoA and Rac.
When StarD13 is knocked down, RhoA is constitutively active which
inhibits Rac. This inhibits motility as Rac is also required for
motility. Furthermore, it has been previously shown that increasing
Rho activation inhibits the dissolution of focal adhesions at the
tail of moving cells, inhibiting cell motility (20,21).
Thus, we formulated the hypothesis that StarD13 knockdown is
keeping RhoA active in focal adhesions at the tail leading to the
inhibition of cell motility. This persistent activation of RhoA is
also keeping Rac inhibited not allowing Rac to initiate focal
complexes which are precursors for focal adhesions as described
below.
Knowing that Rac1 plays a major role in breast
cancer motility and adhesion formation and knowing the antagonistic
effect of RhoA and Rac (20), we
started by looking at the dynamics of cellular adhesion directly
following Rac and RhoA knockdowns. In cells with Rac knockdown,
neither focal complexes nor focal adhesions were observed. This is
in accordance with the fact that Rac is needed for the formation of
focal complexes (22). Moreover,
cells underexpressing RhoA showed inability to form mature focal
adhesions. Similarly previous studies done on MTLn3 cells showed
that inhibition of RhoA downstream effector ROCK blocked the
maturation of focal adhesions in MTLn3 cells (23). However, silencing StarD13 led to
the stabilization of focal adhesions and decrease in focal
complexes. Hence, we suspected that cells with StarD13 knockdown,
seem to have a constitutively active RhoA stabilizing cellular
adhesion to the underlying substratum and impeding tail retraction
resulting in inhibition of cell motility. The disassembly of focal
adhesions is required for the completion of the cell motility
cycle. This suggests that StarD13 plays a role in inhibiting RhoA
leading to the detachment of the cell. In this sense,
overexpressing a dominant active form of RhoA would mimic StarD13
knockdown phenotype in cell motility and adhesion. Indeed,
transfecting the cells with a constitutively active RhoA inhibited
cell motility and cells showed larger and more abundant focal
adhesions relative to focal complexes. Similar studies involving
the use of dominant active RhoA have demonstrated an inhibition of
cellular motility (24–26).
Taken together, our data show that even though
StarD13 is known to be a tumor suppressor, it is needed for
motility. This controverts traditional concepts regarding definite
roles of tumor suppressors versus oncogenes in different cancer
types. Studies done on DLC1, a closely related gene,
reported its function as a candidate tumor suppressor in
hepatocellular carcinoma (27).
Further studies showed that hypermethylation of DLC1 gene
promoter is responsible for the loss of its function as a tumor
suppressor in a subset of liver, colon and prostate cancers
(15,28–30).
Other studies also confirm the role of DLC1 as a tumor suppressor
(29). In this framework,
overexpression of DLC1 was shown to exhibit inhibitory effects on
cell growth and proliferation in hepatocellular and breast cancer
(28,30,31).
Moreover, DLC1 activity was shown to positively regulate the
cytoskeleton and ultimately cell motility. This regulatory
mechanism was linked to the its negative regulation of RhoA through
its GAP activity (32,33). Another recent study done on normal
prostate cells showed that silencing of DLC1 reduces migration
(34). In fact, recent studies
showed that DLC1 plays differential roles in regulating cell
migration and transformation depending on its interaction with
tensins (35). This highlights the
differential role of the DLC family of proteins as tumor
suppressors yet needed for cell motility. A comparable dilemma is
illustrated in a recent review on TGF-β that is known to exert
tumor-suppressive effects in normal cells yet paradoxically, in
protumorigenic cells its role is reversed (36).
After determining the mechanism by which StarD13
might affect random 2D cell motility, it was intriguing to study
its effect on cellular invasion in 3D. For this we transfected the
cells with siRNA against starD13 and performed collagen-based
transwell invasion assay. Knowing that StarD13 knockdown inhibited
cellular motility in 2D it was assumed that it would also inhibit
cell invasion. However, to our ultimate surprise, silencing StarD13
had a positive effect on cellular invasion, despite the fact that
StarD13 knockdown stabilizes focal adhesions. This might be due to
focal adhesions playing an unconventional role in cellular
invasion. A recent report exists on the contribution of focal
adhesions to matrix degradation. Results revealed that several cell
lines degraded underlying ECM specifically at focal adhesion sites.
This process occurred through proteolytic activity of MMPs and not
due to physical tension exerted by FAs onto the matrix (37). Moreover, other studies demonstrated
that silencing RhoA leads to the inhibition of cellular invasion,
particularly in breast cancer cell lines (38,39).
This solidifies our data with starD13 knockdown where we typically
have an increase in RhoA activity, thus promoting cellular
invasion. Moreover, it was previously discovered that in 3D
matrices, tumor cells are able to switch between distinct modes of
motility (40). This pertains to
the interplay between different signaling requirements. Thus, cells
can switch between a rounded blebbing movement and a more elongated
protrusive fashion. Thus in our study, the depletion of StarD13
increased cellular adhesion to the ECM impeding 2D mesenchymal
cellular migration; however, this was reflected in an increase in
3D movement. This suggests that when cells cannot move in an
adhesion-dependent manner, they tend to switch to a more amoeboid
fashion. Therefore, the ability of tumor cells to switch between
modes of motility may limit the effectiveness of prospective
inhibitory strategies targeting particular cell morphology, hence
promoting the selection of a different mode to escape
inhibition.
We conclude that StarD13 tumor suppressor activity
is contextual where tumor cells manage to exploit alternative
mechanisms to escape inhibition. This reveals the importance of
understanding the complexity and diversity of these pathways as a
tool in paving the way for finding potential therapeutic
targets.
Acknowledgements
The authors would like to thank Drs
Hitoshi Yagisawa and Hideki Yamaguchi for providing constructs. The
ROI_Tracker software was supplied by David Entenberg and John
Condeelis as supported by CA100324 and GM064346. This study was
supported by the Natural Science Department at the Lebanese
American University, by the University Research Council (URC) at
LAU and by the Lebanese National Center for Scientific Research
(L-NCSR) (Ref: 03-06-10).
References
|
1.
|
Jiang P, Enomoto A and Takahashi M: Cell
biology of the movement of breast cancer cells: intracellular
signalling and the actin cytoskeleton. Cancer Lett. 284:122–130.
2009. View Article : Google Scholar
|
|
2.
|
Claus EB, Stowe M and Carter D: Breast
carcinoma in situ: risk factors and screening patterns. J Natl
Cancer Inst. 93:1811–1817. 2001. View Article : Google Scholar : PubMed/NCBI
|
|
3.
|
Bombonati A and Sgroi DC: The molecular
pathology of breast cancer progression. J Pathol. 223:307–317.
2011. View Article : Google Scholar
|
|
4.
|
van Golen KL: Inflammatory breast cancer:
relationship between growth factor signaling and motility in
aggressive cancers. Breast Cancer Res. 5:174–179. 2003.PubMed/NCBI
|
|
5.
|
Sahai E and Marshall CJ: RHO-GTPases and
cancer. Nat Rev Cancer. 2:133–142. 2002. View Article : Google Scholar
|
|
6.
|
Tang Y, Olufemi L, Wang MT and Nie D: Role
of Rho GTPases in breast cancer. Front Biosci. 13:759–776. 2008.
View Article : Google Scholar : PubMed/NCBI
|
|
7.
|
Etienne-Manneville S and Hall A: Rho
GTPases in cell biology. Nature. 420:629–635. 2002. View Article : Google Scholar
|
|
8.
|
Vega FM and Ridley AJ: Rho GTPases in
cancer cell biology. FEBS Lett. 582:2093–2101. 2008. View Article : Google Scholar : PubMed/NCBI
|
|
9.
|
Takai Y, Sasaki T and Matozaki T: Small
GTP-binding proteins. Physiol Rev. 81:153–208. 2001.PubMed/NCBI
|
|
10.
|
Moon SY and Zheng Y: Rho GTPase-activating
proteins in cell regulation. Trends Cell Biol. 13:13–22. 2003.
View Article : Google Scholar : PubMed/NCBI
|
|
11.
|
Grise F, Bidaud A and Moreau V: Rho
GTPases in hepatocellular carcinoma. Biochim Biophys Acta.
1795:137–151. 2009.PubMed/NCBI
|
|
12.
|
Ching YP, Wong CM, Chan SF, et al: Deleted
in liver cancer (DLC) 2 encodes a RhoGAP protein with growth
suppressor function and is underexpressed in hepatocellular
carcinoma. J Biol Chem. 278:10824–10830. 2003. View Article : Google Scholar : PubMed/NCBI
|
|
13.
|
Ullmannova V and Popescu NC: Expression
profile of the tumor suppressor genes DLC-1 and DLC-2 in solid
tumors. Int J Oncol. 29:1127–1132. 2006.
|
|
14.
|
Thorsell AG, Lee WH, Persson C, et al:
Comparative structural analysis of lipid binding START domains.
PLoS One. 6:e195212011. View Article : Google Scholar : PubMed/NCBI
|
|
15.
|
Liao YC and Lo SH: Deleted in liver
cancer-1 (DLC-1): a tumor suppressor not just for liver. Int J
Biochem Cell Biol. 40:843–847. 2008. View Article : Google Scholar : PubMed/NCBI
|
|
16.
|
El-Sitt S, Khalil BD, Hanna S, El-Sabban
M, Fakhreddine N and El-Sibai M: DLC2/StarD13 plays a role of a
tumor suppressor in astrocytoma. Oncol Rep. 28:511–518.
2012.PubMed/NCBI
|
|
17.
|
Nobes CD and Hall A: Rho GTPases control
polarity, protrusion, and adhesion during cell movement. J Cell
Biol. 144:1235–1244. 1999. View Article : Google Scholar : PubMed/NCBI
|
|
18.
|
Wolfenson H, Henis YI, Geiger B and
Bershadsky AD: The heel and toe of the cell’s foot: a multifaceted
approach for understanding the structure and dynamics of focal
adhesions. Cell Motil Cytoskeleton. 66:1017–1029. 2009.
|
|
19.
|
Arjonen A, Kaukonen R and Ivaska J:
Filopodia and adhesion in cancer cell motility. Cell Adh Migr.
5:421–430. 2011. View Article : Google Scholar : PubMed/NCBI
|
|
20.
|
Sander EE, ten Klooster JP, van Delft S,
van der Kammen RA and Collard JG: Rac downregulates Rho activity:
reciprocal balance between both GTPases determines cellular
morphology and migratory behavior. J Cell Biol. 147:1009–1022.
1999. View Article : Google Scholar
|
|
21.
|
Cox EA, Sastry SK and Huttenlocher A:
Integrin-mediated adhesion regulates cell polarity and membrane
protrusion through the Rho family of GTPases. Mol Biol Cell.
12:265–277. 2001. View Article : Google Scholar : PubMed/NCBI
|
|
22.
|
Kaverina I, Krylyshkina O and Small JV:
Regulation of substrate adhesion dynamics during cell motility. Int
J Biochem Cell Biol. 34:746–761. 2002. View Article : Google Scholar : PubMed/NCBI
|
|
23.
|
El-Sibai M, Pertz O, Pang H, et al:
RhoA/ROCK-mediated switching between Cdc42- and Rac1-dependent
protrusion in MTLn3 carcinoma cells. Exp Cell Res. 314:1540–1552.
2008. View Article : Google Scholar
|
|
24.
|
Banyard J, Anand-Apte B, Symons M and
Zetter BR: Motility and invasion are differentially modulated by
Rho family GTPases. Oncogene. 19:580–591. 2000. View Article : Google Scholar : PubMed/NCBI
|
|
25.
|
Vial E, Sahai E and Marshall CJ: ERK-MAPK
signaling coordinately regulates activity of Rac1 and RhoA for
tumor cell motility. Cancer Cell. 4:67–79. 2003. View Article : Google Scholar : PubMed/NCBI
|
|
26.
|
Tkach V, Bock E and Berezin V: The role of
RhoA in the regulation of cell morphology and motility. Cell Motil
Cytoskeleton. 61:21–33. 2005. View Article : Google Scholar : PubMed/NCBI
|
|
27.
|
Yuan BZ, Miller MJ, Keck CL, Zimonjic DB,
Thorgeirsson SS and Popescu NC: Cloning, characterization, and
chromosomal localization of a gene frequently deleted in human
liver cancer (DLC-1) homologous to rat RhoGAP. Cancer Res.
58:2196–2199. 1998.
|
|
28.
|
Yuan BZ, Durkin ME and Popescu NC:
Promoter hypermethylation of DLC-1, a candidate tumor suppressor
gene, in several common human cancers. Cancer Genet Cytogenet.
140:113–117. 2003. View Article : Google Scholar : PubMed/NCBI
|
|
29.
|
Durkin ME, Yuan BZ, Zhou X, et al: DLC-1:a
Rho GTPase-activating protein and tumour suppressor. J Cell Mol
Med. 11:1185–1207. 2007. View Article : Google Scholar : PubMed/NCBI
|
|
30.
|
Yuan BZ, Zhou X, Durkin ME, et al: DLC-1
gene inhibits human breast cancer cell growth and in vivo
tumorigenicity. Oncogene. 22:445–450. 2003. View Article : Google Scholar : PubMed/NCBI
|
|
31.
|
Ng IO, Liang ZD, Cao L and Lee TK: DLC-1
is deleted in primary hepatocellular carcinoma and exerts
inhibitory effects on the proliferation of hepatoma cell lines with
deleted DLC-1. Cancer Res. 60:6581–6584. 2000.PubMed/NCBI
|
|
32.
|
Kim TY, Vigil D, Der CJ and Juliano RL:
Role of DLC-1, a tumor suppressor protein with RhoGAP activity, in
regulation of the cytoskeleton and cell motility. Cancer Metastasis
Rev. 28:77–83. 2009. View Article : Google Scholar : PubMed/NCBI
|
|
33.
|
Zhong D, Zhang J, Yang S, et al: The SAM
domain of the RhoGAP DLC1 binds EF1A1 to regulate cell migration. J
Cell Sci. 122:414–424. 2009. View Article : Google Scholar : PubMed/NCBI
|
|
34.
|
Shih YP, Takada Y and Lo SH: Silencing of
DLC1 upregulates PAI-1 expression and reduces migration in normal
prostate cells. Mol Cancer Res. 10:34–39. 2012. View Article : Google Scholar : PubMed/NCBI
|
|
35.
|
Cao X, Voss C, Zhao B, Kaneko T and Li SS:
Differential regulation of the activity of deleted in liver cancer
1 (DLC1) by tensins controls cell migration and transformation.
Proc Natl Acad Sci USA. 109:1455–1460. 2012. View Article : Google Scholar : PubMed/NCBI
|
|
36.
|
Massague J: TGFbeta in Cancer. Cell.
134:215–230. 2008. View Article : Google Scholar
|
|
37.
|
Wang Y and McNiven MA: Invasive matrix
degradation at focal adhesions occurs via protease recruitment by a
FAK-p130Cas complex. J Cell Biol. 196:375–385. 2012. View Article : Google Scholar : PubMed/NCBI
|
|
38.
|
Pille JY, Denoyelle C, Varet J, et al:
Anti-RhoA and anti-Rh˚C siRNAs inhibit the proliferation and
invasiveness of MDA-MB-231 breast cancer cells in vitro and in
vivo. Mol Ther. 11:267–274. 2005.PubMed/NCBI
|
|
39.
|
Wu M, Wu ZF, Rosenthal DT, Rhee EM and
Merajver SD: Characterization of the roles of RHOC and RHOA GTPases
in invasion, motility, and matrix adhesion in inflammatory and
aggressive breast cancers. Cancer. 116:2768–2782. 2010. View Article : Google Scholar : PubMed/NCBI
|
|
40.
|
Sahai E and Marshall CJ: Differing modes
of tumour cell invasion have distinct requirements for Rho/ROCK
signalling and extracellular proteolysis. Nat Cell Biol. 5:711–719.
2003. View Article : Google Scholar : PubMed/NCBI
|