Introduction
Ovarian cancer is the second most common gynecologic
cancer and causes more deaths than any other malignant tumor of the
female reproductive system (1).
Unfortunately, the relatively asymptomatic nature of early ovarian
cancer leaves most patients undiagnosed until advanced stages,
which are usually incurable by surgery or chemotherapy. The
majority of patients are diagnosed at an advanced stage, with a
5-year survival rate of only 35%, compared to 90% for early-stage
tumors, according to the International Federation of Gynecology and
Obstetrics (FIGO) in 2013 (2–4).
Identifying tumor biomarkers in biological fluids, such as serum,
plasma and urine, is one of the most significant aspects of
proteomic research. For this reason, it is necessary to understand
the molecular alterations that occur during the development of
ovarian cancer and use the information to more efficiently identify
sensitive biomarkers suitable for the early detection of ovarian
cancer.
Cancer cells secrete different kinds of proteins
that can enter the blood circulation. Consequently, the serum
proteome may reflect the abnormality or pathologic state of the
disease (5). Comparative protein
profiling is a promising way of detecting of specific protein
expression of cancer, which may serve as a novel serum biomarker.
Surface-enhanced laser desorption/ionization time-of-flight mass
spectrometry (SELDI-TOF-MS) is a better tool for proteomic research
than classic 2-dimensional electrophoresis. It combines
chromatography with mass spectrometry, and it can provide rapid,
reproducible, high-throughput protein profiles from trace
biological samples (6,7). Many studies have reported the use of
SELDI-TOF-MS in the early diagnosis of cancers, such as lung
cancer, esophageal cancer and breast cancer (8–11).
SELDI-TOF-MS was used to profile changes in the
serum proteome changes of Fischer 344 rats with ovarian cancer
during tumor development. The differential expression of
proteinogram before and after tumor generation in rats offered
useful information regarding proteins and genes that may be a key
to carcinogenesis. It may also facilitate identification of novel
serum biomarkers suitable for detection of ovarian cancer (7,12).
Materials and methods
Cell lines and culture conditions
The Fischer 344-rat-derived epithelial ovarian
carcinoma cell line NuTu-19 was a kind gift provided by Dr Airong
Zhang of the Second Hospital of Shandong University. The NuTu-19
cells were maintained in complete media consisting of Dulbecco’s
modified Eagle’s medium (DMEM; Gibco-Life Technologies) with 10%
heat-inactivated fetal bovine serum (Gibco-Life Technologies) at
37°C, 5% CO2 and 100% humidity.
The animal model
Female pathogen-free Fischer 344 rats (100–125 g)
were obtained from Weitong Lihua, Inc., Beijing, China, and housed
in a pathogen-free animal facility. Rats were kept in an
environment with a 12-h light 12-h dark cycle and free access to
food and water in the animal facility of the Shandong University
Medical School. The present study was carried out in strict
accordance with the guidelines for the Animal Care and Use of the
Shandong University, China. The protocol was approved by the
Committee on the Ethics of Animal Experiments in Qilu Hospital of
Shandong University, and an informed consent form was provided by
them. Surgery was performed under sodium pentobarbital anesthesia,
and all efforts were made to minimize suffering.
NuTu-19 cells were harvested with 0.25% trypsin and
0.01% ethylenediaminetetraacetic acid (EDTA) and washed twice with
phosphate-buffered saline (PBS) solution. Then a total of
106 cells were injected intraperitoneally into each rat.
The animals were observed daily and weighed weekly. All animals
grew in parallel and the body weight of each rat was kept uniform
throughout the experiment.
Serum sample preparation
Peripheral blood (0.5 ml) was collected from the
axillary vein of rats on day A (1 week before tumor cell
injection), day B (4 weeks after injection), and day C (6 weeks
following injection). Each blood sample was allowed to clot and was
centrifuged at 3,000 rpm for 20 min soon after collection to remove
all cellular components. Then, serum samples were aliquoted into
10-μl sections and kept at −80°C until use. The serum samples were
centrifuged at 10,000 rpm for 20 min at 4°C and then diluted 1:3
into 20 μl U9 buffer solution (9 mol/l urea, 2% CHAPS, 50 mmol/l
Tris-HCl, pH 9.0, 1% DTT) before testing. After incubation on ice
for 30 min, the samples were diluted again 1:13 into 360 μl of
sodium acetate buffer solution (50 mmol/l NaAc, pH 4.0). Then the
samples were ready for SELDI testing.
SELDI analysis
Four different types of chip (Ciphergen Biosystems,
Inc., Fremont, CA, USA) with surface chemistry of hydrophobic
(H50), ionic (CM10), cationic (WCX2), and metal binding (IMAC3)
were tested to determine which produced the best serum profiles.
The CM10 ProteinChip, which is a weak cationic exchanger, was
selected for the present study (7,8). The
CM10 ProteinChip was activated with 10 mM HCl and equilibrated with
binding buffer (100 mM ammonium acetate). Then serum samples were
added to the 8-spot ProteinChip. The samples were allowed to
incubate at room temperature for 60 min on a platform shaker, and
then the array was washed twice with 200 μl binding buffer for 5
min, followed by two quick rinses with HEPES water. Before SELDI
analysis, 0.5 μl saturated EAM solution (sinapinic acid in 50%
aqueous acetonitrile and 0.5% trifluoroacetic acid) was loaded onto
each spot twice, allowing the surface of the array to air-dry
between each EAM application (8,13,14).
Chips loaded with samples were placed on the Protein
Biological System II mass spectrometer reader (Ciphergen
Biosystems). Time-of-flight spectra were generated by averaging 60
laser shots and collected in the positive mode at laser intensity
185 and detector sensitivity 8 with molecular weight optimized from
2,000 to 10,000 Da (15). Mass
accuracy was calibrated on the day of measurements before data
collection using the All-in-one peptide molecular mass standard
(8).
The reproducibility of SELDI spectra from array to
array on a single chip (intra-assay) and between chips
(inter-assay) was determined using the pooled normal serum quality
control (QC) sample (16). Three
peaks in the range of 5,000–10,000 Da were selected randomly on
spectra and used to calculate the coefficient of variance. The
intra-assay analyses were performed in quadruplicate and the
inter-assay analyses were performed on three different days.
Peak detection, data analysis and
decision tree classification
Data analysis involved peak detection, alignment and
selection of peaks with the highest discriminatory power. All
spectra were collected using ProteinChip Biomarker software version
3.2 (Ciphergen Biosystems). Spectra range from 2,000 to 20,000 m/z
was selected for analysis. The study focused on this region to
eliminate low-mass (m/z <1,000) and low-intensity peaks (m/z
>20,000). Peak detection involved baseline subtraction, mass
accuracy calibration and automatic peak detection (17). Mean spectra generated from
different times were compared using the t-test.
Decision tree analyses were performed using
Biomarker Patterns Software (BPS; Bio-Rad Laboratories). For each
sample, the intensity values for each protein peak were entered in
BPS and classified according to the tree analysis described. The
BPS program can combine multiple biomarkers to distinguish between
independent groups, thereby increasing sensitivity and specificity
compared with single biomarker predictors. BPS was also used to
perform a 10-fold cross-validation because the size of the data set
was too small for an independent validation set. This process
allows the sensitivity and specificity to be predicted for future
data and provides an accurate estimate of the predictive accuracy
of the selected decision tree (7,13,15).
Results
Tumor model
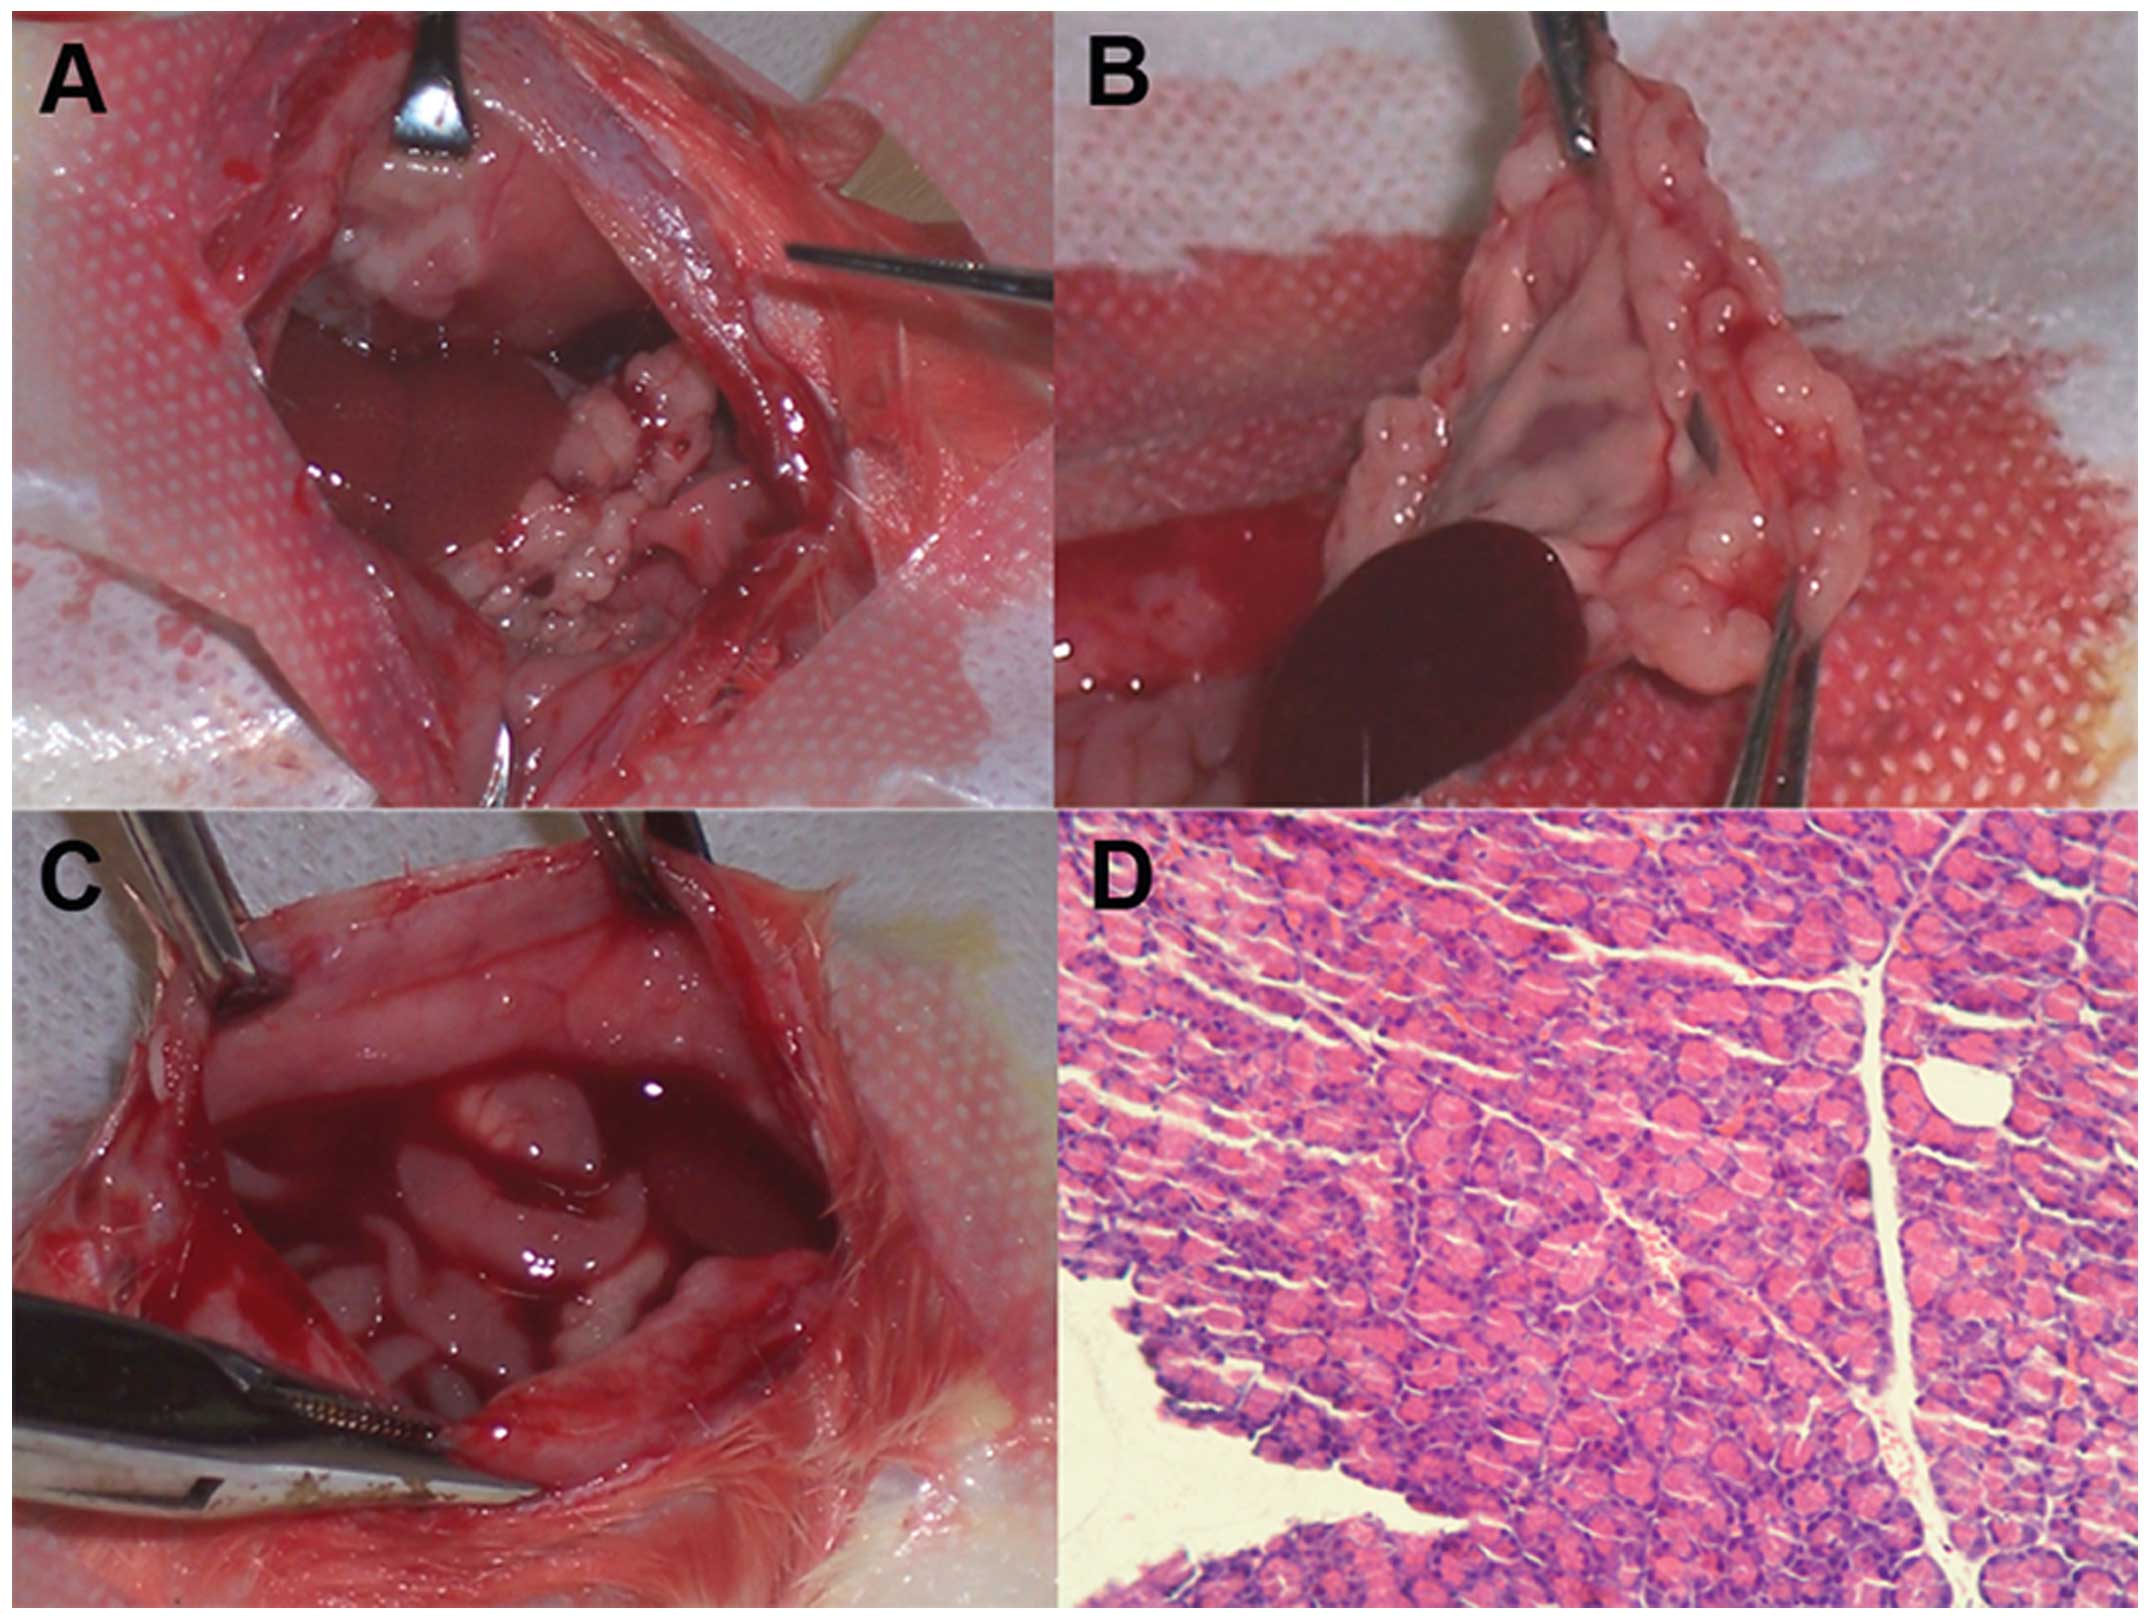
NuTu-19 cells grew progressively in the abdominal
cavity in a manner typical of human ovarian epithelial carcinomas.
At the fourth week after injection of 106 cells, the
rats showed no obvious features of cancer. However, during the
sixth week, all animals developed cancer in the peritoneal cavity,
represented by numerous serosal nodules (peritoneum, omentum,
diaphragm and bowel), omentum contraction and malignant bloody
ascites. Characteristics of cachexia such as pallor (anemia),
marasmus and abundance of bloody ascites appeared gradually. At the
end of the study, all animals were sacrificed and tumor tissues
were removed for section and H&E staining. Pathohistological
results confirmed the existence of adenocarcinoma tissue (Fig. 1).
Reproducibility
Accurate and reproducible feature selection is
essential for SELDI application. The reproducibility of the current
SELDI spectra was confirmed successfully, using a QC sample. The
intra and inter-assay coefficients of variance for peak location
were both 0.05%, and the intra- and inter-assay coefficients of
variance for normalized intensity were 12 and 18%, respectively.
Little variation was shown across day-to-day sampling and
differences in instrumentation and chips (16,18).
SELDI spectra of rat serum
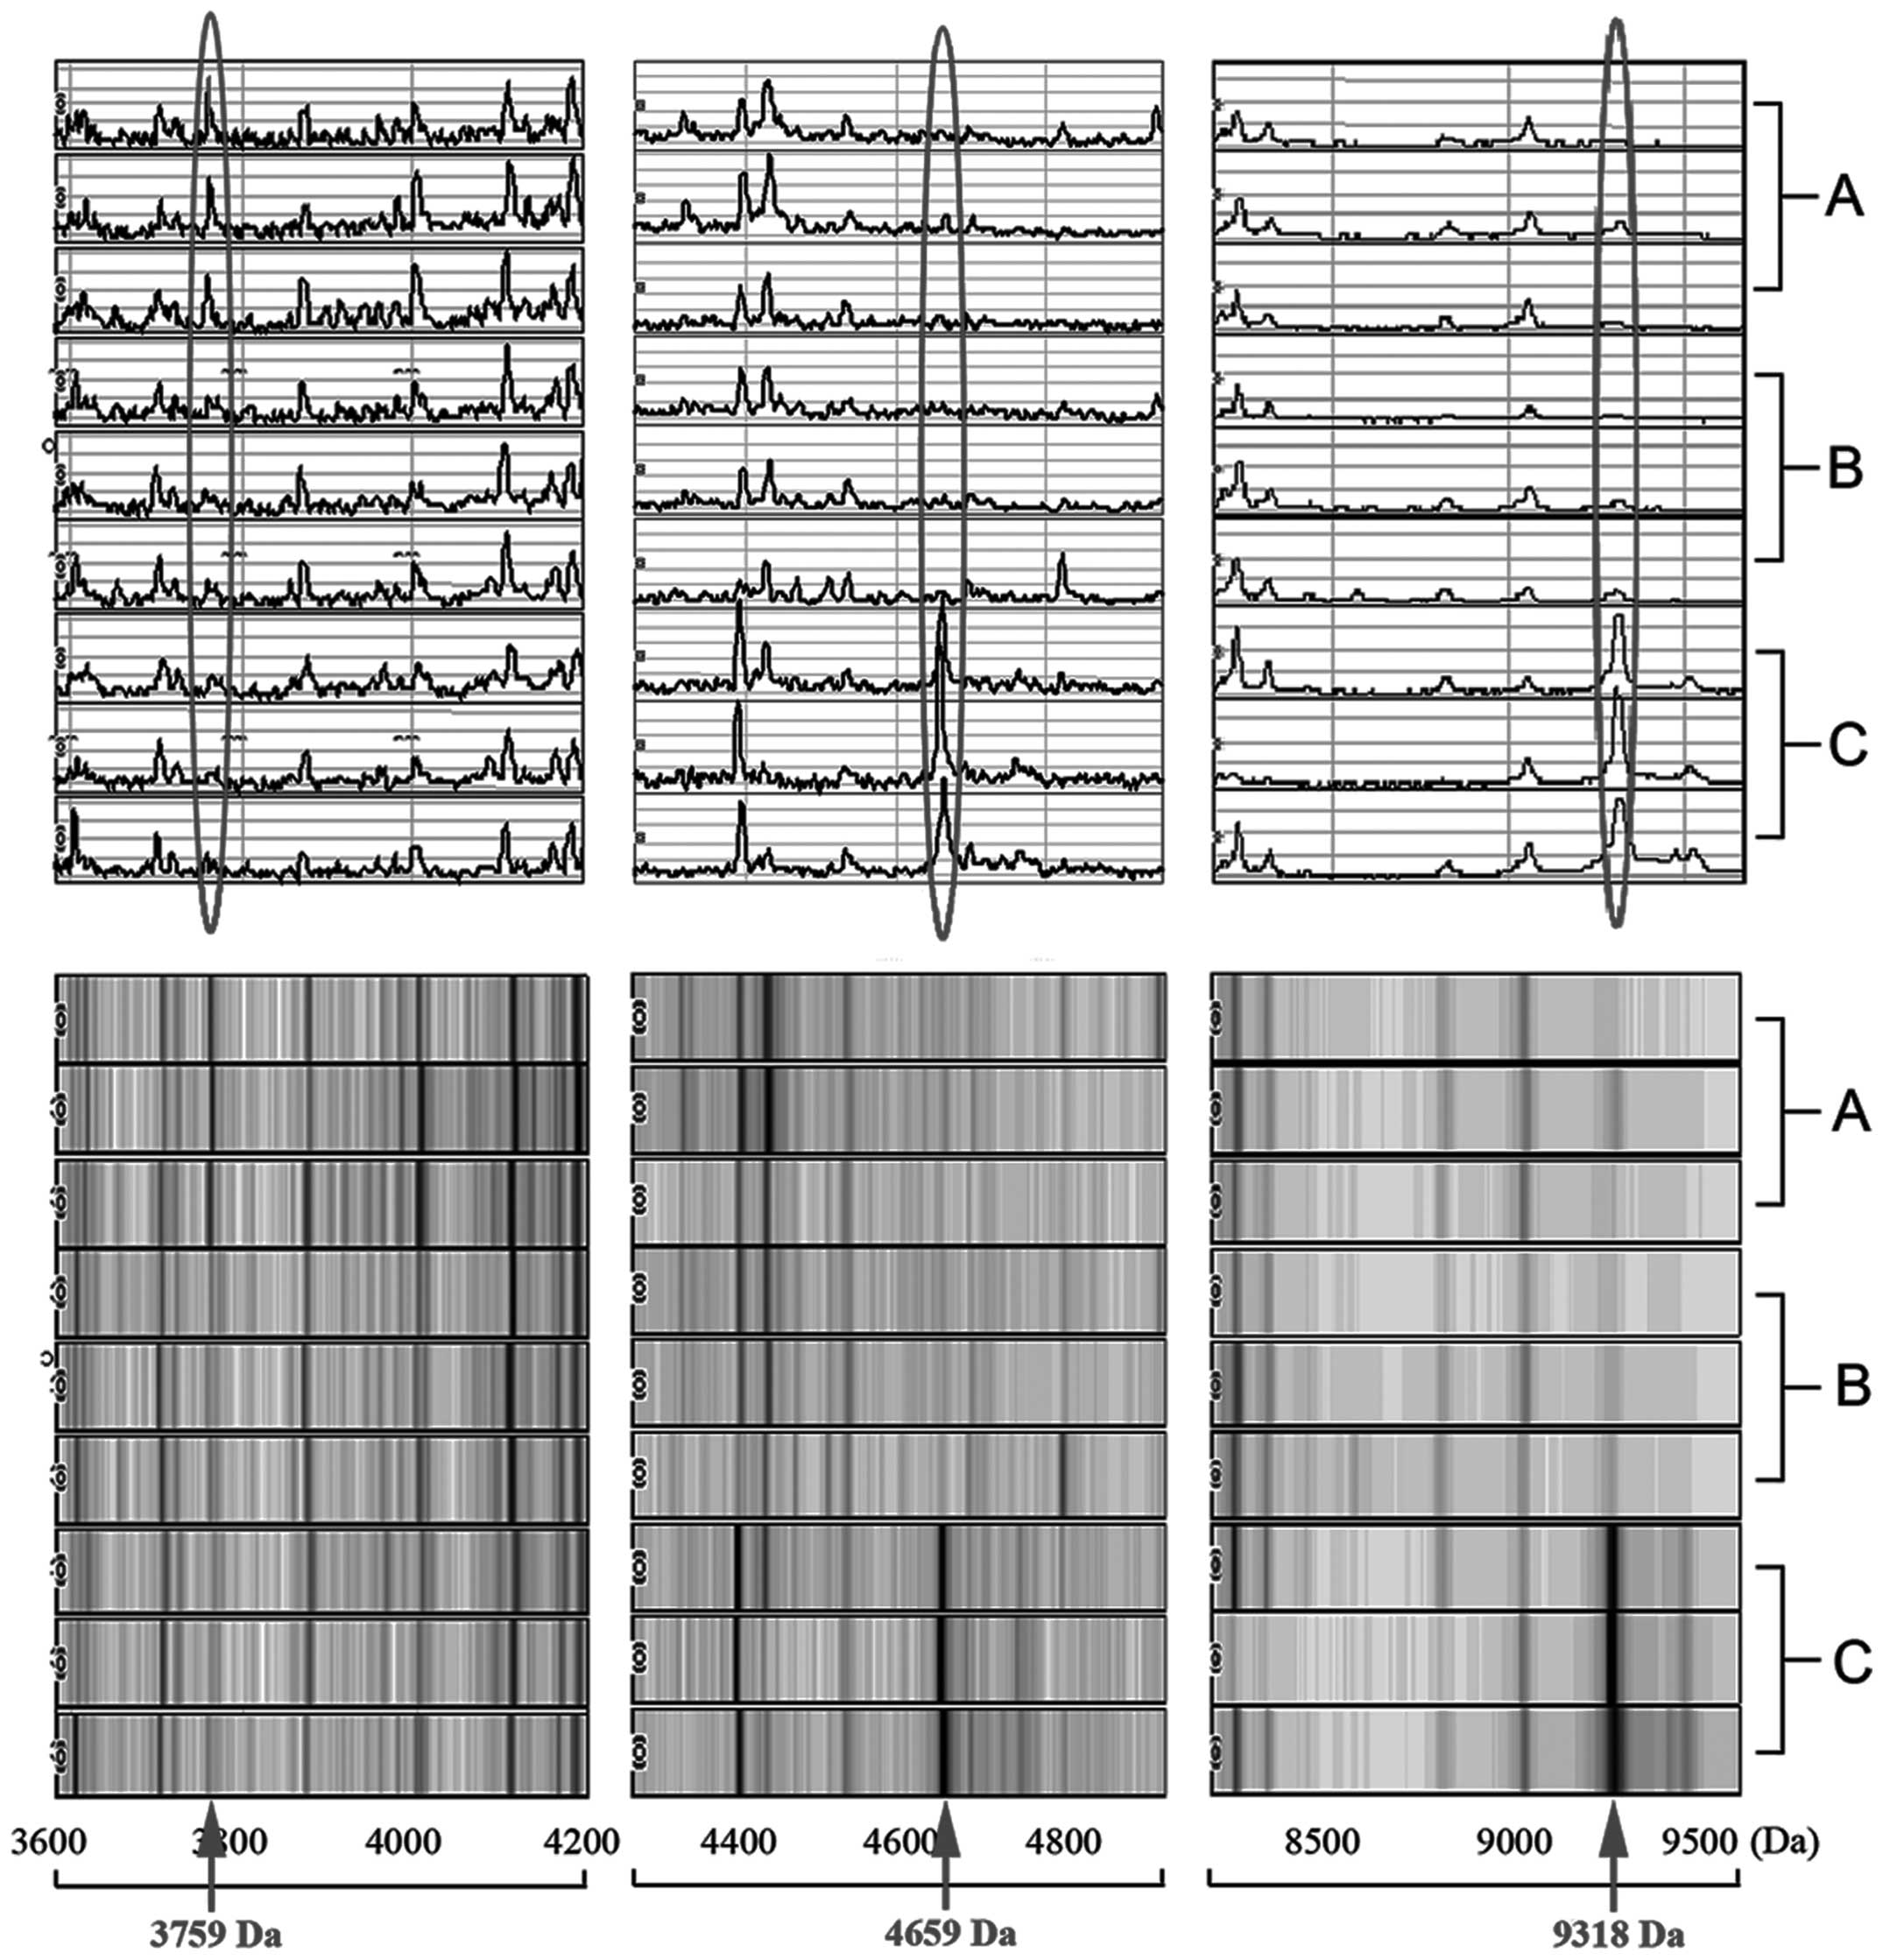
SELDI spectra of rat serum samples showed a total of
126 raw peaks in the m/z region of 1,000–20,000 Da. Using biomarker
pattern software, the spectrum generated from pre-injection rats (1
week before injection) was compared to the spectrum generated from
post-injection rats (4 and 6 weeks after injection, respectively).
This comparison yielded a model consisting of 10 peaks that
discriminated between pre-injection and post-injection rats during
the development of ovarian cancer (P<0.05) (19). Among these 10 peaks, the 3 peaks
that were found to be most valuable after comprehensive selection
had peak intensity levels above 5. These 3 peaks corresponded to
m/z ratios of 3759, 4659 and 9318 (Fig. 2) (8,19).
Expression frequency of key proteins
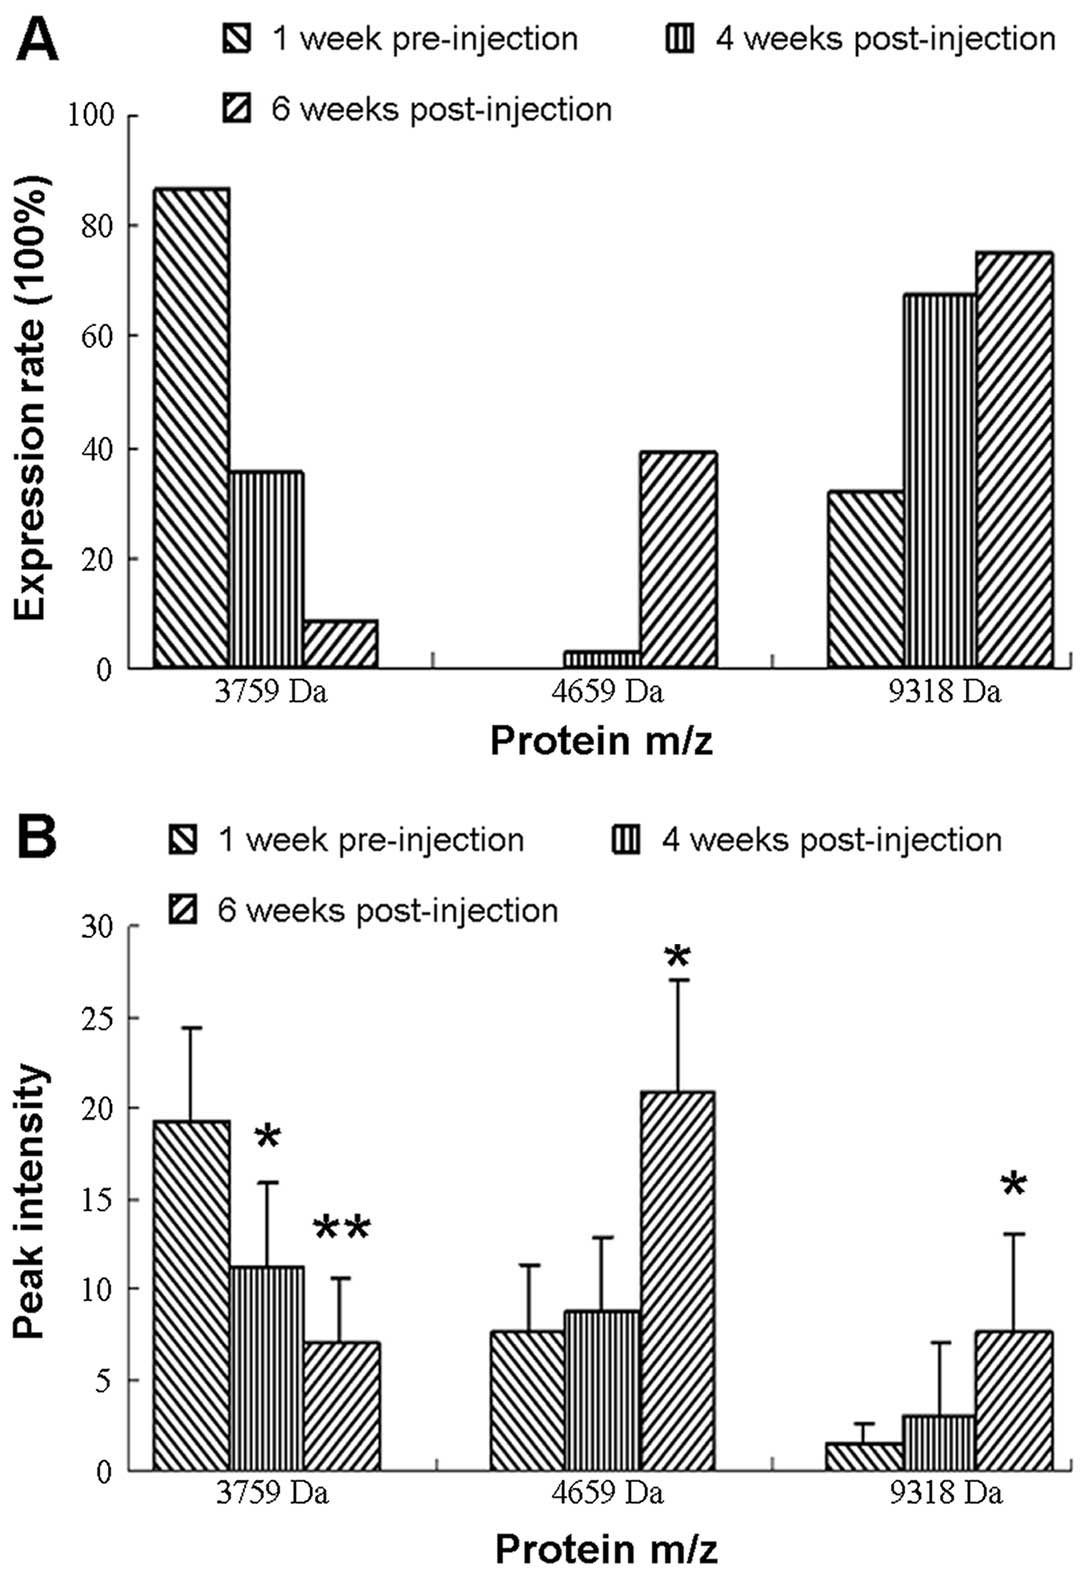
The expression frequency of m/z 3759 peaks was
downregulated and that of the other two peaks (4659 and 9318) was
upregulated during the development of ovarian cancer. The protein
with molecular weight 3759 Da was expressed in 86.8% of the rats
before injection of ovarian cancer cells. However, 4 weeks after
injection, the frequency dropped to only 35.2%. At 6 weeks after
injection, it had dropped to 8.4%. None of the proteins of 4659 Da
were detected before injection but levels increased to 2.7 and
39.0% at 4 and 6 weeks, respectively. Similarly, the expression
rates of the 9318-Da protein were 31.6% before injection and 67.6
and 75.0% at 4 and 6 weeks (Fig.
3A) (20–22).
Expression levels of key proteins
The expression levels of the 3759-, 4659- and
9318-Da proteins, here indicated by the peak intensity of each
protein, showed the same tendency as the expression frequency
before and after injection. The peak intensity of the 3759-Da
protein dropped from 19.19±5.2 before injection to 11.14±4.62
(P=0.0177) and 7.01±3.65 (P=0.0008) at 4 and 6 weeks after. The
peak intensity of the 4659-Da protein was 7.73±4.52 before
injection and increased gradually after tumor injection to
8.78±4.21 (P>0.05) at 4 weeks and 21.37±6.19 (P=0.0014) at 6
weeks. Similarly, the peak intensity of protein 9318 Da before
injection was 1.5±1.03, which was rather low, and subsequently
increased to 3.01±4.07 (P>0.05) at 4 weeks and 7.67±4.99
(P=0.0141) at 6 weeks after tumor injection (Fig. 3B).
Establishment of a diagnostic decision
tree
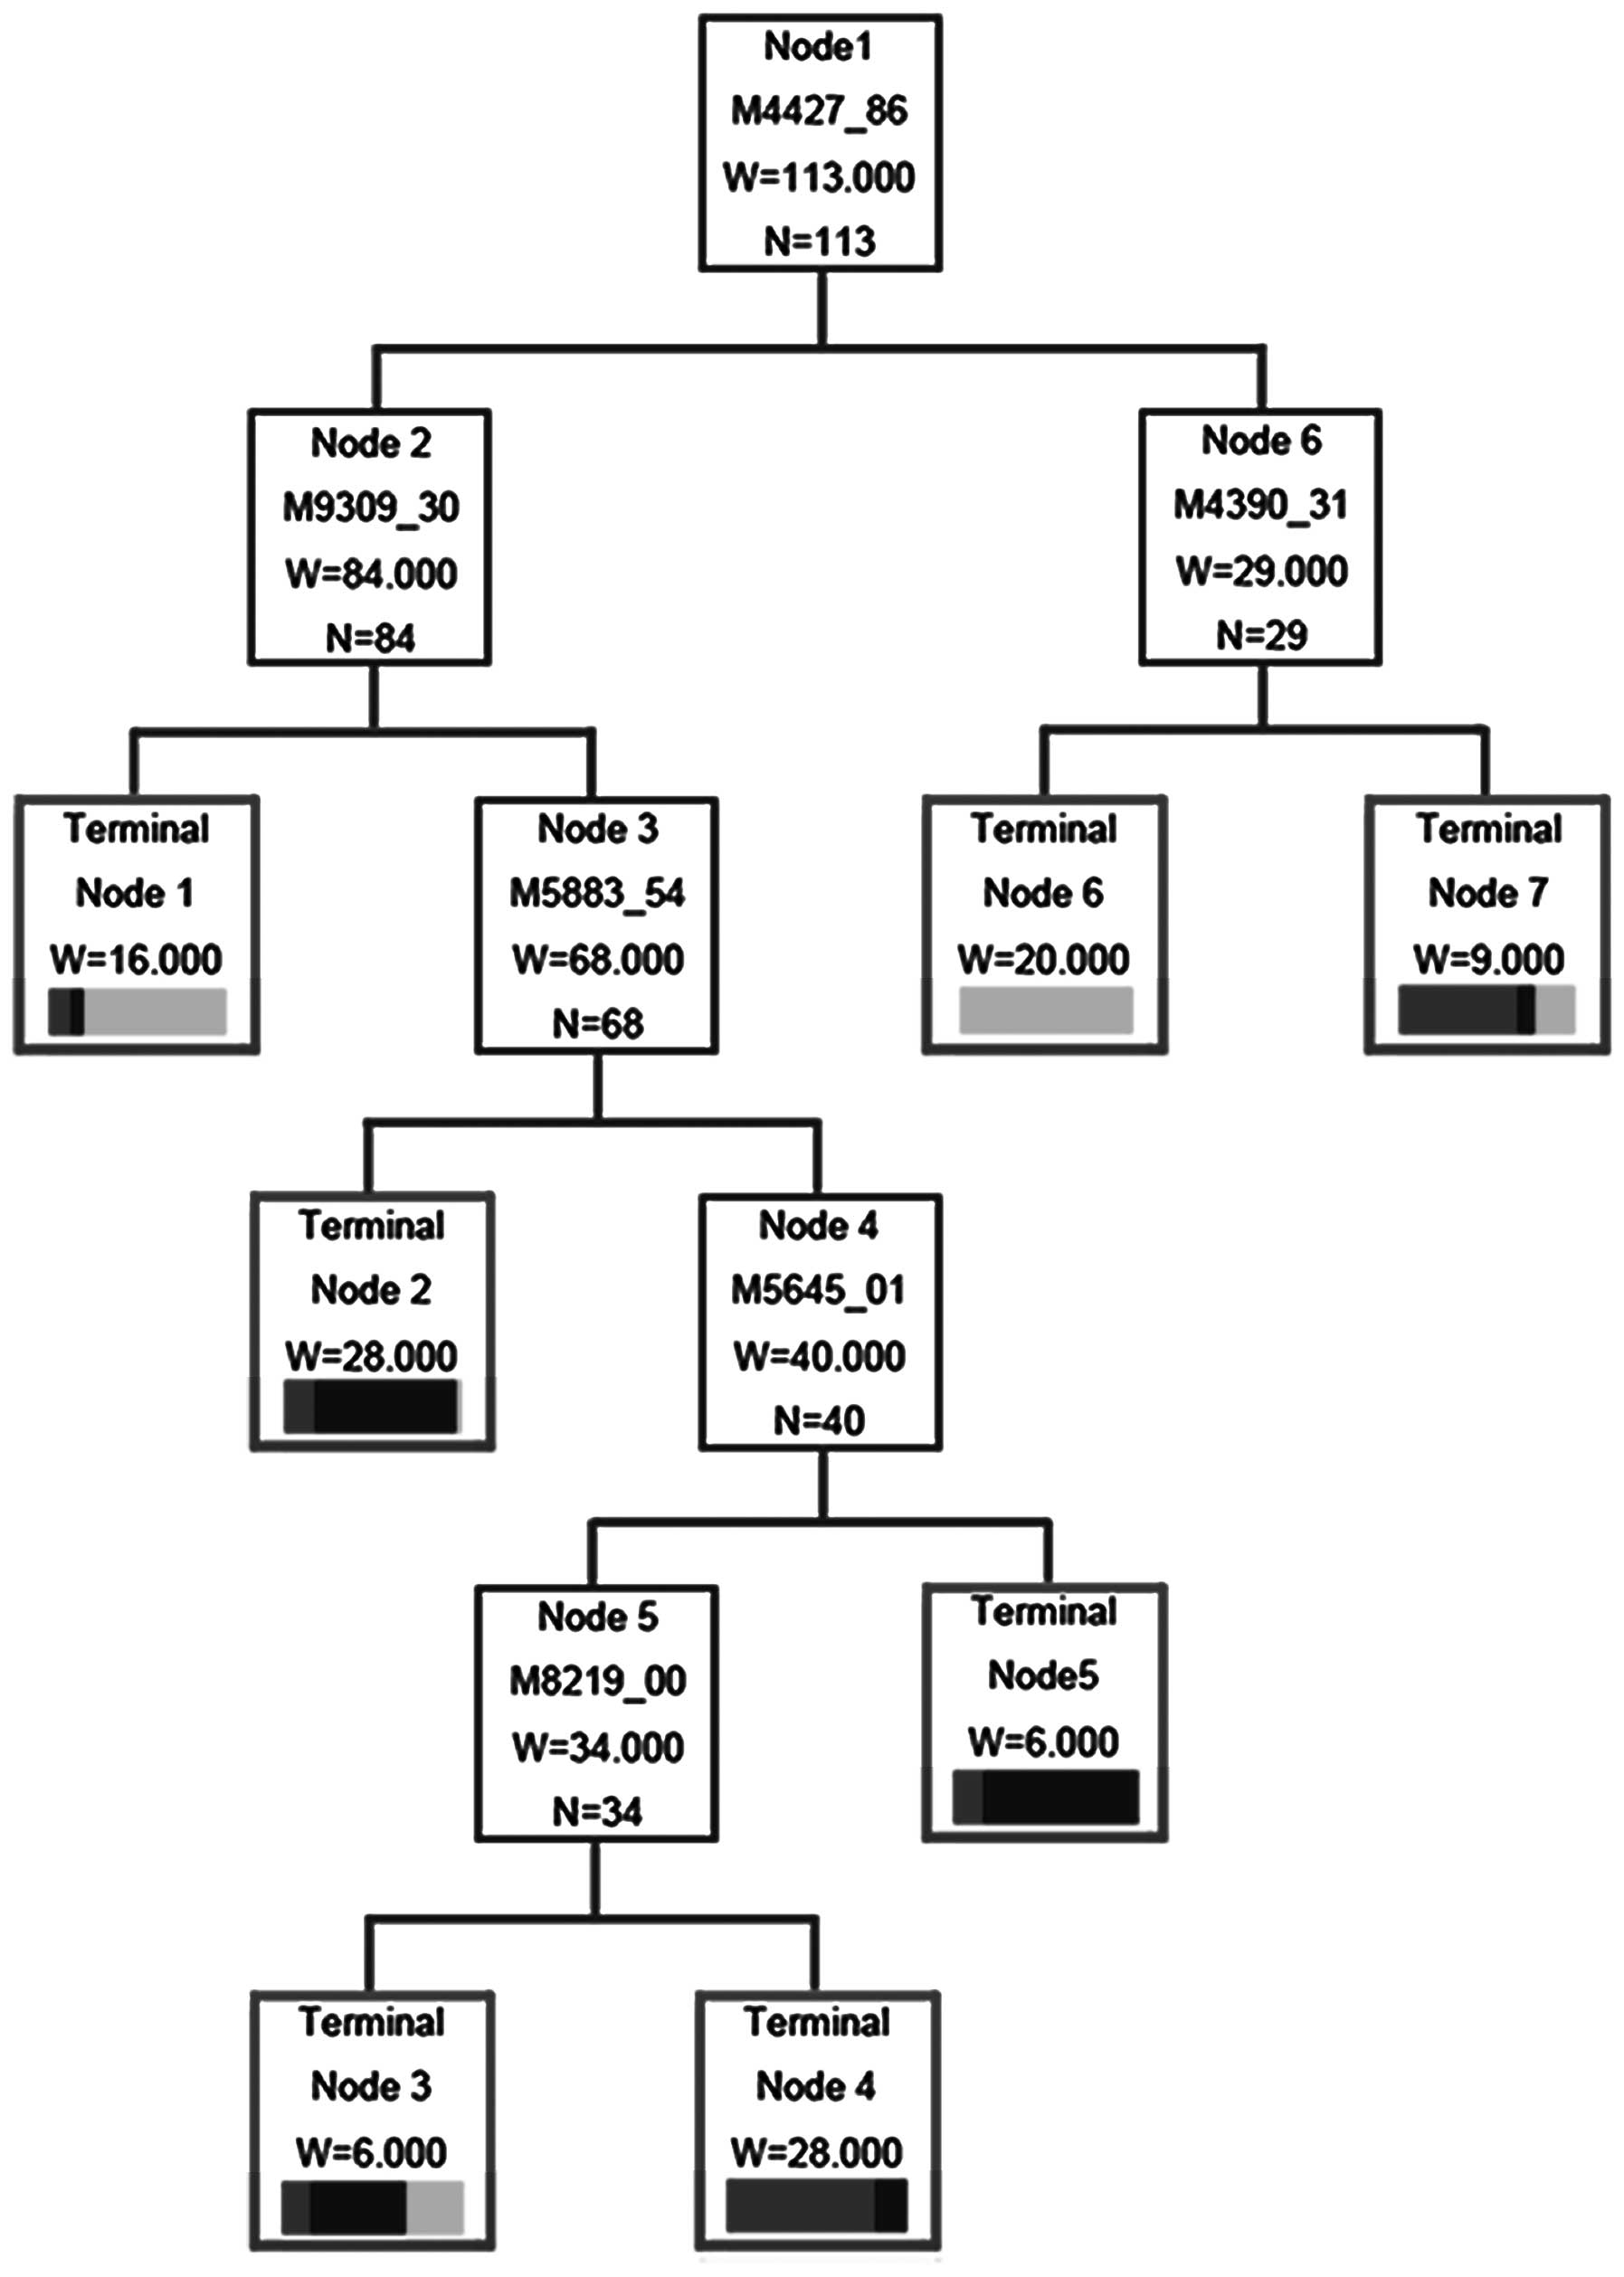
The decision classification tree was used as a
predictive tool to distinguish the pre-injection rats from
post-injection groups (23). The
classification tree used 6 splitters with distinct masses of
4427.86, 9309.30, 5883.54, 4390.31, 5645.01 and 8219.00 Da,
respectively. Cases were classified into 7 terminal nodes (Fig. 4). The error rate of the
classification tree was estimated using cross-validation (24). At 4 and 6 weeks post-injection, the
algorithm diagnosed 76.30% (29 of 38) and 81.08% (30 of 37) of
cancer-bearing rats correctly and 86.84% (33 of 38) of the
pre-injection rats were also diagnosed correctly. The total
diagnostic accuracy rate of cancer-bearing rats at 4 and 6 weeks
after injection were 94.7 and 97.3%, respectively, in the present
study (Table I).
 | Table IDiagnostic accuracy of tumor-bearing
rats using diagnostic decision tree. |
Table I
Diagnostic accuracy of tumor-bearing
rats using diagnostic decision tree.
| | Diagnosis accuracy
rate (%) |
|---|
| |
|
|---|
| N | Pre-injection | 4 weeks
post-injection | 6 weeks
post-injection |
|---|
| Pre-injection | 38 | 86.84 | 5.26 | 7.89 |
| 4 weeks
post-injection | 38 | 5.26 | 76.30 | 18.42 |
| 6 weeks
post-injection | 37 | 2.70 | 16.22 | 81.08 |
Discussion
For most types of cancers, survival rates depend on
early diagnosis of the disease. For example, the 5-year survival
rate of patients diagnosed at an advanced stage is ~35%, compared
with 90% for cancers at stage I (2–4).
According to the newest National Comprehensive Cancer Network
(NCCN) guidelines for ovarian cancer, the diagnosis of ovarian
cancer still depends mainly on imaging techniques and serum tumor
markers testing. Current evidence shows that ultrasound imaging,
CA-125, and human epididymis protein 4 (HE4) are useful in cancer
diagnosis, but several of the markers used in recent studies,
including CA-125, HE, B7-H4, mesothelin, decoy receptor 3 (DcR3)
and spondin-2, are not adequately sensitive for use in early
detection (25). However, the
pathophysiological mechanisms of cancer development are not yet
clear. Proteins carry out most cellular functions. The measurement
of protein concentrations and activity levels can facilitate
understanding of cancer pathogenesis. Once their roles in biology
and pathology are understood, they may be used in the early
detection of cancer. Traditional proteomics profiling techniques
involve 2D gel electrophoresis, which is a low-throughput approach
to proteomic analysis. Surface-enhanced laser desorption/ionization
time-of-flight mass spectrometry (SELDI-TOF-MS) technology, which
is high-throughput, may also serve as an alternative to the 2D PAGE
approach (26). SELDI-TOF-MS may
help researchers better understand cellular functions at the
protein level.
Mass spectrometry based on proteomics has been
widely used in many related studies to identify and map proteins in
bodily fluids, and proteomics profiling is one commonly used
approach in proteomics (27). In
recent years proteomics profiling using SELDI-TOF-MS has shown
considerable potential in the field of biomarker discovery
(28). Changes in proteomic
profiles that occur around the time of tumorigenesis can facilitate
understanding of the mechanism of cancer development. However, most
of these experiments have involved non-clinical research and it is
difficult to obtain proteomic profiles of patients before their
diseases are diagnosed (29). In a
previous study, serum samples from ovarian cancer rats and
non-cancer controls were obtained using SELDI-TOF-MS. A four-peak
model was established in the training set. It was found capable of
distinguishing cancerous from non-cancerous samples with a
sensitivity of 90.8% and specificity of 93.5%. In a blind test of
the same model, a sensitivity of 87.0% and a specificity of 95.0%
were recorded (20). The purpose
of the present study was to explore the changes in the proteomics
profiles before and after tumor development using a Fischer 344 rat
ovarian cancer model. As anticipated, key proteins were found
during the development of ovarian cancer. A total of 126 raw peaks
were found in the m/z region of 1000–20,000 Da. A model consisting
of 10 peaks was established to distinguish between pre-injection
and post-injection rats. Of these 10 peaks, 3 peaks (m/z ratios of
3759, 4659 and 9318) were found to be the relevant. The expression
frequency of m/z 3759 peaks was downregulated and that of the other
two peaks (4659 and 9318) was upregulated. This indicated that the
first is a tumor suppressing gene and the other two are oncogenes.
Any of these 3 proteins may serve as molecular targets in cancer
therapy. They may also play key roles during tumorigenesis. Through
establishing and analyzing a decision classification tree, we found
the total diagnostic accuracy rate was also high enough (94.7% at 4
weeks and 97.3% at 6 weeks). Studies have pointed out that the act
of identifying these protein peaks is significant in some way.
These protein signatures may facilitate the identification of
populations at high risk of cancer and monitoring of patients’
response to chemotherapy (30).
The present study evaluated the alterations in the
proteomic profiling of the serum of tumor-bearing rats using
SELDITOF-MS. These protein markers may be novel oncogenes or tumor
suppressing proteins and may provide useful information on tumor
cell growth and metastasis, genes related to the tumor cell
microenvironment and specific molecular targets (31,32).
It may be helpful in the diagnosis and monitoring of ovarian cancer
and the development of individualized treatment. Further research
is needed to identify relevant proteins and to confirm the current
findings in humans. Hopefully, new cancer biomarkers in human
bodily fluids can be used to trace cancer development through
proteomic analysis, providing an opportunity to put forward cancer
control measures, design novel drugs and optimize the use of
molecularly targeted agents (31).
Although SELDI-TOF-MS is not a current state-of-the-art proteomics
technology, it is still a guide to human ovarian cancer early
diagnostics. We will focus further on the identity of the proteins
for their eventual functional validation on cancer biology
relevance in our subsequent experiments.
Acknowledgements
This study was funded by research grants from the
National Natural Science Foundation of China (nos. 81100403) and
Foundation for Outstanding Young Scientist in Shandong Province of
China (BS2013YY035).
References
|
1
|
Maheedhar K, Bhat RA, Malini R, et al:
Diagnosis of ovarian cancer by Raman spectroscopy: a pilot study.
Photomed Laser Surg. 26:83–90. 2008. View Article : Google Scholar : PubMed/NCBI
|
|
2
|
Wegdam W, Moerland PD, Meijer D, et al: A
critical assessment of SELDI-TOF-MS for biomarker discovery in
serum and tissue of patients with an ovarian mass. Proteome Sci.
10:452012. View Article : Google Scholar : PubMed/NCBI
|
|
3
|
Tessitore A, Gaggiano A, Cicciarelli G, et
al: Serum biomarkers identification by mass spectrometry in
high-mortality tumors. Int J Proteomics. 2013:1258582013.
View Article : Google Scholar : PubMed/NCBI
|
|
4
|
Kristjansdottir B, Levan K, Partheen K,
Carlsohn E and Sundfeldt K: Potential tumor biomarkers identified
in ovarian cyst fluid by quantitative proteomic analysis, iTRAQ.
Clin Proteomics. 10:42013. View Article : Google Scholar : PubMed/NCBI
|
|
5
|
Sarojini S, Tamir A, Lim H, et al: Early
detection biomarkers for ovarian cancer. J Oncol. 2012:7090492012.
View Article : Google Scholar : PubMed/NCBI
|
|
6
|
Kamai T, Tomosugi N, Abe H, Kaji Y, Oyama
T and Yoshida K: Protein profiling of blood samples from patients
with hereditary leiomyomatosis and renal cell cancer by
surface-enhanced laser desorption/ionization time-of-flight mass
spectrometry. Int J Mol Sci. 13:14518–14532. 2012. View Article : Google Scholar
|
|
7
|
Liu C: The application of SELDI-TOF-MS in
clinical diagnosis of cancers. J Biomed Biotechnol.
2011:2458212011.PubMed/NCBI
|
|
8
|
Kelly P, Paulin F, Lamont D, et al:
Pre-treatment plasma proteomic markers associated with survival in
oesophageal cancer. Br J Cancer. 106:955–961. 2012. View Article : Google Scholar : PubMed/NCBI
|
|
9
|
Simsek C, Sonmez O, Keyf AI, et al:
Importance of serum SELDI-TOF-MS analysis in the diagnosis of early
lung cancer. Asian Pac J Cancer Prev. 14:2037–2042. 2013.
View Article : Google Scholar : PubMed/NCBI
|
|
10
|
Opstal-van Winden AW, Krop EJ, Karedal MH,
et al: Searching for early breast cancer biomarkers by serum
protein profiling of pre-diagnostic serum; a nested case-control
study. BMC Cancer. 11:3812011.PubMed/NCBI
|
|
11
|
Gast MC, van Dulken EJ, van Loenen TK, et
al: Detection of breast cancer by surface-enhanced laser
desorption/ionization time-of-flight mass spectrometry tissue and
serum protein profiling. Int J Biol Markers. 24:130–141.
2009.PubMed/NCBI
|
|
12
|
Seibert V, Ebert MP and Buschmann T:
Advances in clinical cancer proteomics: SELDI-TOF-mass spectrometry
and biomarker discovery. Brief Funct Genomic Proteomic. 4:16–26.
2005. View Article : Google Scholar : PubMed/NCBI
|
|
13
|
Giusti I, D’Ascenzo S and Dolo V:
Microvesicles as potential ovarian cancer biomarkers. Biomed Res
Int. 2013:7030482013. View Article : Google Scholar : PubMed/NCBI
|
|
14
|
Wiesner A: Detection of tumor markers with
ProteinChip technology. Curr Pharm Biotechnol. 5:45–67. 2004.
View Article : Google Scholar : PubMed/NCBI
|
|
15
|
Mu AK, Lim BK, Hashim OH and Shuib AS:
Identification of O-glycosylated proteins that are
aberrantly excreted in the urine of patients with early stage
ovarian cancer. Int J Mol Sci. 14:7923–7931. 2013.
|
|
16
|
Callesen AK, Mogensen O, Jensen AK, et al:
Reproducibility of mass spectrometry based protein profiles for
diagnosis of ovarian cancer across clinical studies: a systematic
review. J Proteomics. 75:2758–2772. 2012. View Article : Google Scholar : PubMed/NCBI
|
|
17
|
Emanuele VA II, Panicker G, Gurbaxani BM,
Lin JM and Unger ER: Sensitive and specific peak detection for
SELDI-TOF mass spectrometry using a wavelet/neural-network based
approach. PLoS One. 7:e481032012. View Article : Google Scholar : PubMed/NCBI
|
|
18
|
Diao L, Clarke CH, Coombes KR, et al:
Reproducibility of SELDI spectra across time and laboratories.
Cancer Inform. 10:45–64. 2011.PubMed/NCBI
|
|
19
|
Wang J, Zhang X, Ge X, Guo H, Xiong G and
Zhu Y: Proteomic studies of early-stage and advanced ovarian cancer
patients. Gynecol Oncol. 111:111–119. 2008. View Article : Google Scholar : PubMed/NCBI
|
|
20
|
Zhang H, Kong B, Qu X, Jia L, Deng B and
Yang Q: Biomarker discovery for ovarian cancer using SELDI-TOF-MS.
Gynecol Oncol. 102:61–66. 2006. View Article : Google Scholar : PubMed/NCBI
|
|
21
|
Zhang Z, Bast RC Jr, Yu Y, et al: Three
biomarkers identified from serum proteomic analysis for the
detection of early stage ovarian cancer. Cancer Res. 64:5882–5890.
2004. View Article : Google Scholar : PubMed/NCBI
|
|
22
|
Moshkovskii SA, Serebryakova MV,
Kuteykin-Teplyakov KB, et al: Ovarian cancer marker of 11.7 kDa
detected by proteomics is a serum amyloid A1. Proteomics.
5:3790–3797. 2005. View Article : Google Scholar : PubMed/NCBI
|
|
23
|
Cao XL, Li H, Yu XL, et al: Predicting
early intrahepatic recurrence of hepatocellular carcinoma after
microwave ablation using SELDI-TOF proteomic signature. PLoS One.
8:e824482013. View Article : Google Scholar : PubMed/NCBI
|
|
24
|
Qian JY, Mou SH and Liu CB: SELDI-TOF MS
combined with magnetic beads for detecting serum protein biomarkers
and establishment of a boosting decision tree model for diagnosis
of pancreatic cancer. Asian Pac J Cancer Prev. 13:1911–1915. 2012.
View Article : Google Scholar : PubMed/NCBI
|
|
25
|
NCCN. NCCN Clinical Guidelines in
Oncology: Ovarian Cacer Including Fallopian Tube Cancer and Primary
Peritoneal Cancer (Vesion 1.2014). 2014.
|
|
26
|
Vlasova MA, Moshkovskii SA, Safarova MP,
Makarov OV and Archakov AI: Molecular diagnostics of ovarian cancer
using proteome techniques. Biomed Khim. 51:367–383. 2005.(In
Russian).
|
|
27
|
Huijbers A, Velstra B, Dekker TJ, et al:
Proteomic serum biomarkers and their potential application in
cancer screening programs. Int J Mol Sci. 11:4175–4193. 2010.
View Article : Google Scholar : PubMed/NCBI
|
|
28
|
De Bock M, de Seny D, Meuwis MA, et al:
Challenges for biomarker discovery in body fluids using
SELDI-TOF-MS. J Biomed Biotechnol. 2010:9060822010.PubMed/NCBI
|
|
29
|
Cadron I, Van Gorp T, Amant F, et al: The
use of laser microdis-section and SELDI-TOF MS in ovarian cancer
tissue to identify protein profiles. Anticancer Res. 29:1039–1045.
2009.PubMed/NCBI
|
|
30
|
Luo J, Qian JH, Yu JK, Zheng S, Xie X and
Lu WG: Discovery of altered protein profiles in epithelial ovarian
carcinogenesis by SELDI mass spectrometry. Eur J Gynaecol Oncol.
29:233–238. 2008.PubMed/NCBI
|
|
31
|
Toss A, De Matteis E, Rossi E, et al:
Ovarian cancer: can proteomics give new insights for therapy and
diagnosis? Int J Mol Sci. 14:8271–8290. 2013. View Article : Google Scholar : PubMed/NCBI
|
|
32
|
Sinha A, Ignatchenko V, Ignatchenko A,
Mejia-Guerrero S and Kislinger T: In-depth proteomic analyses of
ovarian cancer cell line exosomes reveals differential enrichment
of functional categories compared to the NCI 60 proteome. Biochem
Biophys Res Commun. 445:694–701. 2014. View Article : Google Scholar : PubMed/NCBI
|