Introduction
Esophageal carcinoma is the eighth most common
cancer worldwide and the sixth leading cause of cancer-related
deaths (1). It has one of the
worst prognoses of any cancer, with a 5-year overall survival rate
of about 15–25%. Poor prognosis has been associated with diagnosis
at advanced (metastatic) stages and its propensity for metastasis
(2,3). Esophageal adenocarcinoma is less
common than squamous cell carcinoma, although the frequency of
adenocarcinoma of the esophagus, esophageal junction (EGJ) and
gastric cardia has increased dramatically in Western countries
(4).
Metformin is an oral biguanide drug used to treat
type 2 diabetes (5). It lowers
hyperglycemia by inhibiting hepatic glucose production. A recent
epidemiologic survey found that metformin use was associated with
reduced cancer incidence in patients with type 2 diabetes (6,7).
The anticarcinogenic activity of metformin has been
attributed to several mechanisms, including activation of the
LKB1/AMPK pathway, induction of cell cycle arrest and/or apoptosis,
inhibition of protein synthesis, inhibition of the unfolded protein
response, activation of the immune system, and possible eradication
of cancer stem cells (8).
Activation of the LKB1/AMPK pathway inhibits mammalian target of
rapamycin (mTOR), which negatively affects protein synthesis in
cancer cells (8). Metformin has
been shown to inhibit the proliferation of various cancer cell
types, such as those of prostate (5), breast (9) and colon (10) cancer.
Several in vitro and in vivo studies
have also indicated that metformin inhibits the growth of gastric
(11), esophageal squamous cell
(12), and hepatocellular
(13) carcinoma cells. Less is
known, however, about the antitumor effects of metformin on
esophageal adenocarcinoma cells and on micro RNAs (miRNA)
associated with these effects. This study therefore evaluated the
effects of metformin on the growth of esophageal adenocarcinoma
cell lines, its mechanism of action, and the miRNAs associated with
the antitumor effect of metformin.
Materials and methods
Regents and antibodies
Metformin (1,1-dimethylbiguanide monohydrochloride)
was purchased from Astellas Pharma, Inc. Cell counting kit (CCK)-8
was purchased from Dojindo Laboratories (Kumamoto, Japan), and all
other chemicals were obtained from Sigma Chemical (Tokyo,
Japan).
Primary antibodies included anti-β-actin monoclonal
antibody (Sigma-Aldrich, St. Louis, MO, USA; A5441, 1:3,000),
anti-cyclin D1 (RB-9041, used at 1:1,000; Thermo Fisher Scientific,
Walthman, MA, USA), anti-cyclin E (used at 1:1,000; Thermo Fisher
Scientific), anti-Cdk6 (sc-177, used at 1:1,000, Santa Cruz
Biotechnology, Santa Cruz, CA, USA), anti-Cdk4 (sc-749, used at
1:1,000; Santa Cruz Biotechnology), anti-Cdk2 (sc-163, used at
1:2,000; Santa Cruz Biotechnology), and phosphorylated
retinoblastoma protein (Rb; no. 558385, used at 1:1,000; BD
Pharmingen), and anti-Rb (sc-50, used at 1:1,000; Santa Cruz
Biotechnology). Secondary antibodies included horseradish
peroxidase (HRP)-linked antimouse and antirabbit IgG antibodies
(used at 1:2,000; GE Healthcare, UK).
Cell culture and cell proliferation
assay
The four human esophageal adenocarcinoma cell lines,
OE19, OE33, SK-GT4 and OACM5.1c, were obtained from the European
Collection of Cell Culture (ECACC). All were grown in RPMI-1640
(Gibco Invitrogen, Carlsbad, CA, USA), supplemented with 10% fetal
bovine serum (FBS) and penicillin-streptomycin 9100 mg/l;
Invitrogen), at 37°C in a humidified atmosphere containing 5%
CO2.
Cell proliferation was assayed using the CCK-8 cell
counting kit, according to the manufacturer’s instructions.
Briefly, cells (5×10³) were seeded into each well of a
96-well plate and cultured in 100 μl of RPMI-1640 supplemented with
10% FBS. After 24 h, metformin (0, 1, 5 or 10 mM) was added to each
well and cells were cultured for an additional 72 h. CCK-8 reagent
(10 μl) was added to each well, and the plates were incubated at
37°C for 3 h. The absorbance of each well was measured at 450 nm
using a microplate reader.
Preparation of cell lysate
Cell lysates were prepared as described at 4°C
(14). Protein concentrations were
measured using a dye-binding protein assay based on the Bradford
method (15).
Gel electrophoresis and western
blotting
OE19 cells (1.0×10⁶/dish) were seeded in
100-mm culture dishes and cultured for 24 h; metformin was added,
and the cells were further cultured for 72 h. The cells were lysed
in protease-inhibitor cocktail (‘Complete’ protease inhibitor
mixture; iNtRON Biotechnology; Sungnam; Korea) on ice for 20 min.
Suspensions of lysed cells were centrifuged at 13000 × g at 4°C for
5 min; supernatants containing soluble cellular proteins were
collected and stored at −80°C until use. Protein concentrations
were measured using a Nanodrop 2000 fluorospecrometer (Thermo
Scientific Corp., USA). Protein aliquots (1–10 μg) was resuspended
in sample buffer and separated on 10% Tris-glycine gradient gels by
SDS-PAGE (16), and the proteins
were transferred to nitrocellulose membranes. After blocking, the
membranes were incubated with primary antibodies and then were
incubated with HRP-conjugated secondary antibodies (17). Immunoreactive proteins were
visualized with an enhanced chemiluminescence detection system
(Perkin-Elmer, Waltham, MA, USA) on X-ray film.
Flow cytometry
To evaluate the mechanism of growth inhibition by
metformin, cell cycle profiles were analyzed after treatment with
metformin. OE19 cells (1.0×10⁶ cells in a
100-mm-diameter dish) were treated with or without 10 mmol/l
metformin for 24–72 h. The cell cycle was analyzed by measuring the
amount of propidium iodide (PI)-labeled DNA in ethanol-fixed cells.
Fixed cells were washed with PBS and then stored at −20°C until
analyzed by flow cytometry. On the day of analysis, the cells were
washed with cold PBS, suspended in 100 μl PBS plus 10 μl RNaseA
(250 μg/ml) and incubated for 30 min. To each suspension was added
110 μl PI stain (100 μg/ml), and the cells were incubated at 4°C
for at least 30 min prior to analysis. Flow cytometry was performed
on a Cytomics FC 500 flow cytometer (Beckman Coulter) with an argon
laser (488 nm). The percentages of cells in different phases of the
cell cycle were analyzed by FlowJo software (TreeStar, Ashland, OR,
USA). All experiments were performed in triplicate to assess
consistency of response.
Xenograft model analysis
Animal experiments were performed according to the
guidelines of the Committee on Experimental Animals of Kagawa
University, Kagawa, Japan. Thirty male athymic mice (BALB/c-nu/nu;
6 weeks old; 20–25 g) were purchased from Japan SLC Inc. and
maintained under specific pathogen-free conditions using a laminar
airflow rack. The mice had continuous free access to sterilized
(γ-irradiated) food (CL-2; CLEA Japan Inc.) and autoclaved water.
Each mouse was subcutaneously inoculated with OE19 cells
(5×10⁶ cells per animal) in the flank. One week later,
the xenografts were identifiable as masses of maximal diameter
>6 mm. The animals were randomized to treatment with metformin
or PBS. The metformin group was intraperitoneally (i.p.) injected
five times per week with 2 mg/kg body weight per day metformin for
two weeks; whereas the control group was administered PBS alone for
2 weeks. Tumor growth was monitored daily by the same investigators
(S. Fujihara and T. Masaki), and tumor size was measured weekly by
measuring the 2 greatest perpendicular dimensions. Tumor volume
(mm3) was calculated as tumor length (mm) × tumor width
(mm)2/2 (18). All
animals were sacrificed on day 17 after treatment, with all
remaining alive during this period. Between-group differences in
tumor growth were analyzed by one-way ANOVA.
Antibody arrays of phosphorylated
receptor tyrosine kinase (p-RTK)
Human phospho-RTK was assayed using Human
phospho-RTK Array kits (R&D Systems, Minneapolis, MN, USA),
according to the manufacturer’s instructions. Briefly, p-RTK array
membranes were blocked with 5% BSA/TBS (0.01 M Tris-HCl, pH 7.6)
for 1 h and incubated with 2 ml of lysate prepared from cell lines
after normalization so that amounts of protein were equal. After 3
washes for 10 min each with TBS plus 0.1% v/v Tween-20 and 2 washes
for 10 min with TBS alone to remove unbound materials, the
membranes were incubated with anti-phospho-tyrosine-HRP antibody
for 2 h at room temperature. The unbound HRP antibody was washed
out with TBS plus 0.1% Tween-20. Finally, each array membrane was
exposed to X-ray film using a chemiluminescence detection system
(Perkin-Elmer Co.). The density of the immunoreactive band obtained
on this array was analyzed by densiometric scanning (TIc scanner,
Shimizu Co, Ltd., Kyoto, Japan).
Angiogenic profile analysis using an
antibody array
The RayBio Human Angiogenesis Antibody Array
(RayBiotech Inc.) was used according to the manufacturer’s
protocol. This method is a dot-based assay enabling detection and
comparison of 20 angiogenesis-specific cytokines. Briefly, p-RTK
array membranes were blocked with 5% BSA/TBS (0.01 M Tris-HCl, pH
7.6) for 1 h and incubated with 2 ml of lysate prepared from cell
lines after normalization so that amounts of protein were equal.
After 3 washes for 10 min each with TBS plus 0.1% v/v Tween-20 and
2 washes for 10 min with TBS alone to remove unbound materials, the
membranes were incubated with anti-phospho-tyrosine-HRP antibody
for 2 h at room temperature. The unbound HRP antibody was washed
out with TBS including 0.1% Tween-20. Finally, each array membrane
was exposed to X-ray film using a chemiluminescence detection
system (PerkinElmer Co.). The density of the immunoreactive band
obtained on this array was analyzed by densiometric scanning (TIc
scanner, Shimizu Co., Ltd.).
Analysis of miRNA arrays
Total RNA was extracted from tumor samples and
cancer cell lines using miRNeasy Mini kits (Qiagen, Hilden,
Germany) according to the manufacturer’s instructions. RNA samples
typically showed A260/280 ratios between
1.9 and 2.1, using an Agilent 2100 Bioanalyzer (Agilent
Technologies, Santa Clara, CA, USA).
After RNA measurement with an RNA 6000 Nano kit
(Agilent Technologies), the samples were labeled using a
miRCURYHy3/Hy5 Power Labeling kit and were hybridized to a human
miRNA Oligo chip (v.14.0; Toray Industries, Tokyo, Japan). The
chips were scanned with a 3-D Gene Scanner 3000 (Toray Industries),
and the results analyzed by 3D-Gene extraction version 1.2 software
(Toray Industries). Differences in miRNA expression between
metformin-treated and control samples were assessed by analyzing
the raw data using GeneSpringGX v10.0 (Agilent Technologies).
Samples were first normalized relative to 28S RNA and baseline
corrected to the median of all samples.
Replicate data were consolidated into 2 groups:
those from metformin-treated cells and those from control cells and
were organized using the hierarchical clustering and ANOVA
functions in GeneSpring software. Hierarchical clustering was
performed using the use clustering function (condition tree) and
Euclidean correlation as a distance metric. Two-way ANOVA analysis
and asymptotic P-value computation without any error correction on
the samples were performed to determine the miRNAs varying most
prominently across the groups. The P-value cutoff was set to 0.05.
Only changes >50% for at least one of the time points for each
sample were considered significant. All the analyzed data were
scaled by global normalization. The statistical significance of
differentially expressed miRNAs was analyzed by Student’s
t-test.
Statistical analysis
All statistical analyses were performed using
computer assisted JMP 9.0 (SAS Institute, Cary, NC, USA). Paired
analysis between groups used t-tests. A P-value <0.05 was
considered statistically significant.
Results
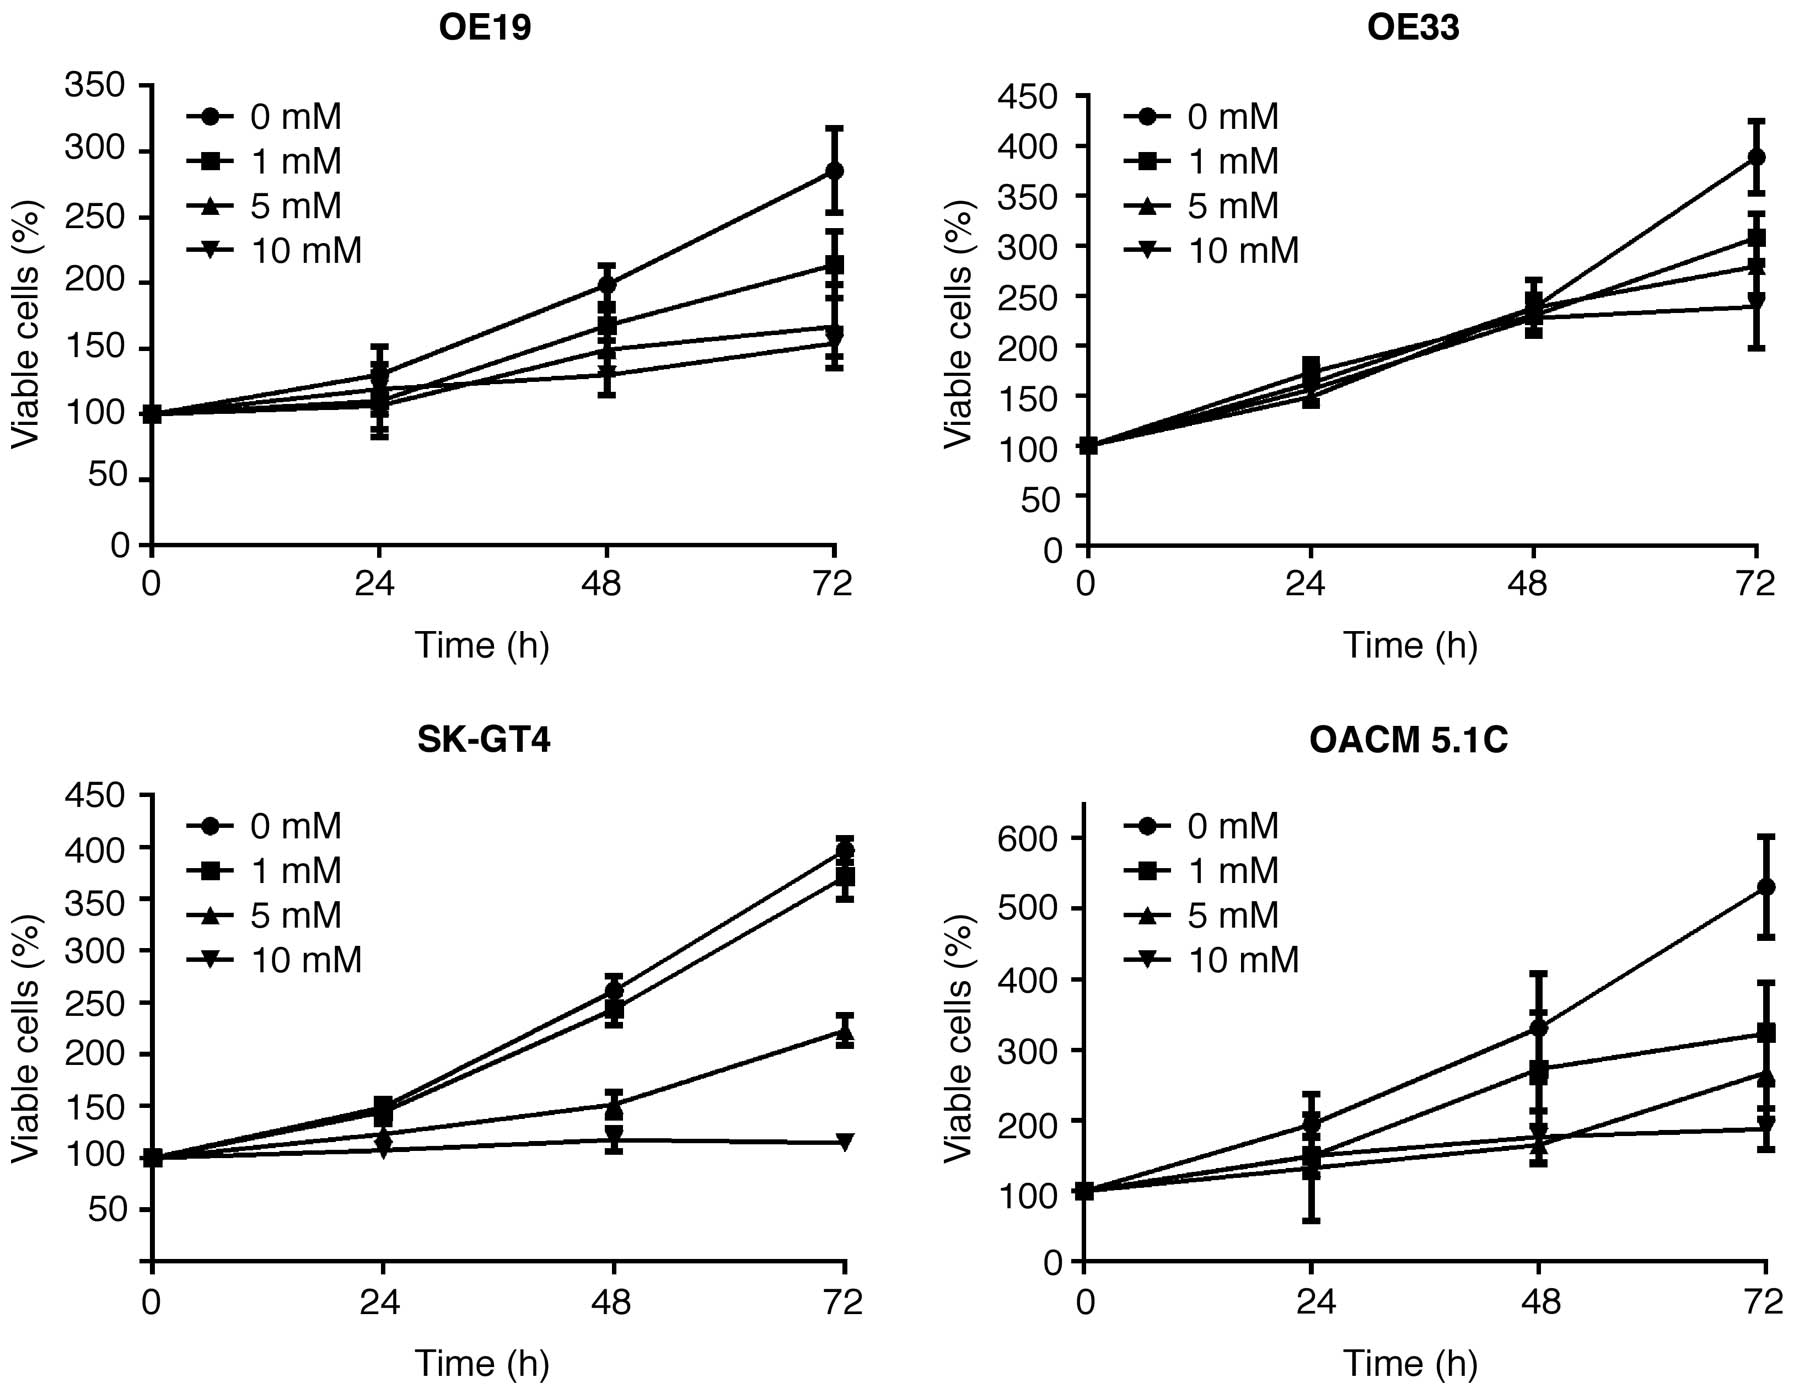
Metformin inhibits the proliferation of
human esophageal adenocarcinoma cancer cells
The effect of metformin on the proliferation of four
esophageal adenocarcinoma cell lines, OE19, OE33, SK-GT4 and
OACM5.1c, was evaluated. Cells were grown in 10% FBS and treated
with 0, 1, 5 or 10 mmol/l metformin for 72 h. Metformin showed a
strong, dose-dependent inhibition of cell proliferation of all four
esophageal adenocarcinoma cell lines (Fig. 1).
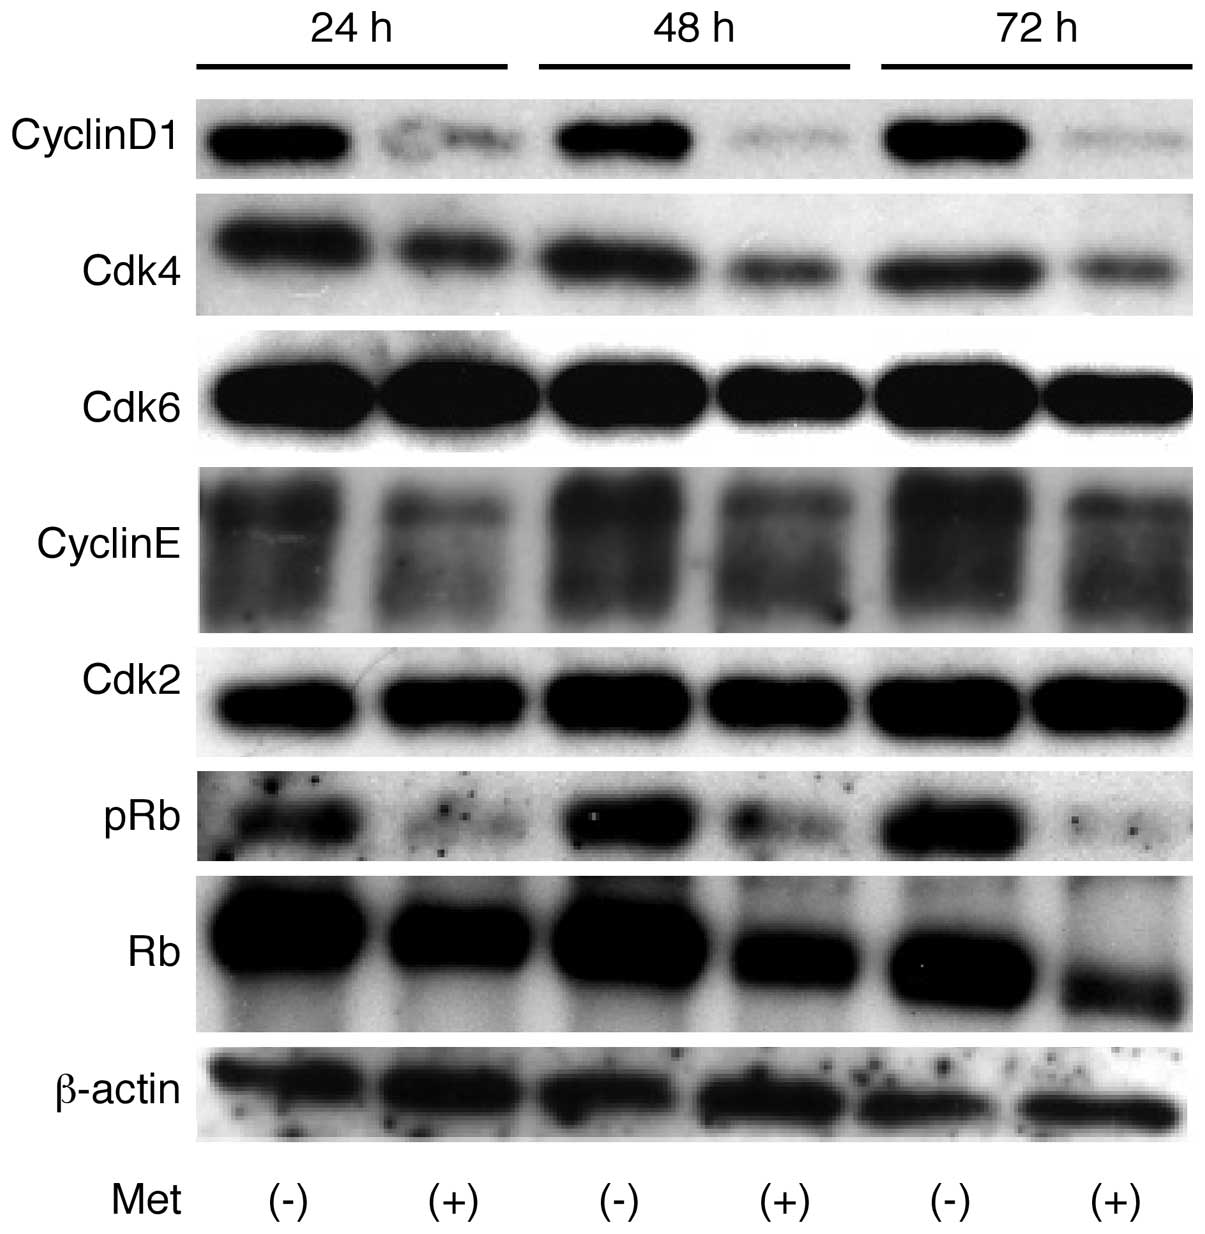
Effects of metformin on cell cycle
regulatory proteins in OE19
The effects of metformin on the expression of
various cell cycle-related molecules in OE19 cells were evaluated
by western blotting. Cells were treated with 0 or 10 mmol/l
metformin for 24–72 h. The most marked metformin-associated change
was the loss of cyclin D1, a key protein implicated in the
transition from G0 to G1 phase, which showed
a time-dependent reduction (Fig.
2). Metformin treatment also resulted in a progressive decrease
in phosphorylated Rb, but had no effect on total Rb. Assays of the
expression of other proteins associated in the G0 to
G1 transition showed that Cdk6, the catalytic subunit of
cyclin D1, Cdk4, and cyclin E were decreased 48 and 72 h after the
addition of metformin.
To further the mechanism of action of metformin on
OE19 cell proliferation, cell cycle progression was examined by
flow cytometry. Following the addition of 10 mmol/l metformin, an
increasing number of cells started accumulating in
G0–G1, 78.2% after 24 h, 81.1% after 48 h,
and 81.9% after 72 h (Fig. 3).
This was accompanied by reductions in the percentages of cells in
S- and G2-M phase (Fig.
3). These findings suggest that metformin inhibits cell cycle
progression from G0–G1 into S-phase,
resulting in G1 cell cycle arrest.
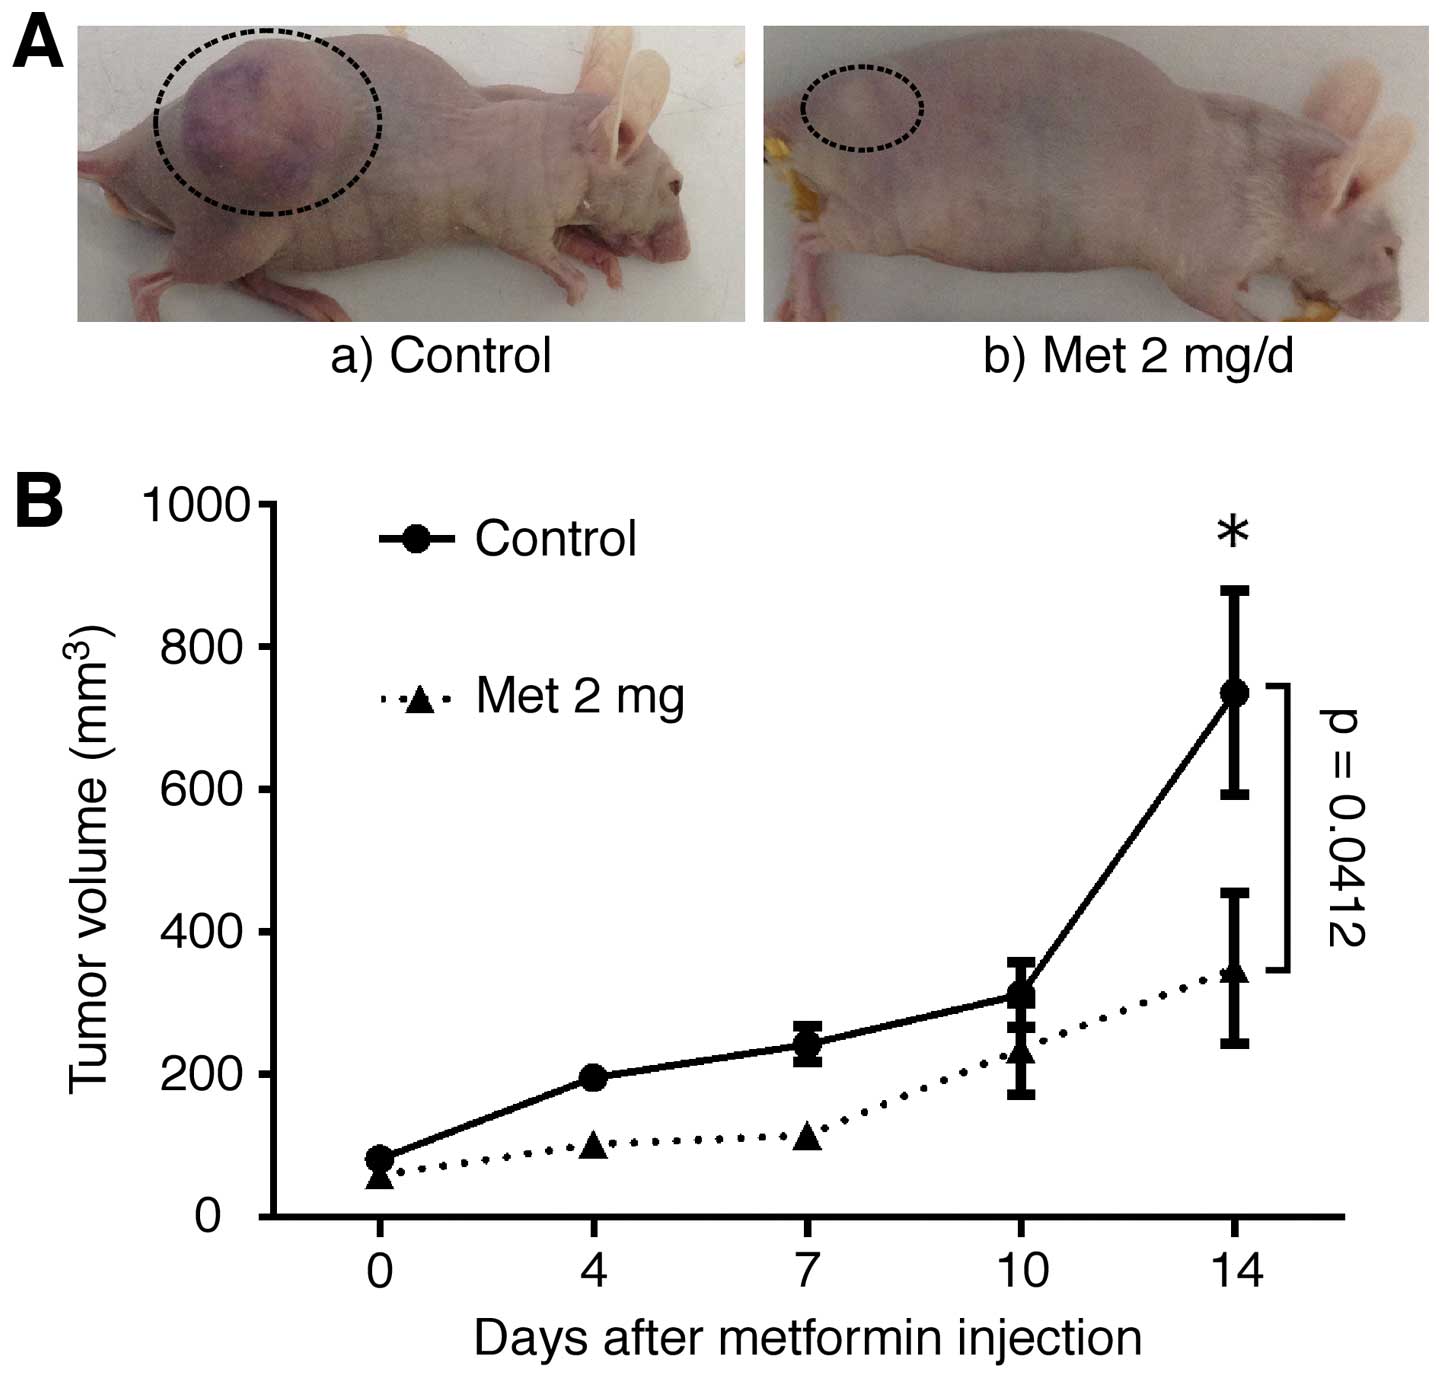
Metformin inhibits tumor proliferation in
vivo
To determine whether metformin could affect tumor
growth in vivo, nude mice were injected subcutaneously with
OE19 cells, followed by the i.p. injection of metformin. Based on
integrated tumor growth curves, the i.p. metformin substantially
inhibited tumor growth, by 47% (Fig.
4A and B), compared with untreated control mice. Throughout
this study, metformin had no apparent effects on the mice and did
not affect their weight. All animals remained alive during the
experiment.
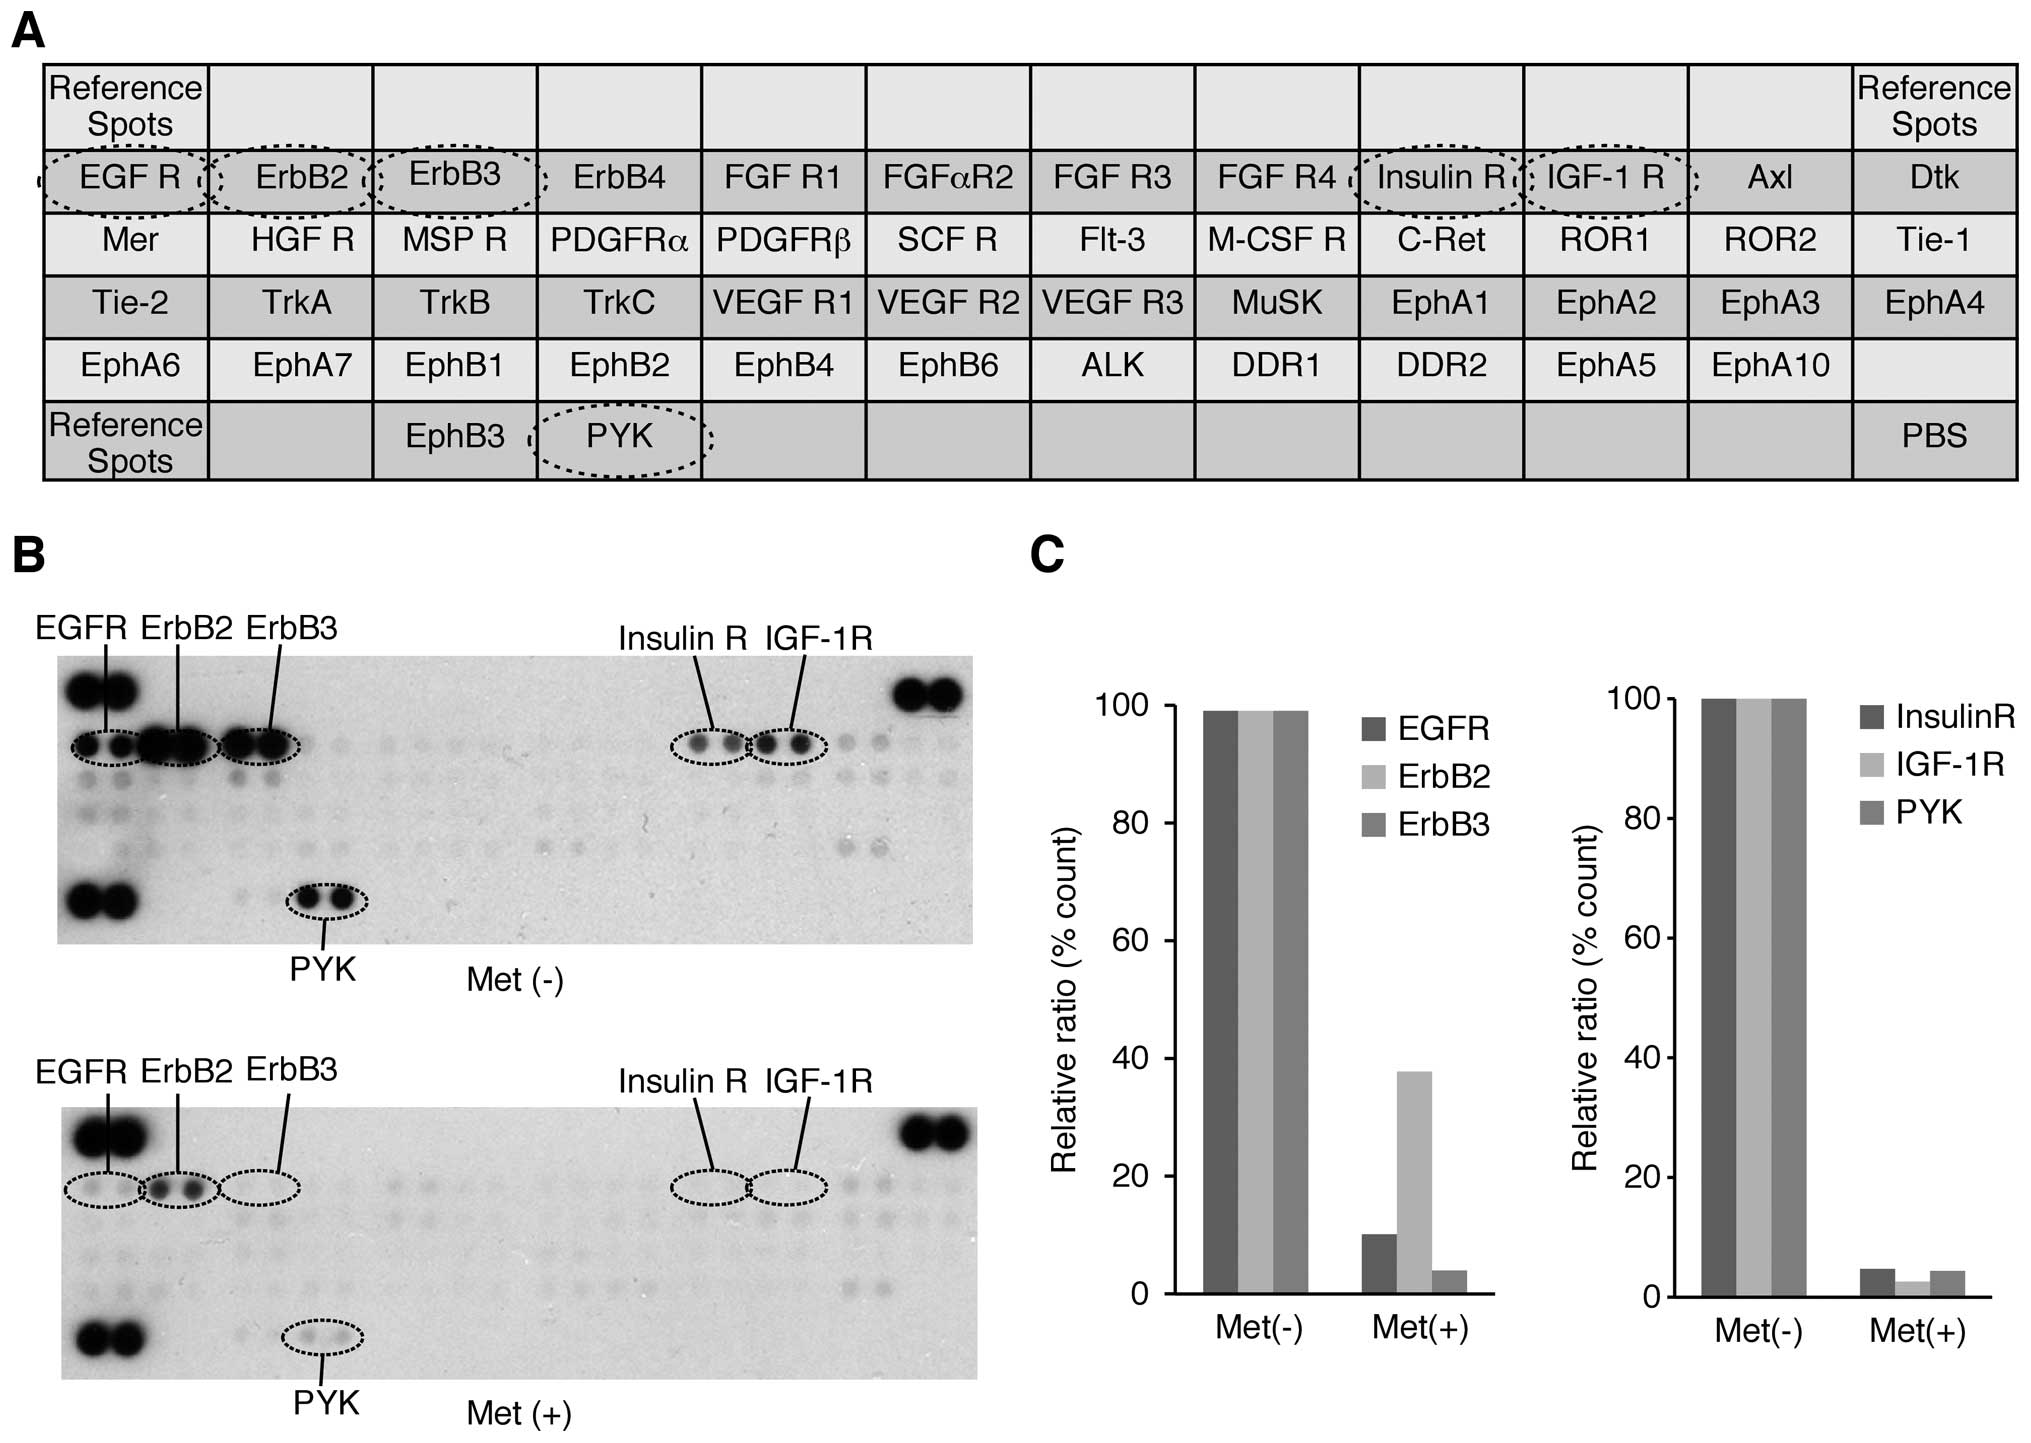
Effects of metformin on p-RTKs in vitro
and in vivo
A p-RTK array system was used to identify the key
RTKs associated with the antitumor effect of metformin. Using an
antibody array (Fig. 5A) enabled
the expression of 49 activated RTKs to be screened in OE19 cells
and tumors in the presence and absence of metformin. Metformin
reduced the levels of expression of phosphorylated epidermal growth
factor receptor (p-EGFR) and phosphorylated insulin-like growth
factor-1 receptor (p-IGF-1R) in vitro, as well as reducing
the expression of ErbB2, ErbB3, insulin-R and PYK (Fig. 5B).
Densitometry showed that ratios of p-EGFR, ErbB2 and
ErbB3 spots of metformin-treated to untreated cells were 10.8, 38.4
and 4.6%, respectively (Fig. 5C).
The densitometric ratios of p-IGF-1R, insulin R, and PYK spots of
metformin-treated to untreated cells were 2.5, 4.7 and 4.4%,
respectively (Fig. 5C).
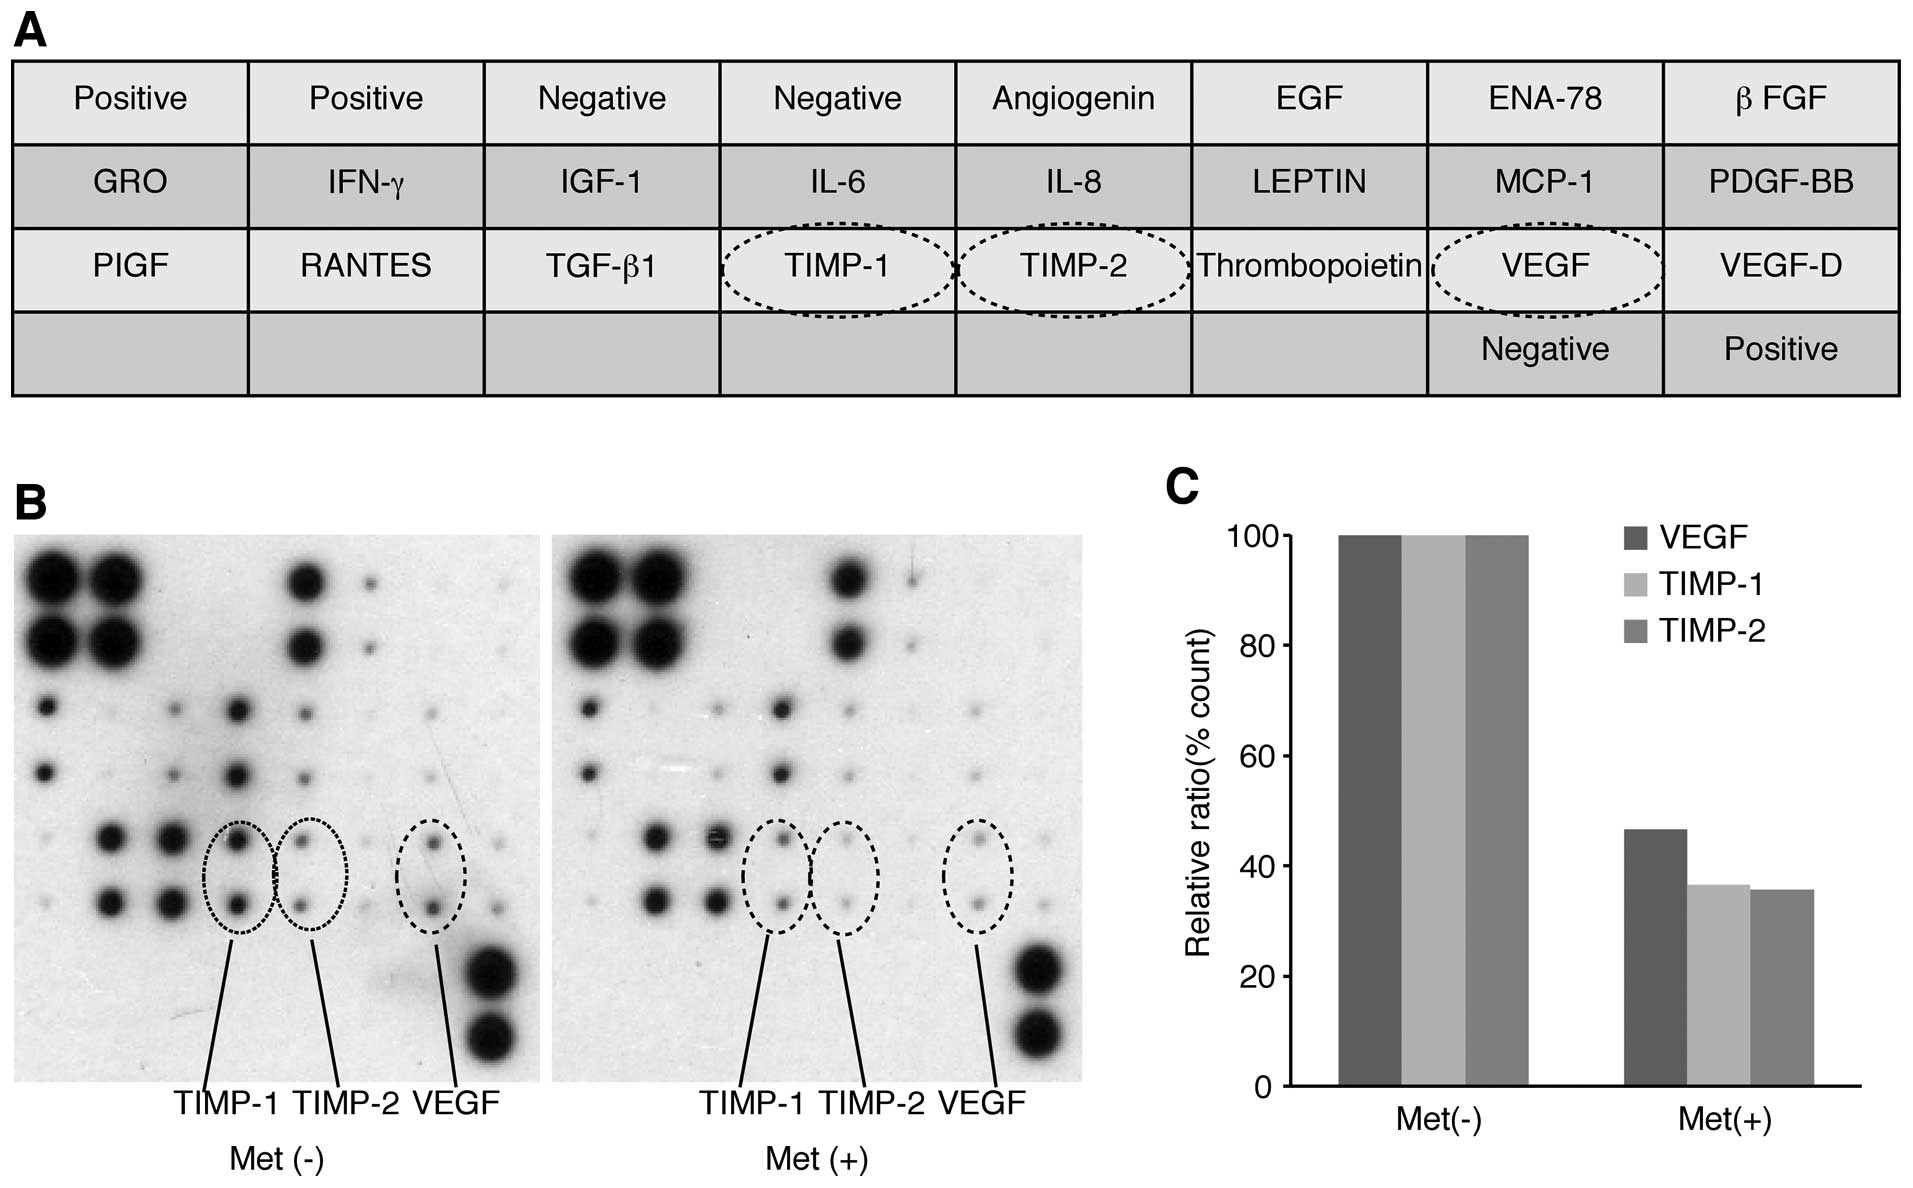
Effects of metformin on angiogenesis in
vitro and in vivo
We used an angiogenesis array system (Fig. 6A) to identify the key
angiogenesis-related molecules associated with the antitumor
effects of metformin on OE19 cells. Of the 20 angiogenesis
molecules screened, VEGF, TIMP-1, and TIMP-2 were reduced in
vitro by metformin (Fig. 6B).
The densitometric ratios of VEGF, TIMP-1 and TIMP-2 spots of
metformin-treated to untreated cells were 46.5, 36.6 and 35.6%,
respectively (Fig. 6C).
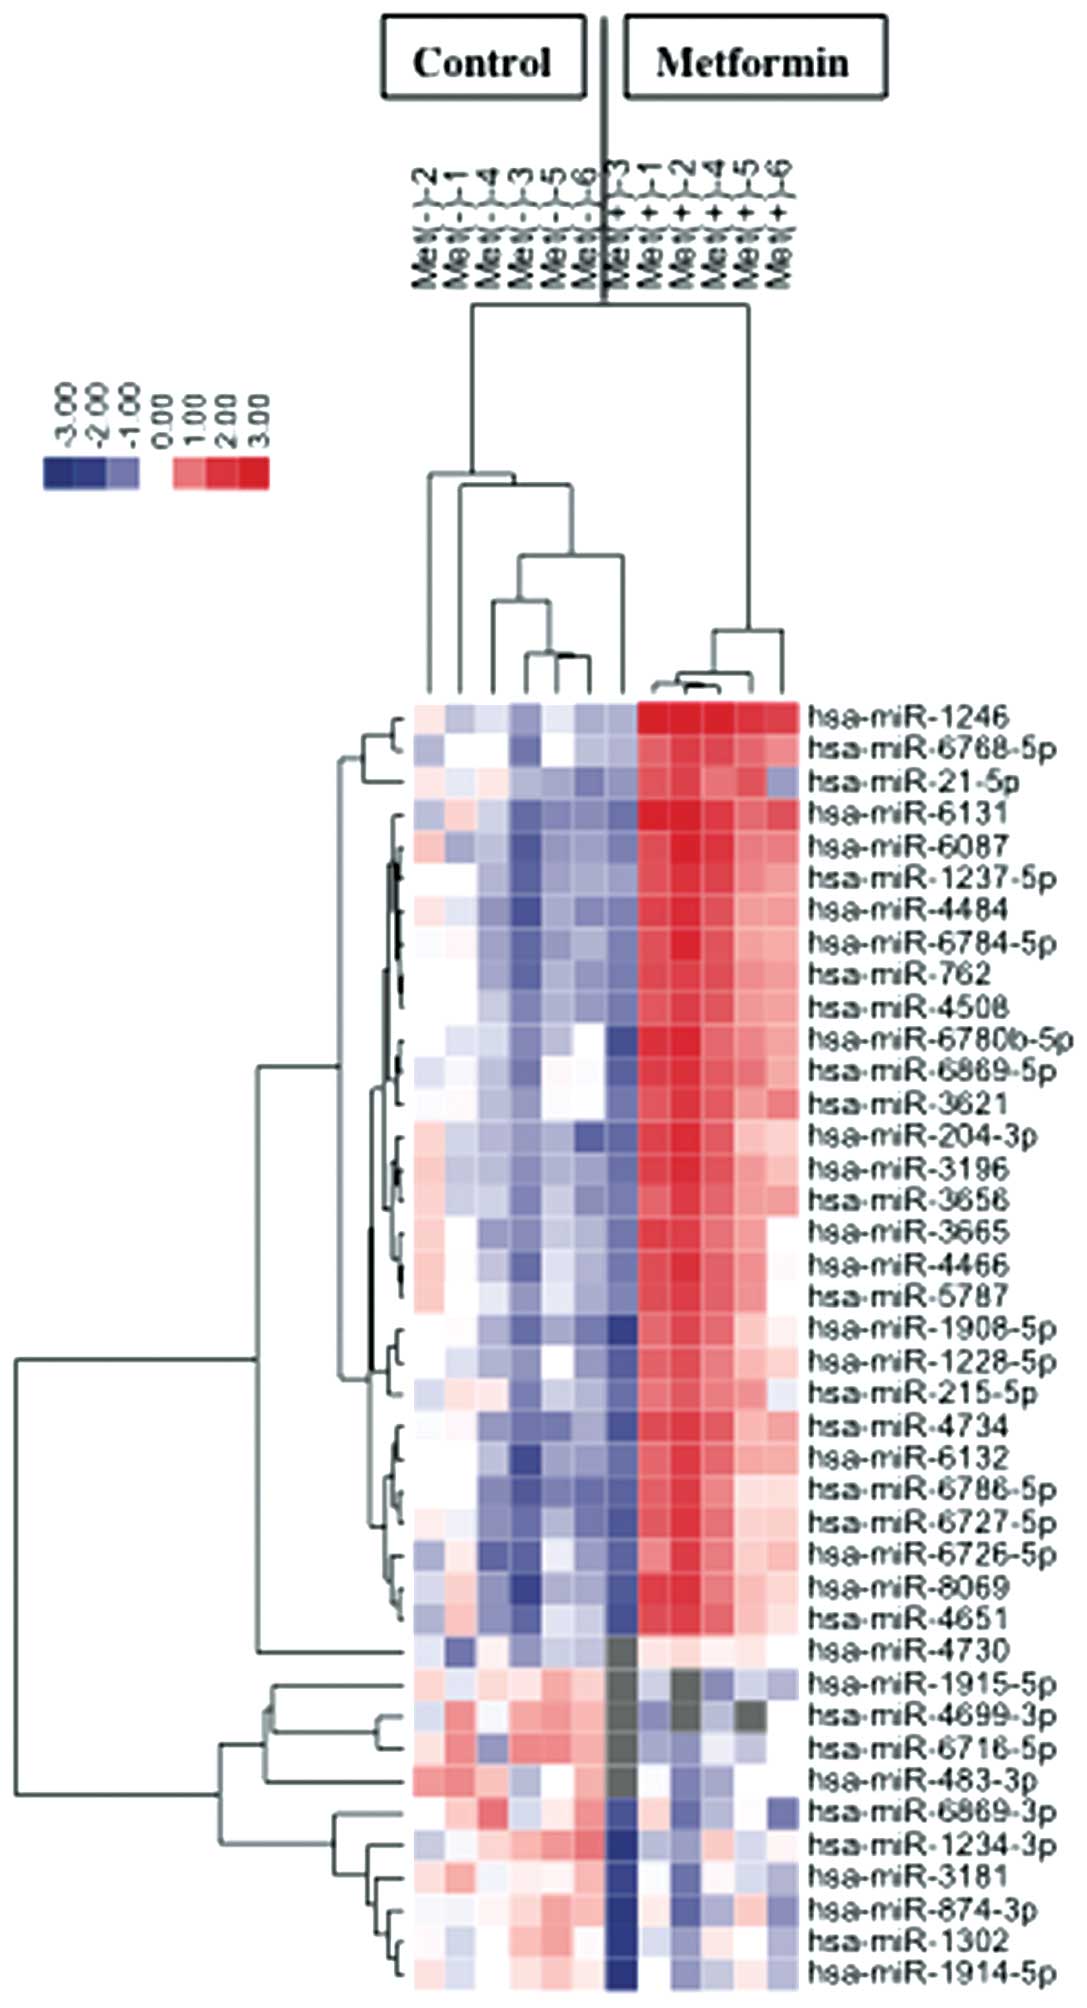
Effects of metformin on miRNA
expression
Using a custom microarray platform, we analyzed the
levels of expression of 985 miRNA probes in cell lines and tumor
tissues in the presence and absence of metformin. Treatment of OE19
cells with 10 mmol/l metformin for 72 h significantly upregulated
three miRNAs while significantly downregulating 10 miRNAs (Table I).
 | Table IStatistical results and chromosomal
location of miRNAs in OE19 cells treated with and without
metformin. |
Table I
Statistical results and chromosomal
location of miRNAs in OE19 cells treated with and without
metformin.
| miRNA | Fold
(treated/nontreated), mean ± SD | P-value | Chromosomal
localization |
|---|
| Upregulated |
| hsa-miR-1246 | 6.25±3.29 | 0.0107 | 2q31.1 |
| hsa-miR-6131 | 4.90±2.87 | 0.0216 | 5 |
| hsa-miR-6087 | 3.55±1.26 | 0.0230 | X |
| hsa-miR-4484 | 3.08±1.01 | 0.0190 | 10 |
|
hsa-miR-1237-5p | 2.93±0.96 | 0.0109 | 11 |
|
hsa-miR-6784-5p | 2.91±1.34 | 0.0341 | 17 |
| hsa-miR-762 | 2.77±0.92 | 0.0103 | 16 |
|
hsa-miR-6780b-5p | 2.75±1.53 | 0.0419 | 6 |
| hsa-miR-204-3p | 2.71±1.14 | 0.0445 | 9q21.12 |
| hsa-miR-3196 | 2.69±1.15 | 0.0323 | 20 |
|
hsa-miR-6768-5p | 2.68±0.97 | 0.0051 | 16 |
| hsa-miR-4734 | 2.66±1.05 | 0.0216 | 17 |
|
hsa-miR-6869-5p | 2.64±1.33 | 0.0238 | 20 |
|
hsa-miR-6726-5p | 2.57±1.53 | 0.0444 | 1 |
| hsa-miR-8069 | 2.56±1.11 | 0.0478 | 21 |
|
hsa-miR-6786-5p | 2.46±0.80 | 0.0431 | 17 |
| hsa-miR-4508 | 2.45±0.79 | 0.0147 | 15 |
| hsa-miR-6132 | 2.42±0.68 | 0.0241 | 7 |
|
hsa-miR-6727-5p | 2.41±0.96 | 0.0469 | 1 |
| hsa-miR-4651 | 2.35±1.33 | 0.0487 | 7 |
| hsa-miR-3621 | 2.35±1.04 | 0.0208 | 9 |
| hsa-miR-3656 | 2.32±0.69 | 0.0213 | 11 |
| hsa-miR-21-5p | 2.28±1.07 | 0.0348 | 17q23.1 |
| hsa-miR-4466 | 2.27±0.84 | 0.0455 | 6 |
| hsa-miR-3665 | 2.22±092 | 0.0470 | 13 |
|
hsa-miR-1908-5p | 2.12±0.85 | 0.0490 | 11 |
| hsa-miR-5787 | 2.06±0.75 | 0.0409 | 3 |
|
hsa-miR-1228-5p | 2.00±0.80 | 0.0392 | 12 |
| hsa-miR-215-5p | 1.76±0.64 | 0.0499 | 1q41 |
| hsa-miR-4730 | 1.19±0.66 | 0.0108 | 17 |
| Downregulated |
|
hsa-miR-4699-3p | 0.31±0.35 | 0.0440 | 12 |
|
hsa-miR-1915-5p | 0.44±0.34 | 0.0035 | 10p12.31 |
| hsa-miR-483-3p | 0.52±0.31 | 0.0356 | 11p15.5 |
|
hsa-miR-6869-3p | 0.58±0.27 | 0.0270 | 20 |
|
hsa-miR-6716-5p | 0.59±0.44 | 0.0215 | 11 |
| hsa-miR-874-3p | 0.62±0.31 | 0.0372 | 5q31.2 |
| hsa-miR-3181 | 0.64±0.27 | 0.0117 | 16 |
|
hsa-miR-1234-3p | 0.64±0.29 | 0.0467 | 8 |
| hsa-miR-1302 | 0.71±0.30 | 0.0426 | X |
|
hsa-miR-1914-5p | 0.71±0.30 | 0.0408 | 20q13.33 |
Unsupervised hierarchical clustering analysis, using
Pearson’s correlation, showed that cell lines in vitro and
tumorous tissues in vivo treated with metformin clustered
together, and separately from untreated cell lines (Fig. 7).
Discussion
Esophageal cancer is the eight most common cancer
and the sixth most common cause of cancer deaths worldwide
(19). The incidence of esophageal
adenocarcinoma (EAC) has been increasing, particularly in western
countries, accounting for 50% of esophageal cancers (20). Obese patients have a higher
prevalence of gastroesophageal reflux disease, which can lead to
Barrett’s esophagus and intestinal metaplasia, which are precursors
of EAC (21–23).
Metformin (dimethylbiguanide) is one of the most
commonly prescribed antihyperglycemic drugs for the treatment of
type 2 diabetes worldwide. The mechanism of action of metformin
includes the stimulation of glucose uptake and the increase in
fatty acid oxidation in muscle and liver (5). These properties can result in the
inhibition of cancer cell growth, the suppression of HER2
overexpression and the inhibition of mTOR (24–26).
Metformin has also been shown to block cancer cell proliferation
(5,10–13),
and to reduce the risk of esophagus, stomach, colon, pancreas and
liver cancer, and improve cancer prognosis, in patients with type 2
diabetes (27).
However, the antitumor effect of metformin on EAC
remained unknown. Herein, we show that metformin not only is a very
potent inhibitor of human esophageal adenocarcinoma cell growth but
also inhibits tumorigenesis in a xenograft model when administered
intraperitoneally.
Specific cyclin/Cdk complexes are activated at
different intervals during the cell cycle. Complexes of Cdk4 and
Cdk6 with cyclin D1 are required for G1 phase progression, whereas
complexes of Cdk2 with cyclin E are required for G1-S transition
(28). Metformin has been shown to
downregulate cyclin D1 in various cancer cell lines, including
stomach (11), colon (10), liver (13), breast (9), and prostate (5) cancer lines. However, the effects of
metformin on catalytic subunits of cyclin D1, Cdk4 and Cdk6, remain
unknown. The results presented here indicate that these major cell
cycle regulators (cyclin D1, Cdk4, Cdk6, cyclinE, Cdk2 and
phosphorylated Rb) may be intracellular targets of the
metformin-mediated antiproliferative effect in human esophageal
adenocarcinoma cell lines. In addition, flow cytometry showed that
metformin arrested esophageal adenocarcinoma cells at the
G0 to G1 transition in vitro.
Metformin also markedly suppressed the growth of subcutaneous
esophageal adenocarcinomas in athymic nude mice reducing the levels
of expression of cyclin D1, Cdk4, Cdk6, cyclin E, Cdk2 and
phosphorylated Rb in these tumors, indicating that metformin may
inhibit the expression of cell cycle-related molecules in
vivo. These data suggest that the antitumor effect of metformin
may be related to the reduction of various cell cycle-related
proteins, especially cyclin D1.
An in vitro study was conducted using a
higher dose of metformin than used in human treatment (6–30
μmol/l). The use of such higher doses has been the subject of
criticism of similar studies in other cancer cell types, such as
breast (9), prostate (5), and colon cancer (10) cells. However, cells in culture are
grown under hyperglycemic conditions (29). Tissue culture medium alone contains
high concentrations of glucose, and 5–10% FBS is typically added,
resulting in excessive growth stimulation. This may explain why the
antitumor effects of metformin in cell culture systems require
higher doses than are used in patients with diabetes.
The expression of various cell cycle-related
molecules, including cyclin D1 Cdk4, Cdk6, cyclinE and Cdk2, has
been found to be enhanced in various cancers (30,31).
Therefore, inhibition of these molecules, including cycle D1, may
be a target for controlling tumor proliferation.
Metformin has been found to alter the
phosphorylation of various proteins, including Akt, β-catenin, CREB
and Chk2 (32), and c-Src
(29), in various cell lines.
Using protein arrays, we found that metformin reduced p-EGFR and
p-IGF-1R in esophageal adenocarcinoma cells. Metformin has also
been reported to reduce the levels of expression of p-EGFR and
p-IGF-1R in breast (29), and
pancreatic (33) cancers.
Together, these studies suggest that metformin might reduce the
expression levels of levels of p-EGFR and p-IGF in many cancer
types, including esophageal adenocarcinoma. The EGFR pathway is
important in controlling cell cycle events. For example, EGFR
activation was found to induce expression of cyclin D1, a protein
important in cell cycle progression (34,35).
Metformin also reduced the level of VEGF expression,
a key mediator in cancer angiogenesis, a process essential for
cancer development and growth (42). High VEGF expression has been
associated with poor prognosis in patients with esophageal cancer,
suggesting that reducing its expression may have benefits in
patients with esophageal cancers (43). Moreover, metformin was found to
reduce expression of TIMP-1 and TIMP-2, both of which are
angiogenesis-related proteins. TIMP-1 inhibits the activity of
matrix metalloproteinases, which play an important role in cancer
invasion and metastasis (36).
TIMP-1 expression has been found to correlate with
high-grade malignant behavior in human esophageal carcinomas, and
is an independent prognostic factor in these patients (37). These results suggest that the
antitumor effect of metformin may be due, at least in part, to its
reduction of TIMP-1 expression, and may therefore play an important
role in reducing cancer invasion and metastasis.
The miRNAs associated with the antitumor effects of
metformin were assessed using miRNA expression arrays. Cluster
analyses clearly showed that metformin treatment affected the
extent of miRNA expression in clustered cells and in tumor tissues.
We identified 40 miRNAs that were differentially expressed in
cluster. These miRNAs are meaningful candidates to gauge the
effectiveness of metformin treatment and to provide clues to the
molecular basis of the anti-cancer effects of metformin,
particularly those mediated by miRNAs.
MiR-1246 was reported to be a target of the p53
family, and inhibits Down syndrome-associated DYRK1A, consequently
activating NFAT1c and inducing apoptosis (38). Serum miR-1246 was reported elevated
in patients with esophageal squamous cell carcinoma, to correlate
with TNM stage and to be an independent risk factor for poor
survival (39). Other studies have
also shown contrasting changes in the miRNA expression levels
between tissue and blood samples (40,41).
It has not yet been determined whether miR-1246 acts as an
oncogenic miRNA or tumor suppressor. However, metformin was shown
to upregulate miR-1246 in gastric cancer (11), esophageal squamous cell carcinoma
(12), and hepatocellular
carcinoma (13) cell lines,
suggesting that miR-1246 may be associated with the antitumor
effect of metformin in various cancer cells.
In conclusion, our results revealed that metformin
inhibits human esophageal adenocarcinoma cell proliferation and
tumor growth, possibly by suppressing cell cycle-related molecules
through the alteration of miRNAs.
Acknowledgements
We thank Ms. Yuko Miyawaki and Ms. Noriko Murao for
providing technical assistance.
References
|
1
|
Pennathur A, Gibson MK, Jobe BA and
Luketich JD: Oesophageal carcinoma. Lancet. 381:400–412. 2013.
View Article : Google Scholar : PubMed/NCBI
|
|
2
|
Enzinger PC and Mayer RJ: Esophageal
cancer. N Engl J Med. 349:2241–2252. 2003. View Article : Google Scholar : PubMed/NCBI
|
|
3
|
Pennathur A, Farkas A, Krasinskas AM,
Ferson PF, Gooding WE, Gibson MK, Schuchert MJ, Landreneau RJ and
Luketich JD: Esophagectomy for T1 esophageal cancer: Outcomes in
100 patients and implications for endoscopic therapy. Ann Thorac
Surg. 87:1048–1055. 2009. View Article : Google Scholar : PubMed/NCBI
|
|
4
|
Edgren G, Adami HO, Weiderpass E and Nyrén
O: A global assessment of the oesophageal adenocarcinoma epidemic.
Gut. 62:1406–1414. 2013. View Article : Google Scholar
|
|
5
|
Ben Sahra I, Laurent K, Loubat A,
Giorgetti-Peraldi S, Colosetti P, Auberger P, Tanti JF, Le
Marchand-Brustel Y and Bost F: The antidiabetic drug metformin
exerts an antitumoral effect in vitro and in vivo through a
decrease of cyclin D1 level. Oncogene. 27:3576–3586. 2008.
View Article : Google Scholar : PubMed/NCBI
|
|
6
|
Libby G, Donnelly LA, Donnan PT, Alessi
DR, Morris AD and Evans JM: New users of metformin are at low risk
of incident cancer: A cohort study among people with type 2
diabetes. Diabetes Care. 32:1620–1625. 2009. View Article : Google Scholar : PubMed/NCBI
|
|
7
|
Landman GW, Kleefstra N, van Hateren KJ,
Groenier KH, Gans RO and Bilo HJ: Metformin associated with lower
cancer mortality in type 2 diabetes: ZODIAC-16. Diabetes Care.
33:322–326. 2010. View Article : Google Scholar :
|
|
8
|
Kourelis TV and Siegel RD: Metformin and
cancer: New applications for an old drug. Med Oncol. 29:1314–1327.
2012. View Article : Google Scholar
|
|
9
|
Anisimov VN, Egormin PA, Piskunova TS,
Popovich IG, Tyndyk ML, Yurova MN, Zabezhinski MA, Anikin IV,
Karkach AS and Romanyukha AA: Metformin extends life span of
HER-2/neu transgenic mice and in combination with melatonin
inhibits growth of transplantable tumors in vivo. Cell Cycle.
9:188–197. 2010. View Article : Google Scholar
|
|
10
|
Zhou XZ, Xue YM, Zhu B and Sha JP: Effects
of metformin on proliferation of human colon carcinoma cell line
SW-480. Nan Fang Yi Ke Da Xue Xue Bao. 30:1935–1938. 1942.2010.(In
Chinese).
|
|
11
|
Kato K, Gong J, Iwama H, et al: The
antidiabetic drug metformin inhibits gastric cancer cell
proliferation in vitro and in vivo. Mol Cancer Ther. 11:549–560.
2012. View Article : Google Scholar : PubMed/NCBI
|
|
12
|
Kobayashi M, Kato K, Iwama H, et al:
Antitumor effect of metformin in esophageal cancer: In vitro study.
Int J Oncol. 42:517–524. 2013.
|
|
13
|
Miyoshi H, Kato K, Iwama H, et al: Effect
of the anti-diabetic drug metformin in hepatocellular carcinoma in
vitro and in vivo. Int J Oncol. 45:322–332. 2014.PubMed/NCBI
|
|
14
|
Masaki T, Tokuda M, Yoshida S, et al:
Comparison study of the expressions of myristoylated alanine-rich C
kinase substrate in hepatocellular carcinoma, liver cirrhosis,
chronic hepatitis, and normal liver. Int J Oncol. 26:661–671.
2005.PubMed/NCBI
|
|
15
|
Bradford MM: A rapid and sensitive method
for the quantitation of microgram quantities of protein utilizing
the principle of protein-dye binding. Anal Biochem. 72:248–254.
1976. View Article : Google Scholar : PubMed/NCBI
|
|
16
|
Laemmli UK: Cleavage of structural
proteins during the assembly of the head of bacteriophage T4.
Nature. 227:680–685. 1970. View
Article : Google Scholar : PubMed/NCBI
|
|
17
|
Towbin H, Staehelin T and Gordon J:
Electrophoretic transfer of proteins from polyacrylamide gels to
nitrocellulose sheets: Procedure and some applications. Proc Natl
Acad Sci USA. 76:4350–4354. 1979. View Article : Google Scholar : PubMed/NCBI
|
|
18
|
D’Incalci M, Colombo T, Ubezio P, et al:
The combination of yondelis and cisplatin is synergistic against
human tumor xenografts. Eur J Cancer. 39:1920–1926. 2003.
View Article : Google Scholar
|
|
19
|
Ferlay J, Shin HR, Bray F, Forman D,
Mathers C and Parkin DM: Estimates of worldwide burden of cancer in
2008: GLOBOCAN 2008. Int J Cancer. 127:2893–2917. 2010. View Article : Google Scholar
|
|
20
|
Bird-Lieberman EL and Fitzgerald RC: Early
diagnosis of oesophageal cancer. Br J Cancer. 101:1–6. 2009.
View Article : Google Scholar : PubMed/NCBI
|
|
21
|
Solaymani-Dodaran M, Logan RF, West J,
Card T and Coupland C: Risk of oesophageal cancer in Barrett’s
oesophagus and gastro-oesophageal reflux. Gut. 53:1070–1074. 2004.
View Article : Google Scholar : PubMed/NCBI
|
|
22
|
Falk GW: Barrett’s esophagus.
Gastroenterology. 122:1569–1591. 2002. View Article : Google Scholar : PubMed/NCBI
|
|
23
|
Fujihara S, Mori H, Kobara H, Nishiyama N,
Kobayashi M, Oryu M and Masaki T: Metabolic syndrome, obesity, and
gastrointestinal cancer. Gastroenterol Res Pract. 2012:4836232012.
View Article : Google Scholar
|
|
24
|
Alimova IN, Liu B, Fan Z, Edgerton SM,
Dillon T, Lind SE and Thor AD: Metformin inhibits breast cancer
cell growth, colony formation and induces cell cycle arrest in
vitro. Cell Cycle. 8:909–915. 2009. View Article : Google Scholar : PubMed/NCBI
|
|
25
|
Vazquez-Martin A, Oliveras-Ferraros C and
Menendez JA: The antidiabetic drug metformin suppresses HER2
(erbB-2) oncoprotein overexpression via inhibition of the mTOR
effector p70S6K1 in human breast carcinoma cells. Cell Cycle.
8:88–96. 2009. View Article : Google Scholar
|
|
26
|
Vázquez-Martín A, Oliveras-Ferraros C, del
Barco S, Martín-Castillo B and Menéndez JA: mTOR inhibitors and the
anti-diabetic biguanide metformin: New insights into the molecular
management of breast cancer resistance to the HER2 tyrosine kinase
inhibitor lapatinib (Tykerb). Clin Transl Oncol. 11:455–459. 2009.
View Article : Google Scholar : PubMed/NCBI
|
|
27
|
Franciosi M, Lucisano G, Lapice E,
Strippoli GF, Pellegrini F and Nicolucci A: Metformin therapy and
risk of cancer in patients with type 2 diabetes: Systematic review.
PLoS One. 8:e715832013. View Article : Google Scholar : PubMed/NCBI
|
|
28
|
Masaki T, Shiratori Y, Rengifo W, et al:
Cyclins and cyclin-dependent kinases: Comparative study of
hepatocellular carcinoma versus cirrhosis. Hepatology. 37:534–543.
2003. View Article : Google Scholar : PubMed/NCBI
|
|
29
|
Liu B, Fan Z, Edgerton SM, Deng XS,
Alimova IN, Lind SE and Thor AD: Metformin induces unique
biological and molecular responses in triple negative breast cancer
cells. Cell Cycle. 8:2031–2040. 2009. View Article : Google Scholar : PubMed/NCBI
|
|
30
|
Han S, Kim HY, Park K, Lee MS, Kim HJ and
Kim YD: Expression of p27Kip1 and cyclin D1 proteins is inversely
correlated and is associated with poor clinical outcome in human
gastric cancer. J Surg Oncol. 71:147–154. 1999. View Article : Google Scholar : PubMed/NCBI
|
|
31
|
Aoyagi K, Koufuji K, Yano S, Murakami N,
Terasaki Y, Yamasaki Y, Takeda J, Tanaka M and Shirouzu K:
Immunohistochemical study on the expression of cyclin D1 and E in
gastric cancer. Kurume Med J. 47:199–203. 2000. View Article : Google Scholar : PubMed/NCBI
|
|
32
|
Vazquez-Martin A, Oliveras-Ferraros C,
Cufí S, Martin-Castillo B and Menendez JA: Metformin activates an
ataxia telangiectasia mutated (ATM)/Chk2-regulated DNA damage-like
response. Cell Cycle. 10:1499–1501. 2011. View Article : Google Scholar : PubMed/NCBI
|
|
33
|
Wang LW, Li ZS, Zou DW, Jin ZD, Gao J and
Xu GM: Metformin induces apoptosis of pancreatic cancer cells.
World J Gastroenterol. 14:7192–7198. 2008. View Article : Google Scholar : PubMed/NCBI
|
|
34
|
Ren M, Zhong X, Ma CY, Sun Y, Guan QB, Cui
B, Guo J, Wang H, Gao L and Zhao JJ: Insulin-like growth factor-1
promotes cell cycle progression via upregulation of cyclin D1
expression through the phosphatidylinositol 3-kinase/nuclear
factor-kappaB signaling pathway in FRTL thyroid cells. Acta
Pharmacol Sin. 30:113–119. 2009. View Article : Google Scholar
|
|
35
|
Pollak M: Insulin and insulin-like growth
factor signalling in neoplasia. Nat Rev Cancer. 8:915–928. 2008.
View Article : Google Scholar : PubMed/NCBI
|
|
36
|
Zeng ZS, Cohen AM, Zhang ZF,
Stetler-Stevenson W and Guillem JG: Elevated tissue inhibitor of
metalloproteinase 1 RNA in colorectal cancer stroma correlates with
lymph node and distant metastases. Clin Cancer Res. 1:899–906.
1995.PubMed/NCBI
|
|
37
|
Mori M, Mimori K, Sadanaga N, Inoue H,
Tanaka Y, Mafune K, Ueo H and Barnard GF: Prognostic impact of
tissue inhibitor of matrix metalloproteinase-1 in esophageal
carcinoma. Int J Cancer. 88:575–578. 2000. View Article : Google Scholar : PubMed/NCBI
|
|
38
|
Zhang Y, Liao JM, Zeng SX and Lu H: p53
downregulates Down syndrome-associated DYRK1A through miR-1246.
EMBO Rep. 12:811–817. 2011. View Article : Google Scholar : PubMed/NCBI
|
|
39
|
Takeshita N, Hoshino I, Mori M, et al:
Serum microRNA expression profile: miR-1246 as a novel diagnostic
and prognostic biomarker for oesophageal squamous cell carcinoma.
Br J Cancer. 108:644–652. 2013. View Article : Google Scholar : PubMed/NCBI
|
|
40
|
Tanaka M, Oikawa K, Takanashi M, Kudo M,
Ohyashiki J, Ohyashiki K and Kuroda M: Down-regulation of miR-92 in
human plasma is a novel marker for acute leukemia patients. PLoS
One. 4:e55322009. View Article : Google Scholar : PubMed/NCBI
|
|
41
|
Liu H, Zhu L, Liu B, Yang L, Meng X, Zhang
W, Ma Y and Xiao H: Genome-wide microRNA profiles identify miR-378
as a serum biomarker for early detection of gastric cancer. Cancer
Lett. 316:196–203. 2012. View Article : Google Scholar
|
|
42
|
Carmeliet P: VEGF as a key mediator of
angiogenesis in cancer. Oncology. 69(Suppl 3): 4–10. 2005.
View Article : Google Scholar : PubMed/NCBI
|
|
43
|
Chen M, Cai E, Huang J, Yu P and Li K:
Prognostic value of vascular endothelial growth factor expression
in patients with esophageal cancer: A systematic review and
meta-analysis. Cancer Epidemiol Biomarkers Prev. 21:1126–1134.
2012. View Article : Google Scholar : PubMed/NCBI
|