Introduction
The emergence of next-generation sequencing (NGS)
has changed the paradigm of genetic and genomic sequencing studies
in personalized medicine. Currently, the power of NGS technology
has allowed large scale DNA sequencing projects to be completed in
record time, releasing huge amounts of invaluable genetic
information. The Cancer Genome Atlas (TCGA) is an international
consortium that has sequenced the exome from more than 17,200 tumor
patient samples including lung (1–4),
colon and rectal (5), breast
(6), prostate (7), bladder (8), melanoma (9), gastric adenocarcinoma (10), and numerous other cancer types
(11–24). NGS has helped to identify
actionable somatic mutations in cancer. Since human cancers are
mainly caused by genetic alterations of key drivers or main pathway
regulator genes, use of NGS is expected to identify new therapeutic
targets and diagnostic markers.
More and more molecular diagnostic laboratories are
using NGS to screen mutations of key genes for either drug
selection as a targeted therapy or for patient follow-up such as
disease recurrence monitoring. The two most common NGS library
preparation methods are hybridization or capturing-based (25) and amplicon-based methods (26). Both have proved to work efficiently
with DNA extracted from formalin-fixed, paraffin-embedded (FFPE)
tissue specimens, which account for the vast majority of samples
for molecular and histopathology diagnosis. However, several
obstacles prevent the routine implementation of NGS technology in
the clinical molecular diagnostic setting: the sophisticated sample
preparation process, high cost, time-consuming data analyses, as
well as the reproducibility and accuracy of interpretation.
Moreover, it is not always feasible to investigate
reproducibility and accuracy of sequencing results among different
clinical laboratories due to different systems including
technician's skill, DNA and RNA extraction, library preparation,
library quality and quantity measurement, sequencing and data
analyses. Although the same sequencing library and sequencing
reagents are used, the results can be different depending on the
several factors mentioned above. This can be a huge problem when
considering the significance of the sequencing result and its role
as treatment selection.
To address those of the potentially important
disparities in workflow, we sought to determine the variations and
consistencies between two different clinical laboratories when
testing a targeted cancer panel comprising 25 cancer driver genes
known to be clinically relevant. Clinical samples and commercially
available mutation-positive DNA were tested for
laboratory-to-laboratory consistency, validation of
intra-laboratory reproducibility, and limit of detection (LOD)
analysis. We used both clinical samples and mutation positive DNA
control with various types of mutations. We focused on consistency
and reproducibility of sequencing results in two different
laboratories for the laboratory-to-laboratory accuracy test. We
also aimed to test batch-to-batch or person-to-person variations by
doing 5 independent sequencings in one laboratory. Finally, we
tested the limit of mutation detection by serial dilution of a
known mutation-positive DNA sample with a wild-type or non-mutant
control sample in a limit of detection test.
Materials and methods
Experimental design
The experimental design of our targeted NGS cancer
panel validation consisted of three different experiments conducted
at two independent Clinical Laboratory Improvement Amendments
(CLIA)-certified laboratories, Encore Clinical (Brisbane, CA, USA;
referred to as Laboratory A) and Purity Laboratories (Lake Oswego,
OR, USA; referred to as Laboratory B). The first experiment was
laboratory-to-laboratory accuracy validation to determine the
reproducibility and accuracy of the targeted NGS panel (NextDaySeq™
Pan Cancer HotSpot Panel; CureSeq Inc., Brisbane, CA, USA) of 25
genes selected for clinical relevance of various human cancers. The
second experiment was intra-laboratory precision validation to
determine the consistency of results in multiple independent
experiments in one laboratory. To test intra-laboratory
reproducibility, five samples were assayed across five independent
experiments by two technicians in the Laboratory B. The third
experiment was the limit of detection (LOD) test, which measured
the lowest level of mutation allele frequency. It was performed by
diluting mutated DNA from a sample with a previously known genotype
(KRAS mutation) and mutation allele frequency with DNA from
a non-mutated (WT) sample on a wide range of dilutions and assayed
in Laboratory B.
Formalin-fixed, paraffin-embedded (FFPE)
specimens and samples
In the validation of the three tests mentioned
above, we used two commercially available FFPE cell lines, with
known genotypes and mutation allele frequencies (EGFR and
KRAS Gene-Specific Multiplex Reference Standard cell lines;
Horizon Discovery, Cambridge, MA, USA; cat no. HD850 and HD301 for
EGFR and KRAS, respectively), 48 FFPE or frozen
cancer tissues collected under a protocol (#11-06107) approved by
the Committee for Human Research at the University of California,
San Francisco, and the AcroMetrix Oncology Hotspot Control DNA
(Thermo Fisher Scientific, Waltham, MA, USA; cat. no. 969056) to
test multiple mutations across different regions targeted by the
NGS panel.
FFPE tissue processing and DNA
extraction
For each sample one FFPE tissue section, 5–10 μm in
thickness with no more than 2.25 cm2 of tissue area, was
used as starting material for DNA extraction with the UltraRapid
FFPE DNA extraction kit (CureSeq; cat. no. CS-FFPE-50). Extraction
was performed in accordance with the manufacturer's instructions.
Briefly, the frosted histological slides containing the FFPE tissue
sections were deparaffinized in xylene for 10 min at room
temperature in a dedicated fume hood, followed by complete air dry
for at least 10 min. The deparaffinized FFPE tissue was hydrated
with 5 μl of Solution A (CureSeq) and transferred into a
low-binding 0.2 ml PCR tube containing 70 μl of Solution A. The
tube was then incubated in a regular thermal cycler for 5 min at
99°C. After adding 10 μl of resuspended Solution B (CureSeq),
samples were incubated for 5 min at 60°C followed by 5 min at 99°C.
Samples were centrifuged at 1,000 × g for 1 min at room
temperature, and the supernatant was transferred into a clean tube
without disturbing the pellet.
Quality assessment and quantitation of
functional DNA concentration by qPCR
The quantity and quality control of the extracted
DNA was evaluated using the DNA Q&Q kit (CureSeq; cat. no.
Q&Q-DNA-50) and run on a QuantStudio 6 qPCR platform (Thermo
Fisher Scientific), following the manufacturer's instructions. The
DNA Q&Q is a fluorescent-based qPCR assay that provides
quantitation of human genomic DNA by measuring the presence of
short DNA fragments (amplicons called DS1; length ≤85 bp). The
integrity of the extracted DNA is evaluated by calculating the
ratio of DNA concentration of short (DS1) and long amplicons
(called DS2; length <190 bp). Briefly, the extracted DNA was
diluted 1:4 (vol/vol) in molecular biology-grade water. Each sample
DNA was tested in triplicate for both DS1 and DS2 assays. The qPCR
thermal profile and reagents volume shared for DS1 and DS2 were as
follows: 2 μl of diluted DNA was mixed with 10 μl of 2× PCR Master
Mix, 1 μl of 20× DS1 or DS2 assay oligonucleotides and 7 μl of
water. The thermal profile of the qPCR reaction started with an
incubation for 2 min at 50°C, followed by 2 min at 95°C and 40 qPCR
cycles of 15 sec at 95°C plus 1 min at 60°C. The melting curve
consists of a single cycle of 15 sec at 95°C, 1 min at 60°C and a
final incubation of 15 sec at 95°C. ROX was used as passive
reference. The thresholds of increase in the fluorescence intensity
(ΔRn) were 1.29 for DS1 and 1.00 for DS2. The analysis of qPCR data
was carried out by using the DNA Q&Q Calculator v7.0 provided
by the manufacturer.
Targeted NGS library preparation
The targeted cancer NGS panel (NextDay Seq-Pan
Cancer HotSpot Panel kit; CureSeq) was used to prepare the
libraries for sequencing in the Ion Torrent PGM sequencer. The
libraries were prepared in a three-step protocol. First, 10 ng of
DNA was loaded in a multiplexed, high-fidelity PCR reaction,
targeting hot-spot mutated loci of the human genome from 25 of the
most commonly mutated genes across solid and hematological tumor
types (ABL1, AKT1, ALK, BRAF,
CTNNB1, DDR2, DNMT3A, EGFR,
ERBB2, ESR1, FLT3, GNA11, GNAQ,
HRAS, IDH1, IDH2, KRAS, MAP2K1,
NRAS, PIK3CA, PTEN, RET, SMAD4,
SMO and TSC1) and run for 22 cycles. Second, the PCR
products were directly ligated to universal adapters and barcodes.
Third, the libraries were purified by using a magnetic bead-based
protocol and eluted in 30 μl of 1X LTE buffer. The prepared
libraries were stored at 4°C for short-term and at −20°C for
long-term storage. Each library (1 μl) was loaded into a High
Sensitivity DNA chip (Agilent Technologies, Santa Clara, CA, USA;
cat. no. 5067-4626) to evaluate the quality and library yield. The
yield from each library (pmol/l) was calculated by running a smear
analysis of the electropherogram peaks ranging from 245 to 400 bp,
using the Bioanalyzer 2100 platform (Agilent Technologies) and
software.
Emulsion PCR and Ion torrent
sequencing
Following the manufacturer's instructions, the
volume of each of the prepared libraries was adjusted to add
equimolar amounts of each library into the emulsion PCR for a final
total molarity ranging from 400 to 800 pmoles. The emulsion PCRs
were carried out using the Ion PGM Template OT2 200 kit (Thermo
Fisher Scientific; cat. no. 4480974) and loaded in the Ion
OneTouch™ 2 System, after which non-templated Ion Sphere Particles
(ISP) beads were removed by magnetic bead purification (included in
the Ion PGM Template OT2 200 kit). After ISP bead enrichment, each
library was sequenced using the Ion PGM Sequencing 200 kit V2
(Thermo Fisher Scientific; cat. no. 4482006; lot no. sequencing
reagents: 010688; sequencing solution: 010689). The enriched
sequencing microreactors from each emulsion PCR were loaded in an
Ion 316 v2 Chip or an Ion 318 v2 Chip (Thermo Fisher Scientific;
cat no. 4484355; lot no. P32800.1, and P32672.1), and sequenced on
an Ion Torrent™ Personal Genome Machine® (PGM)
platform.
Laboratory-to-laboratory accuracy
test
Forty-eight FFPE or fresh-frozen cancer tissues, two
cancer FFPE cell lines samples (Horizon), and one commercial DNA
containing multiple cancer mutations (AcroMetrix) were used for
targeted NGS analysis. All the library preparation and sequencing
were done in Laboratories A and B.
Intra-laboratory precision test
Four cancer FFPE samples (9T, 14T, 19T and 29T) and
one normal tissue (3N) were used for the targeted NGS analysis in
Laboratory B. Five independent NGS analyses were done by two
technicians using the above mentioned five FFPE samples.
Limit of detection (LOD) validation
The LOD study was done at Laboratory B serially
diluting a KRAS (G12A) mutant FFPE sample (8T) with a
KRAS wild-type sample (27T). The DNA from a mutated sample
(8T) was serially diluted with WT DNA to create a decreasing
mutation allele frequency titration experiment from 70 to 2%.
NGS data analysis
The PGM's default system, the Ion Torrent Suite
(ITS) was used for sequencer data management. ITS integrates a
cluster of pre-processing algorithms for NGS data, to align the
targeted sequencing data against the human reference genome (hg19)
and to normalize the quality scores. The output sequencing data for
each barcoded library was aligned against the human genome by the
Ion Torrent Suite software and compiled into .bam and their indexed
counterpart (.bai) files. These files were used to run coverage
analysis of targeted regions and variant calls with DanPA software
(CureSeq). DanPA software, by default, only calls mutations with
allele frequency >2%. Ion Torrent Suite maximizes the quality of
the sequencing data output, filters out the data coming from
sequencing microreactors containing polyclonal templates and low
quality reads or primer dimers. After the initial filtering of
data, the quality of a sequencing run can be assessed by evaluating
the percentage of bases with ≥Q20 value, percentage of sequencing
reads successfully aligned against the reference human genome, mean
of sequencing read length and the median sequencing coverage. The
Phred score (Q-score) defines the logarithmic chances that a
sequenced nucleotide base is erroneously called, so a base with
≥Q20 indicates that the error rate is <1 in 100.
Statistical analysis
The mutation allele frequency variable was analyzed
as a continuous variable. We calculated the correlation between
mutation allele frequencies from Laboratory A and B, or from
different experiments from intra-laboratory precision validation,
by linear regression analysis (GraphPad Prism v 6.0 software). The
reproducibility of each mutation detected in the intra-laboratory
validation was calculated by coefficient of variation (GraphPad
Prism v 6.0 software). All statistical tests were considered
significant when the alpha values were <0.05.
Results
Laboratory-to-laboratory accuracy
test
The sequencing data obtained was of high quality and
consistent inter- and intra-experimentally in both laboratories.
The percentage of sequenced bases with ≥Q20 value ranged from 88.18
to 91.98% in Laboratory A and from 89.29 to 92.18% in Laboratory B.
The average of sequencing reads aligned against the reference human
genome was 96.00% for sequencing runs from Laboratory A and 96.75%
for runs from Laboratory B. The median sequencing coverage in
targeted regions was of 3,053X and 3,664X for sequencing runs from
Laboratory A and B, respectively.
Among the 48 clinical samples used in the accuracy
test, a total of 87 mutations were detected, including 63 (72.4%)
silent or synonymous and 24 (27.6%) non-synonymous variants,
respectively. In the Acrometrix control DNA, 83 expected mutations
targeted by the NGS library panel were detected, including 7 (8.4%)
silent and 76 (91.6%) non-synonymous variants. In the two
commercial FFPE cell lines, a total of 12 mutations were detected,
including 2 (16.7%) silent and 10 (83.3%) non-synonymous variants.
Out of a total of 182 mutations, 181 were detected in both
laboratories. The study of consistency of mutation calls between
both clinical laboratories showed that 99.5% (181 out 182) of the
mutations detected in Laboratory B were also found in Laboratory A.
One synonymous mutation (HRAS H27H; mutation allele
frequency, 2.4%), was detected in sample number 25 in Laboratory B
but not detected in Laboratory A. Because silent mutations detected
in tumor tissue can be either germline polymorphisms or somatic
mutations, and the germline variants can affect the degree of
correlation between mutation allele frequencies found in both
laboratories, two separated analyses were performed: one for all
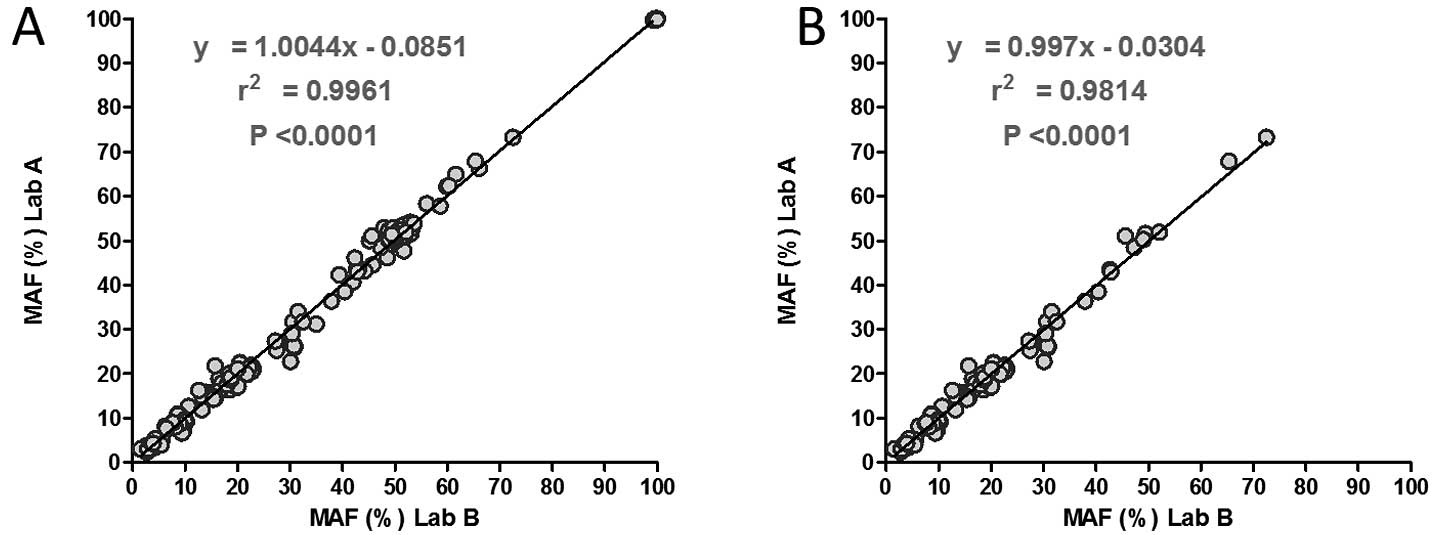
the variants and another for non-synonymous mutations. The
regression analysis of mutation allele frequencies from mutations
found in both laboratories showed very strong correlation when all
the variants (n=181; slope=1.0044; R2=0.996;
P<0.0001) were analyzed and if only non-synonymous mutations
were analyzed (n=110; slope=0.997; R2=0.9814;
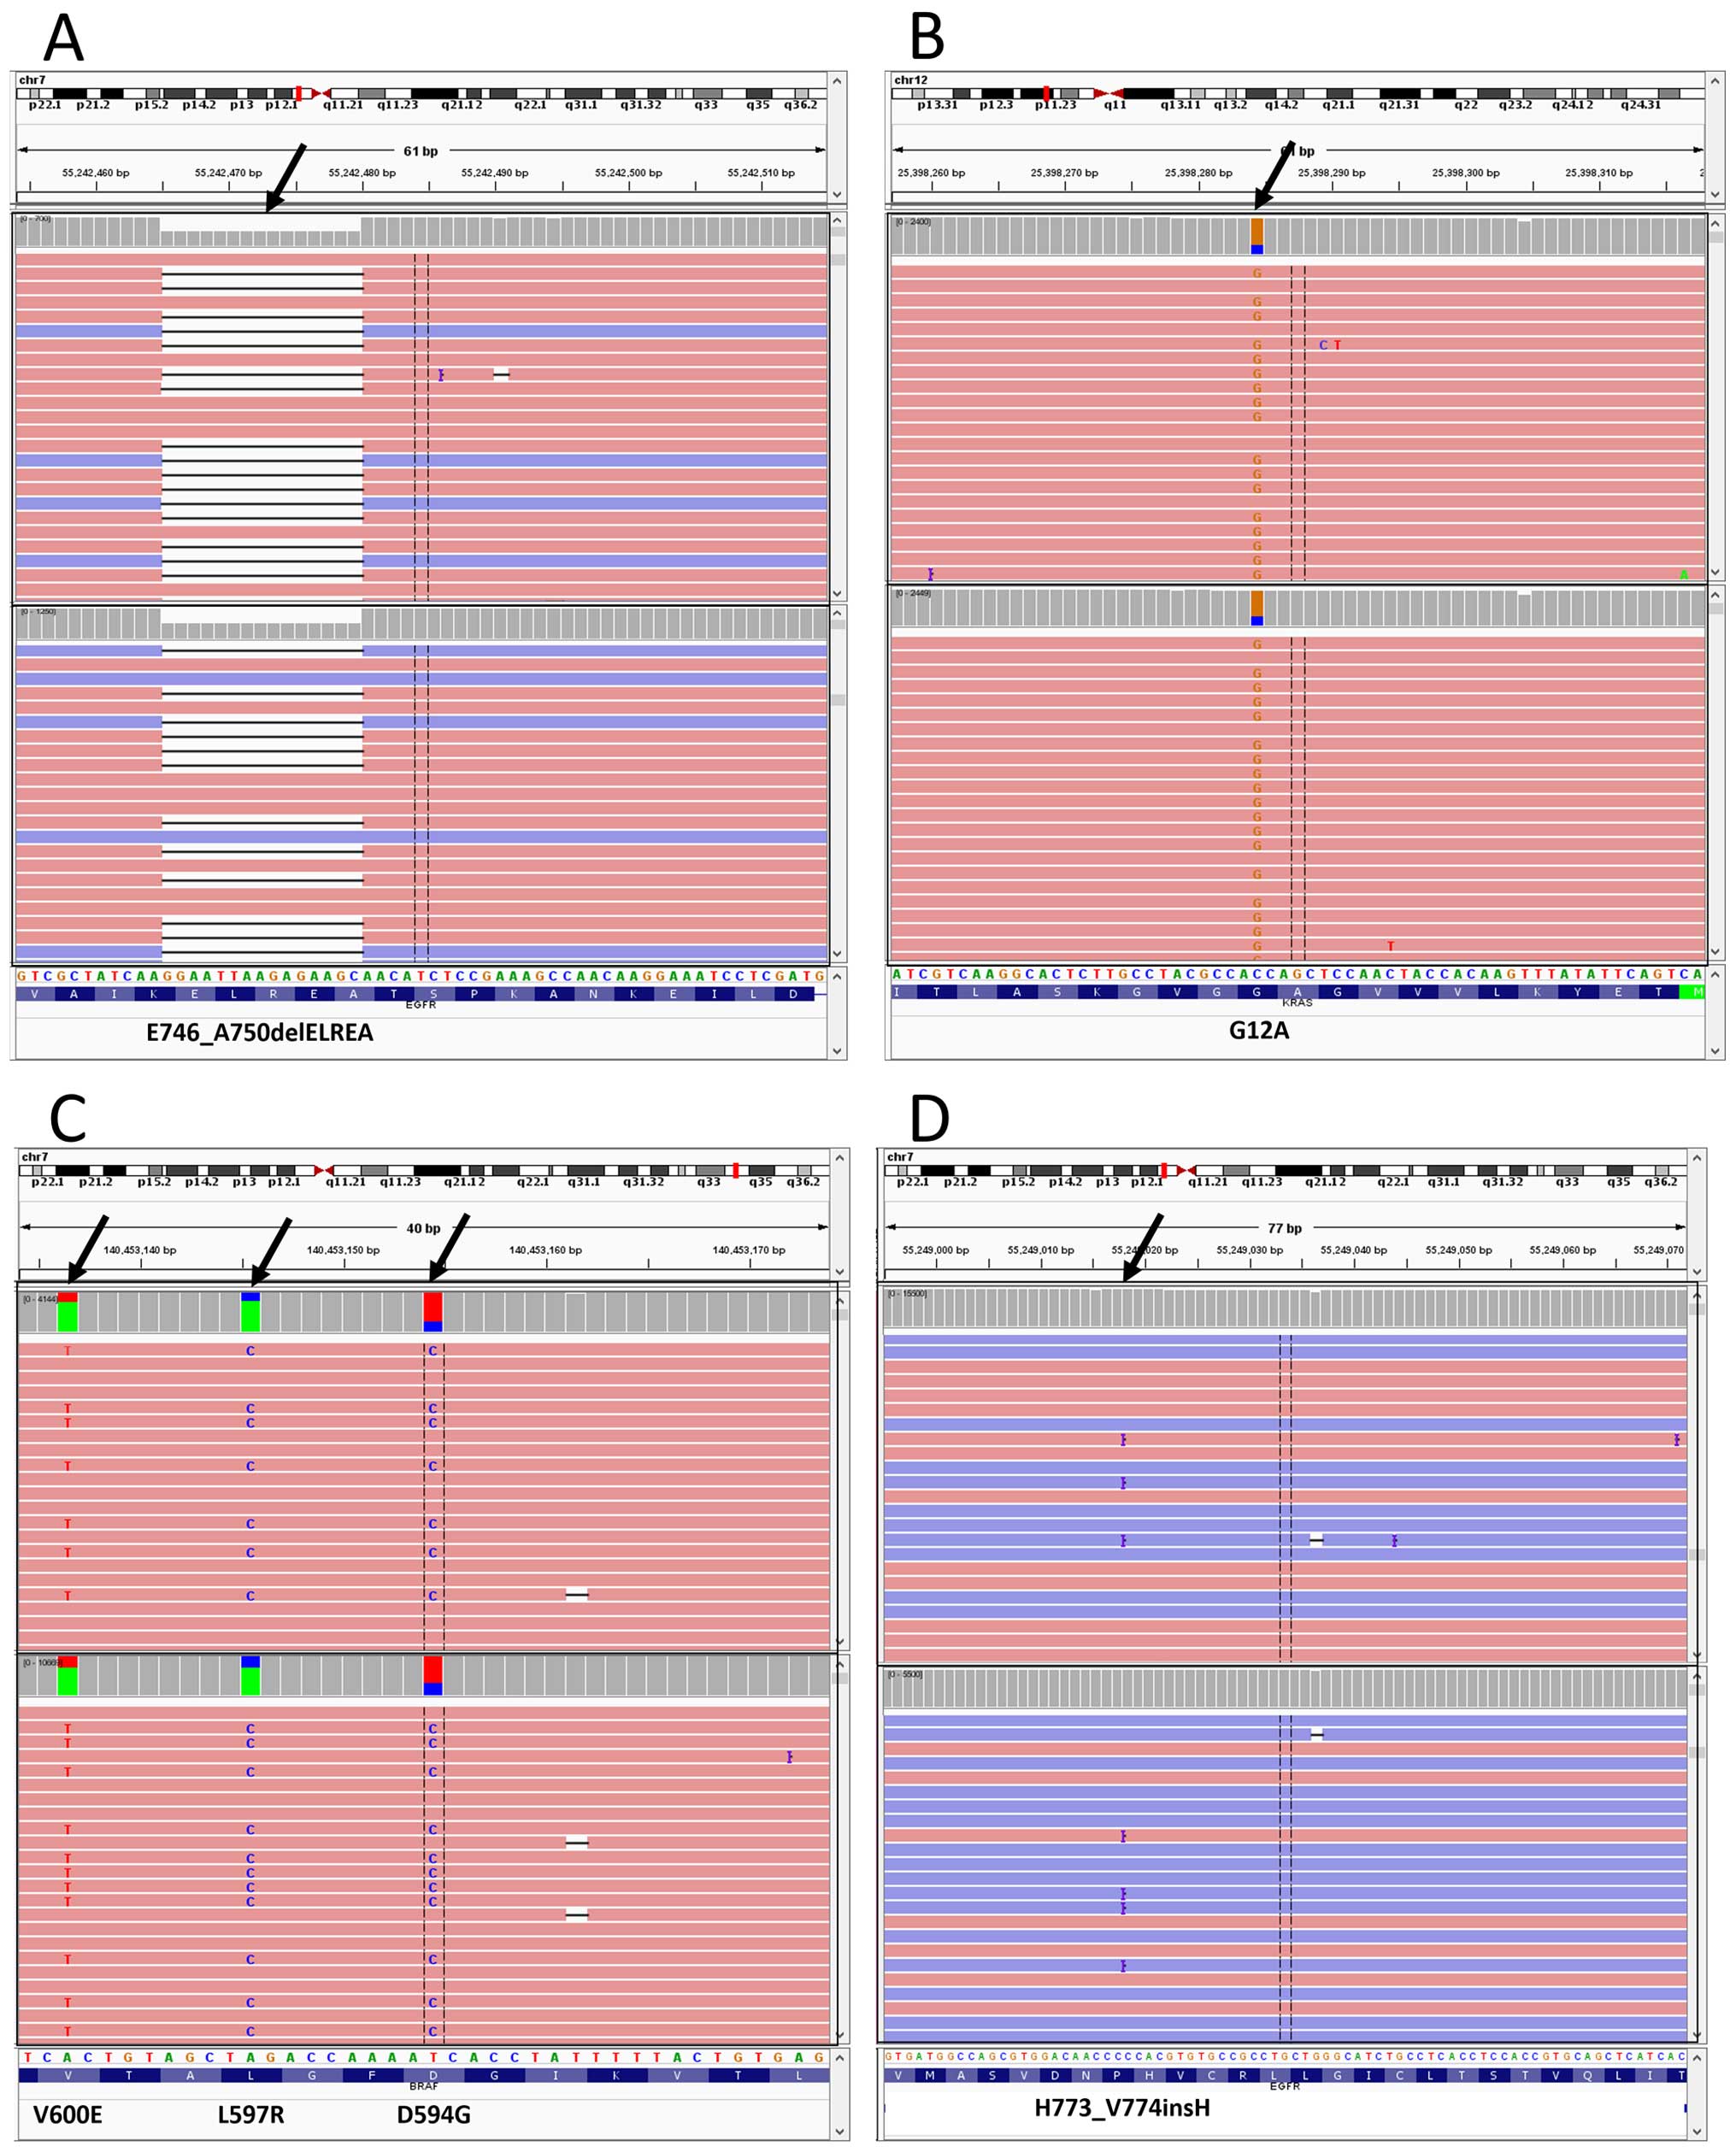
P<0.0001) (Fig. 1). Examples of
detected mutations in the two laboratories are shown in Fig. 2.
The laboratory-to-laboratory accuracy test showed a
sensitivity of 100% (95% CI, 92.45–100%), specificity of 99.97%
(95% CI, 99.85–100%), positive predictive value of 97.9% (95% CI,
88.93–99.95%) and a negative predictive value of 100% (95% CI,
99.90–100%).
Intra-laboratory precision test
The quality parameters of the intra-laboratory
precision test showed high reproducibility (Table I). Regarding the mutational data,
DanPA software detected the same mutation in all five samples
across the five independent experiments, showing 100% qualitative
reproducibility. Quantitatively, the intra-laboratory
reproducibility was very high, as the coefficient of variation of
the mutation allele frequency for each mutation across the five
independent experiments was always <5% (Table II), regardless of whether the
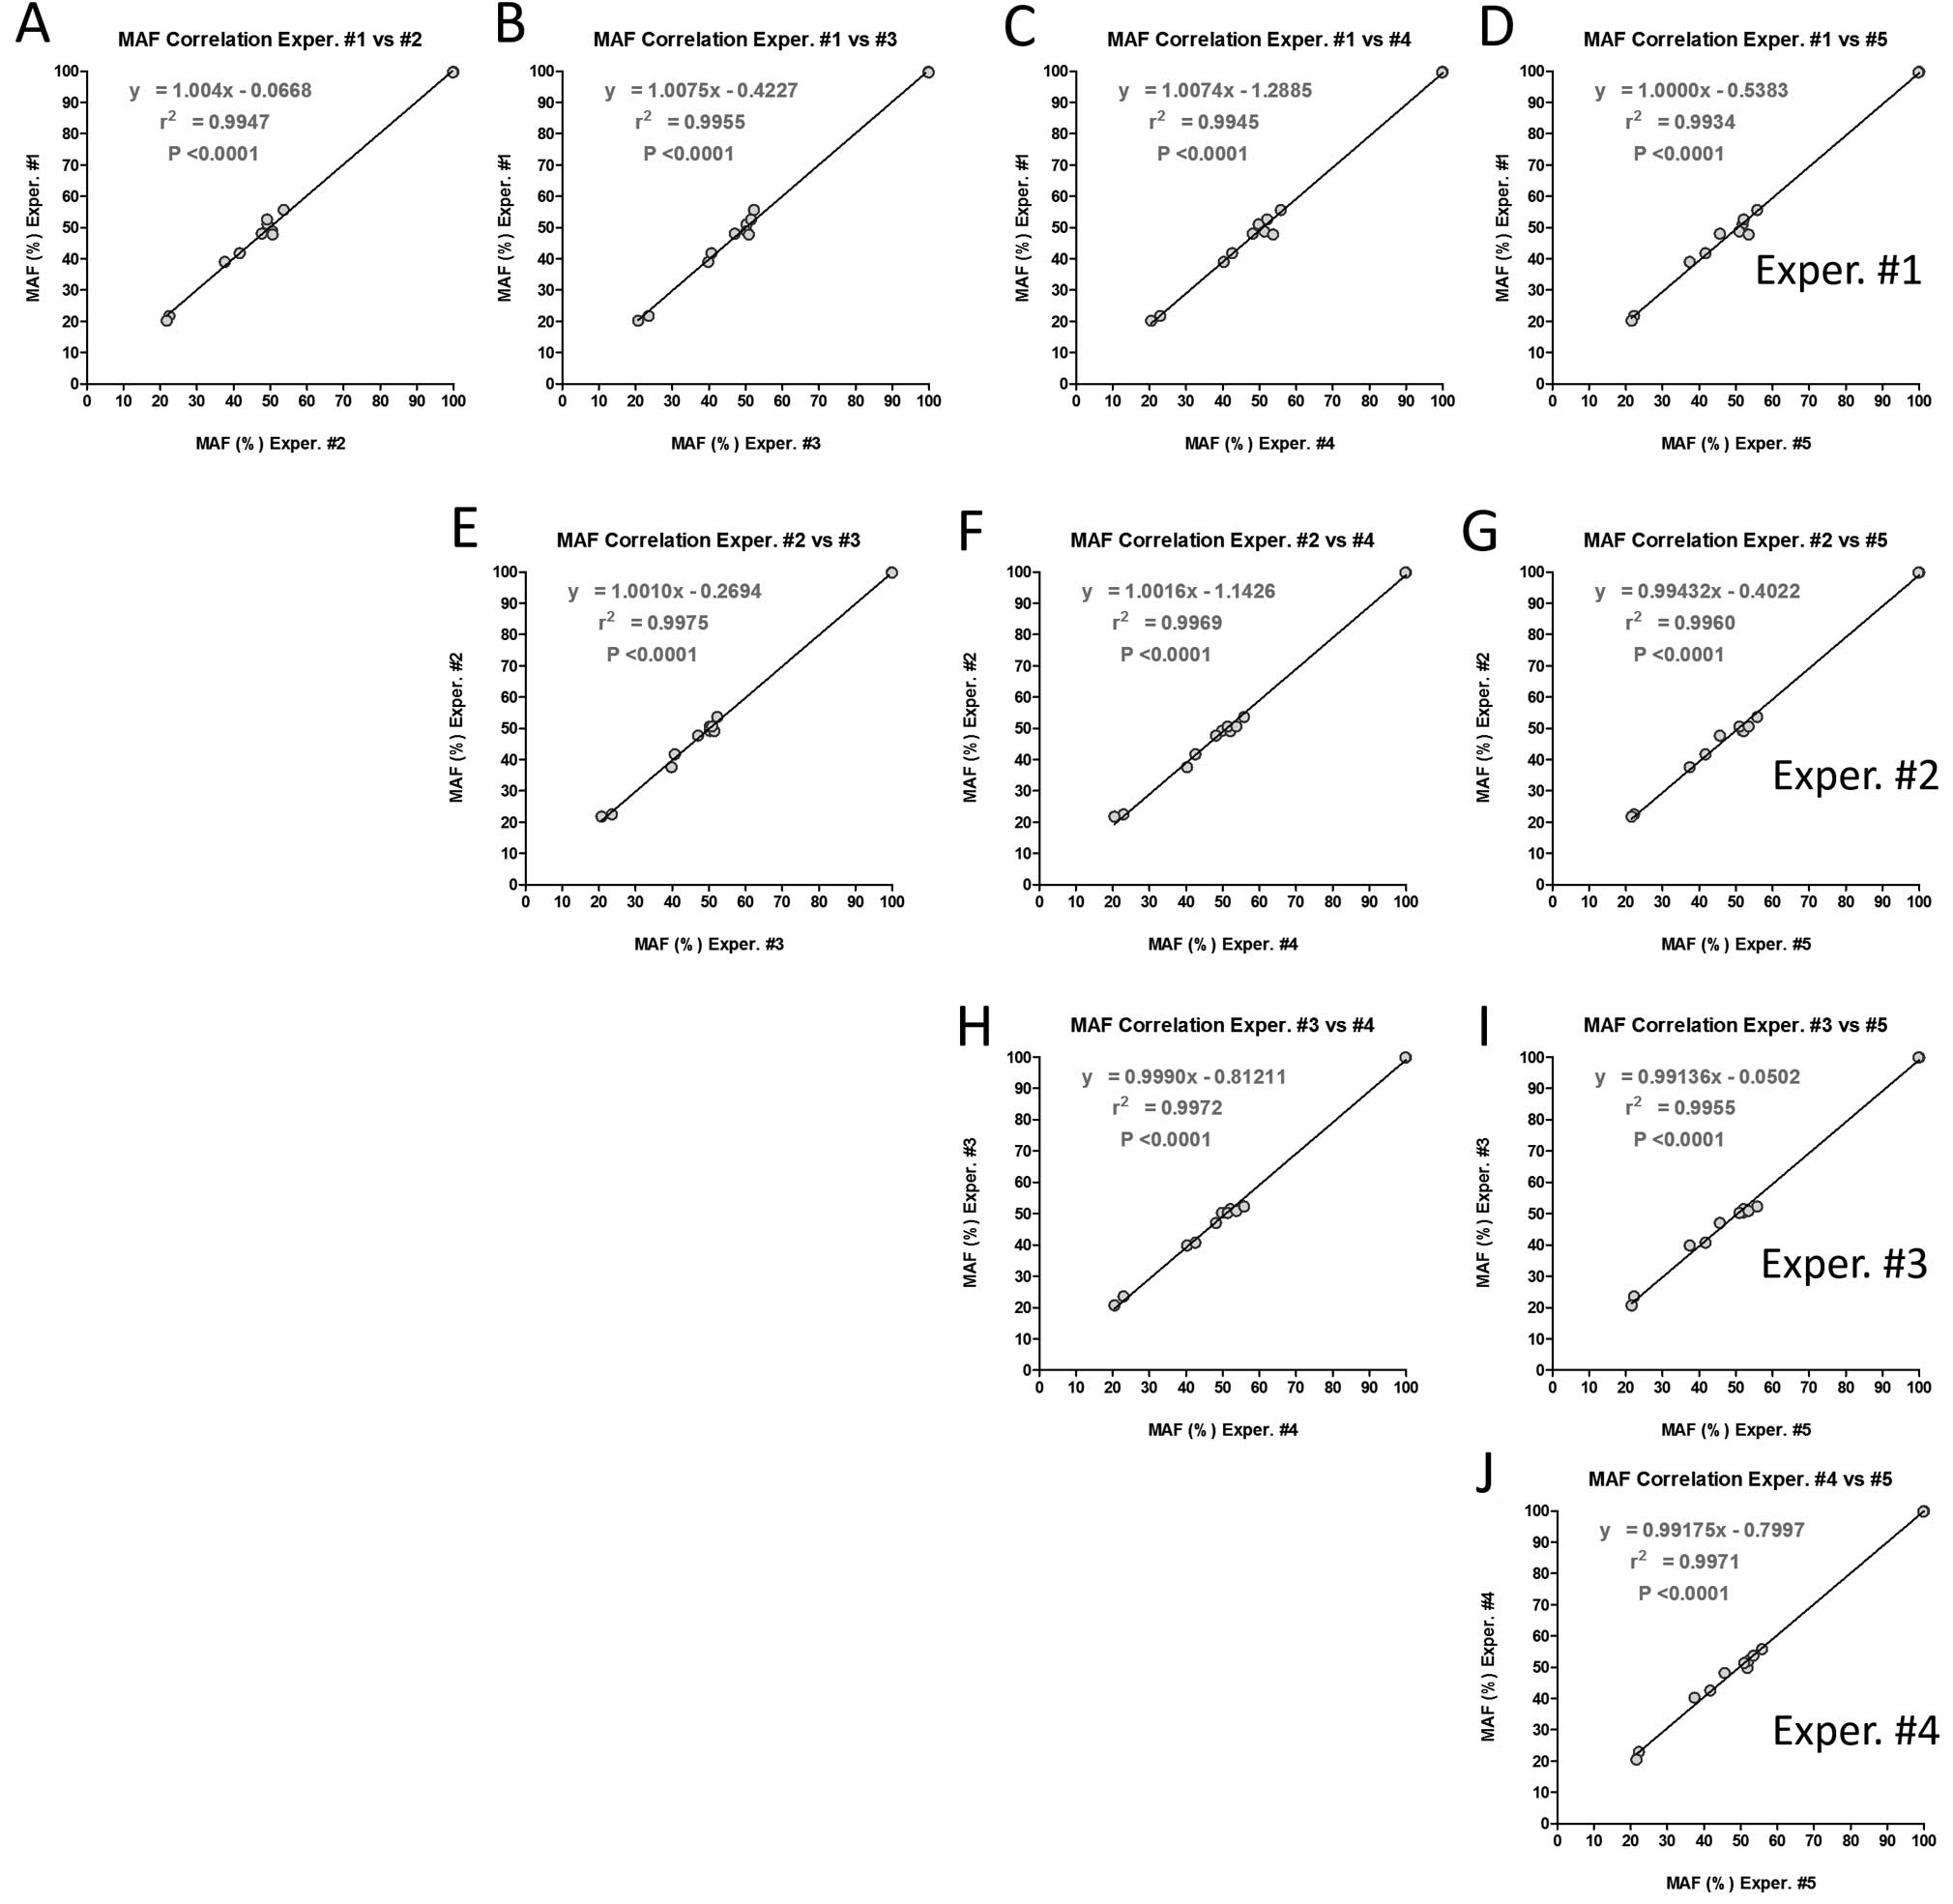
variant was silent or non-synonymous. The regression analysis of
mutation allele frequencies found in the five different experiments
were highly correlated (Fig.
3).
 | Table IReproducibility of quality parameters
of the five sequencing runs from the intra-laboratory precision
test. |
Table I
Reproducibility of quality parameters
of the five sequencing runs from the intra-laboratory precision
test.
| Run name | % ≥Q20 bases | (%) Seq reads aligned
to hg19 | Mean read length
(bp) | Median Seq. coverage
(No. reads) |
|---|
|
|---|
| Median (%) | Min (%) | Max (%) |
|---|
| Run #1 | 92.1 | 91.7 | 92.4 | 98% | 153 | 7,160x |
| Run #2 | 91.9 | 91.5 | 92.2 | 98% | 159 | 6,896x |
| Run #3 | 90.7 | 90.1 | 91.1 | 97% | 148 | 6,752x |
| Run #4 | 92.9 | 92.5 | 93.1 | 97% | 150 | 7,830x |
| Run #5 | 92.0 | 91.5 | 92.3 | 98% | 156 | 7,519x |
| Table IIQuantitative and qualitative
reproducibility of mutation calls from the intra-laboratory
precision test. |
Table II
Quantitative and qualitative
reproducibility of mutation calls from the intra-laboratory
precision test.
| Sample ID | Mutation ID | Mut. Allele Freq.
Exper. #1 | Mut. Allele Freq.
Exper. #2 | Mut. Allele Freq.
Exper. #3 | Mut. Allele Freq.
Exper. #4 | Mut. Allele Freq.
Exper. #5 | Mut. Allele Freq.
AVR | Mut. Allele Freq.
SD | Mut. Allele Freq.
CV (%) |
|---|
| 3 | EGFR p.Q787Q | 51.09 | 49.22 | 50.25 | 49.80 | 51.84 | 50.44 | 1.04 | 2.06 |
| HRAS p.H27H | 52.61 | 49.12 | 51.45 | 52.06 | 52.11 | 51.47 | 1.38 | 2.67 |
| 9 | EGFR
p.E746_A750delELREA | 48.04 | 47.69 | 47.03 | 48.16 | 45.65 | 47.31 | 1.03 | 2.17 |
| HRAS p.H27H | 48.74 | 50.58 | 50.19 | 51.33 | 50.94 | 50.35 | 1.00 | 1.98 |
| 14 | EGFR p.Q787Q | 99.80 | 99.88 | 99.84 | 99.95 | 99.97 | 99.89 | 0.07 | 0.07 |
| KRAS p.G12V | 39.00 | 37.60 | 39.81 | 40.27 | 37.42 | 38.82 | 1.28 | 3.30 |
| 19 | EGFR p.Q787Q | 99.63 | 99.81 | 99.88 | 99.81 | 99.81 | 99.79 | 0.09 | 0.09 |
| HRAS p.H27H | 41.81 | 41.69 | 40.68 | 42.56 | 41.71 | 41.69 | 0.67 | 1.60 |
| KRAS p.G12V | 21.74 | 22.48 | 23.53 | 22.93 | 22.25 | 22.59 | 0.68 | 3.00 |
| 29 | EGFR p.Q787Q | 47.80 | 50.65 | 50.86 | 53.72 | 53.48 | 51.30 | 2.42 | 4.72 |
| HRAS p.H27H | 55.64 | 53.66 | 52.28 | 55.81 | 55.79 | 54.64 | 1.60 | 2.93 |
| PIK3CA
p.H1047R | 20.20 | 21.80 | 20.70 | 20.47 | 21.60 | 20.96 | 0.71 | 3.37 |
Limit of detection validation
The LOD experiment was run in the Laboratory B. All
the different serial dilutions of the KRAS mutant sample in
KRAS WT DNA were run in the same experiment. The quality of
the sequencing data was comparable to that from the
laboratory-to-laboratory and intra-laboratory validations. The
percentage of sequenced bases with ≥Q20 value ranged from 89.14 to
90.58%. More than 97% of the sequencing reads were successfully
aligned against the reference human genome. The median sequencing
coverage in targeted regions was of 6,350X reads.
The KRAS G12A mutation assayed for LOD was
successfully detected at 71.1, 60.8, 41.2, 27.6, 13.3, 6.5, 4.1 and
2.0% mutation allele frequencies, but not in the WT DNA sample, at
which the findings ensure the reliability of the data (Table III).
| Table IIIResults of the limit of detection
(LOD) validation. |
Table III
Results of the limit of detection
(LOD) validation.
| Sequencing barcode
# | Experimental
condition | Gene symbol | Cosmic mutation
ID | CDS variant
coordinates | Protein variant
coordinates | Chr # | Exon | No. of mutation
reads | No. of WT
reads | (%) Mut. Allele
Freq. |
|---|
| 8 | WT | No mutation
detected |
| 16 | Mutated | KRAS | COSM522 | c.35G>C | p.G12A | chr12 | KRAS_Exon_2 | 7896 | 3213 | 71.08 |
| 9 | Condition #1 | KRAS | COSM522 | c.35G>C | p.G12A | chr12 | KRAS_Exon_2 | 2781 | 1794 | 60.79 |
| 10 | Condition #2 | KRAS | COSM522 | c.35G>C | p.G12A | chr12 | KRAS_Exon_2 | 1318 | 1862 | 41.45 |
| 11 | Condition #3 | KRAS | COSM522 | c.35G>C | p.G12A | chr12 | KRAS_Exon_2 | 1265 | 3319 | 27.60 |
| 12 | Condition #4 | KRAS | COSM522 | c.35G>C | p.G12A | chr12 | KRAS_Exon_2 | 957 | 6231 | 13.31 |
| 13 | Condition #5 | KRAS | COSM522 | c.35G>C | p.G12A | chr12 | KRAS_Exon_2 | 213 | 3062 | 6.50 |
| 14 | Condition #6 | KRAS | COSM522 | c.35G>C | p.G12A | chr12 | KRAS_Exon_2 | 219 | 5129 | 4.09 |
| 15 | Condition #7 | KRAS | COSM522 | c.35G>C | p.G12A | chr12 | KRAS_Exon_2 | 87 | 4260 | 2.00 |
Discussion
Our comparison study of a targeted NGS panel shows
data quality and accuracy is very high and satisfactory within and
between two clinical laboratories. In the present study, we first
conducted a laboratory-to-laboratory accuracy test experiment
because reproducibility of a mutation or a variant calling is the
basic but the most important factor to be considered for molecular
genetic testing in a clinical laboratory. We found that Laboratory
B detected 182 synonymous or non-synonymous mutations in a total of
51 samples and that Laboratory A detected 181. One variant calling
was not concordant. Our check of the raw sequencing data using a
data analysis program and an Integrative Genomics Viewer (IGV;
https://www.broadinstitute.org/igv/)
showed there was no single mutant read in the data from Laboratory
A. The discordant mutation has a low frequency of the mutant
allele: 2.4%. This suggests challenging samples with a low minor
allele frequency (MAF) must be interpreted carefully. We also did a
coverage comparison between two laboratories' results. Although
correct mutation detection would be the most important factor for
doing NGS analysis, we questioned the consistency of the percentage
of mutant alleles in both laboratories. Regression analysis showed
a very high correlation of MAF from all the common mutations found
in both laboratories (n=110; slope=0.997; R2=0.9814;
P<0.0001). The accuracy test result indicates that mutation
calling is stable and reliable in two laboratories.
The results of the second test, an intra-laboratory
precision test in which we analyzed the outcome of two technicians
performing five independent experiments in one laboratory, showed
that even in the same clinical laboratory, variations among
technicians and reagents or kits could be significant. Thus,
intra-laboratory precision validation is important for checking
variations caused by batch-to-batch or person-to-person effects. In
our experiment, all the variants were detected correctly in five
tests (100% reproducibility). The coefficient of variation of the
mutation allele frequency across the five independent experiments
was <5%.
Our third experiment, a limit of detection (LOD)
test, examined the stability of mutation calling in different
proportion of tumor part or mutant alleles. We serially diluted a
KRAS G12A mutant sample with the KRAS wild-type DNA
from ~70% to finally 2% mutation allele frequency. We set the
cut-off level for mutation detection at 2% because we believe a
mutation candidate with a mutation allele frequency less than 2%
has questionable clinical relevance and technical reliability. We
limited our scope to regular FFPE tumor or biopsy specimens and
aimed to provide coverage of a few hundreds to thousands of reads
for selected genes or amplicons. Thus, we believe our cut-off
level, 2% in mutation allele frequency, is the minimal and
reasonable level for mutation detection. We also selected
KRAS mutant for the LOD test sample because KRAS is
one of the most frequently mutated genes in various human cancers.
In the present study, KRAS G12A mutation was detected in all
diluted samples, from 70 through 2%. These findings suggest that
most of the FFPE cancer samples with a tumor proportion of at least
10–20% would be suitable for targeted NGS analysis, although
screening is always encouraged for samples with a tumor proportion
>20%.
Although we believe the consistent results across
all three tests are enough to evaluate a targeted NGS cancer panel
for most of the clinical samples analyzed in clinical laboratories,
several issues remain. First, we tested only FFPE samples and set
the cut-off level as 2% of mutation allele frequency. Liquid biopsy
or circulating tumor DNA (ctDNA) is becoming popular for early
detection of cancer (27) or
monitoring tumor recurrence (28).
For liquid biopsy specimens, the sequencing coverage should be much
higher and the cut-off level should be much lower than for regular
tumor specimens. It is therefore important to systemically analyze
liquid biopsy specimens in clinical laboratories. Second, we tested
tumor specimens with a tumor proportion >20% except for the
serial dilution experiment of the LOD test. Many samples from
clinics have a tumor proportion <10–20% and tend to be rejected
by clinical laboratories or analyzed without thorough
consideration. It will be important to have a consensus not only
for the clinical meaning but also technical reliability for such
samples. Third, tumor heterogeneity or tumor clonal evolution
should also be considered when NGS results are interpreted. If
multiple different tumor sites from one slide are analyzed
separately or a low mutation allele frequency is considered with a
very deep sequencing (i.e. more than 10,000X), this issue should be
discussed for its clinical meaning before providing a result to
cancer patients. Last, more technical aspects beyond NGS should
also be thoroughly checked in a clinical laboratory such as DNA
extraction methods, storage time or condition of FFPE blocks or
slides.
In conclusion, we believe that this present study,
done in compliance with the guidelines of American College of
Medical Genetics, demonstrates the feasibility of clinical
implementation of a targeted NGS cancer panel analysis for
personalized medicine.
Acknowledgements
The present study was supported by funds from the
CureSeq Inc., and the Thoracic Oncology Laboratory at University of
California San Francisco (UCSF). DJM and IJK are equity holders and
consultants of CureSeq Inc. We thank Pamela Derish in the UCSF
Department of Surgery for editorial assistance with the
manuscript.
References
|
1
|
Cancer Genome Atlas Research Network.
Comprehensive molecular profiling of lung adenocarcinoma. Nature.
511:543–550. 2014. View Article : Google Scholar : PubMed/NCBI
|
|
2
|
George J, Lim JS, Jang SJ, Cun Y, Ozretić
L, Kong G, Leenders F, Lu X, Fernández-Cuesta L, Bosco G, et al:
Comprehensive genomic profiles of small cell lung cancer. Nature.
524:47–53. 2015. View Article : Google Scholar : PubMed/NCBI
|
|
3
|
Govindan R, Ding L, Griffith M,
Subramanian J, Dees ND, Kanchi KL, Maher CA, Fulton R, Fulton L,
Wallis J, et al: Genomic landscape of non-small cell lung cancer in
smokers and never-smokers. Cell. 150:1121–1134. 2012. View Article : Google Scholar : PubMed/NCBI
|
|
4
|
Hammerman PS, Lawrence MS, Voet D, Jing R,
Cibulskis K, Sivachenko A, Stojanov P, McKenna A, Lander ES,
Gabriel S, et al; Cancer Genome Atlas Research Network.
Comprehensive genomic characterization of squamous cell lung
cancers. Nature. 489:519–525. 2012. View Article : Google Scholar
|
|
5
|
Network TCGA; Cancer Genome Atlas Network.
Comprehensive molecular characterization of human colon and rectal
cancer. Nature. 487:330–337. 2012. View Article : Google Scholar : PubMed/NCBI
|
|
6
|
Cancer Genome Atlas Network. Comprehensive
molecular portraits of human breast tumours. Nature. 490:61–70.
2012. View Article : Google Scholar : PubMed/NCBI
|
|
7
|
Abstract G and Brief I; Cancer Genome
Atlas Research Network. The Molecular Taxonomy of Primary Prostate
Cancer. Cell. 163:1011–1025. 2015. View Article : Google Scholar
|
|
8
|
Cancer Genome Atlas Research Network.
Comprehensive molecular characterization of urothelial bladder
carcinoma. Nature. 507:315–322. 2014. View Article : Google Scholar : PubMed/NCBI
|
|
9
|
Hodis E, Watson IR, Kryukov GV, Arold ST,
Imielinski M, Theurillat JP, Nickerson E, Auclair D, Li L, Place C,
et al: A landscape of driver mutations in melanoma. Cell.
150:251–263. 2012. View Article : Google Scholar : PubMed/NCBI
|
|
10
|
Bass AJ, Thorsson V, Shmulevich I,
Reynolds SM, Miller M, Bernard B, Hinoue T, Laird PW, Curtis C,
Shen H, Weisenberger DJ, et al; Cancer Genome Atlas Research
Network. Comprehensive molecular characterization of gastric
adenocarcinoma. Nature. 513:202–209. 2014. View Article : Google Scholar :
|
|
11
|
Andersson AK, Ma J, Wang J, Chen X, Gedman
AL, Dang J, Nakitandwe J, Holmfeldt L, Parker M, Easton J, et al;
St. Jude Children's Research Hospital-Washington University
Pediatric Cancer Genome Project. The landscape of somatic mutations
in infant MLL-rearranged acute lymphoblastic leukemias. Nat Genet.
47:330–337. 2015. View
Article : Google Scholar : PubMed/NCBI
|
|
12
|
Brennan CWW, Verhaak RGWGW, McKenna A,
Campos B, Noushmehr H, Salama SR, Zheng S, Chakravarty D, Sanborn
JZ, Berman SH, et al: The somatic genomic landscape of
glioblastoma. Cell. 155:462–477. 2013. View Article : Google Scholar : PubMed/NCBI
|
|
13
|
Cancer Genome Atlas Research Network.
Genomic and epigenomic landscapes of adult de novo acute myeloid
leukemia. N Engl J Med. 368:2059–2074. 2013. View Article : Google Scholar : PubMed/NCBI
|
|
14
|
Cancer T and Atlas G; Cancer Genome Atlas
Research Network. Integrated genomic analyses of ovarian carcinoma.
Nature. 474:609–615. 2011. View Article : Google Scholar
|
|
15
|
Chan-On W, Nairismägi M-L, Ong CK, Lim WK,
Dima S, Pairojkul C, Lim KH, McPherson JR, Cutcutache I, Heng HL,
et al: Exome sequencing identifies distinct mutational patterns in
liver fluke-related and non-infection-related bile duct cancers.
Nat Genet. 45:1474–1478. 2013. View
Article : Google Scholar : PubMed/NCBI
|
|
16
|
Chen K, Yang D, Li X, Sun B, Song F, Cao
W, Brat DJ, Gao Z, Li H, Liang H, et al: Mutational landscape of
gastric adenocarcinoma in Chinese: Implications for prognosis and
therapy. Proc Natl Acad Sci USA. 112:1107–1112. 2015. View Article : Google Scholar : PubMed/NCBI
|
|
17
|
Johnson BE, Mazor T, Hong C, Barnes M,
Aihara K, McLean CY, Fouse SD, Yamamoto S, Ueda H, Tatsuno K, et
al: Mutational analysis reveals the origin and therapy-driven
evolution of recurrent glioma. Science. 343:189–193. 2014.
View Article : Google Scholar :
|
|
18
|
Jones DTW, Jäger N, Kool M, Zichner T,
Hutter B, Sultan M, Cho YJ, Pugh TJ, Hovestadt V, Stütz AM, et al:
Dissecting the genomic complexity underlying medulloblastoma.
Nature. 488:100–105. 2012. View Article : Google Scholar : PubMed/NCBI
|
|
19
|
Lawrence MS, Sougnez C, Lichtenstein L,
Cibulskis K, Lander E, Gabriel SB, Getz G, Ally A, Balasundaram M,
Birol I, et al; Cancer Genome Atlas Network. Comprehensive genomic
characterization of head and neck squamous cell carcinomas. Nature.
517:576–582. 2015. View Article : Google Scholar
|
|
20
|
Li M, Zhang Z, Li X, Ye J, Wu X, Tan Z,
Liu C, Shen B, Wang XA, Wu W, et al: Whole-exome and targeted gene
sequencing of gallbladder carcinoma identifies recurrent mutations
in the ErbB pathway. Nat Genet. 46:872–876. 2014. View Article : Google Scholar : PubMed/NCBI
|
|
21
|
Lin DC, Hao JJ, Nagata Y, Xu L, Shang L,
Meng X, Sato Y, Okuno Y, Varela AM, Ding LW, et al: Genomic and
molecular characterization of esophageal squamous cell carcinoma.
Nat Genet. 46:467–473. 2014. View
Article : Google Scholar : PubMed/NCBI
|
|
22
|
Lohr JG, Stojanov P, Carter SL,
Cruz-Gordillo P, Lawrence MS, Auclair D, Sougnez C, Knoechel B,
Gould J, Saksena G, et al; Multiple Myeloma Research Consortium.
Widespread genetic heterogeneity in multiple myeloma: Implications
for targeted therapy. Cancer Cell. 25:91–101. 2014. View Article : Google Scholar : PubMed/NCBI
|
|
23
|
Creighton CJ, Morgan M, Gunaratne PH,
Wheeler DA, Gibbs RA, Gordon Robertson A, Chu A, Beroukhim R,
Cibulskis K, Signoretti S, et al; Cancer Genome Atlas Research
Network. Comprehensive molecular characterization of clear cell
renal cell carcinoma. Nature. 499:43–49. 2013. View Article : Google Scholar
|
|
24
|
Tirode F, Surdez D, Ma X, Parker M, Le
Deley MC, Bahrami A, Zhang Z, Lapouble E, Grossetête-Lalami S,
Rusch M, et al; St. Jude Children's Research Hospital-Washington
University Pediatric Cancer Genome Project and the International
Cancer Genome Consortium. Genomic landscape of Ewing sarcoma
defines an aggressive subtype with co-association of STAG2 and TP53
mutations. Cancer Discov. 4:1342–1353. 2014. View Article : Google Scholar : PubMed/NCBI
|
|
25
|
Carrick DM, Mehaffey MG, Sachs MC,
Altekruse S, Camalier C, Chuaqui R, Cozen W, Das B, Hernandez BY,
Lih CJ, et al: Robustness of next generation sequencing on older
formalin-fixed paraffin-embedded tissue. PLoS One. 10:e01273532015.
View Article : Google Scholar : PubMed/NCBI
|
|
26
|
Fujita S, Masago K, Takeshita J, Okuda C,
Otsuka K, Hata A, Kaji R, Katakami N and Hirata Y: Validation of an
ion torrent sequencing platform for the detection of gene mutations
in biopsy specimens from patients with non-small-cell lung cancer.
PLoS One. 10:e01302192015. View Article : Google Scholar : PubMed/NCBI
|
|
27
|
Newman AM, Bratman SV, To J, Wynne JF,
Eclov NC, Modlin LA, Liu CL, Neal JW, Wakelee HA, Merritt RE, et
al: An ultrasensitive method for quantitating circulating tumor DNA
with broad patient coverage. Nat Med. 20:548–554. 2014. View Article : Google Scholar : PubMed/NCBI
|
|
28
|
Dawson SJ, Tsui DWY, Murtaza M, Biggs H,
Rueda OM, Chin SF, Dunning MJ, Gale D, Forshew T, Mahler-Araujo B,
et al: Analysis of circulating tumor DNA to monitor metastatic
breast cancer. N Engl J Med. 368:1199–1209. 2013. View Article : Google Scholar : PubMed/NCBI
|