Introduction
Animal models have traditionally offered an
important platform for determining tumor characteristics and
testing drug efficacy and dynamics in a complete physiological
environment. However, the differences between mice and humans
(1), together with animal models
being expensive, difficult and ethically not sustainable for large
drug screens have fostered the use of in vitro culture
systems for pre-animal testing. While 2D monolayers have been the
cornerstone of preclinical cancer research, there is increasing
evidence that cells grown in 2D monolayers do not accurately
reflect the biological complexity of tumors. Indeed, most if not
all drugs that pass preclinical in vitro testing fail in the
patients since 2D cultures lack, in large part, the complex
stroma-cancer interactions (cell:cell and cell:matrix
interactions), tissue architectures (1), and intratumoral gradients in pH,
nutrition and oxygenation found in cancers in vivo (2).
This is of particular importance for cancers, such
as the pancreatic ductal adenocarcinoma (PDAC), whose tumor
microenvironment has a dominant role in carcinogenesis, metastatic
spread and therapeutic resistance (3). Indeed, among all cancer types PDAC,
due to the strong interplay between tumor cells and stromal
components, exhibits the most dense desmoplastic stroma which can
account for up to 90% of the total tumor volume (4). These complex stroma-cancer
interactions in PDAC result in and contribute to the inherently
aggressive disease biology and a pronounced resistance to
conventional therapeutic regimens. This makes PDAC one of the few
human malignancies with a median survival time of <6 months, a
5-year survival rate of 5–7% (5,6) and
a projection to become the second leading cause of cancer-related
deaths in the next 10–15 years (7). It is, therefore, critical to
establish innovative and more physiologically relevant in
vitro experimental models allowing the study of drug efficacy
and dynamics in the context of the desmoplastic tumor-supportive
PDAC environment.
It is now generally recognized that
three-dimensional (3D) cultures could be a relevant pre-clinical
model with advantages over 2D monolayers as they more accurately
reflect the architecture and bio-mechanical properties of the
tumor. Indeed, cell growth dynamics and response to both growth
factors and therapeutic treatment are quite different assessed in
3D models compared to 2D models (8). As a result, there has been increasing
focus on developing 3D techniques and many different platforms have
been proposed, all with different grades of complexity and
expression of tumor environmental conditions. While the different
organoid model platforms used in PDAC research have been described
in a review (9), there has been no
systematic comparison and validation in a single study of the
differences in such systems for evaluating PDAC cell growth and
response to factors increasing growth or anti-neoplastic agents.
Therefore, it remains unclear which models best recapitulate
different aspects of in vivo tumor biology and response to
therapy.
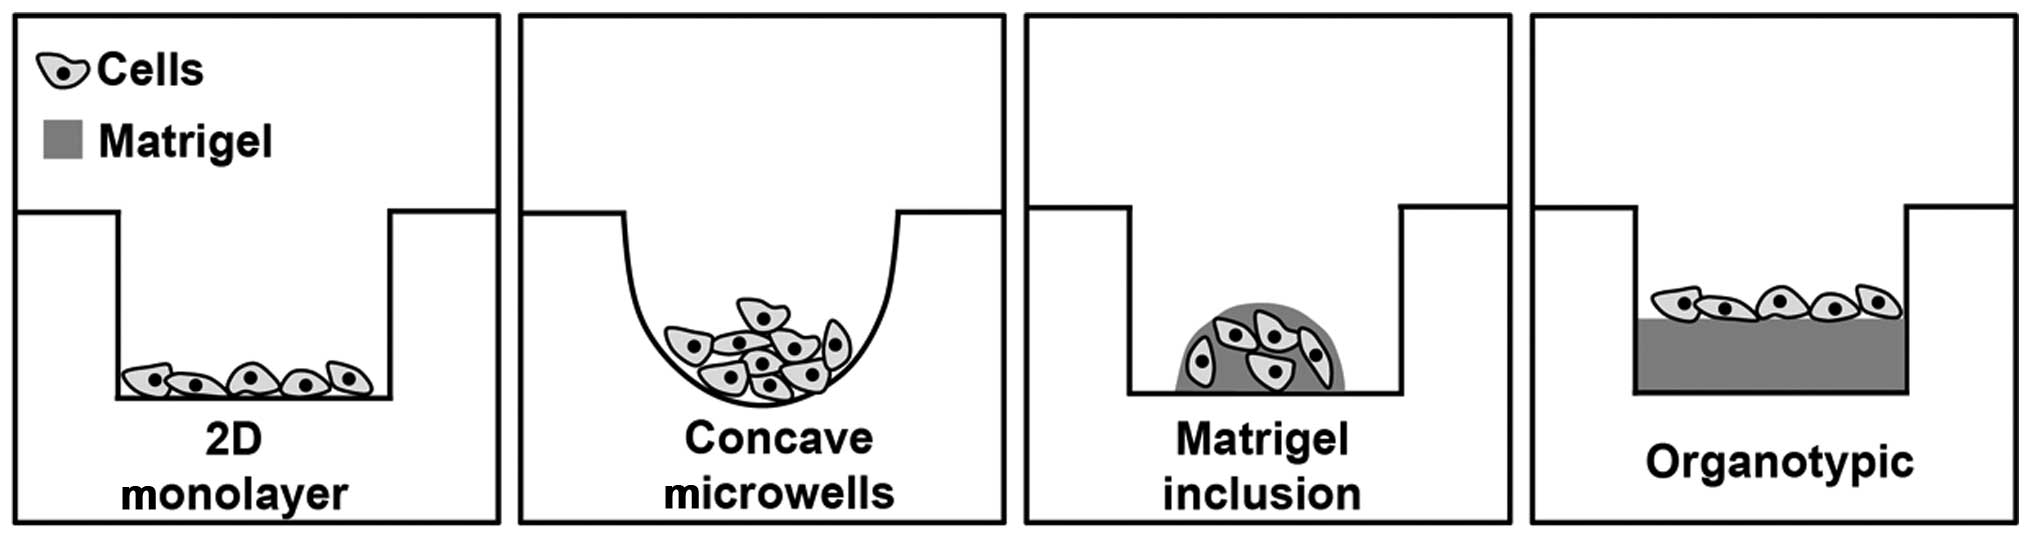
Here, we describe the comparative analyses of 2D
culture and a series of 3D PDAC cancer microtissue models obtained
culturing PDAC cells in ultra-low adhesion, concave microwell
plates, implanting them in reconstituted Matrigel drops, or on
Matrigel in organotypic culture to model disease pathogenesis and
drug pharmacodynamics. We used as a read-out their molecular and
cellular responses when the PDAC-driver epidermal growth factor
receptor (EGFR) is stimulated and/or inhibited, respectively with
EGF and the small tyrosine kinase inhibitor (TKI) of EGFR,
erlotinib. We conclude that the organotypic system most closely
mimicked the complex biological interactions driving progression
and determining drug sensitivity.
Materials and methods
Cell lines and culture platforms
Experiments were performed on the following well
established human pancreatic cancer cell lines as reported
(10): Panc-1, BxPC3, MiaPaCa-2
and CAPAN-2. All cells were kept at 37°C in humidified air
containing 5% CO2. PANC-1 cells were grown in
bicarbonate-buffered Dulbecco's minimal essential medium (DMEM; pH
7.4, stable glutamine, 4.5 g/l glucose). MiaPaCa-2 was grown in
bicarbonate-buffered Dulbecco's minimal essential medium/Ham's F12
(DMEM/F-12; pH 7.4, stable glutamine, 4.5 g/l glucose). BxPC3 and
CAPAN-2 cells were cultured in bicarbonate-buffered RPMI-1640
medium [Gibco 52400-025, pH 7.4, stable glutamine (2 mM)]. Media
were always supplemented with 10% heat-inactivated fetal calf serum
(FCS, PAA Gold) and 1% penicillin and streptomycin. MiaPaCa-2 cells
were further supplemented with 2.5% heat-inactivated horse serum
(Biochrom, Germany).
Antibodies and reagents
Primary antibodies were purchased from: EGFR (Cell
Signaling Technology, rabbit cat no. 4267), p(1173)EGFR (GeneTex,
rabbit monoclonal cat no. GTX1052), HIF1α (BD, rabbit cat no.
610959), β1 integrin (Santa Cruz, mouse cat no. sc-18887) ezrin
(BD, mouse cat no. 610603) p(T567)ezrin (Abcam, rabbit cat no.
ab47293), NHERF1 (BD mouse cat no. 611160), E-cadherin (R&D
Systems, mouse cat no. 180215) and β-actin (Sigma, mouse cat no.
A5441), respectively. Secondary antibodies were anti-mouse (Sigma)
and anti-rabbit (Cell Signaling). Human-recombinant epidermal
growth factor (EGF) (PreproTech, NJ, USA) was dissolved in
H2O and used at a final concentration of 100 ng/ml. The
EGFR inhibitor erlotinib (Selleckchem, Italy) was solubilized in
DMSO.
Spheroid-forming assay
Cells were seeded (2,500 cells/well) in 96-well
ultra-low adhesion round bottom plates (Corning Costar
Sigma-Aldrich, Italy) that will be referred to here as concave
microwells. The well's shape forces all the cells to collect at the
bottom of the well where they adhere to each other, forming loose
or compact spheroids depending on cell type. Here the spheroids are
therefore non-clonal in that each was comprised of all the cells
seeded. The wells of the outer edge of the plate were filled with
culture medium to prevent an uneven evaporation. Pharmacological
treatments were added the next day and maintained for a total of 7
days with a midweek change of medium, including treatments if
present.
Colony formation in 3D Matrigel
inclusion
To analyse the ability of cells to grow in an
anchorage-independent manner in 3D semi-solid media (ECM scaffolds)
(11), we dispersed 10,000 cells
of each cell line into 10 μl drops of Matrigel (BD Bioscience)
mixed with serum-free culture medium to a final concentration of 7
mg/ml. The drop of Matrigel was placed in the middle of the well of
a 24-well plate which was then inverted for the first 30 min of
polymerization, entrapping the cells in the drop and preventing
collection of cells at the bottom. The plate was then turned right
side-up and allowed to polymerize for an additional 30 min in a
37°C incubator and 400 μl culture medium was added and changed
every 3 days. As each cell line had different growth rates the
colonies were grown for 12, 8, 6 and 4 days for CAPAN-2, BxPC3,
PANC-1 and MiaPaCa-2, respectively. Here the many spheroids that
formed are clonal as each grew from a single dispersed cell that
then grew into a colony.
Organotypic 3D culture
Cells were seeded at a density of 15,000 cells/well
of 96-well plates on top of an extracellular matrix gel prepared by
mixing Matrigel (BD Bioscience) with serum-free culture medium, to
a final concentration of 7 mg/ml. One hundred microliters/well was
plated into 96-well plates and incubated for 60 min in a 37°C
incubator allowing the gels to solidify. In-order-to ensure proper
attachment of the cells, treatments where added the next day and
growth was maintained for a total of 7 days, with a midweek change
of medium.
Assessment of growth reduction by
resazurin and integrated density
Cell viability was measured using the resazurin cell
viability assay (Immunological Sciences). The resazurin method is
an easy and fast assay to measure cell viability and is based on
the principles of the MTT assay, but with the superiority of not
having to extract the dye from the cells. Resazurin (10 μl) was
added to each 100 μl of medium according to the manufacturer's
instructions and fluorescence was measured after ~3 h. Relative
cell number was calculated from standard curves of resazurin
fluorescence vs cell number in a Burker chamber and growth or
response to erlotinib measured as the change in cell number over
time.
In the experiments with ultra-low adhesion concave
plates and Matrigel inclusion drops, images of the spheroids from
both culture systems were acquired and analyzed with a 60X oil
objective using a Nikon Eclipse TE 2000S epifluorescence
microscope. The spheroids were analyzed for size, circularity and
integrated density using ImageJ (http://rsb.info.nih.gov/ij/). For integrated density,
images of the cultures were uploaded to the program, colors were
inverted and the images were converted into 8-bit. Threshold was
adjusted to have only the cell mass emerge and integrated density
value was then calculated by multiplying mean grey values by
area.
Western blot analysis
Cells were lysed directly from 2D monolayers and
ultra-low adhesion concave microplates while in Matrigel inclusion
drops and the organotypic culture cells were extracted from the
Matrigel matrix by the use of CellSperse (Cultrex) and lysed in
lysis buffer (HEPES 5 mM, EDTA 0.5 mM, pH 7.2 supplied with
protease inhibitor 2 μl/ml, phenyl-methanesulfonylfluoride (PMSF) 1
mM, sodium orthovanadate 1 mM, dithiothreitol (DTT) 1 mM, Nonidet
0.1%). Proteins were measured with Bradford (Pierce), resuspended
in sodium dodecyl sulfate (SDS) sample buffer [6.25 mM Tris-HCl, pH
6.8, containing 10% (v/v) glycerol, 3 mM SDS, 1% (v/v)
2-mercaptoethanol and 0.75 mM of bromophenol blue], run on 10%
SDS-PAGE and blotted to Immobilon P. The protein expression levels
of EGFR, p(1173)EGFR, HIF-1α, Ezrin/p(T567)Ezrin, β1 integrin,
NHERF1 and E-cadherin were analyzed with their primary antibodies.
Each blot was scanned with an Epson V600 scanner and the relative
optical density of each band was analyzed using ImageJ (http://rsb.info.nih.gov/ij/).
Orthotopic implantation of human
pancreatic tumor cell lines and H&E staining of tissue
specimens
Cells of the PDAC cell lines were implanted
orthotopically in severe combined immunodeficient mice (SCID mice),
strain C.B-17/Ztm-scid of both sexes or nude mice, strain NMRI-Fox1
nu/nu, as described (10). Animal
studies adhere to the Animal Welfare Act in the version published
on 18 May 2006 (Federal Law Gazette I p. 1206, 1313) amended by
article 4 section 90 of the Act of 7 August 2013 (Federal Law
Gazette I p. 3154) which is in full correspondance with European
legislation. Tumor cell implantation was performed in accordance
with the Declaration of Helsinki protocols as described previously
(12). Professor F. Alves and her
team, supported by the veterinarian S. Kimmina, have approval for
ongoing research in oncology including orthotopic pancreatic tumor
models using experimental mice (Tierversuchsantrag: 33.42502/103/06
and 33.9-42502-04-13/1085) from the Niedersachsen animal welfare
committee (the respective local institution: Niedersächsisches
Landesamt für Verbraucherschutz und Lebensmittelsicherheit). For
orthotopic transplantation, general anesthesia was performed by
intraperitoneal application using a ketamine-xylazin mixture
(75–100/15–20 mg/kg b.w.). A median laparotomy was performed, the
peritoneum opened and the pancreas carefully exposed. Aliquots of
1×10⁶ pancreatic tumor cells in a volume of 15 μl PBS
were injected very slowly with an insulin syringe into the duodenal
lobe of the pancreas through the pancreatic serosa into the
pancreatic tissue. The pancreas was then returned to the abdominal
cavity and the incision closed in two layers using Vicryl suture
(Metric 1.5, Ethicon, Norderstedt, Germany). After implantation,
mice were monitored at least five times a week following tumor cell
transplantation by expert personnel through direct observation of
fur signs, tumor development, abdominal distension and weight loss.
Weight loss exceeding 20% of the initial weight that lasts more
than two days was the criteria for experimental termination. For
post-surgical analgesia treatment, mice received analgesic (i.p.;
Rimadyl; active substance: carprofen; doses 5 mg/kg b.w.). Operated
animals were kept on a warming device. Animals were anesthesized by
isoflurane, and finally painlessly euthanized by cervical
dislocation. The pancreatic tumor masses were excised and placed in
phosphate-buffered 4% formalin for 16 h at room temperature and
embedded in paraffin. Tissue sections (2.5 μm) were obtained and
stained with hematoxylin and eosin (H&E) using standard
protocols.
Statistical procedures
Data correspond to at least three independent
experiments, each of which was done in triplicate. Results are
presented as means ± standard error of the mean (SEM). The results
of erlotinib +/− EGF treatment on 3D growth were analyzed according
to published methods (13). The
data for each condition were subject to analysis of variance
(ANOVA) followed by Dunnet post hoc test when comparing three or
more conditions or evaluated using Student's t-test when comparing
only two conditions. Differences were considered significant with
values of P<0.05. The results of treatments with erlotinib on 3D
growth were analyzed in KaleidaGraph-Synergy software (Reading, PA,
USA) using the median effect equation, fa/fu = (D/Dm)m,
in which fa is the fraction affected by dose D, fu is
the fraction unaffected, D is the dose and Dm is the
dose required for 50% growth inhibition and m is the coefficient of
sigmoidicity (13).
Results
Characterization and comparison of tumor
morphology and growth in 2D versus 3D systems and in vivo
Cells grown on 2D tissue culture substrates differ
considerably in their morphology and differentiation and their
cell-cell and cell-matrix interactions from cells in vivo
(2,14,15).
While it is known that both intrinsic 3D architecture and the ECM
exert strong effects on cell morphology, a single study comparing
the effects of different 3D systems on PDAC cell morphology,
growth, molecular signaling and response to therapy has yet to be
done. Here, we first analyzed the impact of 2D and three known 3D
tissue cultures, namely the ultralow adhesion concave microwells,
Matrigel inclusion and the organotypic system, in affecting basal
growth and morphology of a panel of PDAC cell lines (Fig. 1) and the resulting growth patterns
were compared with those obtained by orthotopically implanting the
same cell lines in mice. We utilized BxPC3 cells, which carry p53
mutations, and PANC-1 and MiaPaCa-2, which are poorly
differentiated and carry both KRAS and p53 mutations (16). In addition, CAPAN-2 cells were
included as it is a well-differentiated PDAC cell line (17). The BxPC3 and CAPAN-2 lines have
been classified as less aggressive, classical PDAC cell lines while
PANC-1 and MiaPaCa-2 are very aggressive lines of the
quasi-mesenchymal QM-PDAC type (16).
The morphological growth patterns of the four cell
lines in all four culture systems from less (left) to more (right)
aggressive are shown in Fig. 2A.
When grown in 2D, all four cell lines grew as monolayers but
displayed different morphologies, such that CAPAN-2 and BxPC3 grew
as tight cobblestone monolayers, while both PANC-1 cells and the
very aggressive MiaPaCa-2 cells formed monolayers composed of loose
aggregates with a high percentage of cells having an elongated,
mesenchymal form. Cells grown in 3D spheroid-producing techniques
generated a single multiclonal spheroid with the ultra-low adhesion
concave microwells system and a high number of monoclonal spheroids
with the Matrigel inclusion method, but in both systems colonies
formed with similar shapes and dynamics independently of the
presence of an extracellular matrix. However, spheroid-growth
patterns, measured by integrated density analyses and circularity
indexes were quite different among each cell line and consistent
with their reported malignant potential and subtype gene signatures
(16). The spheroids from the less
aggressive, classical PDAC cell lines (CAPAN-2 and BxPC3) increased
their size slower (Fig. 2A) and
had a more spherical shape (Fig.
2B; circularity index of 0.93±0.04 and 0.96±0.02,
respectively). In contrast, spheroids from the more aggressive,
PANC-1 and MiaPaCa-2 cells grew larger in less time (Fig. 2A) and had a more irregular
morphology (Fig. 2B, basal
circularity index of 0.87±0.06 and 0.83±0.05, respectively).
Interestingly, the circularity index of each cell line was not
significantly different between spheroids developed in the concave
microwell and Matrigel inclusion systems (Fig. 2B).
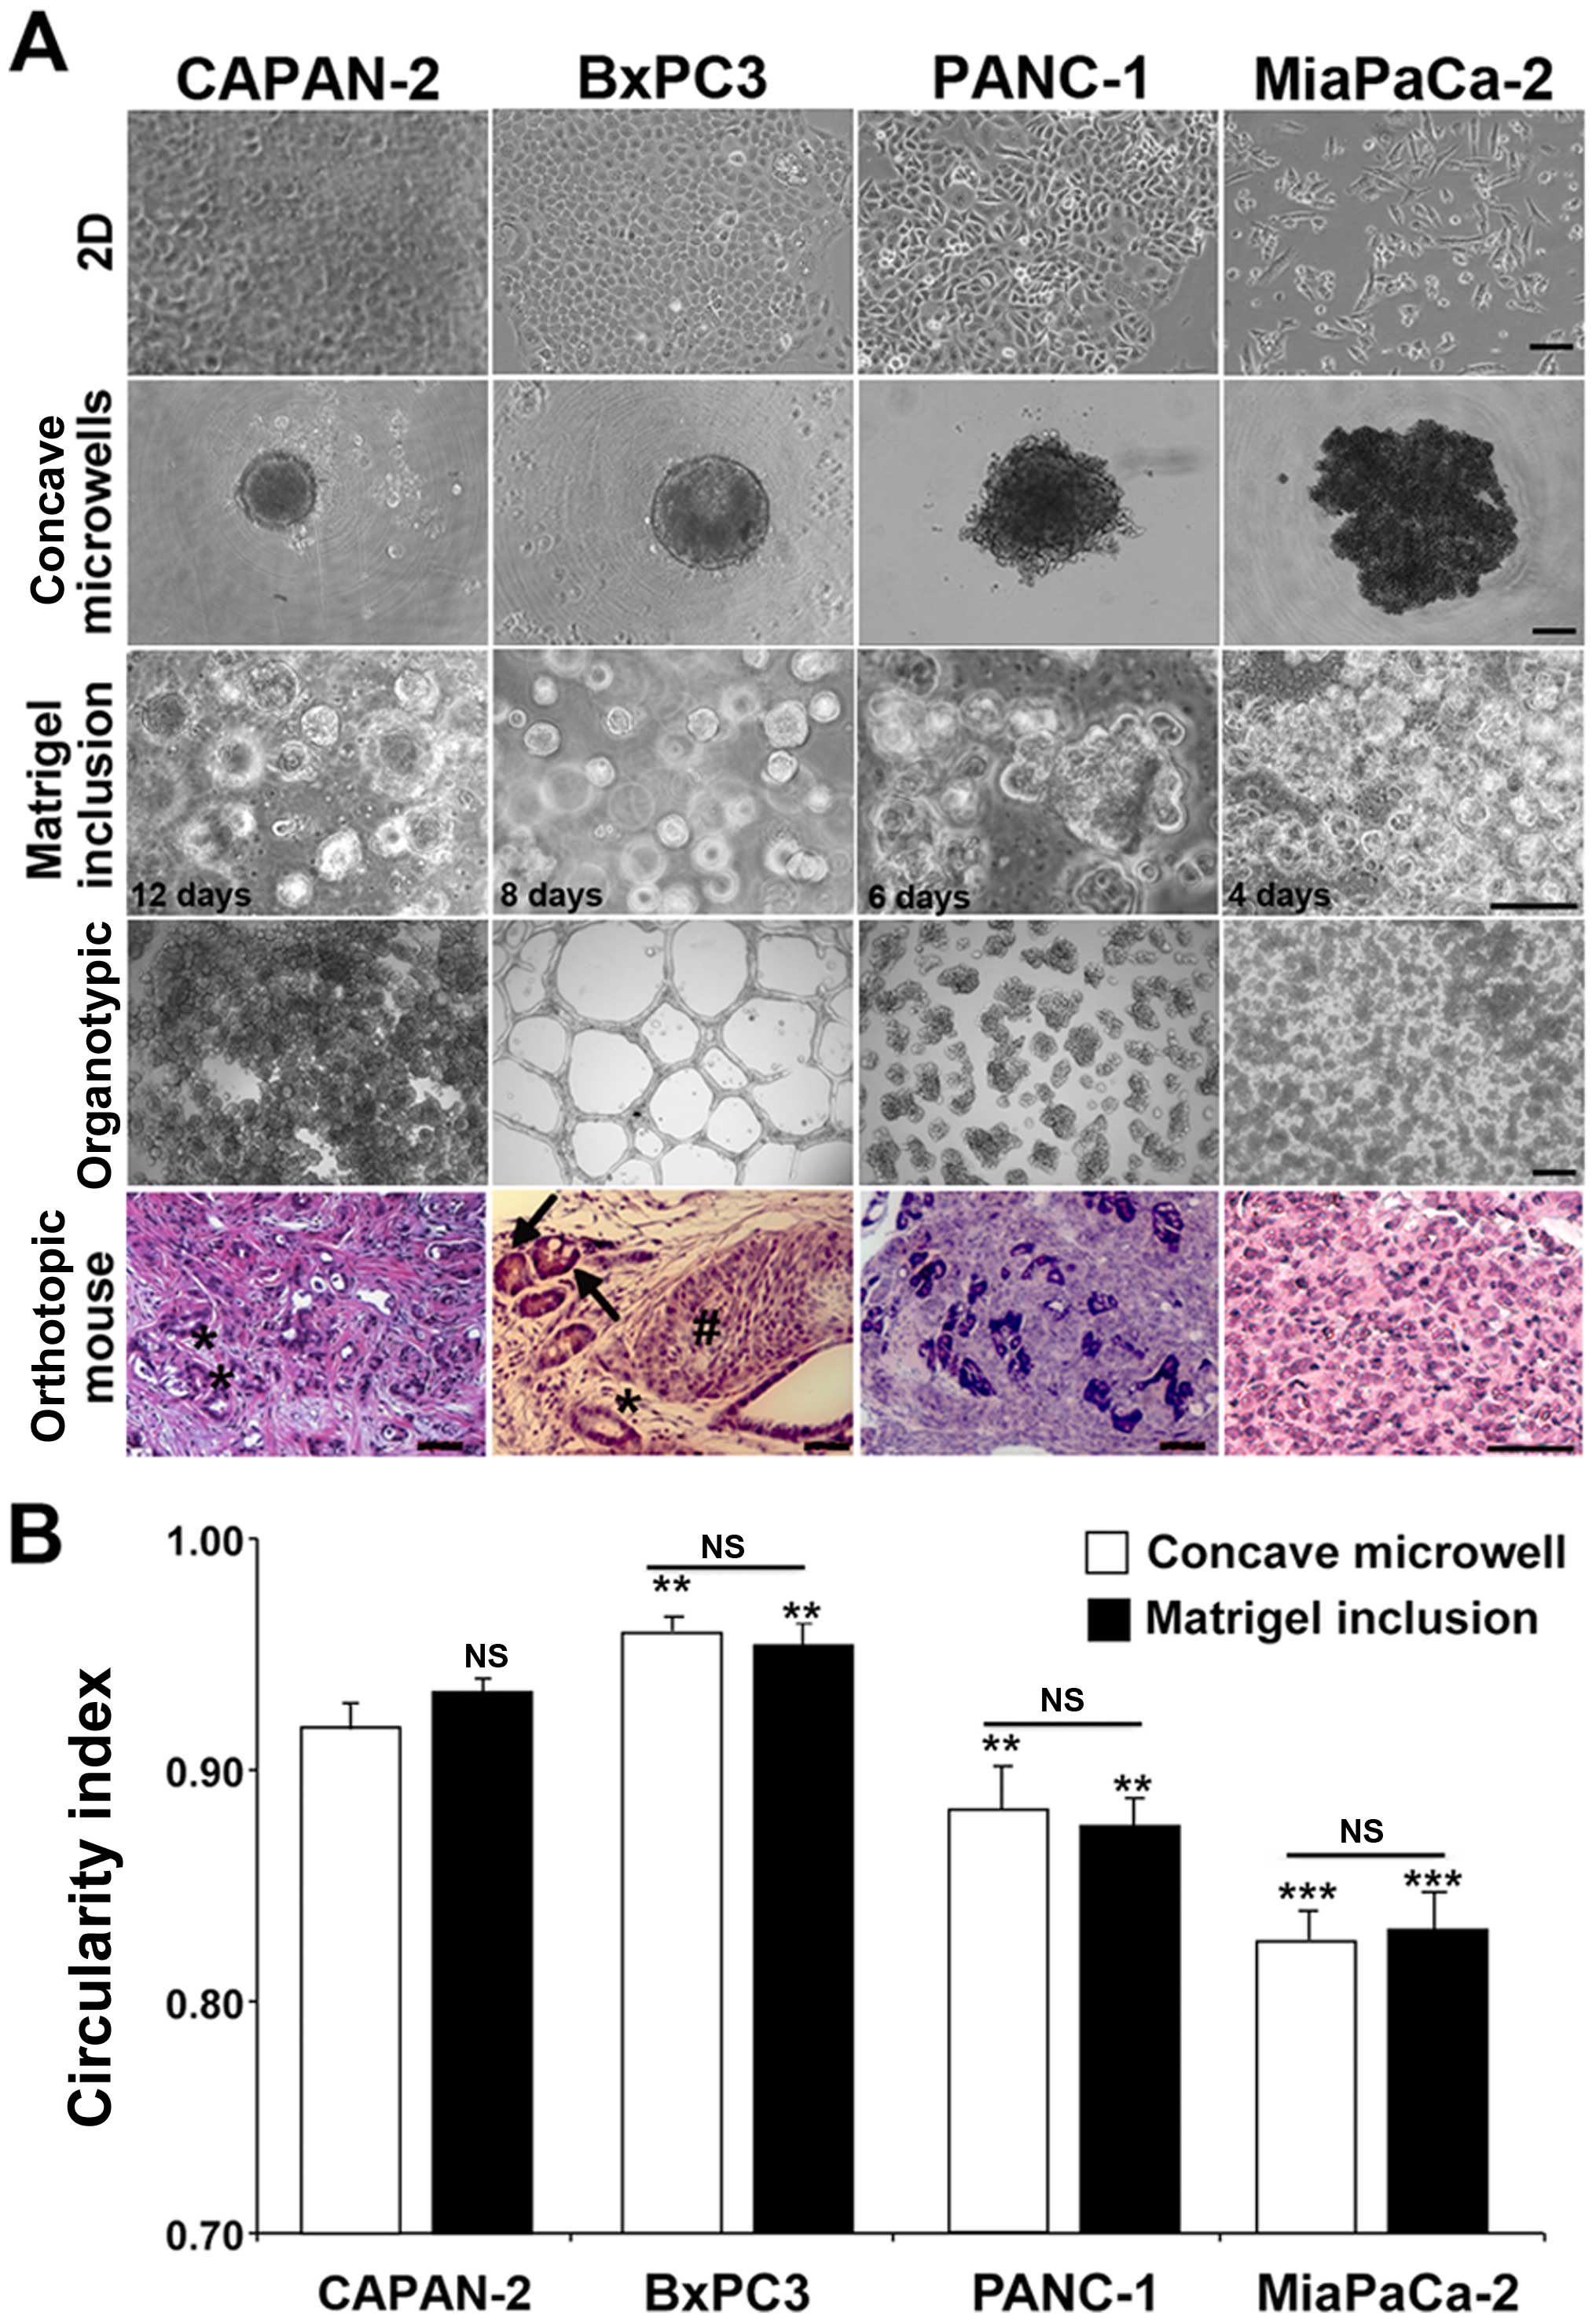 | Figure 2Morphological comparisons of PDAC
cells in 2D and different 3D systems. PDAC cells were cultured in
the different platforms and images of representative structures
were captured at different time-points as indicated in the images.
(A) Representative images of colonies from the four PDAC cell lines
in 2D (first row), ultra-low adhesion concave microwells without
ECM (second row), dispersed in 7 mg/ml Matrigel (third row), in
organotypic (forth row) and hematoxylin and eosin (H&E)
staining in pancreatic tissue sections derived from
immunosuppressed mice in which the four PDAC cell lines were
orthotopically implanted (fifth row). Only cells in the organotypic
3D culture conditions showed a close resemblance to the in
vivo orthotopic tumors developed from the same cell lines.
Scale bars, 10 μm for 2D cultures; 25 μm for all three 3D cultures
and 50 μm for in vivo tumors. Asterisks indicate duct-like
structures with a distinct apical-basal polarization, the hashtag
character indicates a dense mass of tumor cells and arrows indicate
small vessels lined with tumor cells and containing erythrocytes.
Images in Matrigel inclusion (second row) were taken at different
days after plating (12, 8, 6 and 4 days for CAPAN-2, BxPC3, PANC-1
and MiaPaCa-2, respectively) because of the large differences in
colony growth. (B) Colony circularity index measured and calculated
in Fiji. Data are shown as mean ± SEM for four independent
experiments; ANOVA followed by Dunnet post hoc test:
**P<0.01; ***P<0.001 of the circularity
index of the spheroids of the different cell lines compared to the
CAPAN-2 cell line spheroids in each respective culture system. The
circularity index for each cell line was not significant (NS)
between Matrigel inclusion (black bars) and their respective
spheroids in concave microwells (open bars). |
Only when grown in organotypic culture (Fig. 2A, fourth row), where the cancer
cells are seeded on top of the matrix, was there a strong
phenotypic variability in microtissue tumor morphology between the
cell lines, such that the least aggressive cell line, CAPAN-2
(16), formed a monolayer rich in
globular structures, the BxPC3 formed a vascular type network while
the more aggressive PANC-1 and MiaPaCa-2 lines initially formed
irregular colonies that eventually coalesced into complex
microtissues. As this increased phenotypic variability in
morphology probably more closely reflects the in vivo
characteristics of the different lines, we compared these observed
morphological differences with PDAC in vivo, by implanting
the four PDAC cell lines orthotopically into the pancreas of nude
mice and analyzing the morphological patterns of pancreatic tumor
sections obtained by hematoxylin and eosin staining (H&E)
[Fig. 2A, fifth row; (10)]. Keeping in mind the much higher
complexity in vivo, the general morphology of the tumors in
all the tumor sections closely followed that observed in the
organotypic culture system. The CAPAN-2 and BxPC3 cell lines grew
in vivo to become, respectively, a well and moderately
differentiated tumor, as confirmed by the presence of in
vivo duct-like structures (asterisks) with a distinct
apical-basal polarization. Moreover, in vivo growth of BxPC3
cells formed organized islands of tumor cells (hashtag character)
and the presence of small vessels lined with tumor cells and
containing erythrocytes (arrows), suggesting that, indeed, this
cell line is able to form microvascular-like bed complexes in
vivo. On the contrary, tumors derived from PANC-1 and MiaPaCa-2
cell lines developed undifferentiated primary tumor masses, which
proliferated in an unorganized way in vivo.
Expression of tissue architecture, growth
signaling and microenvironment proteins
As cells grow in 3D, they alter the expression of a
number of proteins regulating tissue architecture, matrix
interaction and growth factor signaling (14,15,18).
We therefore determined the effect of the different 3D culture
systems on basal and EGF stimulated (100 ng/ml, 24 h) expression in
western blotting of key proteins regulating cell-cell and
cell-matrix interactions, epithelial to mesenchymal transition
(EMT) and metastasis (Fig. 3A).
For this, we utilized the PANC-1 cell line since it is known to be
the most resistant to drugs targeting the EGFR (19). We first looked at E-cadherin
together with β1 integrin, EGFR and ezrin, a membrane-cytoskeleton
linker protein, in virtue of their known involvement in mediating
cell-ECM interactions, EMT and invasion in PDAC (20). In basal conditions, the expression
of E-cadherin (Fig. 3B), a marker
of epithelial tissue organization, was higher in all the 3D systems
compared to 2D culture, while β1 integrin (Fig. 3D) expression was high only in the
presence of matrix and was higher in organotypic than in Matrigel
inclusion. Importantly, only in 3D culture conditions, and
especially in the organotypic platform, did EGF treatment increase
both EGFR phosphorylation (Fig.
3E) and β1 integrin (Fig. 3D)
expression while decreasing E-cadherin expression (Fig. 3B). This supports previous reports
that E-cadherin expression decreases during EMT, invasion and
metastasis (21–23) and that reduced E-cadherin
expression is associated with increased β1 integrin levels in
breast (24) and advanced ovarian
(25) cancers. In line with the
phosphorylation of ezrin on threonine 567 (p(T567)ezrin) being
increased in several human tumor tissues and playing a role in
metastasis by favoring motility and invasion (21), we found that p(T567)ezrin,
normalized to total ezrin expression, was downregulated by EGF in
2D culture, not regulated in concave microwells and Matrigel
inclusion and strongly upregulated only in the organotypic culture
(Fig. 3C). Thus, only the
organotypic platform confirmed the in vivo reports of a
correlation of increased p(T567)ezrin levels, which requires
activated β1 integrin receptor, with the downregulation of
E-cadherin (20).
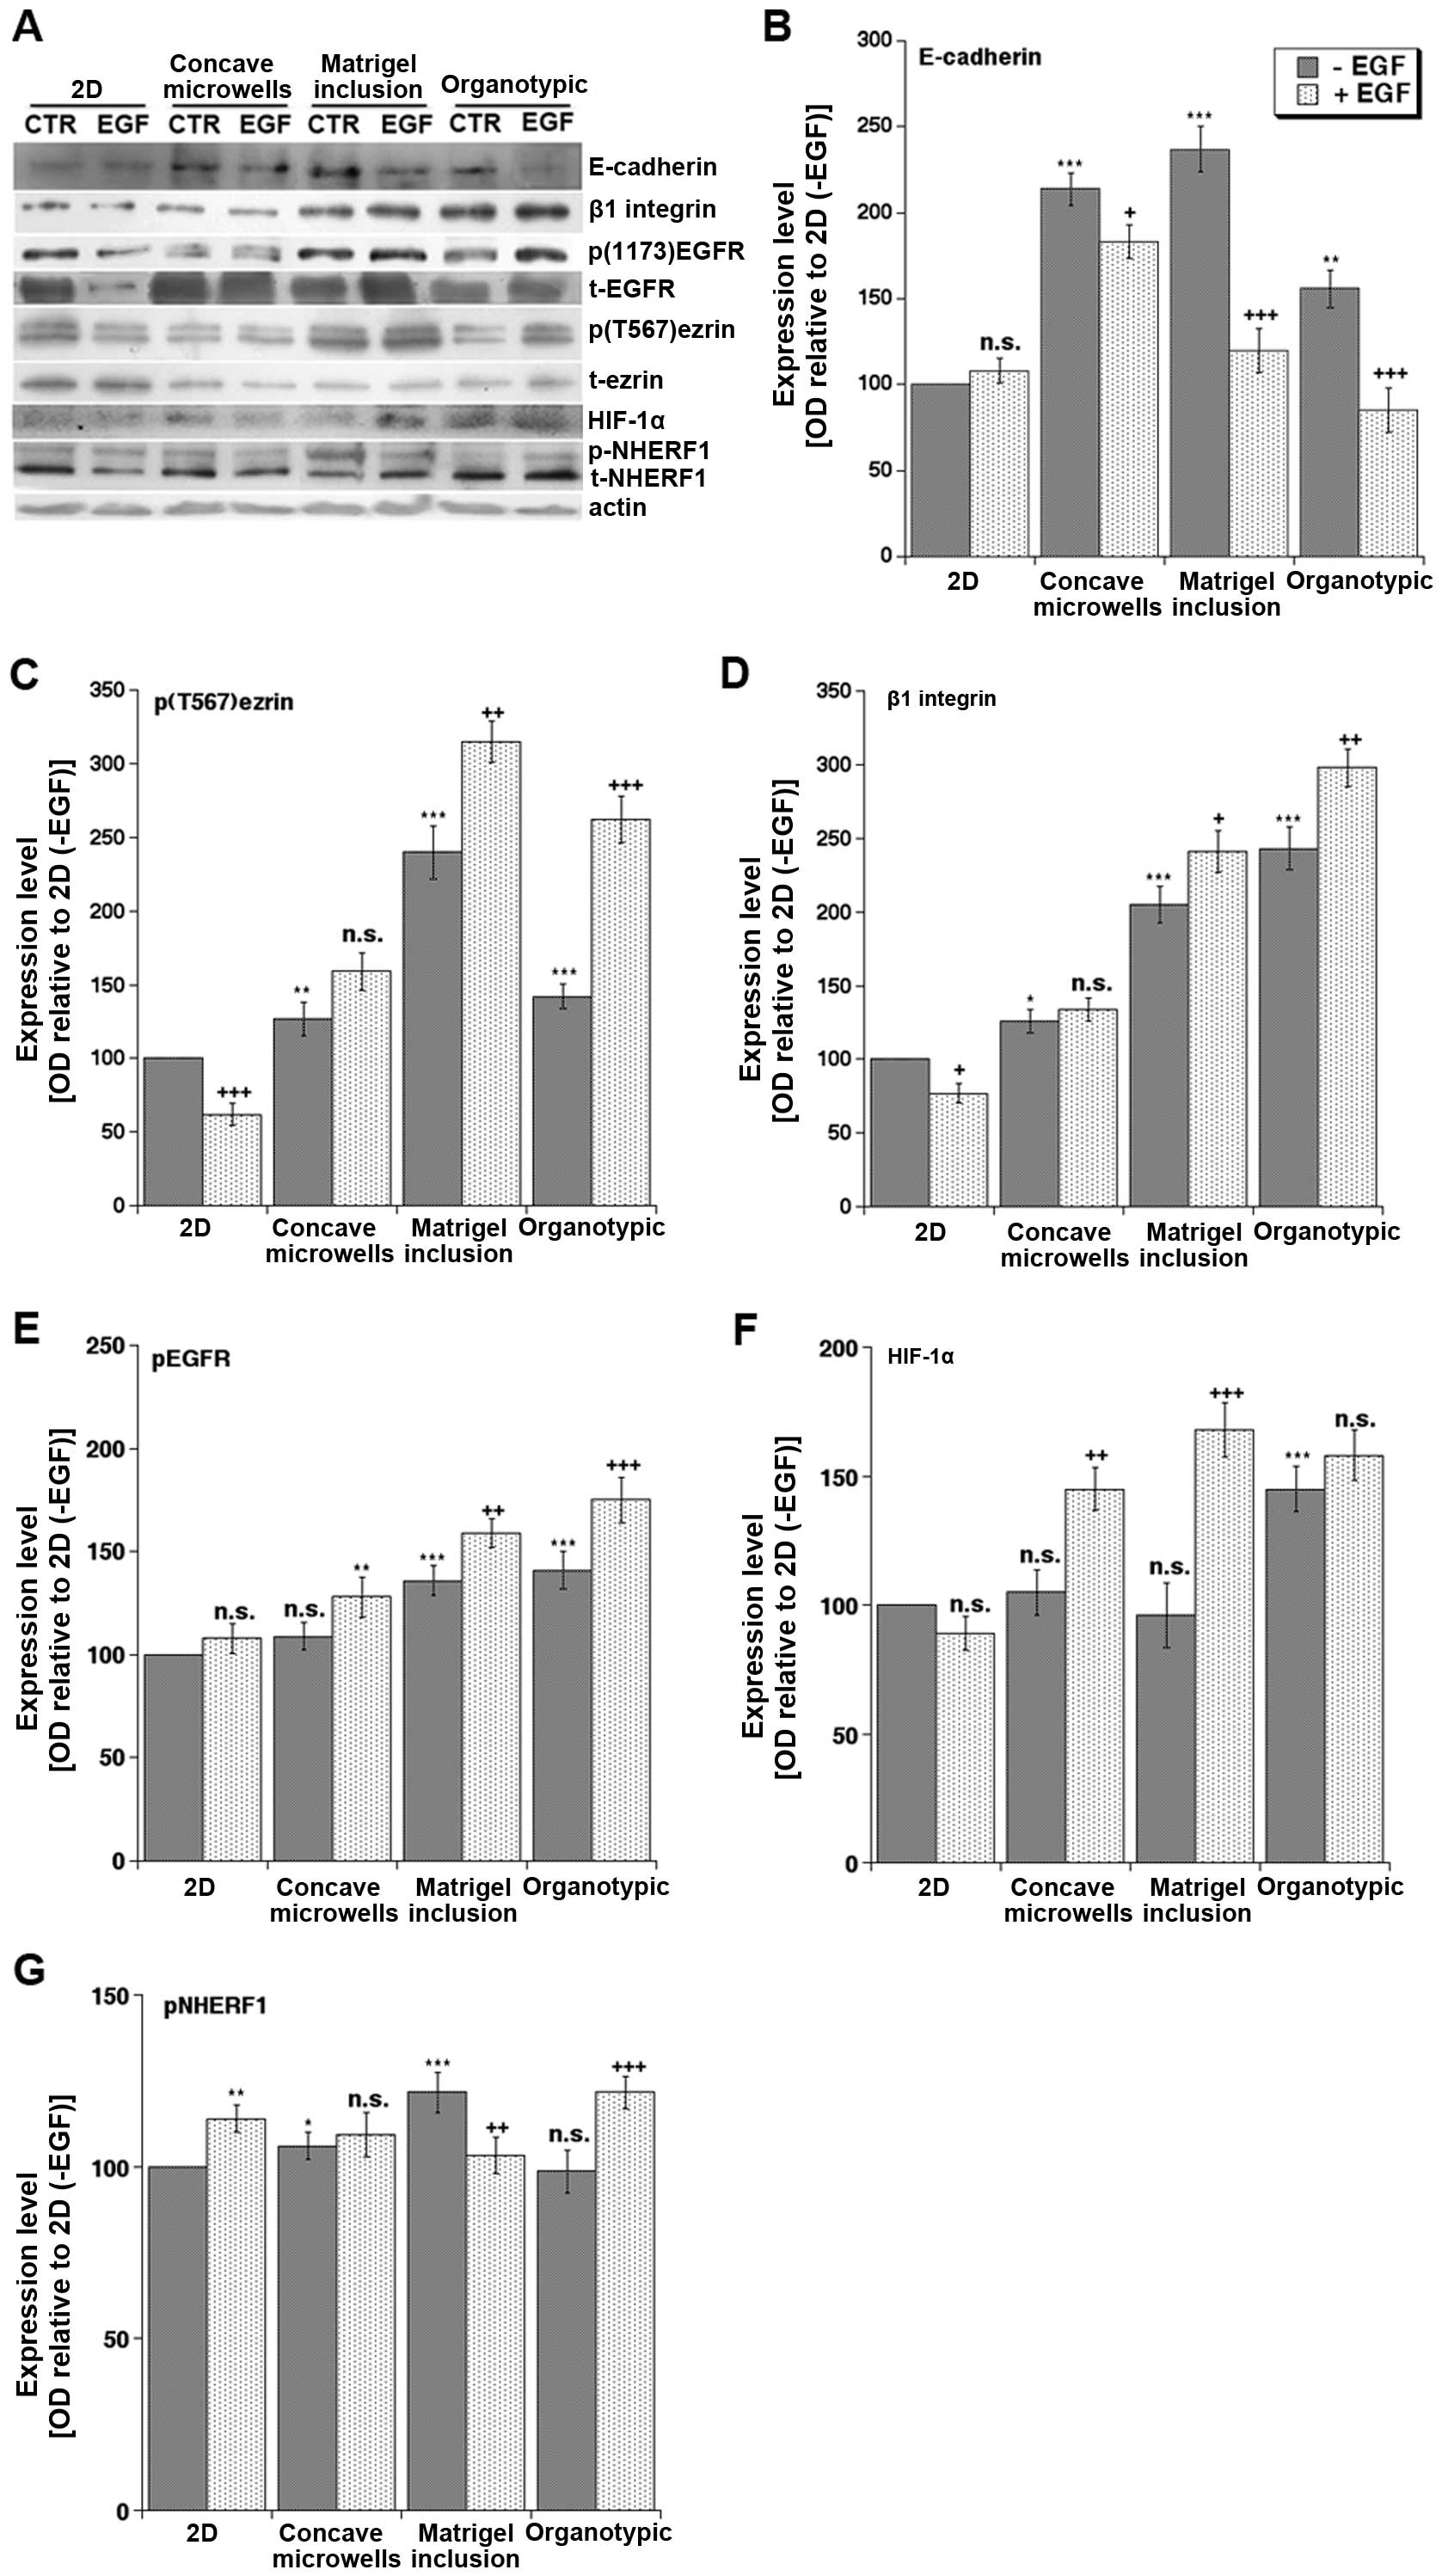 | Figure 3Effects of culture system and EGF on
protein expression levels of p-EGFR, EGFR, HIF-1α, ezrin, p-ezrin,
β1 integrin, NHERF1 and E-cadherin. (A) Typical blots of PANC-1
cells cultured for three days in the different platforms in the
absence or presence of EGF (100 ng/ml). The collected homogenates
were separated in SDS-PAGE, transferred to Immobilon P transfer
membranes and the expression of E-cadherin, p(T567)ezrin, total
ezrin, β1 integrin, p(1173)EGFR, EGFR, HIF-1α, and NHERF1 were
analyzed by western blotting with their primary antibodies as
described in Materials and methods. The expression levels were
analyzed in ImageJ as described in Materials and methods and
standardized for actin levels. (B–G) Histograms summarizing the
relative expression levels from 4 independent experiments using the
expression levels of the 2D minus EGF treatment (2D, -EGF) as 100%
and expressed as mean ± SEM for E-cadherin, p(T567)ezrin, β1
integrin, pEGFR, HIF-1α and pNHERF1, respectively. Statistical
analysis was ANOVA followed by Dunnet post hoc test:
**P<0.01; ***P<0.001 of optical density
of the (−EGF) band for each protein in each 3D system compared to
that in 2D culture while ++P<0.01;
+++P<0.001 between the −EGF and +EGF treated cells
for each system. NS, not significant. |
We then extended the analysis to some signaling
proteins important in transducing the effects of the tumor
microenvironment. First of all, we found that the hypoxia marker,
HIF-1α, which in human PDAC samples correlates with tumor size,
aggressiveness and poor prognosis (26), exhibited the lowest protein levels
in the 2D system and the highest expression in both Matrigel
cultures exposed to EGF and in the organotypic cultures even in the
absence of EGF. This expression pattern, which reflects the
desmoplastic, hypo-vascularised and highly hypoxic nature of PDAC
only in the organotypic model, was shared by another tumor hypoxia
microenvironment-associated protein (27–30),
the scaffolding protein NHERF1. Importantly, NHERF1 expression is
also increased in several human cancers including PDAC (10) and it can be phosphorylated by the
protein kinase A (PKA), via the PKA-anchoring activity of ezrin
(31). In line with this, we
detected an increase of the higher molecular weight band of NHERF1,
corresponding to phospho-NHERF1, in the organotypic cultures
exposed to EGF, where the increase of p(T567)ezrin, i.e., active
ezrin, was highly significant (Fig.
3G). This finding also recapitulates the natural increase in
both p(T567)ezrin expression and NHERF1 phosphorylation that have
been already reported in human tumor tissues (21,32)
and further validates the organotypic system as the more relevant
3D approach to study PDAC biology in response to its
microenvironment.
3D culture promotes sensitivity to EGF
and resistance to erlotinib differently for the various culture
systems
One of the many characteristics of cancer cells
grown in 3D culture is increased chemo- and radio-resistance to
anticancer therapy compared to that in 2D culture (33,34).
It is considered that both 3D architecture and ECM exert strong
effects on both the regulation of growth and drug efficiency
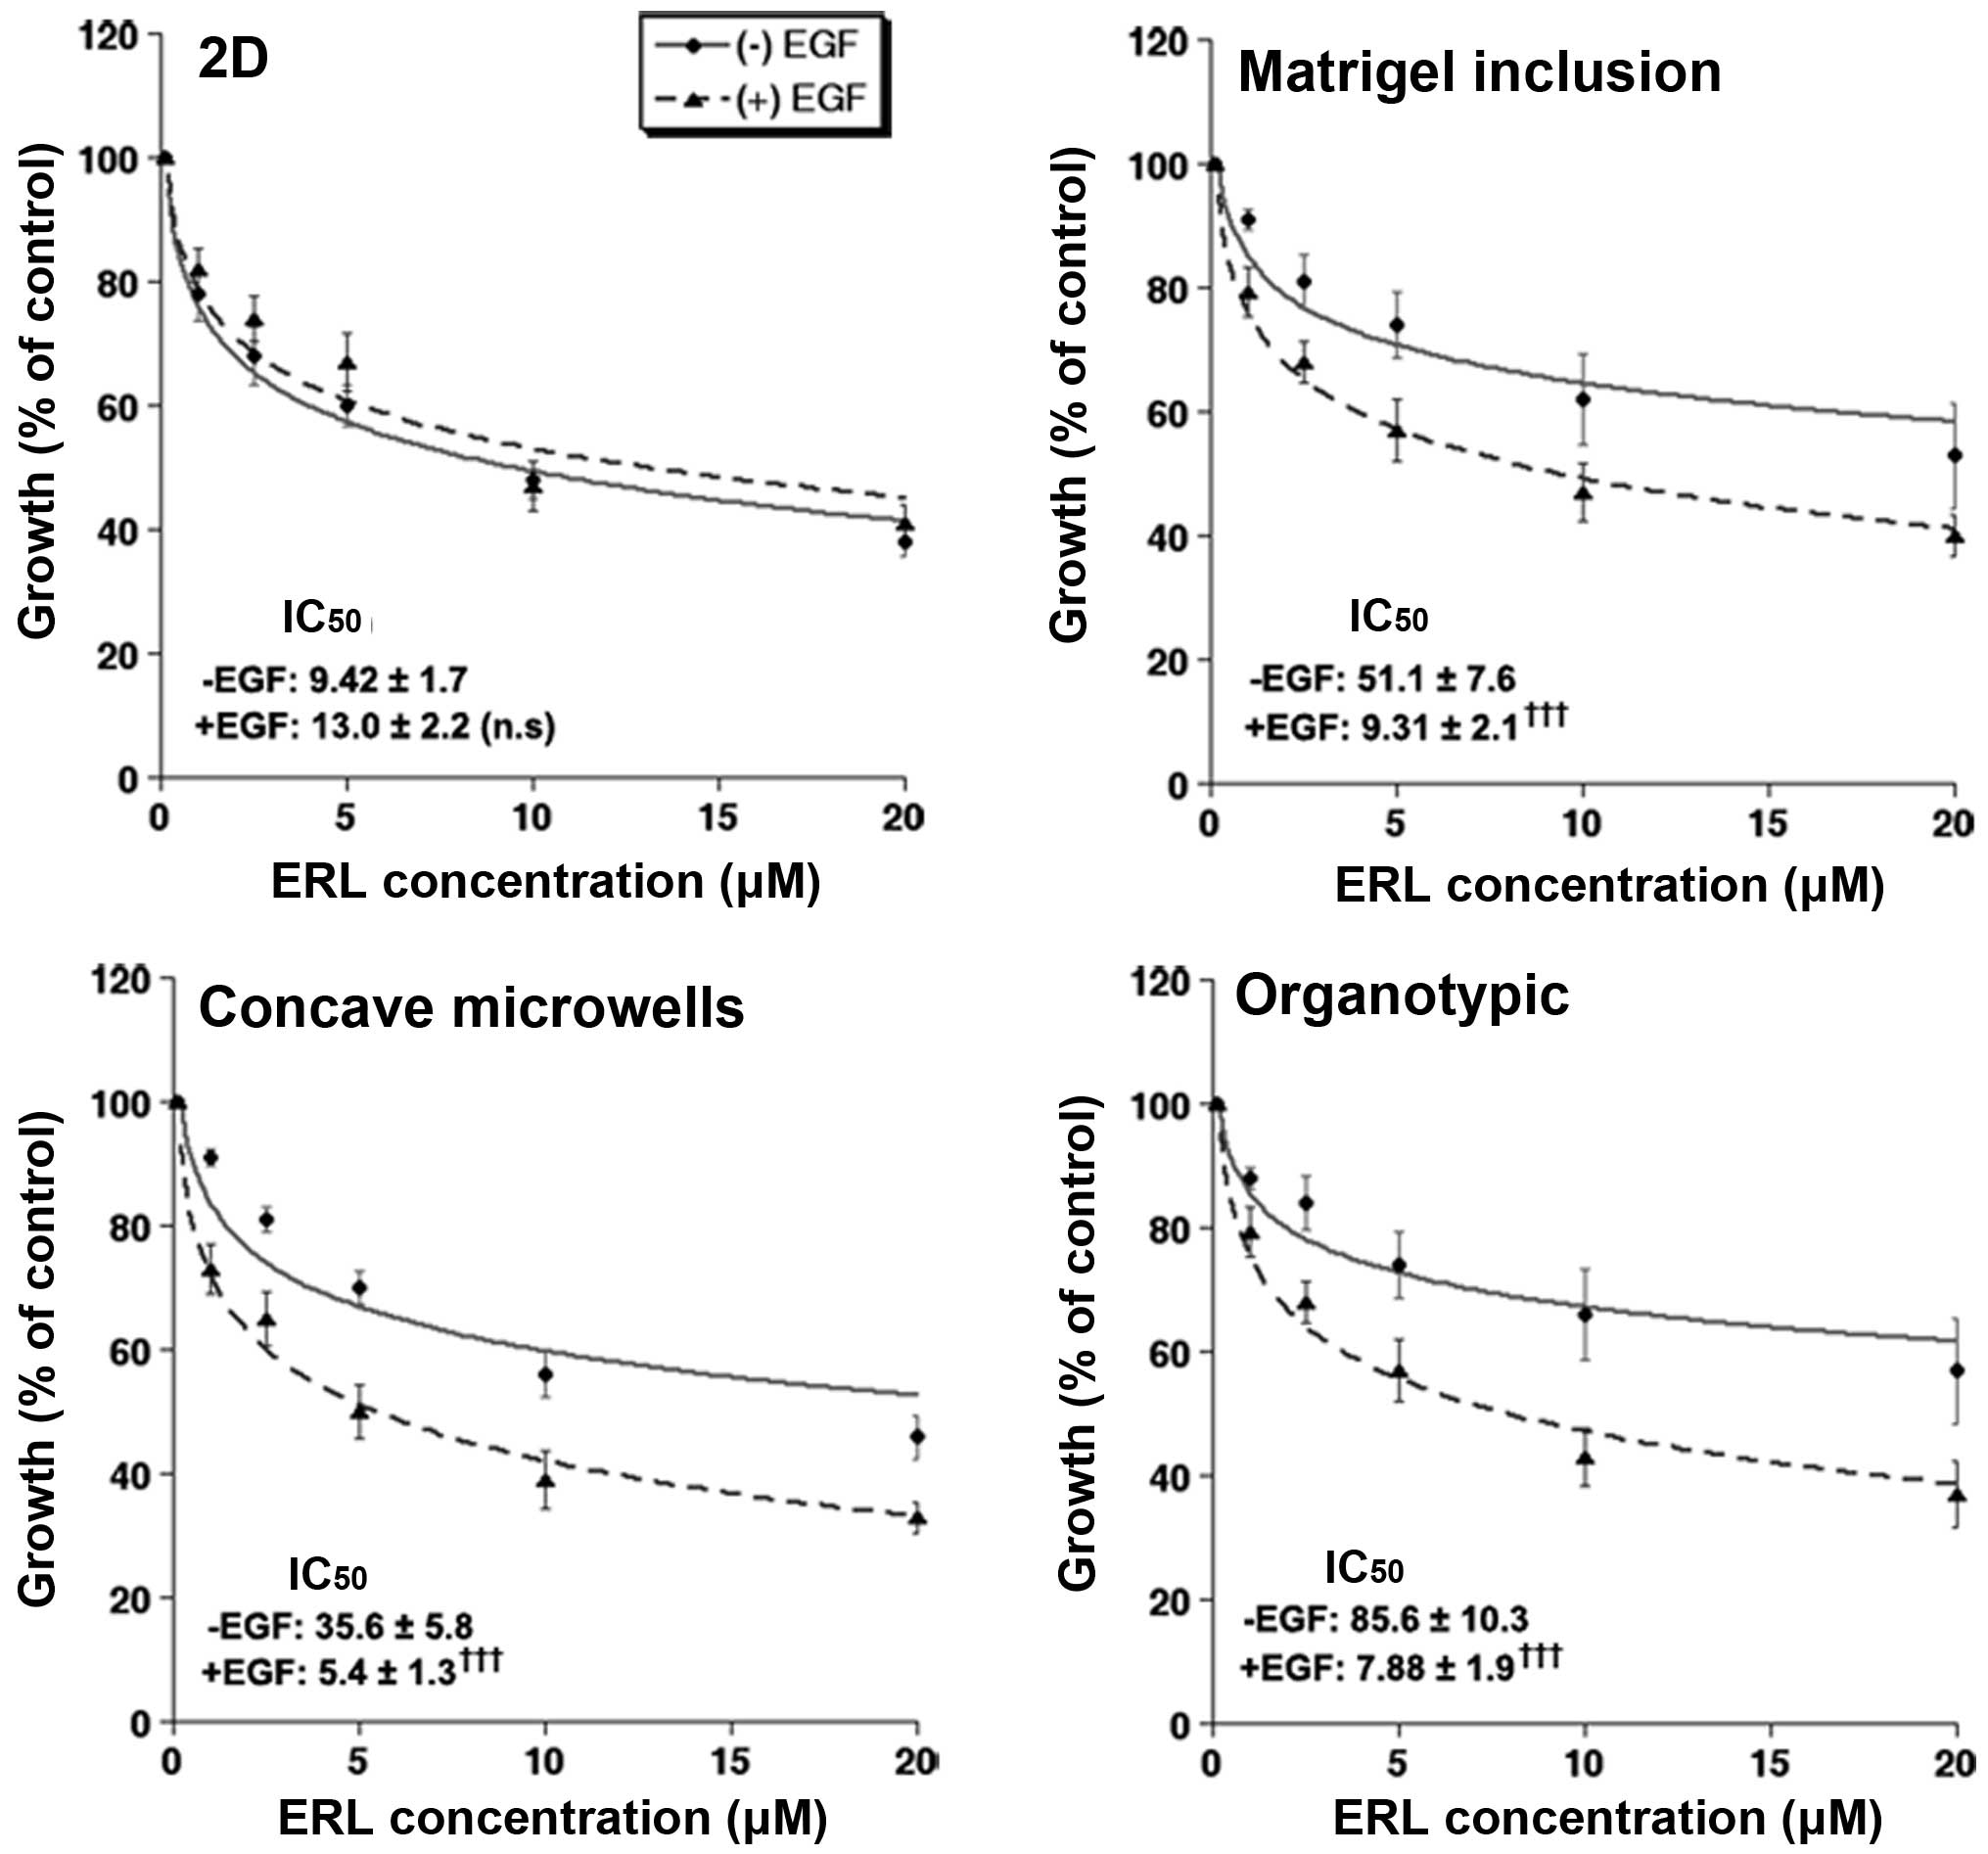
(35). To measure the effect of
EGF on cell sensitivity to the EGFR tyrosine kinase inhibitor,
erlotinib, we treated PANC-1 cells with various concentrations of
erlotinib in the presence or absence of EGF and measured cell
growth using the resazurin assay and transforming to cell number.
Only the cells cultured in 3D responded to EGF addition with an
increase in cell number of 32±7.9% (n=8), 29±12.4% (n=7), and 26±8%
(n=5) in the concave microwell, Matrigel inclusion and organotypic
systems, respectively. Similarly, as can be seen in Fig. 4, cells grown in all three 3D
systems were more resistant to erlotinib than in the 2D system with
the cells grown in the organotypic system being the most resistant
in basal conditions. While EGF treatment increased the growth rate
in all 3D platforms, control growth rates (in the absence of
erlotinib) are shown as 100% in-order-to facilitate visual
comparison of the dose responses of each treatment. Interestingly,
these differences in drug sensitivity are in line with the
expression data as E-cadherin expression has been linked to drug
resistance and clinical trials of the erlotinib in non-small cell
lung cancer have shown better responses in patients with high
E-cadherin expression (36).
Furthermore, concomitant incubation of EGF with erlotinib
significantly enhanced the inhibitory effect of erlotinib only in
the 3D cultures with a greater effect occurring in the organotypic
platform (Fig. 4). These
inhibition data are in line with the reported increased resistance
to pharmacological therapy in other 3D cell culture formats
(5–7) and suggest that efficacy assays
performed in physiologically relevant culture conditions become
more predictive to in vivo responses.
Altogether, these data support earlier reports that
characteristics of 3D cultures are similar to those in the original
tumor (37) and suggest that the
organotypic system most closely recapitulates the in vivo
tumor characteristics in morphology, the relationships in protein
expression and pharmacodynamics.
Discussion
As only 5% of compounds that show pre-clinical
efficacy go on to become licensed drugs (1), more predictive in vitro
efficacy and toxicity assays are needed to identify new anticancer
drugs and reduce the number of costly drug failures in clinical
trials. Traditionally, two-dimensional (2D) cell culture models
have been employed to evaluate drug candidates in the early phases
of the drug discovery process. However, cells grown in 2D
monolayers do not accurately reflect the biological complexity of
tumors as such cultures are a highly reductionist model of
epithelial cancers and poorly represent in vivo tumor cell
biology, due to the absence of relevant properties, such as
cell-cell communication, extracellular matrix (ECM) contacts,
differentiation, polarization and intratumoral gradients in pH,
nutrition and oxygen (i.e., a lack of realistic mass transfer
gradients). For these reason, animal studies have always been
utilized as the final pre-clinical passage before human
experimentation, to predict drug efficacy and to understand the
biological processes driving the tumor development.
However, given the differences between mice and
humans (38,39), techniques that can mimic in
vitro the development of a human tumor have an enormous
potential to further increase our understanding of the dynamics of
progression, metastasis, drug response and therapy resistance. This
need is further accentuated by the creation, in 2005, of the
European Partnership for Alternative Approaches to Animal Testing
(EPAA) and the directive of 2010/63/EU on the protection of animals
used for scientific purposes that recommend to ‘reduce, refine and
finally replace’ the use of animal experimental models. This has
created an urgent need to develop new alternative tests to
animals.
This requirement for better in vitro models
has led to the development of a large variety of 3D cell culture
systems, which retain different aspects of the morphological and
physiological traits of tumors and better predict tumor behavior by
mirroring complex tissue organization and the myriad of
microenvironmental signals impacting tumor growth. Although there
has been much progress in constructing these in vitro
physio-pathological models, there is still no consensus on which 3D
models of PDAC are best able to mimic the tumor's molecular (genome
and proteome) and functional (chemotherapy sensitivity and
signaling) characteristics. Indeed, a rigorous comparison of these
different systems in a single cancer type has not been performed.
Therefore, we have characterized growth, proteins involved in
cell-ECM communication, tissue architecture, EMT and metastasis,
and the response to the EGFR small molecule inhibitor, erlotinib,
in a panel of different 3D culture systems commonly in use and
having different ECM properties.
While our data collectively revealed similarities
between the different 3D systems, the results presented here
suggest that the organotypic 3D system has many advantages over the
other systems. i) Importantly, only the organotypic culture
permitted the cells to express their inherent/intrinsic different
microtissue morphologies that reflected the tumor structure as
observed in orthotopic tumors from each cell line (Fig. 2, fifth row). ii) At the protein
level, we found some important differences among the three
different culture systems with the organotypic model being the more
tissue-mimetic platform also for protein expression/mechanistic
studies of tumor microenvironment-induced cell signaling
components. Indeed, only the organotypic system mirrored the very
tight relationships already reported in vivo among
E-cadherin, β1 integrin, NHERF1, pEGFR and p(T567)ezrin, proteins
mediating tissue architecture, cell-ECM interactions, EMT and
metastasis (21–24). Furthermore, HIF-1α, which plays
major roles in regulating the tumor response to its hypoxic
microenvironment (21–24) was expressed at its very low/basal
level in the matrix-free systems, such as the 2D system and the
concave microwells, while increasing only when the
hypoxia-biomimetic conditions reached into the tumor spheroids,
i.e., in the case of the Matrigel drops exposed to EGF and in the
organotypic system. In the organotypic culture system,
hypoxia-induced HIF-1α expression may have already reached its
maximum stabilization level, thus reducing its sensitivity to EGF
stimulation. iii) We also tested the different culture systems
chemosensitivity to erlotinib, and found that cells were more
resistant to this drug when grown in all the 3D systems compared to
a 2D monolayer but particularly in the organotypic scaffold.
Furthermore, we observed that the organotypic
cultures displayed the highest resistance to erlotinib in basal
conditions, but with an increased response in the presence of EGF
stimulation compared to spheroids in either non-clonal concave
microwell or the clonal Matrigel inclusion systems. iv)
Importantly, the organotypic cultures have the capacity to produce
3D platforms that more faithfully reproduce and permit the
experimental manipulation of the various aspects of the complete
tumor microenvironment including ECM components and different cell
populations (e.g., endothelial cells, immune cells, stellate cells,
pericytes, etc.) (32). This
approach could permit the formation of complex, functional
organoids or microtissues that include the different tumor and
stromal cell populations and ECM components in functional 3D
matrices and/or scaffolds (40).
Given these advantages, the organotypic system has
an enormous potential to permit the more realistic analysis of
tumor development, progression and sensitivity to therapy since 3D
architecture, ECM composition/structure and stromal/metabolic
microenvironments exert strong influences on drug efficacy. Indeed,
evidence is emerging that 3D models with microenvironments
customized to more closely mimic the tumors microenvironment are
superior to both 2D and animal models (5–7,16).
Our findings suggest that this aspect together with its inherent
capacity to easily reproduce the tumor microenvironment to produce
complex co-culture conditions and perform drug schedule regimens
after the tumor has developed in all its complexity, makes this
type of culture the system of choice. Indeed, the further
development of organotypic 3D culture with tissue engineering could
enable the development of more complex, robust and relevant
heterologous 3D tumor models to be used for designing personalized
treatment. Moreover, because these complex organotypic platforms
could provide drug chemosensitivity data within 9 days that is
equivalent to the results generated from mouse tumor xenograft
models in 50 days, the organotypic platform would be more accurate,
efficient, and cost-effective and may reduce or replace animal
models in the near future to identify new drug candidates, predict
drug efficacy, prevent drug resistance, and improve the quality of
life.
Therefore, future directions in this field will be
to develop disease- or pathway-specific tissue models and adapt
these models to create patient-specific systems to screen drug
response in a potentially individualized manner to have direct
personal relevance for each patient.
Acknowledgements
This study was supported by Associazione Italiana
per la Ricerca sul Cancro (AIRC) grant no. 11348 to S.J.R. K.Z. and
M.S. are fellows of Marie Curie Initial Training Network IonTraC
(FP7-PEOPLE-2011-ITN grant agreement no. 289648). The SJR
laboratory is part of the Italian network Istituto Nazionale
Biostrutture e Biosistemi (INBB) and the project BioBoP of the
Region Puglia.
References
|
1
|
Hutchinson L and Kirk R: High drug
attrition rates - where are we going wrong? Nat Rev Clin Oncol.
8:189–190. 2011. View Article : Google Scholar : PubMed/NCBI
|
|
2
|
Cukierman E, Pankov R, Stevens DR and
Yamada KM: Taking cell-matrix adhesions to the third dimension.
Science. 294:1708–1712. 2001. View Article : Google Scholar : PubMed/NCBI
|
|
3
|
Erkan M, Hausmann S, Michalski CW,
Fingerle AA, Dobritz M, Kleeff J and Friess H: The role of stroma
in pancreatic cancer: Diagnostic and therapeutic implications. Nat
Rev Gastroenterol Hepatol. 9:454–467. 2012. View Article : Google Scholar : PubMed/NCBI
|
|
4
|
Neesse A, Michl P, Frese KK, Feig C, Cook
N, Jacobetz MA, Lolkema MP, Buchholz M, Olive KP, Gress TM, et al:
Stromal biology and therapy in pancreatic cancer. Gut. 60:861–868.
2011. View Article : Google Scholar
|
|
5
|
Partensky C: Toward a better understanding
of pancreatic ductal adenocarcinoma: Glimmers of hope? Pancreas.
42:729–739. 2013. View Article : Google Scholar : PubMed/NCBI
|
|
6
|
Oettle H: Progress in the knowledge and
treatment of advanced pancreatic cancer: From benchside to bedside.
Cancer Treat Rev. 40:1039–1047. 2014. View Article : Google Scholar : PubMed/NCBI
|
|
7
|
Rahib L, Smith BD, Aizenberg R, Rosenzweig
AB, Fleshman JM and Matrisian LM: Projecting cancer incidence and
deaths to 2030: The unexpected burden of thyroid, liver, and
pancreas cancers in the United States. Cancer Res. 74:2913–2921.
2014. View Article : Google Scholar : PubMed/NCBI
|
|
8
|
Coleman SJ, Watt J, Arumugam P, Solaini L,
Carapuca E, Ghallab M, Grose RP and Kocher HM: Pancreatic cancer
organotypics: High throughput, preclinical models for
pharmacological agent evaluation. World J Gastroenterol.
20:8471–8481. 2014. View Article : Google Scholar : PubMed/NCBI
|
|
9
|
Hwang CI, Boj SF, Clevers H and Tuveson
DA: Preclinical models of pancreatic ductal adenocarcinoma. J
Pathol. 238:197–204. 2016. View Article : Google Scholar
|
|
10
|
Cardone RA, Greco MR, Zeeberg K,
Zaccagnino A, Saccomano M, Bellizzi A, Bruns P, Menga M, Pilarsky
C, Schwab A, et al: A novel NHE1-centered signaling cassette drives
epidermal growth factor receptor-dependent pancreatic tumor
metastasis and is a target for combination therapy. Neoplasia.
17:155–166. 2015. View Article : Google Scholar : PubMed/NCBI
|
|
11
|
Kimlin L, Kassis J and Virador V: 3D in
vitro tissue models and their potential for drug screening. Expert
Opin Drug Discov. 8:1455–1466. 2013. View Article : Google Scholar : PubMed/NCBI
|
|
12
|
Alves F, Contag S, Missbach M, Kaspareit
J, Nebendahl K, Borchers U, Heidrich B, Streich R and Hiddemann W:
An orthotopic model of ductal adenocarcinoma of the pancreas in
severe combined immunodeficient mice representing all steps of the
metastatic cascade. Pancreas. 23:227–235. 2001. View Article : Google Scholar : PubMed/NCBI
|
|
13
|
Chou TC: Drug combination studies and
their synergy quantification using the Chou-Talalay method. Cancer
Res. 70:440–446. 2010. View Article : Google Scholar : PubMed/NCBI
|
|
14
|
Hebner C, Weaver VM and Debnath J:
Modeling morphogenesis and oncogenesis in three-dimensional breast
epithelial cultures. Annu Rev Pathol. 3:313–339. 2008. View Article : Google Scholar
|
|
15
|
Yamada KM and Cukierman E: Modeling tissue
morphogenesis and cancer in 3D. Cell. 130:601–610. 2007. View Article : Google Scholar : PubMed/NCBI
|
|
16
|
Collisson EA, Sadanandam A, Olson P, Gibb
WJ, Truitt M, Gu S, Cooc J, Weinkle J, Kim GE, Jakkula L, et al:
Subtypes of pancreatic ductal adenocarcinoma and their differing
responses to therapy. Nat Med. 17:500–503. 2011. View Article : Google Scholar : PubMed/NCBI
|
|
17
|
Sipos B, Möser S, Kalthoff H, Török V,
Löhr M and Klöppel G: A comprehensive characterization of
pancreatic ductal carcinoma cell lines: Towards the establishment
of an in vitro research platform. Virchows Arch. 442:444–452.
2003.PubMed/NCBI
|
|
18
|
Edmondson R, Broglie JJ, Adcock AF and
Yang L: Three-dimensional cell culture systems and their
applications in drug discovery and cell-based biosensors. Assay
Drug Dev Technol. 12:207–218. 2014. View Article : Google Scholar : PubMed/NCBI
|
|
19
|
Navas C, Hernández-Porras I, Schuhmacher
AJ, Sibilia M, Guerra C and Barbacid M: EGF receptor signaling is
essential for k-ras oncogene-driven pancreatic ductal
adenocarcinoma. Cancer Cell. 22:318–330. 2012. View Article : Google Scholar : PubMed/NCBI
|
|
20
|
Froeling FE, Mirza TA, Feakins RM, Seedhar
A, Elia G, Hart IR and Kocher HM: Organotypic culture model of
pancreatic cancer demonstrates that stromal cells modulate
E-cadherin, beta-catenin, and Ezrin expression in tumor cells. Am J
Pathol. 175:636–648. 2009. View Article : Google Scholar : PubMed/NCBI
|
|
21
|
Antelmi E, Cardone RA, Greco MR, Rubino R,
Di Sole F, Martino NA, Casavola V, Carcangiu M, Moro L and Reshkin
SJ: β1 integrin binding phosphorylates ezrin at T567 to activate a
lipid raft signalsome driving invadopodia activity and invasion.
PLoS One. 8:e751132013. View Article : Google Scholar
|
|
22
|
Canel M, Serrels A, Frame MC and Brunton
VG: E-cadherin-integrin crosstalk in cancer invasion and
metastasis. J Cell Sci. 126:393–401. 2013. View Article : Google Scholar : PubMed/NCBI
|
|
23
|
Clucas J and Valderrama F: ERM proteins in
cancer progression. J Cell Sci. 127:267–275. 2014. View Article : Google Scholar : PubMed/NCBI
|
|
24
|
Wendt MK, Taylor MA, Schiemann BJ and
Schiemann WP: Down-regulation of epithelial cadherin is required to
initiate metastatic outgrowth of breast cancer. Mol Biol Cell.
22:2423–2435. 2011. View Article : Google Scholar : PubMed/NCBI
|
|
25
|
Sawada K, Mitra AK, Radjabi AR, Bhaskar V,
Kistner EO, Tretiakova M, Jagadeeswaran S, Montag A, Becker A,
Kenny HA, et al: Loss of E-cadherin promotes ovarian cancer
metastasis via alpha 5-integrin, which is a therapeutic target.
Cancer Res. 68:2329–2339. 2008. View Article : Google Scholar : PubMed/NCBI
|
|
26
|
Qin R, Smyrk TC, Reed NR, Schmidt RL,
Schnelldorfer T, Chari ST, Petersen GM and Tang AH: Combining
clinicopathological predictors and molecular biomarkers in the
oncogenic K-RAS/Ki67/HIF-1α pathway to predict survival in
resectable pancreatic cancer. Br J Cancer. 112:514–522. 2015.
View Article : Google Scholar : PubMed/NCBI
|
|
27
|
Kremer KN, Dudakovic A, Hess AD, Smith BD,
Karp JE, Kaufmann SH, Westendorf JJ, van Wijnen AJ and Hedin KE:
Histone deacetylase inhibitors target the leukemic microenvironment
by enhancing a Nherf1-protein phosphatase 1α-TAZ signaling pathway
in osteoblasts. J Biol Chem. 290:29478–29492. 2015. View Article : Google Scholar : PubMed/NCBI
|
|
28
|
Malfettone A, Silvestris N, Paradiso A,
Mattioli E, Simone G and Mangia A: Overexpression of nuclear NHERF1
in advanced colorectal cancer: Association with hypoxic
microenvironment and tumor invasive phenotype. Exp Mol Pathol.
92:296–303. 2012. View Article : Google Scholar : PubMed/NCBI
|
|
29
|
Troncoso M, Cuello Carrión FD, Guiñazu E,
Fanelli MA, Montt-Guevara M, Cabrini RL, Carón RW and Kreimann EL:
Expression of NHERF1 in colonic tumors induced by
1,2-dimethylhydrazine in rats is independent of plasma ovarian
steroids. Horm Cancer. 2:214–223. 2011. View Article : Google Scholar : PubMed/NCBI
|
|
30
|
Cardone RA, Bellizzi A, Busco G, Weinman
EJ, Dell'Aquila ME, Casavola V, Azzariti A, Mangia A, Paradiso A
and Reshkin SJ: The NHERF1 PDZ2 domain regulates
PKA-RhoA-p38-mediated NHE1 activation and invasion in breast tumor
cells. Mol Biol Cell. 18:1768–1780. 2007. View Article : Google Scholar : PubMed/NCBI
|
|
31
|
Wang B, Means CK, Yang Y, Mamonova T,
Bisello A, Altschuler DL, Scott JD and Friedman PA: Ezrin-anchored
protein kinase A coordinates phosphorylation-dependent disassembly
of a NHERF1 ternary complex to regulate hormone-sensitive phosphate
transport. J Biol Chem. 287:24148–24163. 2012. View Article : Google Scholar : PubMed/NCBI
|
|
32
|
Cardone RA, Greco MR, Capulli M, Weinman
EJ, Busco G, Bellizzi A, Casavola V, Antelmi E, Ambruosi B,
Dell'Aquila ME, et al: NHERF1 acts as a molecular switch to program
metastatic behavior and organotropism via its PDZ domains. Mol Biol
Cell. 23:2028–2040. 2012. View Article : Google Scholar : PubMed/NCBI
|
|
33
|
Lee JM, Mhawech-Fauceglia P, Lee N,
Parsanian LC, Lin YG, Gayther SA and Lawrenson K: A
three-dimensional microenvironment alters protein expression and
chemosensitivity of epithelial ovarian cancer cells in vitro. Lab
Invest. 93:528–542. 2013. View Article : Google Scholar : PubMed/NCBI
|
|
34
|
Godugu C, Patel AR, Desai U, Andey T, Sams
A and Singh M: AlgiMatrix™ based 3D cell culture system as an
in-vitro tumor model for anticancer studies. PLoS One.
8:e537082013. View Article : Google Scholar
|
|
35
|
Baker BM and Chen CS: Deconstructing the
third dimension: How 3D culture microenvironments alter cellular
cues. J Cell Sci. 125:3015–3024. 2012. View Article : Google Scholar : PubMed/NCBI
|
|
36
|
Voulgari A and Pintzas A:
Epithelial-mesenchymal transition in cancer metastasis: Mechanisms,
markers and strategies to overcome drug resistance in the clinic.
Biochim Biophys Acta. 1796:75–90. 2009.PubMed/NCBI
|
|
37
|
Longati P, Jia X, Eimer J, Wagman A, Witt
MR, Rehnmark S, Verbeke C, Toftgård R, Löhr M and Heuchel RL: 3D
pancreatic carcinoma spheroids induce a matrix-rich, chemoresistant
phenotype offering a better model for drug testing. BMC Cancer.
13:952013. View Article : Google Scholar : PubMed/NCBI
|
|
38
|
Denayer S, Stöhr T and Van Roy M: Animal
models in translational medicine: Validation and prediction. New
Horiz Transl Med. 2:5–11. 2014. View Article : Google Scholar
|
|
39
|
Greek R and Menache A: Systematic reviews
of animal models: Methodology versus epistemology. Int J Med Sci.
10:206–221. 2013. View Article : Google Scholar : PubMed/NCBI
|
|
40
|
Härmä V, Schukov HP, Happonen A, Ahonen I,
Virtanen J, Siitari H, Åkerfelt M, Lötjönen J and Nees M:
Quantification of dynamic morphological drug responses in 3D
organotypic cell cultures by automated image analysis. PLoS One.
9:e964262014. View Article : Google Scholar : PubMed/NCBI
|