Introduction
Lung cancer risk prediction models provide an
estimate of individual's risk of developing lung cancer such that
‘at-risk’ subjects can be targeted for preventive and treatment
interventions (1). Risk models
hold promise for improving patient care by aiding the clinicians
decision making process regarding choice of interventions and/or
treatments. Risk models can also guide selection of individuals at
the population level, for screening: this ensures limited resources
are focussed on those individuals who are most likely to benefit.
This risk guiding strategy ensures minimisation of unnecessary,
invasive and potentially harmful interventions. Existing lung
cancer absolute risk prediction models are mostly based on
traditional epidemiological and/or clinical risk factors (2–7),
limiting their predictive and discriminative abilities. For an
improved precision, incorporation of genetic and molecular markers
of disease in risk models has been advocated (8) and aided by recent proliferation of
genetic/genomic research which has led to the identification of
susceptibility genes and biological markers in many diseases
(9–12).
Common gene variants involved in lung cancer have
been recently identified through a number of large, collaborative,
genome-wide association studies. Susceptibility genes identified to
date include those on chromosomes 5p15.33, 6p21, and 15q24-25.1
(13–15). Apart from these, other genetic loci
have also been identified in candidate gene association studies
targeting specific molecular pathways; such as genes encoding
proteins in cell cycle control, oxidant response, apoptosis, DNA
repair, cell adhesion and airways inflammatory response (16,17).
While genomics research has been very fruitful in
identifying these common, low-risk allelic variants, there is a
growing scepticism regarding their usefulness in risk prediction.
It has been shown that risk profiles generated by common
low-moderate susceptibility loci, in a simple additive model,
provides limited discrimination (18,19).
The limited contribution of single nucleotide polymorphisms (SNPs)
to risk profiling has been partly blamed on restriction to a
limited number of significant alleles, methodological limitations
regarding assessment of model performance and statistical
approaches for incorporating the variants (19). Whilst the usual approach has been
to utilise only the significant variants for risk profiling, an
improved disease prediction may be attained by accounting for a
large ensemble of markers (20).
For the relatively few markers arising from candidate-gene studies,
incorporation of the interactive effect of these genes, through
epistasis modelling, may provide better predictions beyond that
afforded by the limited effect of multiple loci using additive
effects (21). Models including
epistatic interactions take into account the complex biological
relationships among the loci and extend the traditional method that
focuses only on additive score using a weighted or unweighted
number of risk alleles, which assume independence between the
markers (22).
In the past three decades, improvements in risk
prediction models brought about by the inclusion of markers and
genetic factors were quantified using changes in the area under the
receiving-operating characteristic curve (AUC) (23). Recently, an increasing popular
measure of evaluating improvements in risk predictions, the net
reclassification improvement was introduced (24). This measure involves
cross-tabulating categories of predicted risk for 2 models, usually
one with the new marker under study and the other without it, to
see how persons are classified differently when these models are
used (25).
In this study, we investigated the presence of
epistasis among a panel of SNPs previously validated individually
in lung cancer (26) and used both
area under the receiver operating characteristic (AUC) analysis and
net reclassification improvement (NRI) to assess the contribution
of adding an interactive epistatic effect to an extensively
validated clinical-based risk model for lung cancer.
Materials and methods
Study population
This study was performed as part of the Liverpool
Lung Project (LLP). Details of recruitment procedure, study design
and validation have been previously reported (3,27).
Briefly, incident cases of histologically or cytologically
confirmed lung cancer, ages between 20 and 80 years, were included.
Lung cancer included any of topographical subcategories of code C34
of the International Classification of Disease for Oncology 9th
revision. Two population controls per case, matched on year of
birth (±2 years) and gender, were selected from registers of
general practitioners in Liverpool area. All participants were
Caucasians, residents in the Liverpool area. The study protocol was
approved by the Liverpool Research Ethics Committee, and all
research participants provided written informed consent in
accordance with the Declaration of Helsinki.
In this study, we utilised complete genotype data on
individuals included in the independent validation of SNPs
identified in a candidate-gene genetic association study (26). The data comprises of 2385 subjects
(cases=718, controls=1667) selected from individuals recruited into
the LLP between 2000 and 2008. Of this number, 1362 (cases=418 and
controls=914) were included in LLP case-control data used to
develop the LLP risk model (3).
Data on epidemiological, clinical and lifestyle factors were
collected using a standardised questionnaire supplemented with
hospital case note reviews conducted by trained LLP research
nurses. Information documented includes: patients smoking status
(smoking duration), previous history of pulmonary diseases
(pneumonia, COPD and bronchitis), previous history of malignant
diseases excluding skin melanoma, occupational exposure to
asbestos, family history of lung cancer with age at onset, and case
diagnosis details (date of diagnosis, histological subtype and
staging).
Genetic data consist of 20 SNPs independently
validated from 157 SNPs screened in a candidate-gene discovery
study; details of selection and genotyping have been described
elsewhere (26). Briefly, 157
candidate SNPs were screened in a discovery cohort of 439 subjects
(200 controls and 239 lung cancer cases), which identified 30 SNPs
associated with either the healthy smokers (protective) or lung
cancer (susceptibility) phenotype. After genotyping this 30 SNP
panel in a validation cohort of 491 subjects (248 controls and 207
lung cancers) and, using the same protective and susceptibility
genotypes from the discovery cohort, a 20 SNP panel were selected
based on replication of SNP associations in the validation cohort
that includes variants in the metabolism of smoking-derived
carcinogens (NAT2 and CYP2E1), inflammatory cytokines [interleukins
1(IL1B), 8(IL8), and 18(IL18), tissue necrosis factor α1 receptor
(TNFR1), toll-like receptor 9 (TLR9)], smoking addiction [dopamine
D2 receptor (DRD2) and Dopamine transporter 1(DAT1)], nicotine
dependency [α5-nAChR (CHRNA3)], antioxidant response to smoking [α1
anti-chymotrypsin (SERPINA3) and extracellular super-oxide
dismutase (SOD3)], cell cycle control, DNA repair and apoptosis
(XPD, TP73, Bcl-2, FasL, Cerb1, and REV1) and integrins (ITGA11,
ITGB3) implicated in apoptosis. Genomic DNA was extracted from
whole blood samples by standard salt-based methods and purified
genomic DNA was aliquoted (10 ng/μl concentration) into 96-well
plates. Genotyping was performed on a Sequenom™ system (Sequenom
Autoflex Mass Spectrometer and Samsung 24 pin nanodispenser)
(26).
Statistical analysis
Characteristics of the subjects in the cases and
controls were compared using t-test for continuous variables and
χ2 test or Fisher's exact test for discrete variables as
appropriate. Genotype and allele frequencies were checked for each
SNP for Hardy-Weinberg equilibrium (HWE).
Identification of SNPs epistasis
The multifactor dimensionality reduction (MDR) and
random forest (RF) were used to investigate gene-gene interactions
by identifying SNP combinations that provide the best
discrimination of the status of the subjects. MDR is a
non-parametric, model-free method that utilises a constructive
induction technique to collapse high-dimensional genetic data into
a single dimension (28,29). It pools multi-locus genotypes into
high and low risk groups using an exhaustive search to identify
optimal combination of polymorphisms, which can then be evaluated
for its ability to classify or predict disease status. In our
implementation of MDR, three separate genotypes were analysed for
each SNP. The Relief-F algorithm as implemented in the MDR was used
as a first approach to select among the 20 SNPs that are most
likely to interact. An exhaustive search of all possible 1–5 loci
were then explored using 10-fold cross validation as described by
Hahn et al (28).
Cross-validation allows estimation of the prediction error by
leaving out a portion of the data as an independent test set. With
10-fold cross-validation, the data are divided into 10 equal parts,
the model was developed on 9/10 of the data (i.e. the training
data) and then evaluated on the remaining 1/10 of the data (i.e.
the independent testing data). This is repeated for each possible
9/10 and 1/10 of the data and the resulting ten prediction errors
are averaged (29). MDR, then,
seeks to find the single-locus or multi-locus predictor(s) for
explaining the outcome (based on a balanced accuracy measure - the
arithmetic mean of sensitivity and specificity), based on the
available genomic information (30). The prediction accuracy and
cross-validation consistency defined as the number of
cross-validation replicates (partitions) in which that same n-locus
predictor(s) was chosen as the best predictor of lung cancer status
i.e. the number of replicates in which it minimised the
classification error were used to select the best SNPs in each 1 to
5-locus combination (31). The
overall best SNP classifier of lung cancer status was selected as
the one with the maximum prediction accuracy and cross-validation
consistency and evaluated statistically using 1000-fold permutation
test.
For comparison, we used the freely available Willows
software package for generating RF (32). RF ranks variables by a variable
importance index, a measure which reflects the ‘importance’ of a
variable on the basis of the classification accuracy, while
considering the interaction among variables (33). A classification tree was built by
the recursive partitioning method; each tree is constructed using a
different cohort of bootstrap samples from the original cohort.
Approximately one-third of the samples are left out of the
bootstrap (oob) samples and hence not used in the construction of
the tree. The number of trees was set to 10,000 and the default
values of the other parameters as provided by the program were
used. Several classification trees were created with replacement
from the original data imput into the program. To determine the
importance of an SNP, first the values of the SNP in the oob
samples are randomly permuted; then both the original oob samples
and the permuted oob samples are classified by the corresponding
tree. The difference in the correct classification rates between
the original and permuted oob samples determines the importance of
the SNP, and the variable importance is obtained by averaging the
differences over all trees in the random forest (32,34).
Risk model predictions and incorporation
of SNPs epistasis
Risk prediction was performed using the same risk
factors included in the LLP risk model (3). Multivariable logistic regression was
employed to generate estimates of predicted 5-year absolute risk of
lung cancer in i) a model with epidemiological data and ii) an
extended model with both genetic and epidemiological data. The
baseline risk (α, the constant term in the regression model) for
the prediction of 5-year absolute risk using the extended model
with both genetic and epidemiological data was recalculated. The
method for calculating the baseline α from age- and gender-specific
lung cancer incidence rates from the Liverpool area has been
described (3). The only difference
is that the probability model now includes information on rs1799732
(DRD2), rs5744256 (IL-18) and rs2306022 (ITGA11).
The area under the receiver-operating
characteristics (AUC) was used to i) assess the discriminatory
ability of the models, and ii) compare the models with and without
SNPs. The increase in AUC was evaluated and tested for significance
using DeLong test (35).
Furthermore, the net reclassification improvement (NRI) was used to
assess the added discrimination offered by the addition of SNPs to
the risk model (24).
Bootstrapping techniques were utilised for internal validation of
the models (36). Bootstrap
samples were drawn 1000 times to adjust model parameters for
overfitting. Improvement in model calibration was assessed using
Akaike information criteria (AIC) and Bayesian information criteria
(BIC). Unless otherwise stated, all analyses were performed using R
version 3.1.1 and STATA® version 13.1 (StataCorp LP,
College Station, TX, USA).
Results
Seven hundred and eighteen cases and 1667 population
controls were successfully genotyped for 20 SNPs, which had been
independently validated from 157 SNPs screened in a candidate-gene
discovery study (26). Table I presents the general demographic
and clinical characteristics of the study population. Men
constituted the majority of the study population cases (57.7%) and
(58.1%) controls. The proportion of ever smokers was significantly
higher in cases (93.2%) compared with controls (65.2%). Significant
differences were observed in other risk factors including smoking
duration, prior diagnosis of pneumonia, occupational exposure to
asbestos, and prior diagnosis of tumour (P<0.001).
 | Table IEpidemiology, clinical and lifestyle
characteristics of the subjects by case-control status. |
Table I
Epidemiology, clinical and lifestyle
characteristics of the subjects by case-control status.
|
Characteristics | Case (n=718) | Control
(n=1667) | All subjects
(n=2385) |
|---|
| Age (yrs.) |
| <60 | 162 (22.6) | 457 (27.41) | 619 (25.9) |
| 60–70 | 264 (36.8) | 647 (38.8) | 911 (38.2) |
| 70+ | 292 (40.7) | 563 (33.8) | 855 (35.9 |
| Gender |
| Male | 414 (57.7) | 969 (58.1) | 1383 (58.0) |
| Female | 304 (42.3) | 698 (41.9) | 1002 (42.0) |
| Smoking
statusa |
| Never | 43 (6.0) | 575 (34.5) | 618 (25.9) |
| Former | 316 (44.0) | 820 (49.2) | 1136 (47.6) |
| Current | 353 (49.2) | 267 (16.0) | 620 (26.0) |
| Smoking duration
(yrs.)a |
| Never | 43 (6.0) | 575 (34.5) | 618 (25.9) |
| 1–20 | 38 (5.3) | 341 (20.5) | 379 (15.9) |
| 21–40 | 175 (24.4) | 440 (26.4) | 615 (25.8) |
| 41–60 | 399 (55.6) | 278 (16.7) | 677 (28.4) |
| >60 | 51 (7.1) | 27 (1.6) | 78 (3.3) |
| Previous
pneumoniaa |
| Yes | 105 (14.6) | 243 (14.6) | 348 (14.6) |
| No | 590 (82.2) | 1420 (85.2) | 2010 (84.3) |
| Previous
malignant |
| Yes | 183 (26.3) | 38 (2.3) | 221 (9.4) |
| No | 512 (73.7) | 1625 (97.7) | 2136 (90.6) |
| Asbestos
exposurea |
| Yes | 134 (18.7) | 158 (9.5) | 292 (12.2) |
| No | 395 (55.0) | 1505 (90.3) | 1900 (79.7) |
| Family lung CA |
| No history | 566 (78.8) | 1348 (80.9) | 1914 (80.3) |
| Early onset | 74 (10.3) | 101 (6.1) | 175 (7.3) |
| Late onset | 78 (10.9) | 218 (13.0) | 296 (12.4) |
| Histology |
| Squamous cell
carcinoma | 239 (33.3) | - | |
|
Adenocarcinoma | 228 (31.8) | - | |
| Small cell | 87 (12.1) | - | |
| NSCLC | 77 (10.7) | - | |
| Other | 87 (12.1) | - | |
Table II presents
the results of additive gene-dosage model for all SNPs.
Heterozygosity for rs1799732 (DRD2), rs5744256 (IL-18) and
rs2306022 (ITGA11) conferred an increased risk for lung cancer in
reference to the wild-type genotype [OR 1.74 (95% CI 1.31–2.32);
1.42 (95% CI 1.16–1.72) and 2.53 (95% CI 2.06–3.12), respectively].
The homozygote genotype for rs16969968 (CHRNA3/5), rs13181 (ERCC2),
rs5744256 (IL-18) and rs2306022 (ITGA11) increased the risk of
developing lung cancer with reference to the wild-type [OR 1.46
(95% CI 1.11–1.93); 1.46 (95% CI 1.13–1.89); 4.07 (95% CI
3.11–5.31) 4.09 (95% CI 2.21–7.56), respectively].
| Table IIUnivariable analysis of associations
between 20 candidate SNPs and lung cancer (33). |
Table II
Univariable analysis of associations
between 20 candidate SNPs and lung cancer (33).
| SNP | Chromosome | Gene | Genotype | Additive model
assumption |
|---|
|
|---|
| Wilda | Heterozygote | Homozygote |
|---|
|
|
|
|
|---|
| ca/co (%) | ca/co (%) | OR (95% CI) | ca/co (%) | OR (95% CI) |
P-valuetrend |
|---|
| rs2279115 | 18q21.3 | Bcl-2 | 30.1/29.0 | 49.0/50.4 | 0.91 (0.75,
1.11) | 20.1/20.6 | 0.91 (0.71,
1.17) | 0.91 |
| rs10115703 | 9p22.3 | Cerb1 | 86.2/84.7 | 12.7/14.6 | 0.85 (0.66,
1.10) | 1.1/0.7 | 1.66 (0.66,
4.15) | 0.21 |
| rs16969968 | 15q25.1 | α5-nAChR | 40.1/44.9 | 45.7/44.1 | 1.16 (0.96,
1.40) | 14.2/10.9 | 1.46 (1.11,
1.93) | 0.012 |
| rs2031920 | 10q26.3 | CYP2E1 | 94.7/94.7 | 5.2/5.2 | 0.99 (0.67,
1.47) | 0.1/0.1 | 1.16 (0.11,
12.8) | 0.71 |
| rs6413429 | 5p15.33 | DAT1 | 87.2/86.4 | 12.5/13.3 | 0.93 (0.72,
1.21) | 0.3/0.3 | 0.92 (0.18,
4.76) | 0.74 |
| rs1799732 | 11q23.2 | DRD2 | 79.5/79.4 | 13.0/7.4 | 1.74 (1.31,
2.32) | 7.5/13.1 | 0.57 (0.42,
0.78) | 0.30 |
| rs13181 | 19q13.32 | XPD(ERCC2) | 38.6/39.9 | 43.3/47.3 | 0.95 (0.78,
1.15) | 18.1/12.8 | 1.46 (1.13,
1.89) | 0.10 |
| rs763110 | 1q24.3 | FasL | 42.5/40.2 | 43.4/46.6 | 0.88 (0.73,
1.07) | 14.1/13.2 | 1.00 (0.77,
1.32) | 0.27 |
| rs5744256 | 11q23.1 | IL18 | 32.7/47.2 | 43.7/44.5 | 1.42 (1.16,
1.72) | 23.6/8.3 | 4.07 (3.11,
5.31) | <0.0001 |
| rs16944 | 2q13 | IL1B | 42.9/46.1 | 44.7/43.2 | 1.11 (0.92,
1.34) | 12.4/10.7 | 1.24 (0.93,
1.65) | 0.24 |
| rs4073 | 4q13.3 | IL8 | 27.6/29.9 | 51.3/47.4 | 1.17 (0.96,
1.44) | 21.7/22.7 | 1.01 (0.79,
1.30) | 0.50 |
| rs2306022 | 15q23 | ITGA11 | 65.9/83.6 | 30.6/15.4 | 2.53 (2.06,
3.12) | 3.5/1.0 | 4.09 (2.21,
7.56) | <0.0001 |
| rs2317676 | 17q21.32 | ITGB3 | 87.9/87.5 | 11.6/12.2 | 0.95 (0.72,
1.24) | 0.6/0.3 | 1.54 (0.43,
5.48) | 0.88 |
| rs1799930 | 8p22 | NAT2 | 50.3/48.4 | 39.4/42.7 | 0.89 (0.74,
1.07) | 10.3/8.9 | 1.12 (0.82,
1.52) | 0.95 |
| rs3087386 | 2q11.2 | REV1 | 31.6/31.4 | 49.7/49.4 | 0.99 (0.82,
1.22) | 18.7/19.3 | 0.96 (0.75,
1.24) | 0.63 |
| rs4934 | 14q32.13 | SERPINA3 | 26.9/27.3 | 50.3/49.2 | 1.04 (0.84,
1.28) | 22.8/23.5 | 0.99 (0.77,
1.26) | 0.99 |
| rs1799895 | 4p15.2 | SOD3 | 96.7/97.2 | 3.3/2.7 | 1.25 (0.75,
2.06) | 0.0/0.1 | - | 0.44 |
| rs5743836 | 3p21.2 | TLR9 | 71.2/69.0 | 25.4/28.1 | 0.88 (0.72,
1.07) | 3.5/2.9 | 1.15 (0.70,
1.88) | 0.24 |
| rs1139417 | 12p13.31 | TNFR1 | 32.0/31.5 | 49.3/50.8 | 0.96 (0.78,
1.16) | 18.7/17.8 | 1.03 (0.80,
1.34) | 0.96 |
| rs2273953 | 1p36.33 | TP73 | 58.5/62.8 | 35.5/31.7 | 1.20 (0.99,
1.45) | 6.0/5.5 | 1.17 (0.80,
1.70) | 0.11 |
Table III
summarises the result obtained from the MDR analysis investigating
epistatic effects among the SNPs. The best candidate classifiers of
lung cancer status based on five SNP loci selected using the
cross-validation consistency, training and testing accuracy were as
follows: Single locus: rs2306022 (ITGA11); 2 loci: rs5744256
(IL-18), rs2306022 (ITGA11); 3 loci: rs1799732 (DRD2),
rs5744256(IL-18), rs2306022 (ITGA11); 4 loci: rs1696998 (CHRNA3/5),
rs1799732 (DRD2), rs5744256 (IL-18), rs2306022 (ITGA11); 5 loci:
rs1799732 (DRD2), rs763110 (FasL), rs5744256 (IL-18), rs4073
(IL-8), rs2306022 (ITGA11). The 3 loci consisting of SNPs rs1799732
(DRD2), rs5744256 (IL-18) and rs2306022 (ITGA11) appears to be the
overall best classifier of lung cancer status. These loci had
training and testing accuracy of 0.6592 and 0.6572 respectively,
and the cross validation consistency of 10/10 (model selected as
the best of 3 in 10 CV) P<0.0001 (permutation test).
| Table IIIComparison of different Multi-locus
SNP combinations using MDR. |
Table III
Comparison of different Multi-locus
SNP combinations using MDR.
| Model of
inheritance | No. of loci | Selected SNPs in
selected best model | Cross Validation
consistency (CV) | Balanced training
accuracy | Balanced testing
accuracy |
|---|
| Additive
effect | 1 |
ITGA11_rs2306022 | 10/10 | 0.5886 | 0.5886 |
| 2 |
IL18_rs5744256
ITGA11_rs2306022 | 10/10 | 0.6418 | 0.6418 |
| 3 |
DRD2_rs1799732
IL18_rs5744256
ITGA11_rs2306022 | 10/10 | 0.6575 | 0.6538 |
| 4 |
CHRNA3_A5_rs16969968
DRD2_rs1799732
IL18_rs5744256
ITGA11_rs2306022 | 4/10 | 0.6652 | 0.6321 |
| 5 | DRD2_rs1799732
FASL_rs763110
IL18_rs5744256 IL8_rs4073
ITGA11_rs2306022 | 6/10 | 0.6869 | 0.6178 |
Table IV shows the
importance score results in the RF. RF ranks variables by a
variable importance index, which is an indication of the importance
of a variable on the basis of classification accuracy while
considering interaction among variables. The three SNPs [rs1799732
(DRD2), rs5744256 (IL-18) and rs2306022 (ITGA11)] selected as the
overall best classifier of lung cancer status in MDR were also
ranked top 3 by RF using variable importance index.
| Table IVImportance score results in the
random forest. |
Table IV
Importance score results in the
random forest.
| SNP | Gene name | Variable
importance |
|---|
| rs5744256a | IL18 | 18.0783 |
| rs2306022a | ITGA11 | 14.2703 |
| rs1799732a | DRD2 | 4.4401 |
| rs4934 | SERPINA3 | 2.8533 |
| rs13181 | XPD(ERCC2) | 2.7543 |
| rs16969968 | α5-nAChR | 2.4906 |
| rs16944 | IL1B | 2.1737 |
| rs1139417 | TNFR1 | 1.5054 |
| rs2273953 | TP73 | 1.4667 |
| rs3087386 | REV1 | 1.4185 |
| rs1799930 | NAT2 | 1.1701 |
| rs10115703 | Cerb1 | 0.9366 |
| rs2279115 | Bcl-2 | 0.8465 |
| rs5743836 | TLR9 | 0.7407 |
| rs4073 | IL8 | 0.6093 |
| rs763110 | FasL | 0.4508 |
| rs2317676 | ITGB3 | 0.0477 |
| rs2031920 | CYP2E1 | −0.048 |
| rs1799895 | SOD3 | −0.1922 |
| rs6413429 | DAT1 | −0.3696 |
Table V summarises
reclassifications for cases and controls using epidemiological
model and models with SNPs [rs1799732 (DRD2), rs5744256 (IL-18) and
rs2306022 (ITGA11)]. Subjects were categorised into three different
thresholds; low-risk (<0.91), intermediate risk (0.91 to 5.12),
and high-risk (>5.12) groups. The threshold values were defined
from the predicted 5-year absolute risks for the original LLP
control samples (n=1,272), assuming the risk distribution in this
group is similar to that of the general Liverpool population. The
upper threshold (5.12) corresponds to the value for the top 20% of
predicted absolute risks in the population; individuals whose
5-year predicted absolute risk is equal to or above this value are
designated as ‘high risk’ group. The lower threshold value of 0.91
corresponds to the bottom 40% of absolute risks in the control
population and represents the ‘low risk’ group. This definition of
high risk and low risk groups was used in an earlier study
(13). Overall, 42.7% of cases
(311/727) and 35.7% of controls (592/1657) had their predicted
risks re-classified into other risk groups when SNPs were
incorporated into risk prediction model. This reclassification
showed improvement (upward shift) in approximately 25% of cases and
became worse (downward shift) for 18% resulting in a net gain of
~6%. The net gain was higher for controls (10%) with overall
improvement in risk (downward shift) for 23% and worse performance
(upward shift) for 13%. The NRI was estimated at 13.5%
(P<0.001).
| Table VReclassification of predicted risk
for cases and controls using the epidemiological model and extended
model with rs1799732 (DRD2), rs5744256 (IL-18) and rs2306022
(ITGA11). |
Table V
Reclassification of predicted risk
for cases and controls using the epidemiological model and extended
model with rs1799732 (DRD2), rs5744256 (IL-18) and rs2306022
(ITGA11).
| Epidemiological
model | Extended model with
rs1799732 (DRD2), rs5744256 (IL-18) and rs2306022 (ITGA11) | Total |
|---|
|
|---|
| <0.91% | 0.91 to 2.5% | >2.5 to
5.12% | >5.12% |
|---|
| Cases |
| <0.91% | 69 (57.5) | 43 (35.8) | 8 (6.7) | 0 (0) | 120 |
| 0.91 to 2.5% | 15 (12.4) | 46 (38.0) | 46 (38.0) | 14 (11.6) | 121 |
| >2.5 to
5.12% | 0 (0) | 43 (26.7) | 49 (30.4) | 69 (42.9) | 161 |
| >5.12 | 2 (0.6) | 9 (2.8) | 62 (19.1) | 252 (77.5) | 325 |
| Total | 86 | 141 | 165 | 335 | 727 |
| Controls |
| <0.91% | 726 (89.9) | 77 (9.5) | 4 (0.5) | 1 (0.1) | 808 |
| 0.91 to 2.5% | 180 (45.0) | 147 (36.7) | 58 (14.5) | 15 (3.8) | 400 |
| >2.5 to
5.12% | 20 (8.8) | 85 (37.4) | 70 (30.8) | 52 (22.9) | 227 |
| >5.12% | 3 (1.3) | 29 (13.1) | 68 (30.6) | 122 (55.0) | 222 |
| Total | 929 | 338 | 200 | 190 | 1657 |
Table VI depicts
the odds ratios (OR) and 95% confidence intervals (95% CI) of the
multivariate logistic regression models for the epidemiological
model and the extended model with SNPs. The ORs and 95% CI for both
models were comparable which suggests the absence of any serious
confounding effects of SNPs on the relationship between each of the
other clinical and epidemiological risk factors and lung cancer
risk. Model fit was assessed using Akaike information criterion
(AIC) and Bayes information criteria (BIC). There was an
improvement in model fit as indicated by the reduction of the AIC
from 2098.42 from the epidemiological model to 1930.14 for the
extended model with SNPs. Likewise, a similar reduction was
observed in BIC from 2167.75 from the epidemiological model to
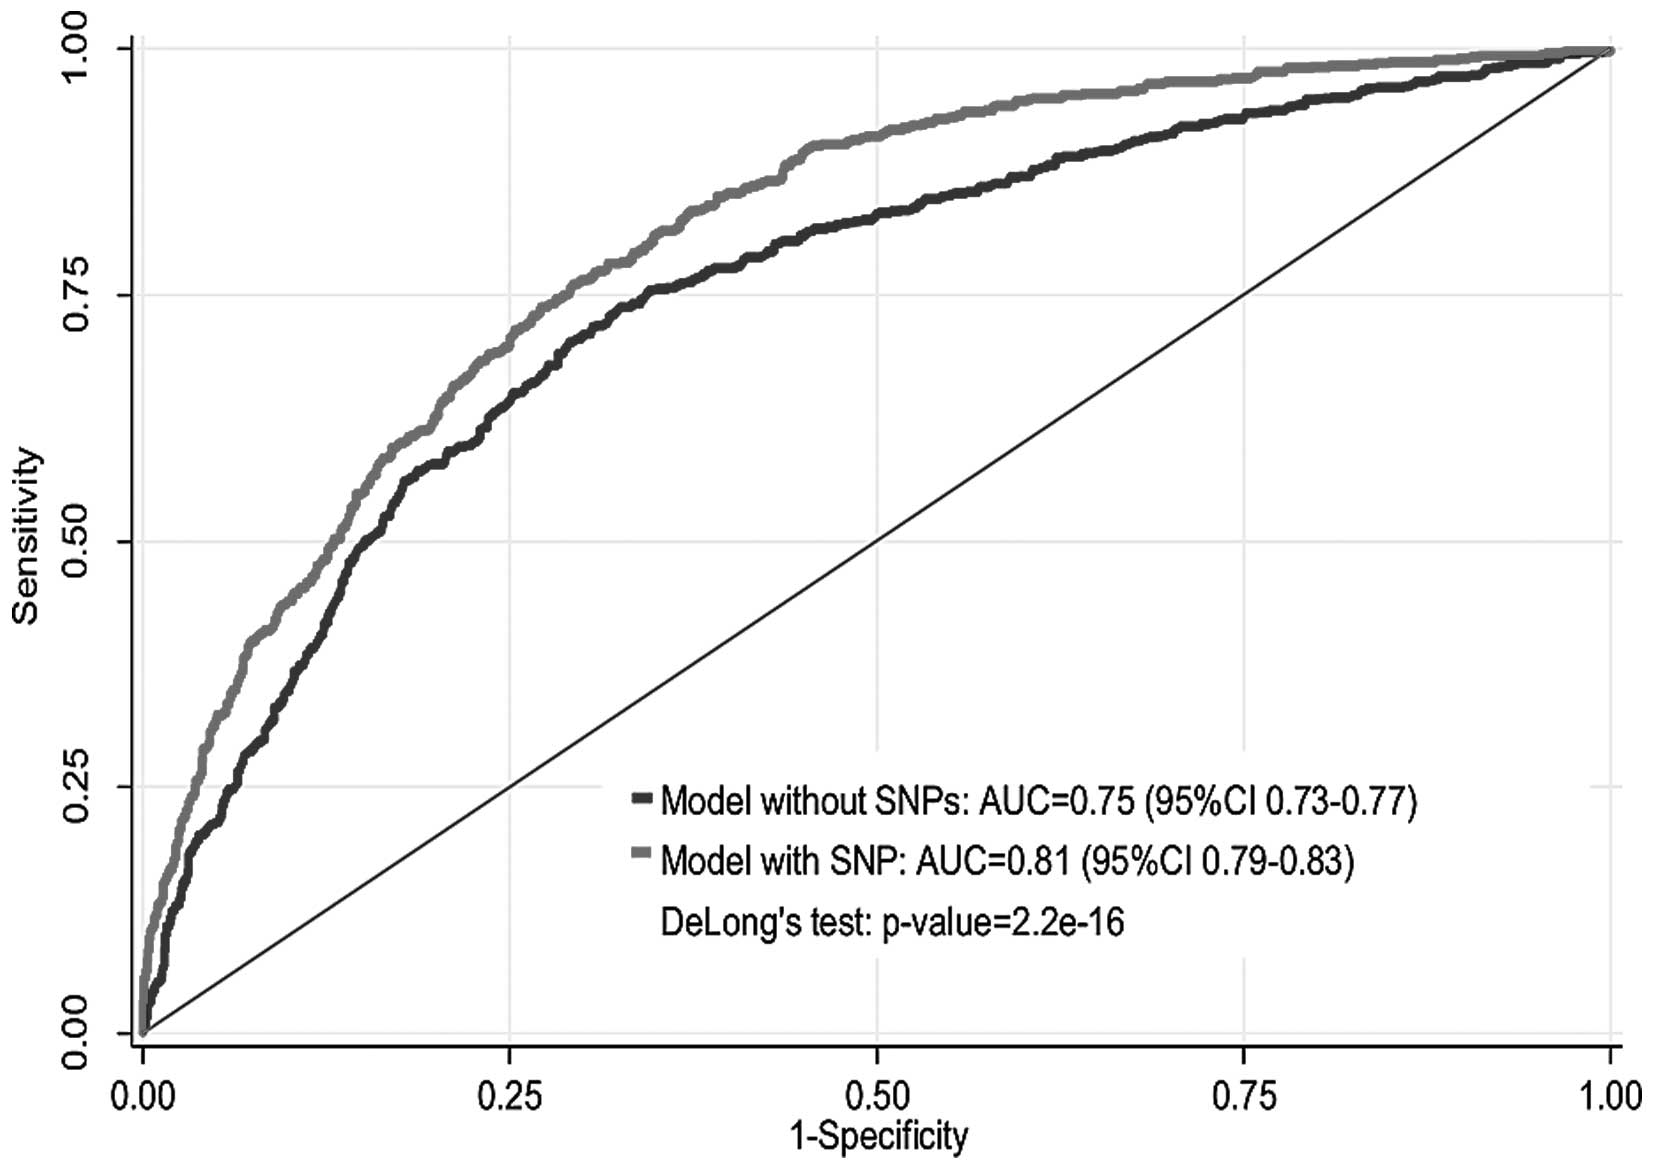
2016.80 for the extended model with SNPs. Fig. 1 shows the AUC of the
epidemiological model and extended model with SNPs. The apparent
AUC of the epidemiological model without SNPs was 0.75 (95% CI
0.73–0.77). When epistatic data were incorporated in the extended
model, the AUC increased to 0.81 (95% CI 0.79–0.83) which
corresponds to 8% increase in AUC for the model with SNPs (DeLong's
test P=2.2e-16). After correction for optimism, the AUC
was 0.73 for the epidemiological model and 0.79 for the extended
model.
| Table VISummary of multivariable risk model
for the epidemiological model and the extended model with rs1799732
(DRD2), rs5744256 (IL-18) and rs2306022 (ITGA11). |
Table VI
Summary of multivariable risk model
for the epidemiological model and the extended model with rs1799732
(DRD2), rs5744256 (IL-18) and rs2306022 (ITGA11).
| Epidemiological
model | Extended model with
SNPs |
|---|
|
|
|
|---|
| Covariates | OR (95%CI) | P-values | OR (95%CI) | P-values |
|---|
| Age | 1.01
(0.99–1.02) | 0.312 | 1.00
(0.99–1.02) | 0.610 |
| Gender | 1.24
(0.95–1.63) | 0.107 | 1.14
(0.87–1.52) | 0.340 |
| Smoking duration
(years) |
| None | 1.00 | | 1.00 | |
| 1–19 | 1.41
(0.82–2.42) | 0.209 | 1.23
(0.69–2.18) | 0.476 |
| 20–39 | 4.30
(2.81–6.57) | <0.001 | 4.90
(3.10–7.73) | <0.001 |
| 40–59 | 11.12
(5.41–22.86) | <0.001 | 15.70
(7.22–34.14) | <0.001 |
| ≥60 | 13.91
(9.26–20.91) | <0.001 | 18.58
(11.90–29.01) | <0.001 |
| Pneumonia | 1.53
(1.12–2.09) | 0.007 | 1.55
(1.11–2.15) | 0.008 |
| Asbestos | 3.25
(2.34–4.52) | <0.001 | 3.10
(2.19–4.39) | <0.001 |
| Previous
tumour | 16.97
(11.25–25.61) | <0.001 | 16.52
(10.79–25.31) | <0.001 |
| Family history of
lung cancer |
| None | 1.00 | | | |
| Early onset
(<60 years) | 1.33
(0.84–2.09) | 0.223 | 1.11
(0.69–1.80) | 0.659 |
| Late onset (≥60
years) | 1.07
(0.76–1.54) | 0.672 | 1.14
(0.78–1.66) | 0.495 |
| rs1799732 | | | 0.78
(0.63–0.97) | 0.028 |
| rs5744256 | | | 2.04
(1.69–2.46) | <0.001 |
| Rs2306022 | | | 4.04
(3.10–5.26) | <0.001 |
| Goodness of fit
statistic |
| AIC | 2098.42 | | 1930.14 | |
| BIC | 2167.75 | | 2016.80 | |
Discussion
This study demonstrates the use of comprehensive
analytical techniques for investigating the contribution of adding
an interactive effect of a panel of genetic markers (SNPs) to the
prediction of individual absolute risk of developing lung cancer,
using a risk model similar to the LLP model (3). Using genotype data from 2385
individuals included in the independent validation of SNPs
identified in a candidate-gene genetic association study from the
LLP case-control study, we found the 3 loci genotype interaction
rs2306022 (ITGA11), rs5744256 (IL-18) and rs1799732 (DRD2) provided
the best classifier of disease status using both MDR and RF. Adding
these SNPs to a clinically-based lung cancer risk model lead to an
increase in AUC (0.75 to 0.81); and increase in net
reclassification (NRI=17.5%).
We utilised two different approaches; discrimination
and reclassification to evaluate the contribution of adding an
interactive epistatic effect to a risk model for lung cancer. AUC
is the most popular metric used for measuring the discriminatory
power of a model to correctly classify subjects with or without a
disease. Our result showed 8% increase in AUC (DeLong's test
P=2.2e-16) for risk prediction in the extended model
with SNPs (AUC=0.81) compared with the epidemiological model
without SNPs (AUC=0.75), which is higher than that reported by Li
et al (9). Li et al,
in a Chinese case-control study, genotyped five SNPs identified in
Genome Wide Association study of 5068 subjects. The genetic risk
scores based on these SNPs were estimated by two approaches: a
simple risk alleles count (cGRS) and a weighted method (wGRS).
Their AUC in combination with the bootstrap resampling method was
used to assess the predictive performance of the genetic risk score
for lung cancer. Smoking history contributed significantly to lung
cancer (P<0.001) risk [AUC=0.619 (0.603–0.634)], and
incorporated with wGRS gave an AUC value of 0.639 (0.621–0.652)
after adjustment for over-fitting (9). For clinical risk prediction, it is
expedient that a new risk model correctly classify individuals into
higher or lower risk categories (37). Pencina et al introduced a
new metric, the NRI that assesses the improvement in model
performance by quantifying the degree of correct classification
(24). By applying the NRI, we
demonstrated that the addition of SNPs lead to a 17.5% improvement
in the risk classification of the subjects.
This study is the first to replicate the association
between the ITGA11 locus and lung cancer described by Young and
colleagues (26). ITGA11 (integrin
α11) belongs to the family of transmembrane receptors that mediate
physical interactions between cells and extracellular matrix
protein collagens (38). ITGA11 is
localised to stromal fibroblast and commonly overexpressed in
non-small cell lung cancer (NSCLC) (38). Earlier studies have reported that
the interactions of tumour cells with the stroma play a crucial
role in tumour growth, invasion, metastases, angiogenesis, and
chemoresistance (38–41). It has been shown that
carcinoma-associated fibroblasts in NSCLC express higher levels of
ITGA11. One of the factors which are affected by higher levels of
ITGA11 during tumour growth is IGF2 (38,42).
Higher levels of IGF2, in turn, can stimulate growth of tumour
epithelial cells leading to tumour progression and metastasis
(38). IL18 (Interleukin-18) is a
multifunctional cytokine (an extracellular signalling molecule)
that augments IFN-γ production and affects tumour immune response,
leukocyte recruitment, cancer proliferation, and angiogenesis
(43,44). An earlier study reported the
presence of IL-18 in induced sputum of lung cancer patients
(45). Farjadfar et al also
reported an association between IL-18 and lung cancer in a
case-control study including 73 lung cancer patients (53 squamous
carcinoma and 20 small cell lung carcinoma), and 97 healthy
regional aged-matched individuals (46). They suggested that their finding
may be attributed to the disruption of the potential of cAMP
responsive element-binding protein site and subsequent reduction in
IL-18 production as observed in other cancer types (46). Reduced production of IL-18 can
result in decreased IFN-γ synthesis, imbalanced Th1/Th2
differentiation, insufficient activation of natural killer cells
and CD8+ lymphocytes (46,47)
impairment of cancer cell apoptosis and efficient angiogenesis
(47,48). DDR2 is a receptor tyrosine kinase
that binds collagen as its endogenous ligand (49). It has been previously shown to
promote cell migration, proliferation, and survival when activated
by ligand binding and phosphorylation (49,50).
Harmmerman et al reported that DDR2 mutations are present in
4% of small cell lung carcinomas; gain-of-function mutations in
this gene are important oncogenic events and are amenable to
therapy with dasatinib (49).
However, the mechanism of this mutation is unknown.
Since epistasis is known to contribute to
unexplained genetic variation of common diseases, some genetic
variants may have a weak and insignificant independent effect, but
strong epistatic effect (biological interaction) with other
variants. The integration of genetic variants in risk prediction
models beyond the traditional epidemiological covariates have been
applauded as the way forward in lung cancer risk prediction
modelling (8). The result
presented in this study supports this notion. Genetic factors
function primarily through complex mechanisms that involve
interactions between multiple genes and environmental factors
(21,22). However, the effect of interaction
will be disregarded if the genetic effect is examined in isolation,
without taking cognisance of potential interactions with other
unknown factors (31). The
inherent nonlinearity implies that epistasis can occur among
polymorphisms even in the absence of independent effect of the
components, presenting computational intensive difficulties and
statistical challenges because an infinite number of combinations
that needs to be evaluated (21,22).
The use of nonparametric and genetic model-free machine learning
algorithms such as MDR (28,29)
and RF (32,33) have been proposed to overcome the
caveat of the traditional parametric statistics and have proven to
be useful in this study. Here we see that the addition of the three
SNPs increases the AUC, indicating that the interaction of these
loci may be important. There was an improvement in model fit, as
indicated by the reduction of the AIC and BIC. Furthermore, the
SNPs used in this study were internally validated using a two stage
design as described by Young et al (26) and the use of HWE to minimise
genotyping error are methodological advantages utilised to minimise
false positive results.
To the best of our knowledge, this is the first
study to evaluate the addition of these specific interactions of
SNPs to a lung cancer risk model. However, the result of this study
must be considered in the light of a number of limitations. First,
our prediction model used covariates in the LLP risk model but did
not include other risk factors for lung cancer such as chronic
obstructive pulmonary diseases. However, the objective of this
study is to evaluate the contribution of adding an interactive
effect of a panel of genetic SNPs to the LLP risk model and the
model has been validated in three independent external datasets
with good discrimination and calibration (27). Second, our study demonstrates how a
modest increase in AUC can lead to a substantial improvement in
reclassification as quantified by the NRI. This finding supports a
suggestion by Pencina et al that a small increase in AUC
might still be suggestive of a meaningful improvement (24). Third, the LLP comprise
predominantly Caucasians and therefore, the lack of ethnic
diversity implies that this model may be less applicable in
non-white population. Fourth, our approach to reclassification did
not distinguish between persons with competing events and those
without an event because both are classified as not having the
event of interest. Fifth, the lack of validation of the epistatic
model in an independent population is a limitation, however, the
application of bootstrap correction for optimism addresses in part
the lack of independent validation. Sixth, many of the 20 SNPs from
Table II failed to replicate in
the current study, particularly given the larger sample size (718
cases, 1667 controls) in the current study when compared with
previous study (248 cases, 207 controls). A plausible explanation
for this observation may be due to the fact that the
non-significant SNPs play lesser or no role in epistatic
interaction. Finally, our threshold values for risk classification
was based on the predicted 5-year absolute risk for original LLP
control samples but the appropriateness of these threshold values
in other populations is uncertain. Using different values could
have affected the results of our reclassification analyses and
subsequent clinical implications.
In conclusion, our result shows in principle how an
SNP epistatic factor can be incorporated into an epidemiological
risk prediction model. In this study, inclusion of SNPs rs1799732
(DRD2), rs5744256 (IL-18), rs2306022 (ITGA11) resulted in a modest
improvement in lung cancer risk prediction.
Acknowledgements
The Liverpool Lung project was principally funded by
the Roy Castle Lung Cancer Foundation, UK. M.W.M. was funded by
National Institute of Health Research Health Technology Assessment
(NIHR-HTA) under grant reference no. 09/61/01. R.P.Y. is a
stockholder and unpaid Chief Scientific Officer of Synergenz
Bioscience Inc. who hold patents on some gene markers of lung
cancer risk. For the remaining authors no conflict of interest is
declared.
References
|
1
|
Field JK, Chen Y, Marcus MW, Mcronald FE,
Raji OY and Duffy SW: The contribution of risk prediction models to
early detection of lung cancer. J Surg Oncol. 108:304–311. 2013.
View Article : Google Scholar : PubMed/NCBI
|
|
2
|
Bach PB, Kattan MW, Thornquist MD, Kris
MG, Tate RC, Barnett MJ, Hsieh LJ and Begg CB: Variations in lung
cancer risk among smokers. J Natl Cancer Inst. 95:470–478. 2003.
View Article : Google Scholar : PubMed/NCBI
|
|
3
|
Cassidy A, Myles JP, van Tongeren M, Page
RD, Liloglou T, Duffy SW and Field JK: The LLP risk model: An
individual risk prediction model for lung cancer. Br J Cancer.
98:270–276. 2008. View Article : Google Scholar
|
|
4
|
Hoggart C, Brennan P, Tjonneland A, Vogel
U, Overvad K, Østergaard JN, Kaaks R, Canzian F, Boeing H, Steffen
A, et al: A risk model for lung cancer incidence. Cancer Prev Res
(Phila). 5:834–846. 2012. View Article : Google Scholar
|
|
5
|
Park S, Nam BH, Yang HR, Lee JA, Lim H,
Han JT, Park IS, Shin HR and Lee JS: Individualized risk prediction
model for lung cancer in Korean men. PLoS One. 8:e548232013.
View Article : Google Scholar : PubMed/NCBI
|
|
6
|
Spitz MR, Hong WK, Amos CI, Wu X, Schabath
MB, Dong Q, Shete S and Etzel CJ: A risk model for prediction of
lung cancer. J Natl Cancer Inst. 99:715–726. 2007. View Article : Google Scholar : PubMed/NCBI
|
|
7
|
Tammemagi CM, Pinsky PF, Caporaso NE,
Kvale PA, Hocking WG, Church TR, Riley TL, Commins J, Oken MM, Berg
CD, et al: Lung cancer risk prediction: Prostate, Lung, Colorectal
and Ovarian Cancer Screening Trial models and validation. J Natl
Cancer Inst. 103:1058–1068. 2011. View Article : Google Scholar : PubMed/NCBI
|
|
8
|
Young RP and Hopkins RJ: Incorporating
genomic data into multivariate risk models for lung cancer. Genet
Med. 15:667–668. 2013. View Article : Google Scholar : PubMed/NCBI
|
|
9
|
Li H, Yang L, Zhao X, Wang J, Qian J, Chen
H, Fan W, Liu H, Jin L, Wang W, et al: Prediction of lung cancer
risk in a Chinese population using a multifactorial genetic model.
BMC Med Genet. 13:1182012. View Article : Google Scholar : PubMed/NCBI
|
|
10
|
Raji OY, Agbaje OF, Duffy SW, Cassidy A
and Field JK: Incorporation of a genetic factor into an
epidemiologic model for prediction of individual risk of lung
cancer: The Liverpool Lung Project. Cancer Prev Res (Phila).
3:664–669. 2010. View Article : Google Scholar
|
|
11
|
Spitz MR, Etzel CJ, Dong Q, Amos CI, Wei
Q, Wu X and Hong WK: An expanded risk prediction model for lung
cancer. Cancer Prev Res (Phila). 1:250–254. 2008. View Article : Google Scholar
|
|
12
|
Beane J, Sebastiani P, Whitfield TH,
Steiling K, Dumas YM, Lenburg ME and Spira A: A prediction model
for lung cancer diagnosis that integrates genomic and clinical
features. Cancer Prev Res (Phila). 1:56–64. 2008. View Article : Google Scholar
|
|
13
|
Young RP, Hopkins RJ, Whittington CF, Hay
BA, Epton MJ and Gamble GD: Individual and cumulative effects of
GWAS susceptibility loci in lung cancer: Associations after
sub-phenotyping for COPD. PLoS One. 6:e164762011. View Article : Google Scholar : PubMed/NCBI
|
|
14
|
Hung RJ, McKay JD, Gaborieau V, Boffetta
P, Hashibe M, Zaridze D, Mukeria A, Szeszenia-Dabrowska N,
Lissowska J, Rudnai P, et al: A susceptibility locus for lung
cancer maps to nicotinic acetylcholine receptor subunit genes on
15q25. Nature. 452:633–637. 2008. View Article : Google Scholar : PubMed/NCBI
|
|
15
|
Truong T, Hung RJ, Amos CI, Wu X,
Bickeböller H, Rosenberger A, Sauter W, Illig T, Wichmann HE, Risch
A, et al: Replication of lung cancer susceptibility loci at
chromosomes 15q25, 5p15, and 6p21: A pooled analysis from the
International Lung Cancer Consortium. J Natl Cancer Inst.
102:959–971. 2010. View Article : Google Scholar : PubMed/NCBI
|
|
16
|
Hosgood HD III, Menashe I, Shen M, Yeager
M, Yuenger J, Rajaraman P, He X, Chatterjee N, Caporaso NE, Zhu Y,
et al: Pathway-based evaluation of 380 candidate genes and lung
cancer susceptibility suggests the importance of the cell cycle
pathway. Carcinogenesis. 29:1938–1943. 2008. View Article : Google Scholar : PubMed/NCBI
|
|
17
|
Liu G, Gramling S, Munoz D, Cheng D, Azad
AK, Mirshams M, Chen Z, Xu W, Roberts H, Shepherd FA, et al: Two
novel BRM insertion promoter sequence variants are associated with
loss of BRM expression and lung cancer risk. Oncogene.
30:3295–3304. 2011. View Article : Google Scholar : PubMed/NCBI
|
|
18
|
Gail MH: Discriminatory accuracy from
single-nucleotide polymorphisms in models to predict breast cancer
risk. J Natl Cancer Inst. 100:1037–1041. 2008. View Article : Google Scholar : PubMed/NCBI
|
|
19
|
Spitz MR, Amos CI, D'Amelio A Jr, Dong Q
and Etzel C: Re: Discriminatory accuracy from single-nucleotide
polymorphisms in models to predict breast cancer risk. J Natl
Cancer Inst. 101:1731–1732. 2009.author reply 1732. View Article : Google Scholar : PubMed/NCBI
|
|
20
|
Wei Z, Sun W, Wang K and Hakonarson H:
Multiple testing in genome-wide association studies via hidden
Markov models. Bioinformatics. 25:2802–2808. 2009. View Article : Google Scholar : PubMed/NCBI
|
|
21
|
Moore JH and Williams SM: Epistasis and
its implications for personal genetics. Am J Hum Genet. 85:309–320.
2009. View Article : Google Scholar : PubMed/NCBI
|
|
22
|
Pan Q, Hu T and Moore JH: Epistasis,
complexity, and multi-factor dimensionality reduction. Methods Mol
Biol. 1019:465–477. 2013. View Article : Google Scholar
|
|
23
|
Hanley JA and McNeil BJ: The meaning and
use of the area under a receiver operating characteristic (ROC)
curve. Radiology. 143:29–36. 1982. View Article : Google Scholar : PubMed/NCBI
|
|
24
|
Pencina MJ, D'Agostino RB Sr, D'Agostino
RB Jr and Vasan RS: Evaluating the added predictive ability of a
new marker: from area under the ROC curve to reclassification and
beyond. Stat Med. 27:157–172. 2008. View
Article : Google Scholar
|
|
25
|
Leening MJ, Vedder MM, Witteman JC,
Pencina MJ and Steyerberg EW: Net reclassification improvement:
computation, interpretation, and controversies: a literature review
and clinician's guide. Ann Intern Med. 160:122–131. 2014.
View Article : Google Scholar : PubMed/NCBI
|
|
26
|
Young RP, Hopkins RJ, Hay BA, Epton MJ,
Mills GD, Black PN, Gardner HD, Sullivan R and Gamble GD: Lung
cancer susceptibility model based on age, family history and
genetic variants. PLoS One. 4:e53022009. View Article : Google Scholar : PubMed/NCBI
|
|
27
|
Raji OY, Duffy SW, Agbaje OF, Baker SG,
Christiani DC, Cassidy A and Field JK: Predictive accuracy of the
Liverpool Lung Project risk model for stratifying patients for
computed tomography screening for lung cancer: A case-control and
cohort validation study. Ann Intern Med. 157:242–250. 2012.
View Article : Google Scholar : PubMed/NCBI
|
|
28
|
Hahn LW, Ritchie MD and Moore JH:
Multifactor dimensionality reduction software for detecting
gene-gene and gene-environment interactions. Bioinformatics.
19:376–382. 2003. View Article : Google Scholar : PubMed/NCBI
|
|
29
|
Moore JH, Gilbert JC, Tsai CT, Chiang FT,
Holden T, Barney N and White BC: A flexible computational framework
for detecting, characterizing, and interpreting statistical
patterns of epistasis in genetic studies of human disease
susceptibility. J Theor Biol. 241:252–261. 2006. View Article : Google Scholar : PubMed/NCBI
|
|
30
|
Motsinger AA and Ritchie MD: The effect of
reduction in cross-validation intervals on the performance of
multifactor dimensionality reduction. Genet Epidemiol. 30:546–555.
2006. View Article : Google Scholar : PubMed/NCBI
|
|
31
|
Cordell HJ: Detecting gene-gene
interactions that underlie human diseases. Nat Rev Genet.
10:392–404. 2009. View
Article : Google Scholar : PubMed/NCBI
|
|
32
|
Zhang H, Wang M and Chen X: Willows: A
memory efficient tree and forest construction package. BMC
Bioinformatics. 10:1302009. View Article : Google Scholar : PubMed/NCBI
|
|
33
|
Bureau A, Dupuis J, Falls K, Lunetta KL,
Hayward B, Keith TP and Van Eerdewegh P: Identifying SNPs
predictive of phenotype using random forests. Genet Epidemiol.
28:171–182. 2005. View Article : Google Scholar
|
|
34
|
Chen X, Wang M and Zhang H: The use of
classification trees for bioinformatics. Wiley Interdiscip Rev Data
Min Knowl Discov. 1:55–63. 2011. View
Article : Google Scholar : PubMed/NCBI
|
|
35
|
DeLong ER, DeLong DM and Clarke-Pearson
DL: Comparing the areas under two or more correlated receiver
operating characteristic curves: A nonparametric approach.
Biometrics. 44:837–845. 1988. View
Article : Google Scholar : PubMed/NCBI
|
|
36
|
Steyerberg EW, Harrell FE Jr, Borsboom GJ,
Eijkemans MJ, Vergouwe Y and Habbema JD: Internal validation of
predictive models: Efficiency of some procedures for logistic
regression analysis. J Clin Epidemiol. 54:774–781. 2001. View Article : Google Scholar : PubMed/NCBI
|
|
37
|
Cook NR: Use and misuse of the receiver
operating characteristic curve in risk prediction. Circulation.
115:928–935. 2007. View Article : Google Scholar : PubMed/NCBI
|
|
38
|
Zhu CQ, Popova SN, Brown ER,
Barsyte-Lovejoy D, Navab R, Shih W, Li M, Lu M, Jurisica I, Penn
LZ, et al: Integrin alpha 11 regulates IGF2 expression in
fibroblasts to enhance tumorigenicity of human non-small-cell lung
cancer cells. Proc Natl Acad Sci USA. 104:11754–11759. 2007.
View Article : Google Scholar : PubMed/NCBI
|
|
39
|
Bhowmick NA, Chytil A, Plieth D, Gorska
AE, Dumont N, Shappell S, Washington MK, Neilson EG and Moses HL:
TGF-beta signaling in fibroblasts modulates the oncogenic potential
of adjacent epithelia. Science. 303:848–851. 2004. View Article : Google Scholar : PubMed/NCBI
|
|
40
|
Gleave M, Hsieh JT, Gao CA, von Eschenbach
AC and Chung LW: Acceleration of human prostate cancer growth in
vivo by factors produced by prostate and bone fibroblasts. Cancer
Res. 51:3753–3761. 1991.PubMed/NCBI
|
|
41
|
Mueller MM and Fusenig NE: Friends or foes
- bipolar effects of the tumour stroma in cancer. Nat Rev Cancer.
4:839–849. 2004. View Article : Google Scholar : PubMed/NCBI
|
|
42
|
Wang KK, Liu N, Radulovich N, Wigle DA,
Johnston MR, Shepherd FA, Minden MD and Tsao MS: Novel candidate
tumor marker genes for lung adenocarcinoma. Oncogene. 21:7598–7604.
2002. View Article : Google Scholar : PubMed/NCBI
|
|
43
|
Dinarello CA: IL-18: A TH1-inducing,
proinflammatory cytokine and new member of the IL-1 family. J
Allergy Clin Immunol. 103:11–24. 1999. View Article : Google Scholar : PubMed/NCBI
|
|
44
|
Kojima H, Aizawa Y, Yanai Y, Nagaoka K,
Takeuchi M, Ohta T, Ikegami H, Ikeda M and Kurimoto M: An essential
role for NF-kappa B in IL-18-induced IFN-gamma expression in KG-1
cells. J Immunol. 162:5063–5069. 1999.PubMed/NCBI
|
|
45
|
Rovina N, Hillas G, Dima E, Vlastos F,
Loukides S, Veldekis D, Roussos C, Alhanatis M and Bakakos P: VEGF
and IL-18 in induced sputum of lung cancer patients. Cytokine.
54:277–281. 2011. View Article : Google Scholar : PubMed/NCBI
|
|
46
|
Farjadfar A, Mojtahedi Z, Ghayumi MA,
Erfani N, Haghshenas MR and Ghaderi A: Interleukin-18 promoter
polymorphism is associated with lung cancer: A case-control study.
Acta Oncol. 48:971–976. 2009. View Article : Google Scholar : PubMed/NCBI
|
|
47
|
Nakanishi K, Yoshimoto T, Tsutsui H and
Okamura H: Interleukin-18 is a unique cytokine that stimulates both
Th1 and Th2 responses depending on its cytokine milieu. Cytokine
Growth Factor Rev. 12:53–72. 2001. View Article : Google Scholar : PubMed/NCBI
|
|
48
|
Okano F and Yamada K: Canine
interleukin-18 induces apoptosis and enhances Fas ligand mRNA
expression in a canine carcinoma cell line. Anticancer Res.
20:3411–3415. 2000.PubMed/NCBI
|
|
49
|
Hammerman PS, Sos ML, Ramos AH, Xu C, Dutt
A, Zhou W, Brace LE, Woods BA, Lin W, Zhang J, et al: Mutations in
the DDR2 kinase gene identify a novel therapeutic target in
squamous cell lung cancer. Cancer Discov. 1:78–89. 2011. View Article : Google Scholar
|
|
50
|
Ford CE, Lau SK, Zhu CQ, Andersson T, Tsao
MS and Vogel WF: Expression and mutation analysis of the discoidin
domain receptors 1 and 2 in non-small cell lung carcinoma. Br J
Cancer. 96:808–814. 2007. View Article : Google Scholar : PubMed/NCBI
|