Introduction
Multiple reports in the field or endocrine oncology
have shown that in renal cell cancer (RCC) development and
progression stimulation by estrogens, androgens, testosterone,
aldosterone, or glucocorticoids are significant pathogenesis
factors (1–3). In molecular research, disturbances in
the 3,5,3′-triiodotyronine (T3) signaling pathway were described as
a possible trigger in RCC (4). In
clinical reports, an increased risk of kidney cancer was reported
in women with a history of hypothyroidism with myxedema,
thyrotoxicosis (5) or multinodular
thyroid disease (6). The molecular
background of coincidence or codependence of renal cell cancer and
thyroid disease is elusive.
In general, the signaling of thyroid hormones (THs),
including T3, is mediated by TH receptors (TRs) TRα (isoforms α1
and α2) and TRβ (isoforms β1 and β2). In cell biology, TRs function
as T3-inducible transcription factors. By controlling the
expression of specific genes, THs regulate a panel of biological
processes, including embryonic and postnatal development,
animal/human metabolism, and general organism-cell homeostasis
(7). THs influence sodium and
calcium reabsorption and renal potassium permeability, and they
affect renin release and angiotensinase activity (8,9). At
the tissue and cell levels, THs regulate differentiation,
proliferation, and apoptosis (10). In normal kidneys, THs have been
shown to play a role in renal morphogenesis and growth regulation,
renal cell differentiation, and renal cell proliferation (11). It was also reported that T3
increased the expression of the epidermal growth factor receptor
(EGFR) gene in renal tubule cells and as a result it potentiated
mitogenic stimulation of epidermal growth factor (EGF) (12). Data on the function of TRs and
impact of T3 on renal cancer is not as detailed as for the healthy
kidney and relevant in vitro and in vivo models need
to be developed.
In humans, the normal total T3 value is 1.2–3.4
nmol/l or 80–230 ng/dl, depending upon the assay conditions and the
antibody employed (13). The
normal range of serum-free T3 (active form) is 3.0–7.0 pg/ml, as
derived from mass values using a molar mass of 650.98 g/mol. At
physiological concentrations, the total free hormone value of T4
and T3 is ~0.03 and 0.20–0.4%, respectively. It results in 6 pM of
T3 and 30 pM of T4 (14). In
serum, 0.3% of T3 is free, and ~70–80% of T3 production is
accounted for by peripheral conversion of T4 to T3. One-third of
circulating T4 is converted to T3 in peripheral tissues. Tissues in
need of TH convert T4 to T3 at different rates (15). T3 is produced by extra-thyroidal
conversion of T4 by 5′-mono-deiodinase, including type I (5′DI),
which is highly expressed in the kidneys (16). The expression of 5′DI was reported
to be downregulated in RCC in comparison to that observed in normal
kidneys (17). Furthermore, RCC
patients treated with tyrosine kinase inhibitors who develop
hypothyroidism are expected to have longer progression-free
survival (PFS) and overall survival (OS) (18–20).
This observation urge the question if the direct influence of T3 on
renal cell cancer cells is involved in the mechanism of disease
control or if there is no direct cause-effect and just a
correlation of phenomena.
In cancer THs promote cancer cell proliferation,
tumor angiogenesis, and neovascularization via TRβ and activation
of its signaling pathway (21). As
reported earlier, upon stimulation of TRβ, cells secreted vascular
endothelial growth factors and basic fibroblast growth factor
(22,23). THs were also shown to play a role
in promoting radiation- and chemical-induced carcinogenesis
(24,25). TR gene deletions, mutations, and
methylation and deregulated expression of TRs protein have been
shown to be associated with the development of multiple types of
cancer, including hepatocellular carcinoma (HCC), breast, colon,
lung, and prostate cancers (26,27).
As a result, TRs have been designated as tumor suppressors.
Cancer-promoting effects of THs are mediated by downstream TR
signaling and by integrin αvβ3 signaling via
phosphatidylinositol-3-kinase (PI3K) and mitogen-activated protein
kinases (MAPK), focal adhesion kinase (FAK) and the Src tyrosine
kinases. This cell-signaling results in stimulation of angiogenesis
in the tumor (26). Indeed,
tetraidothyroacetic acid (TETRAC), a thyromimetic agonist of TRβ
that can also block the T4 integrin (αvβ3)
receptor at the cell surface, has been shown to inhibit growth of
human renal cell carcinoma xenografts (28). In the case of renal cell cancer
abnormal T3 signaling was also reported to induce overexpression of
E2F transcription factor 1 and cyclin E1 and trigger undesirable
G1/S phase progression (4), while
other functional data on T3 and RCC is currently not available.
The THRB (thyroid hormone receptor gene) has
been in the focus of RCC-related research because it is located on
the short arm of chromosome 3, in the proximity of the VHL locus, a
gene that is commonly mutated in clear-cell RCC (17). The region of common allelic losses
(VHL gene) in sporadic RCC is bordered by D3S2 marker and
THRB loci and it was in the focus of early VHL-related
research (29). A loss of
heterozygosity (LOH) analysis provided the first genetic data
supporting the significance of THRB in the development of
RCC, with the analysis revealing that more that 60% of non-familial
RCCs harbored 3p22–24.1 loss or other THRB abnormalities
(30). Large deletions of
THRB in ccRCC samples were confirmed recently in whole
genome analyses including The Cancer Genome Atlas Research Network
study (31,32). Furthermore, point mutations in TR
genes resulting in the loss of its expression have been reported in
RCC tumor samples (33). Most TR
mutations found in RCC cells result in the expression of a receptor
protein with abnormal hormone binding or co-regulator binding
potential. Mutated receptor proteins also harbor dominant negative
effect against wild-type copy of the receptor. In particular mutant
receptor T3 was shown to have affinity shifted towards selected
splice forms of silencing mediator of retinoid and thyroid
receptors (SMRT) known also as thyroid-,
retinoic-acid-receptor-associated co-repressor (34,35).
Selected TR mutants, found in RCC cells, were also reported to have
disturbed TH response element binding and on the other hand
expanded target gene specificity (34,36–38).
In addition to large deletions, the epigenetic silencing of the
THRB gene was also investigated in RCC samples, but results were
negative (31,39). Apart from genomic alternations in
THRB gene, the expression of TRs was also shown to be deregulated
at the mRNA level (40,41). In addition to the protein coding
mRNA sequence, untranslated regions (UTRs) were also shown as
mutated. Also these mutations play a significant role in the
pathogenesis of RCC, since mutations of the TRβ1 5′UTRs resulted in
acquisition of new regulatory functions of 5′UTRs. Specific motifs
of 5′UTRs and its secondary structures that modulate or/and
restrain translation efficiency. In the 3′UTR of TRβ mRNA specific
set of microRNAs is bound and affects its level through RNA
interference (RNAi) mechanism and modify THRB gene
translation. This set of miRNA is different in mutated cases
(39,41). At this point of time analysis of T3
stimulation responsiveness in renal cell cancer cells with mutated
and/or wild-type THRB is not directly available since
current reports were derived from data obtained from the
investigation of frozen RCC tissue samples (33,40,41),
transfected adult African green monkey cells (CV-1 cells) (35) or hepatocellular carcinoma (Hep2G)
cells (38). Direct analysis of
RCC cell T3 stimulation is missing. The goal of this research was
to describe the effect of T3 on RCC cells in in vivo
relevant model including physiological concentrations of hormones.
The second goal of the analysis was to correlate T3 response with
expression and mutation status of hormone receptor.
Materials and methods
Cell culture
Human kidney cancer stem cells (HKCSC, RCC-CSCs)
were obtained from Celprogen Inc. (Torrance, CA, USA). 786-0
(CRL-1932), Caki-1 (HTB46), Caki-2 (HTB-47), 769-P (CRL-1933), ACHN
(CRL-1611), primary normal renal proximal tubule epithelial cells
(PCS400010), and 293 [HEK-293] (CRL-1573) cell lines were obtained
from ATCC Global Bioresource Center (Manassas, VA, USA). SK-RC-42,
SK-RC-44, SK-RC-45, metastatic RCC cell lines were established in
the laboratory of Dr Lloyd Old, from patients undergoing
nephrectomy at Memorial Hospital of Memorial Sloan Kettering Cancer
Center and were obtained from MSKCC core facility (42). Cell lines SMKT-R2 and SMKT-R3 were
a kind gift from Professor Taiji Tsukamoto (School of Medicine,
Sapporo Medical University, Sapporo, Japan) (43). RCC6 cell line was a kind gift of
Professor Salem Chouaib (INSERM, Institut Gustave Roussy,
Villejuif, France) (44).
Human kidney cancer stem cells (HKCSC, RCC-CSCs)
(Celprogen) have been cultured in human kidney cancer stem cell
media according to the manufacturer’s protocol. In reference
experiment RCC cells were cultured in RPMI-1640 with GlutaMAX (Life
Technologies, Carlsbad, CA, USA) with 10% FBS (Biochrom GmbH,
Cambridge, UK). For hormone-level controlled experiment cells were
cultured in Gibco® FreeStyle™ 293 expression medium
(Thermo Fisher Scientific, Waltham, MA, USA), as it does not
require the addition of serum, glutamine, or surfactants, and is
T3/T4-free (Patent WO1998008934A1).
Cells were cultured both in normoxia (21%
O2) and hypoxia (2% O2) conditions. Hypoxia
was obtained with SANYO MCO-5M incubator. In parallel cells
cultured in normoxic conditions were placed in Forma Scientific
3131 incubator. After thawing cells were cultured in normoxia for
first passage for viability analysis and subsequently cultured in
hypoxia until final stimulation experiments, not earlier that
second passage after oxygen tension stabilization.
Hormonal stimulation
For hormonal stimulation 3,3′,5-triiodo-L-thyronine
sodium salt (Sigma-Aldrich, St. Louis, MO, USA) was used. TSH, T3,
T4 depleted serum (SF231–2, BBI Solutions, Cardiff, UK) was used as
a control. To block the receptor CAS 251310-57-3, thyroid hormone
receptor antagonist 1–850 (Santa Cruz Biotechnology Inc. Dallas,
TX, USA) was used as it is a cell-permeable hydrazinyl-carboxamide,
selective and high-affinity thyroid receptor antagonist, blocking
T3 (L-triiodothyronine)-mediated interaction of receptor with
nuclear receptor co-activator and blocking downstream targeted gene
expression. For drug toxicity sunitinib malate and DMSO
(Sigma-Aldrich) were used. For hormone effect cells were cultured
in RPMI 10% FBS. For high T3 stimulation cells were cultured in
RPMI 10% FBS with addition of 1 pM T3, 4 pM T3, 1 nM T3 or 100 nM
T3. As negative control RPMI 10% FBS with inhibitor T3 was used.
Inhibition effectivity was estimated in RPMI 10% FBS with inhibitor
T3 and 4 pM T3. A control, hormone-free conditions, RPMI with T3
depleted serum was used. For additional T3/T4 stimulation
experiments cells were cultured in FreeStyle medium - animal
origin-free, protein-free and chemically-defined medium. This
medium contains L-alanyl-L-Glutamine, amino acids, vitamins, and
salts. T3 stimulation was obtained in FreeStyle medium with 1 pM
T3, 4 pM T3, 1 nM T3 or 100 nM T3. As a negative control FreeStyle
with 1.5 μM T3 inhibitor was used. Inhibition effectivity was
confirmed in FreeStyle medium with 1.5 μM inhibitor T3 and 4 pM T3.
Tyrosine kinase and hormone cross effect on RCC cells was tested in
FreeStyle medium with 3 μM sunitinib and 1 pM T3, 4 pM T3, 1 nM T3
or 100 nM T3. Drug toxicity against RCC cells was tested in
FreeStyle medium with 3 μM sunitinib. FreeStyle with DMSO was used
as control of toxicity.
Cell viability analysis
AlamarBlue® (Life Technologies) was used
to estimate cell proliferation, hormone stimulation and drug
toxicity. Alamar blue measurements were performed every 24 h for 6
h with Multiskan™ GO microplate spectrophotometer (Thermo Fisher
Scientific). Cell viability and number was also confirmed with
automated cell counter ‘MOXI Z’ (Orflo Technologies, Ketchum, ID,
USA). Vybrant® MTT cell proliferation assay kit (Thermo
Fisher Scientific) was used as a method for determination of cell
number using microplate reader. MTT based determination of cell
growth rate was used in the testing of T3 stimulation.
Colony formation analysis
The influence of T3 on cell anchorage-independent
growth was analyzed with Cell Recovery Compatible StemTAG™ stem
cell colony formation assay (Cell Biolabs, Inc. San Diego, CA, USA)
according to the manufacturer’s protocol with adjustment to
differential hormone concentration in media. Cell lines were
cultured in layers of base agar matrix, cell suspension/agar
matrix, and culture media with/without T3 in 96-well plates. The
differences of potency to generate various sizes and numbers of
colonies between the cell lines was analyzed with a dissecting
microscope Delta Optical SZ-450T (Delta Optical, Nowe Osiny,
Poland) and an inverted microscope Olympus CKX41 (Shinjuku, Tokyo,
Japan).
Cell cycle analysis
Cell cycle phase determination kit (Cayman Chemical,
Ann Arbor, MI, USA) was used according to the manufacturer’s
protocol, including propidium iodide staining. For hormone
stimulated cell cycle evaluation, cells were cultured in FreeStyle
medium in 6-well plates and cultured with or without 4 pM T3 for 72
h after seeding. Flow cytometry analysis was performed with
FACSCalibur instrument (Becton-Dickinson and Co., Franklin Lakes,
NJ, USA). Analysis was performed with FlowJo single cell analysis
software (FlowJo, LLC, Ashland, OR, USA).
DNA sequencing
Sequencing service (Genomed S.A, Warsaw, Poland) was
used to analyze THRβ coding sequence (reference: CCDS ID
CCDS2641.1). Reference sequence analyzed was refereed as to
wild-type (non-mutated) (45,46).
Total RNA was isolated with Total RNA Mini Plus kit (A&A
Biotechnology, Gdynia, Poland) and quantified by Multiskan™ GO
microplate spectrophotometer (Thermo Fisher Scientific). For
reverse transcription of RNA TranScriba-qPCR master mix SYBR kit
with moloney murine leukemia virus (MuMLV) reverse transcriptase
and oligo-(dT) primer was used (A&A Biotechnology). Sequencing
primers were designed to cover all transcript variants including:
NM_000461.4, NM_001128177.1, NM_001128176.2 and NM_001252634.1.
Primers used were as follows: THRBF1, ATG+ACTCCCA
ACAGTATGACAGA;THRBR1,GGCAAAATCCACCACTC TGG; THRBF2,
AGTCAATGCCCCAGAAGGTG; THRBR2, CTAATCCTCGAACACTTCCAAGA. Sequences
were analyzed with CLC Sequence Viewer program ver. 7.0.2 (Qiagen,
Waltham, MA, USA).
RT Real-Time PCR analysis
RT-qPCR reactions were performed with FastStart
essential DNA green master kit (Roche Applied Science, Penzberg,
Germany) using the LightCycler® Nano Instrument.
Expression of thyroid hormone receptor α and β along with reference
gene peptidylprolyl isomerase A (Cyclophilin A) - PPIA - were
analyzed with subsequent primers: THRB-R, CACAGAGCTCGTCCTTGTC
TAAGTAA; THRB-F, GTGTCTCAAGTGCCCAGACCTT; THRA-F,
TGGATGACACGGAAGTGGCTCT; THRA-R, ACGCCTCCTGACTCTTCTCGA; PPIA-F,
TGTGTCA GGGTGGTGACTTC; PPIA-R, TTGCCATGGACAAGA TGCCA.
Western blot analysis
NE-PER Nuclear and Cytoplasmic Extraction kit
(Thermo Fisher Scientific) was used to isolate protein fractions
and quantified with bicinchoninic acid (BCA) protein assay
(Sigma-Aldrich, St. Louis, MO, USA). Thyroid hormone receptor β-1
antibody [J52] (Thermo Fisher Scientific) was used for analysis
(1:1,150). For cytoplasmic isolates β actin loading control
antibody [BA3R] Thermo Fisher Scientific) and for nuclear extracts
histone H3 antibody [E.960.2] (Sigma-Aldrich) were used as control
(1:1,150). Secondary anti-mouse IgG (whole molecule)-alkaline
phosphatase labeled antibody produced in goat [A3562] (1:7,000) was
used and detected with SigmaFast™ BCIP/NBT
(5-bromo-4-chloro-3-indolyl phosphate/nitro blue tetrazolium)
(Sigma-Aldrich, St. Louis, MO, USA).
Statistical analysis
Statistical analysis was performed in GraphPad Prism
6 (GraphPad Software, Inc., La Jolla, CA, USA). Statistical models
for repeated measures were used. In particular growth curves were
compared with two-way ANOVA followed with Dunnett’s multiple
comparisons test and Tukey’s multiple comparisons test as
statistical methods that allow estimation of inter-individual
variability in intra-individual patterns of change over time
(47). Cell cycling (cell cycle
phase distribution) was evaluated with t-test. Gene expression
level (RT-qPCR) was also evaluated with t-test (48).
Results
Hormonal stimulation of cell viability
and proliferation
Normal human renal epithelial cells (ASE-5063) are
slow proliferators in comparison to RCC cells. Normal renal cells
were responsive to stimulation with T3 and proliferated at a higher
rate when stimulated with T3, both T3 from FBS (equivalent to
regular serum concentration) and T3 added to hormone-depleted
serum. ASE-5063 cells cultured with the T3 inhibitor proliferated
more slowly than when cultured with FBS or T3. There was no
difference in the viability of the ASE cells cultured in different
concentrations of the T3 hormone. Exposure to 1 pM of T3 stimulated
proliferation of ASE-5063 cells at a high rate. The viability and
proliferation of primary renal proximal tubule epithelial cells
(PCS400010) required 10 nM of supplementation with T3 in the
medium.
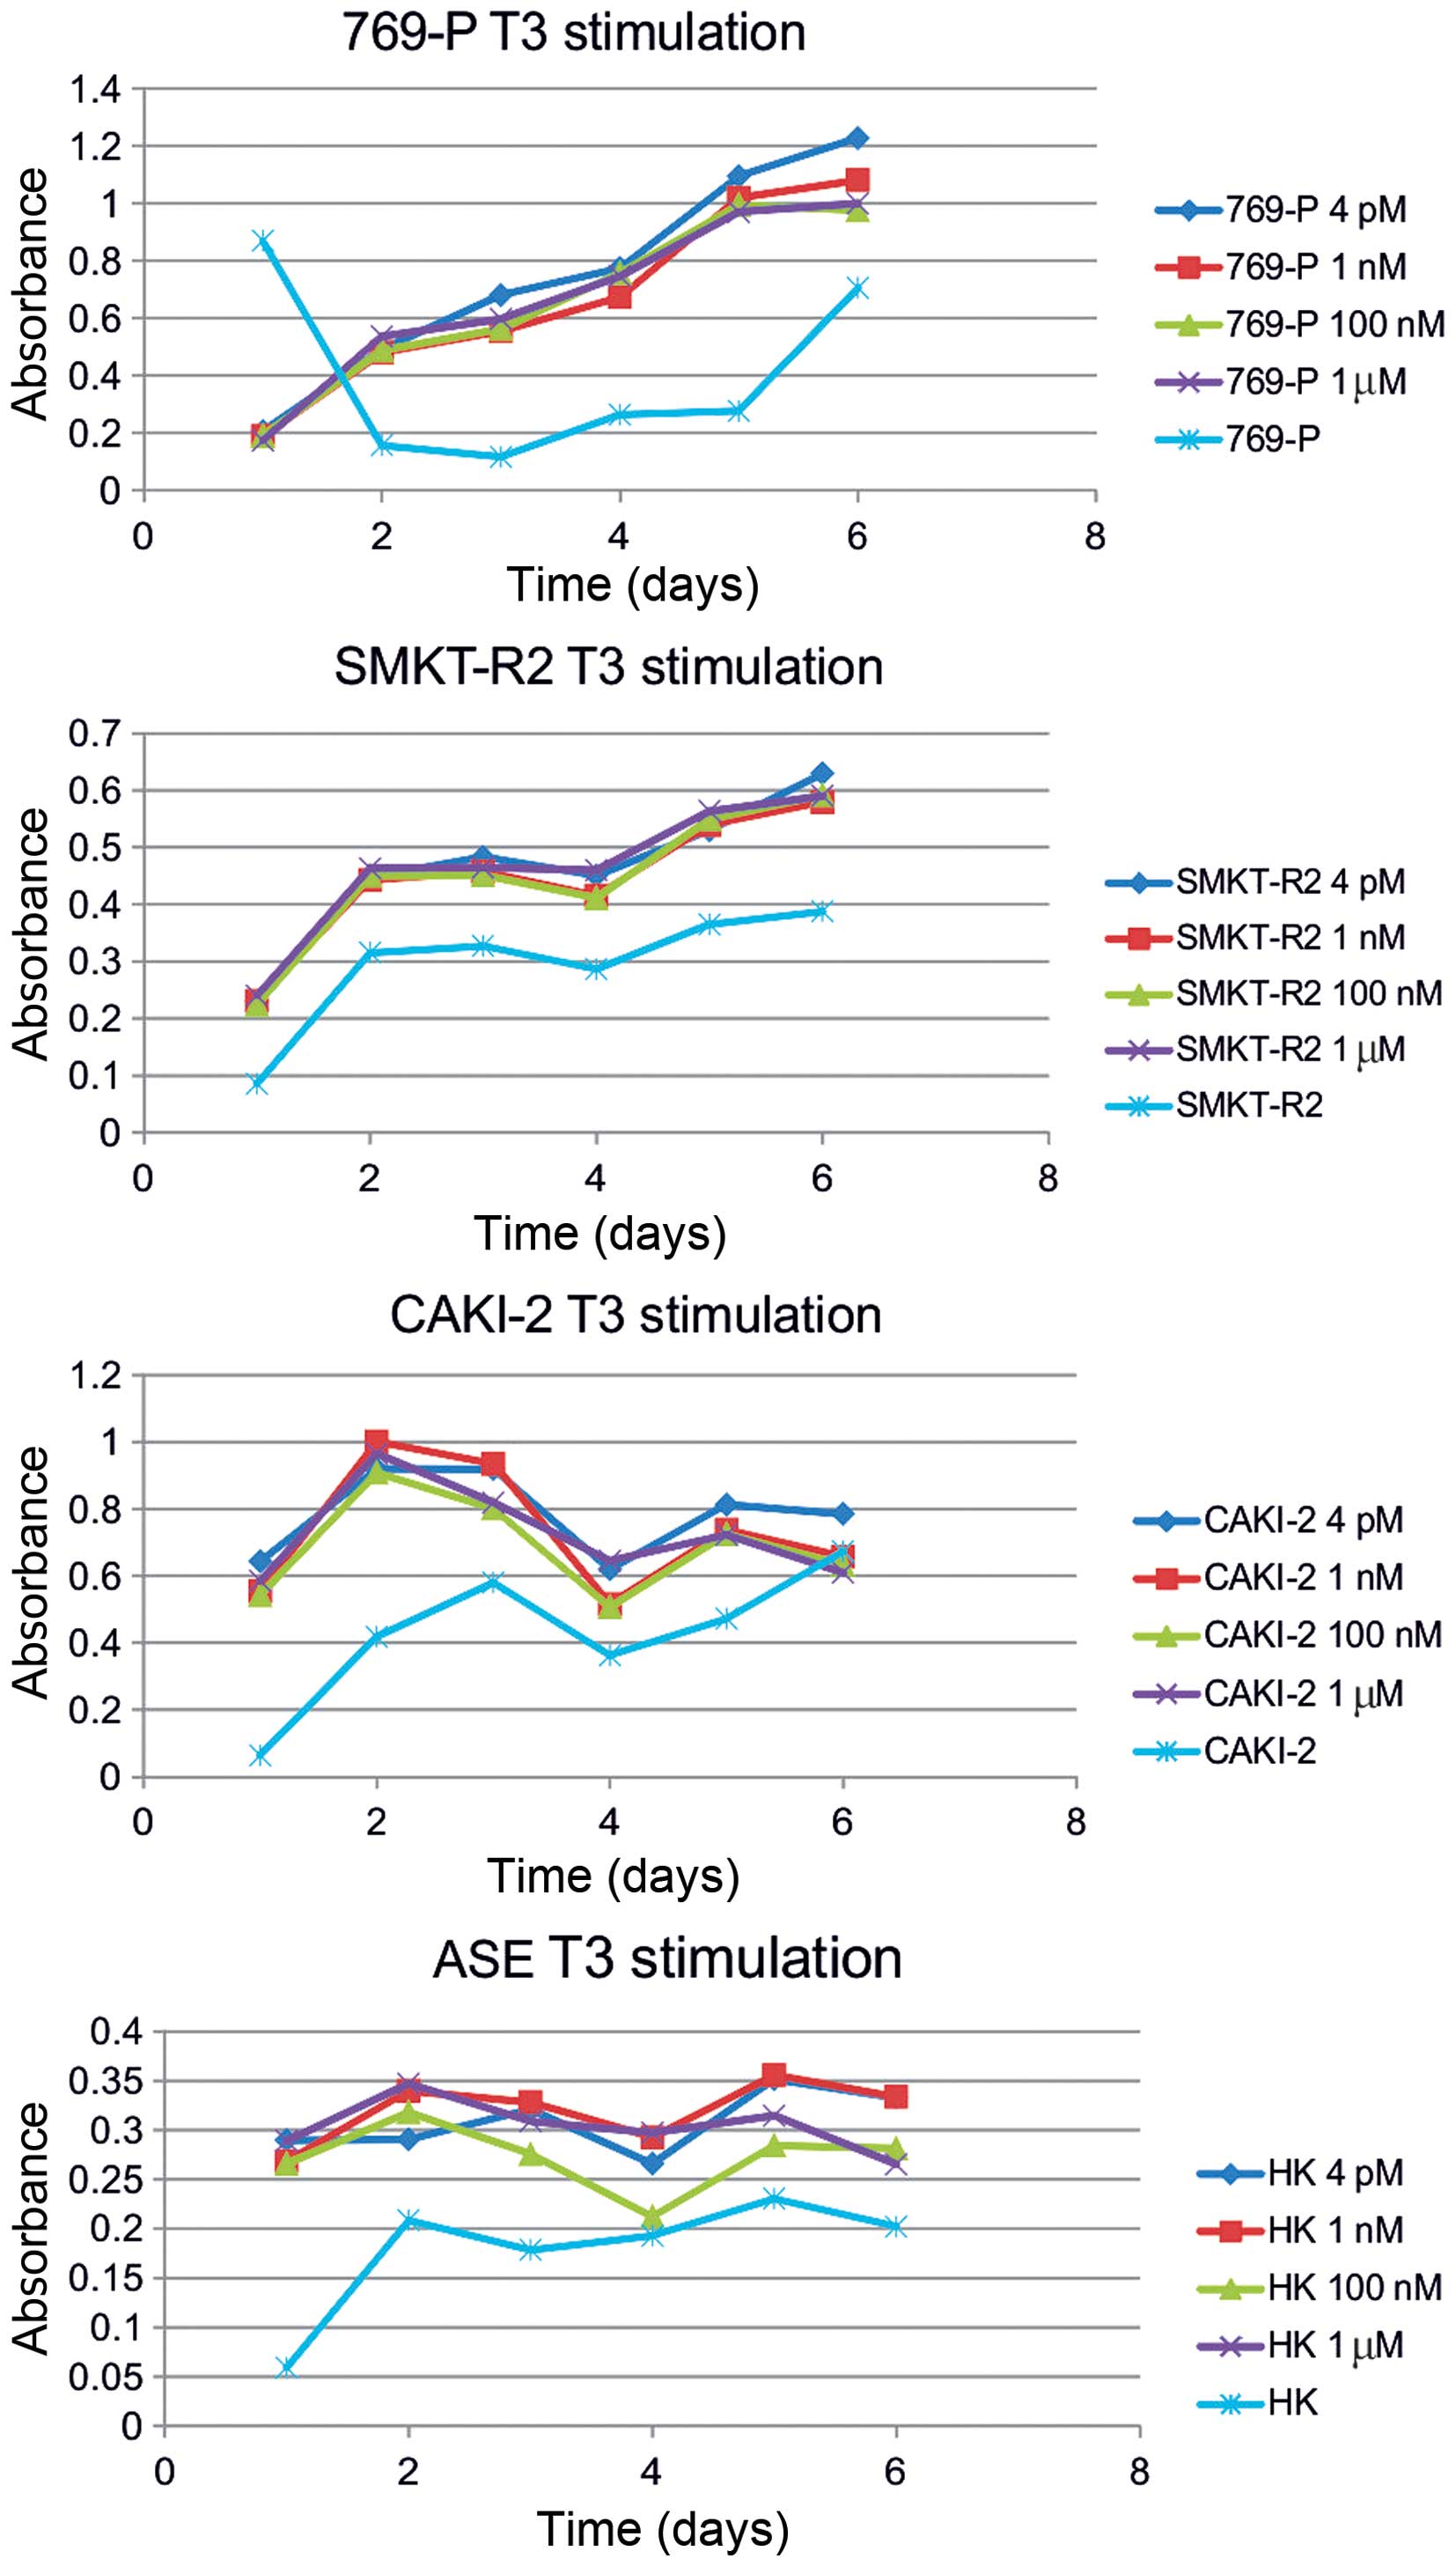
In the first step, T3-hyperstimulation was excluded
to influence RCC cells viability, both in normoxia and hypoxia
(Fig. 1), as the proliferation
rate was specific to the cell line and not dependent on additional
T3 stimulation in the hormone-reach medium. Among the cancer cell
lines in the hormone-depleted medium, the serum proliferation rate
of the HKCSC, Caki-2, ASE, ACHN, SK-RC-42, SMKT-R2, Caki-1, 786-0,
and SK-RC-45 cells was decreased. The RCC6, 769-P, and SK-RC-42
cancer cells and the embryonic HEK-293 cells were viable and
proliferated at a similar rate, both with and without T3/T4. In
hormone depleted conditions supplemented 4 pM T3 was not able to
stimulate cancer cells to regular proliferation, and only
triiodothyronine - 0.56–2.23 ng/ml with thyroxine T4 - 0.08–0.16
ng/ml induced the cells. Off-the-clot serum, thyroxin,
triidothyronine and thyroid hormone, depleted and was more
effective in decreasing cell viability than thyroid hormone
receptor antagonist CAS 251310-57-3 or chemically-defined, animal
origin-free, chemically-defined, protein-free medium. The HKCSC
renal cancer stem cells were particularly sensitive to T3
regulation, as CAS 251310-57-3 decreased their proliferation.
Significant influence of T3 on RCC viability was noted in ACHN
cells, that were stimulated by T3 and inhibited by CAS 251310-57-3,
both in chemically-defined and hormone-depleted conditions.
At the same time as resazurin
(7-hydroxy-3H-phenoxazin-3-one 10-oxide) based cell
viability was estimated by measuring oxidation-reduction in
mitochondria (aerobic respiration) and since T3 is well known to
increase uncoupling and increase aerobic respiration (49), the impact of T3 on cell metabolism
was indirectly evaluated. Metabolic and respiration state of the
cells was therefore described as influenced by T3, because T3
depletion (hormone depleted serum) decreased readout (aerobic
respiration rate) in HKCSC, Caki-2, ASE, ACHN, SK-RC-42, SMKT-R2,
Caki-1, 786-0, and SK-RC-45 cells. In parallel activity of
NAD(P)H-dependent cellular oxidoreductase enzymes, of the cell
cytosolic compartment, reflecting the number of viable cells
present, was also measured in an MTT assay. This test was used as
it is more related to the glycolytic rate per se and thus to NADH
production through glycolysis than to respiration. MTT test results
confirmed the impact of T3 on the RCC cells, with T3 promoting the
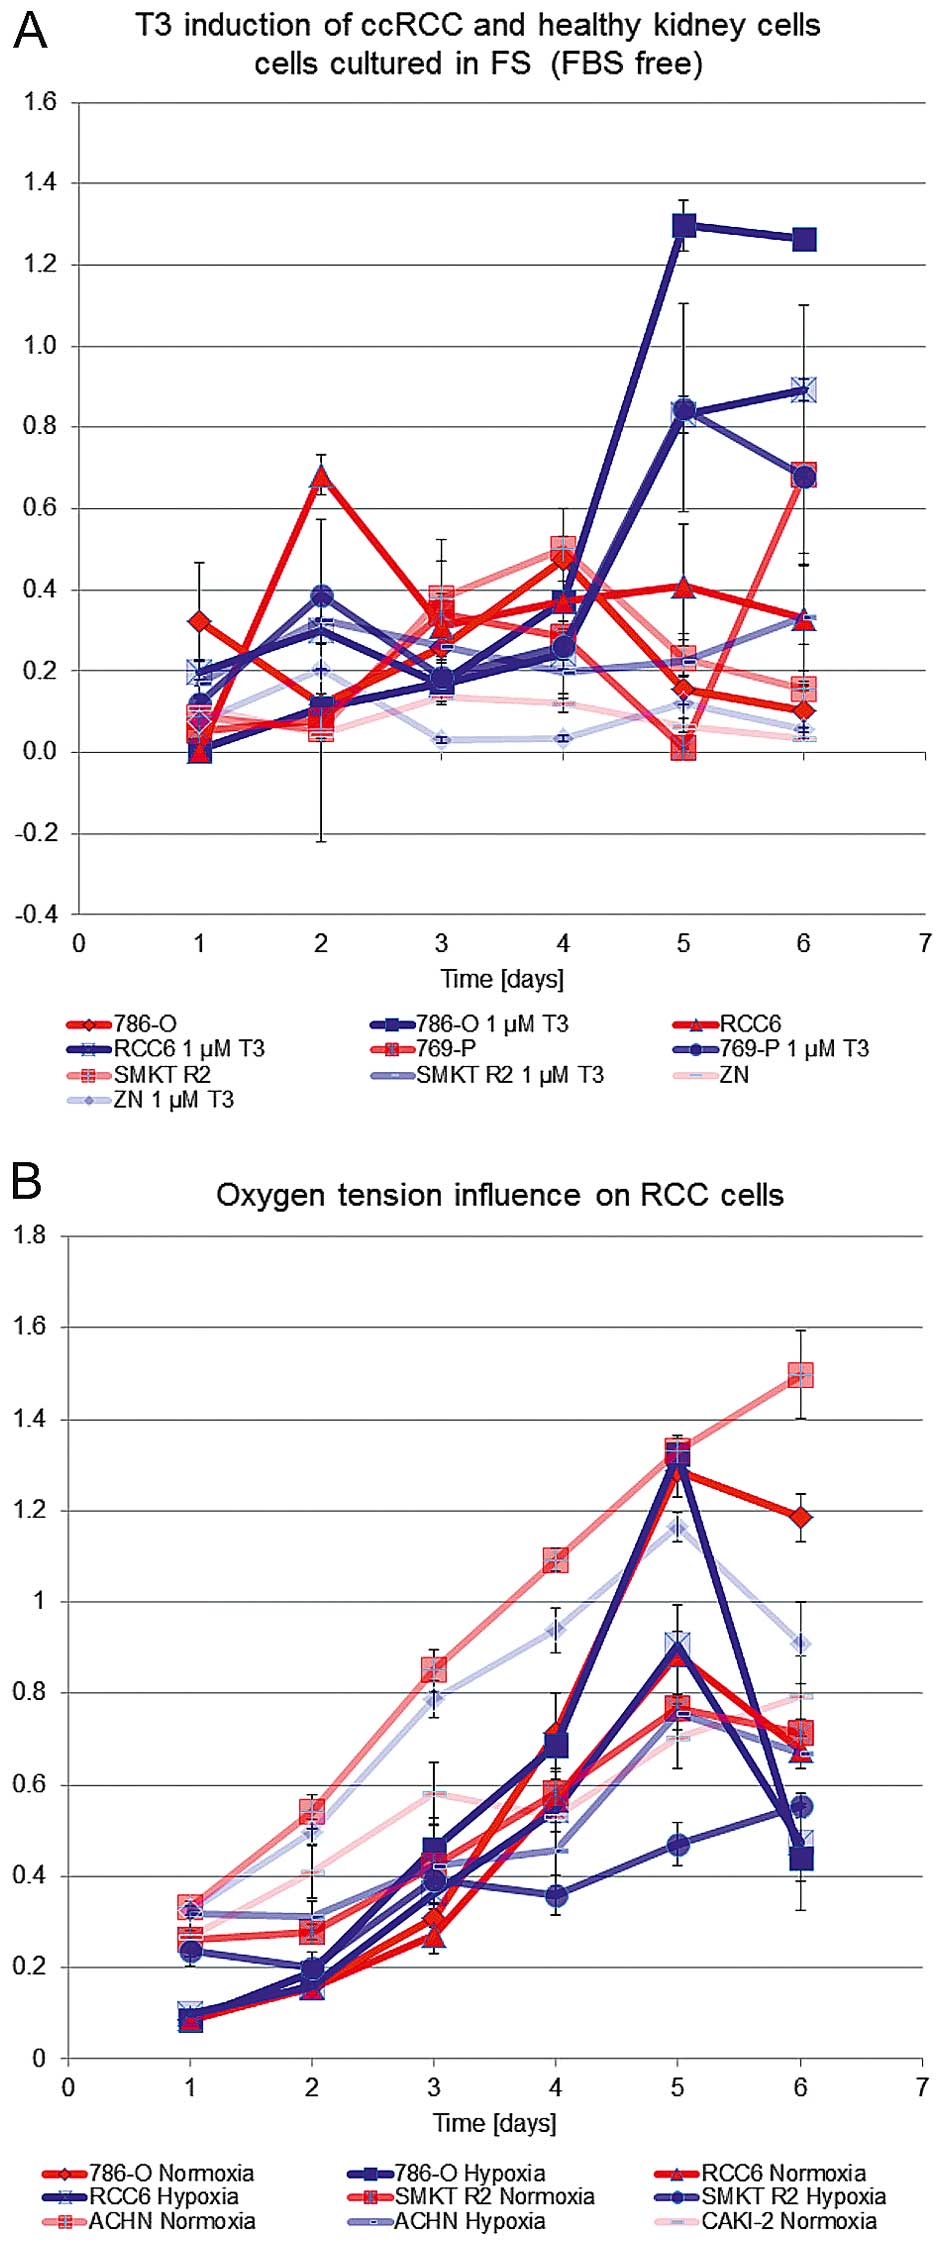
glycolytic rate and viability. T3 inductor effect was shown to
arise independently from oxygen pressure in the cell environment
(hypoxia versus normoxia) and activate both cells responsive and
not responsive to the oxygen concentration (Fig. 2). Hypoxia (2% O2)
promoted viability of Caki-2 cells, normoxia (21% O2)
promoted proliferation of ACHN, and SMKT R2 cells but oxygen
partial pressure had no influence on proliferation of 786-O, and
RCC6 cells. T3 also promoted the proliferation of 786-0, RCC6,
Caki-2, SMKT R2, and healthy kidney cell lines (Fig. 3), as shown in chemically-defined,
animal origin-free and chemically-defined, protein-free media. The
glycolytic rate and cell viability were also induced by
supplementation of as low as 0.5 or 1% serum in cultures of RCC
cells. Additional stimulation with increasing amounts of T3, 4 pM,
1 nM, 100 nM, or 1 μM, along with serum had no further inductor
influence on the RCC cells. Overall, stimulation of the RCC cells
with T3 had a greater impact on the glycolytic rate than on
oxidative respiration, as shown by comparison of formazan and
resazurin oxidation rate. Cultured in the same conditions (T3
concentration) RCC cells in the MTT assay were responsive to T3
stimulation in chemically-defined media, but no difference was
shown in Alamar blue measurements (Fig. 2).
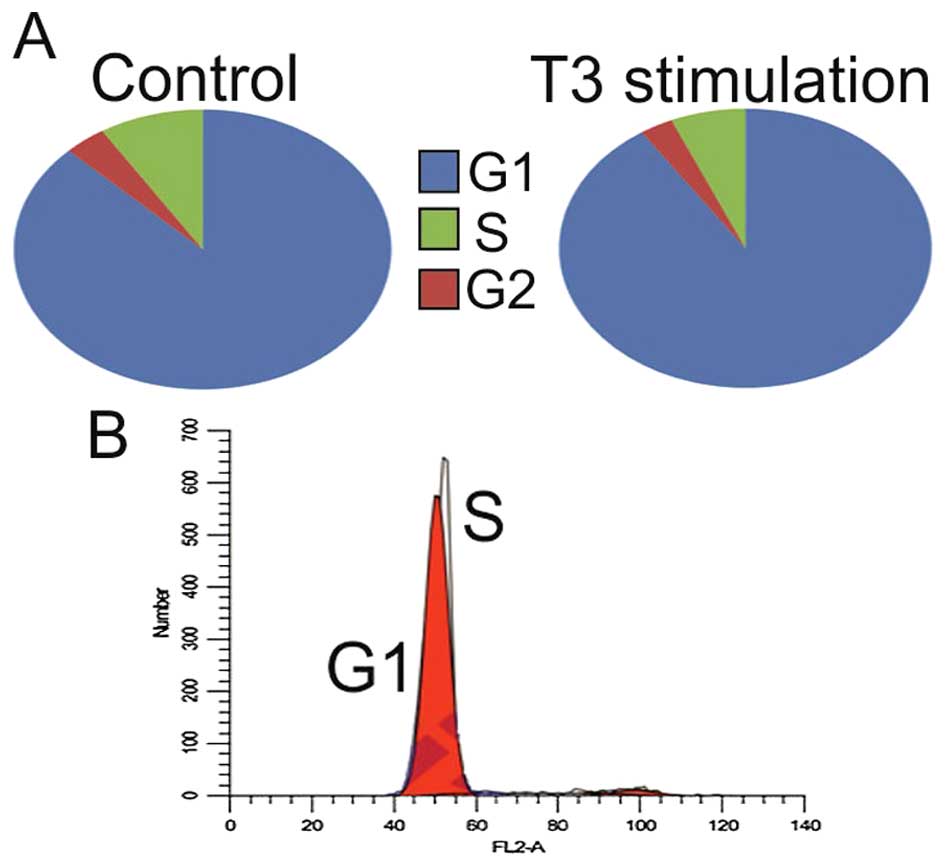
After T3 stimulation in most cell lines trend of
decreasing number of cells in G1 with concurrent increasing in S
phase was observed (p>0.5) (Table
I and Fig. 4). The opposite
correlation was observed in the ACHN and 786-0 cell lines
(p<0.5). Interestingly, giving the slow proliferation
characteristics of RCC stem cells, there was a significant increase
(+7.8%) in the number of cells in S phase in this cell line.
 | Table ICell cycle distribution before and
after T3 stimulation. |
Table I
Cell cycle distribution before and
after T3 stimulation.
| Phase | Control | + T3 | % change | Phase | Control | + T3 | % change |
|---|
| 786-O | | | ACHN | |
| G1 | 87.2 | 90.6 | +3.4a | G1 | 61.3 | 63.9 | +2.6a |
| G2 | 3.9 | 2.9 | −1 | G2 | 17.2 | 16.2 | −1 |
| S | 8.9 | 6.5 | −2.4 | S | 21.5 | 19.9 | −1.6 |
|
| 769-P | | |
SM-KT-R2 | |
|
| G1 | 73.7 | 72.7 | −1 | G1 | 75.9 | 75.5 | −0.4 |
| G2 | 17.9 | 18.8 | +0.9 | G2 | 12.6 | 13.4 | +0.8 |
| S | 8.4 | 8.4 | −0 | S | 11.6 | 11.1 | −0.5 |
|
| RCC6 | | | HKCSC | |
|
| G1 | 77.9 | 76.3 | −1.6 | G1 | 45.7 | 42.5 | −3.2 |
| G2 | 9.6 | 9.5 | −0.1 | G2 | 21.7 | 17.2 | −4.5 |
| S | 12.5 | 14.3 | +1.8 | S | 32.6 | 40.4 | +7.8a |
|
| Caki-2 | | | HSE | |
|
| G1 | 81.3 | 78.2 | −3.1 | G1 | 87.67 | 86.79 | −0.88 |
| G2 | 5.7 | 6.2 | +0.5 | G2 | 11.37 | 12.02 | +0.65 |
| S | 12.8 | 15.5 | +2.7 | S | 0.96 | 1.25 | +0.29 |
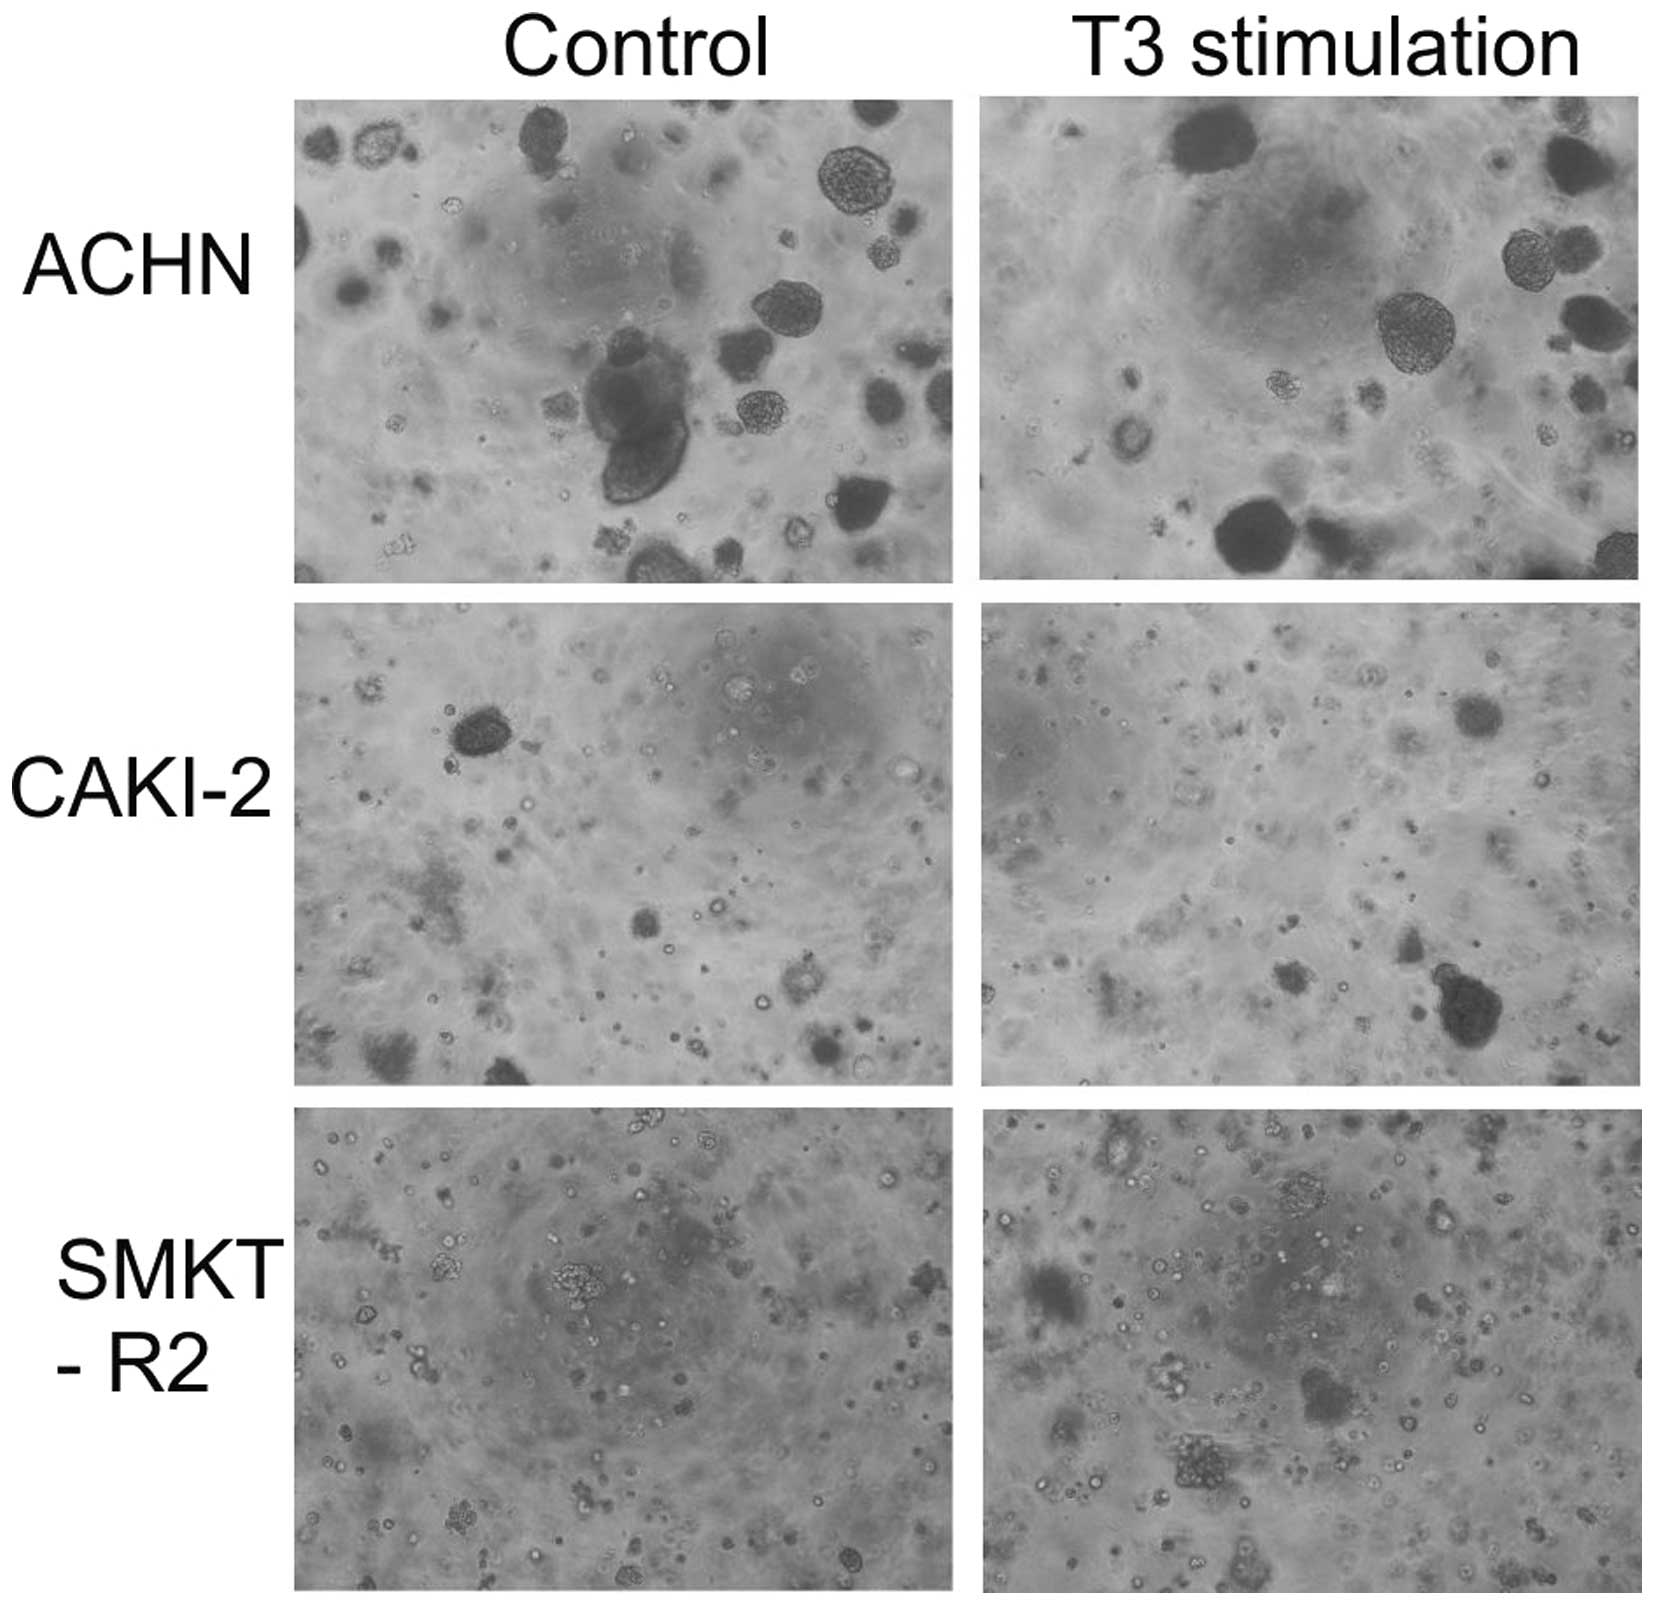
In addition to analyzing cell proliferation in 2D
culture, this study also investigated the impact of T3 on 3D cell
growth. The colony formation potential of the RCC cells before and
after T3 stimulation was low in agar matrix. Only the Caki-2 and
SMKT-R2 cells derived from a primary clear-cell carcinoma of the
kidney and ACHN cells derived from a metastatic site by pleural
effusion generated 3D colonies. The number of colonies formed by
the cell lines was not significantly different between the cells
stimulated and not stimulated with T3 (Fig. 5). In the soft agar colony formation
model of cellular anchorage-independent growth, T3 did not increase
the tumorigenic growth potential of the RCC cells in vitro.
T3 also had no tumor-suppressive effect on the RCC cells.
Treatment of the normal renal and cancer cell lines
with sunitinib, a tyrosine kinase inhibitor, decreased RCC cell
growth. T3 stimulation did not promote or prevent the inhibitory
effect of sunitinib. Higher T3 concentrations also did not decrease
the inhibitory effect of sunitinib.
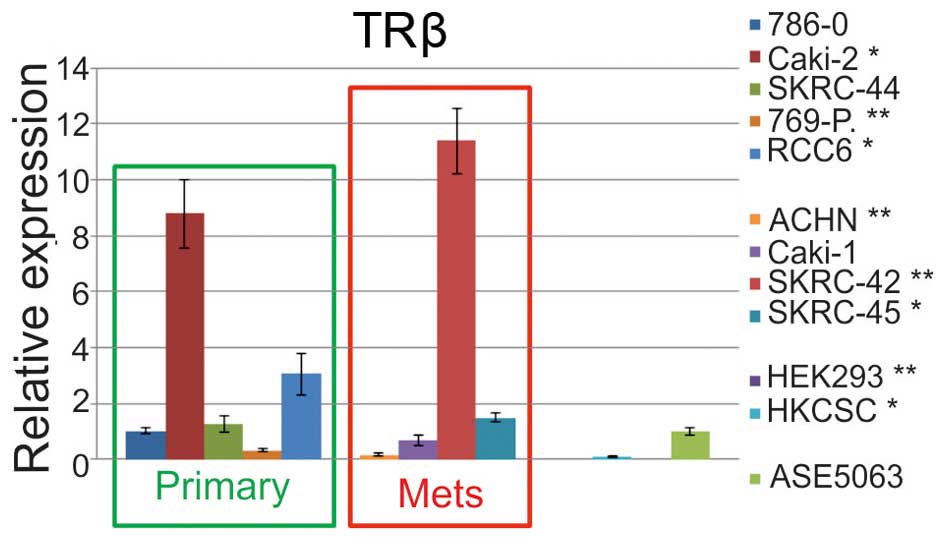
TR gene sequences and expression
For the analysis THRB gene expression on mRNA
and protein level, cell lines were divided into four groups
dependent on the origin as follows: primary RCC, metastatic RCC,
unclassified renal cells, and control normal kidney cell lines
(ASE5063). The statistically significant upregulation of relative
expression (RE) was identified in Caki-2, RCC6, SKRC-42, SKRC-45
cell lines, in comparison to normal cells. In contrast, the
expression in the 769-P, ACHN, HKCSC, and HEK293 cells was
significantly downregulated (Fig.
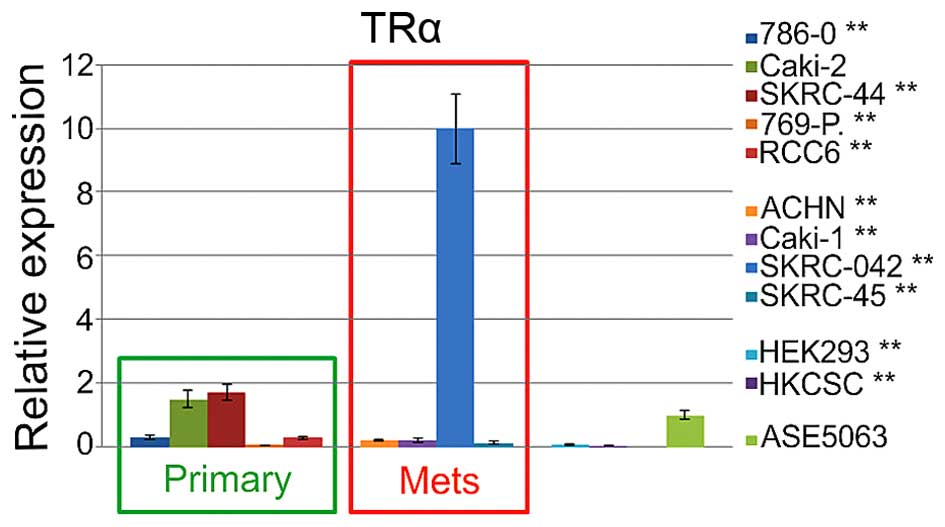
6). Additional control analysis of the THRA (thyroid hormone
receptor α) expression revealed significant upregulation in SKRC-44
cells and downregulation in 786-O, 769-P, and RCC6 primary tumor
cells (Fig. 7). Among the
metastatic cell lines, expression only the in SKRC-44 cells was
upregulated, and the expression in all the other cell lines was
downregulated. The relative THRA expression in the embryonic renal
cell line and renal cancer, cancer stem cells were also
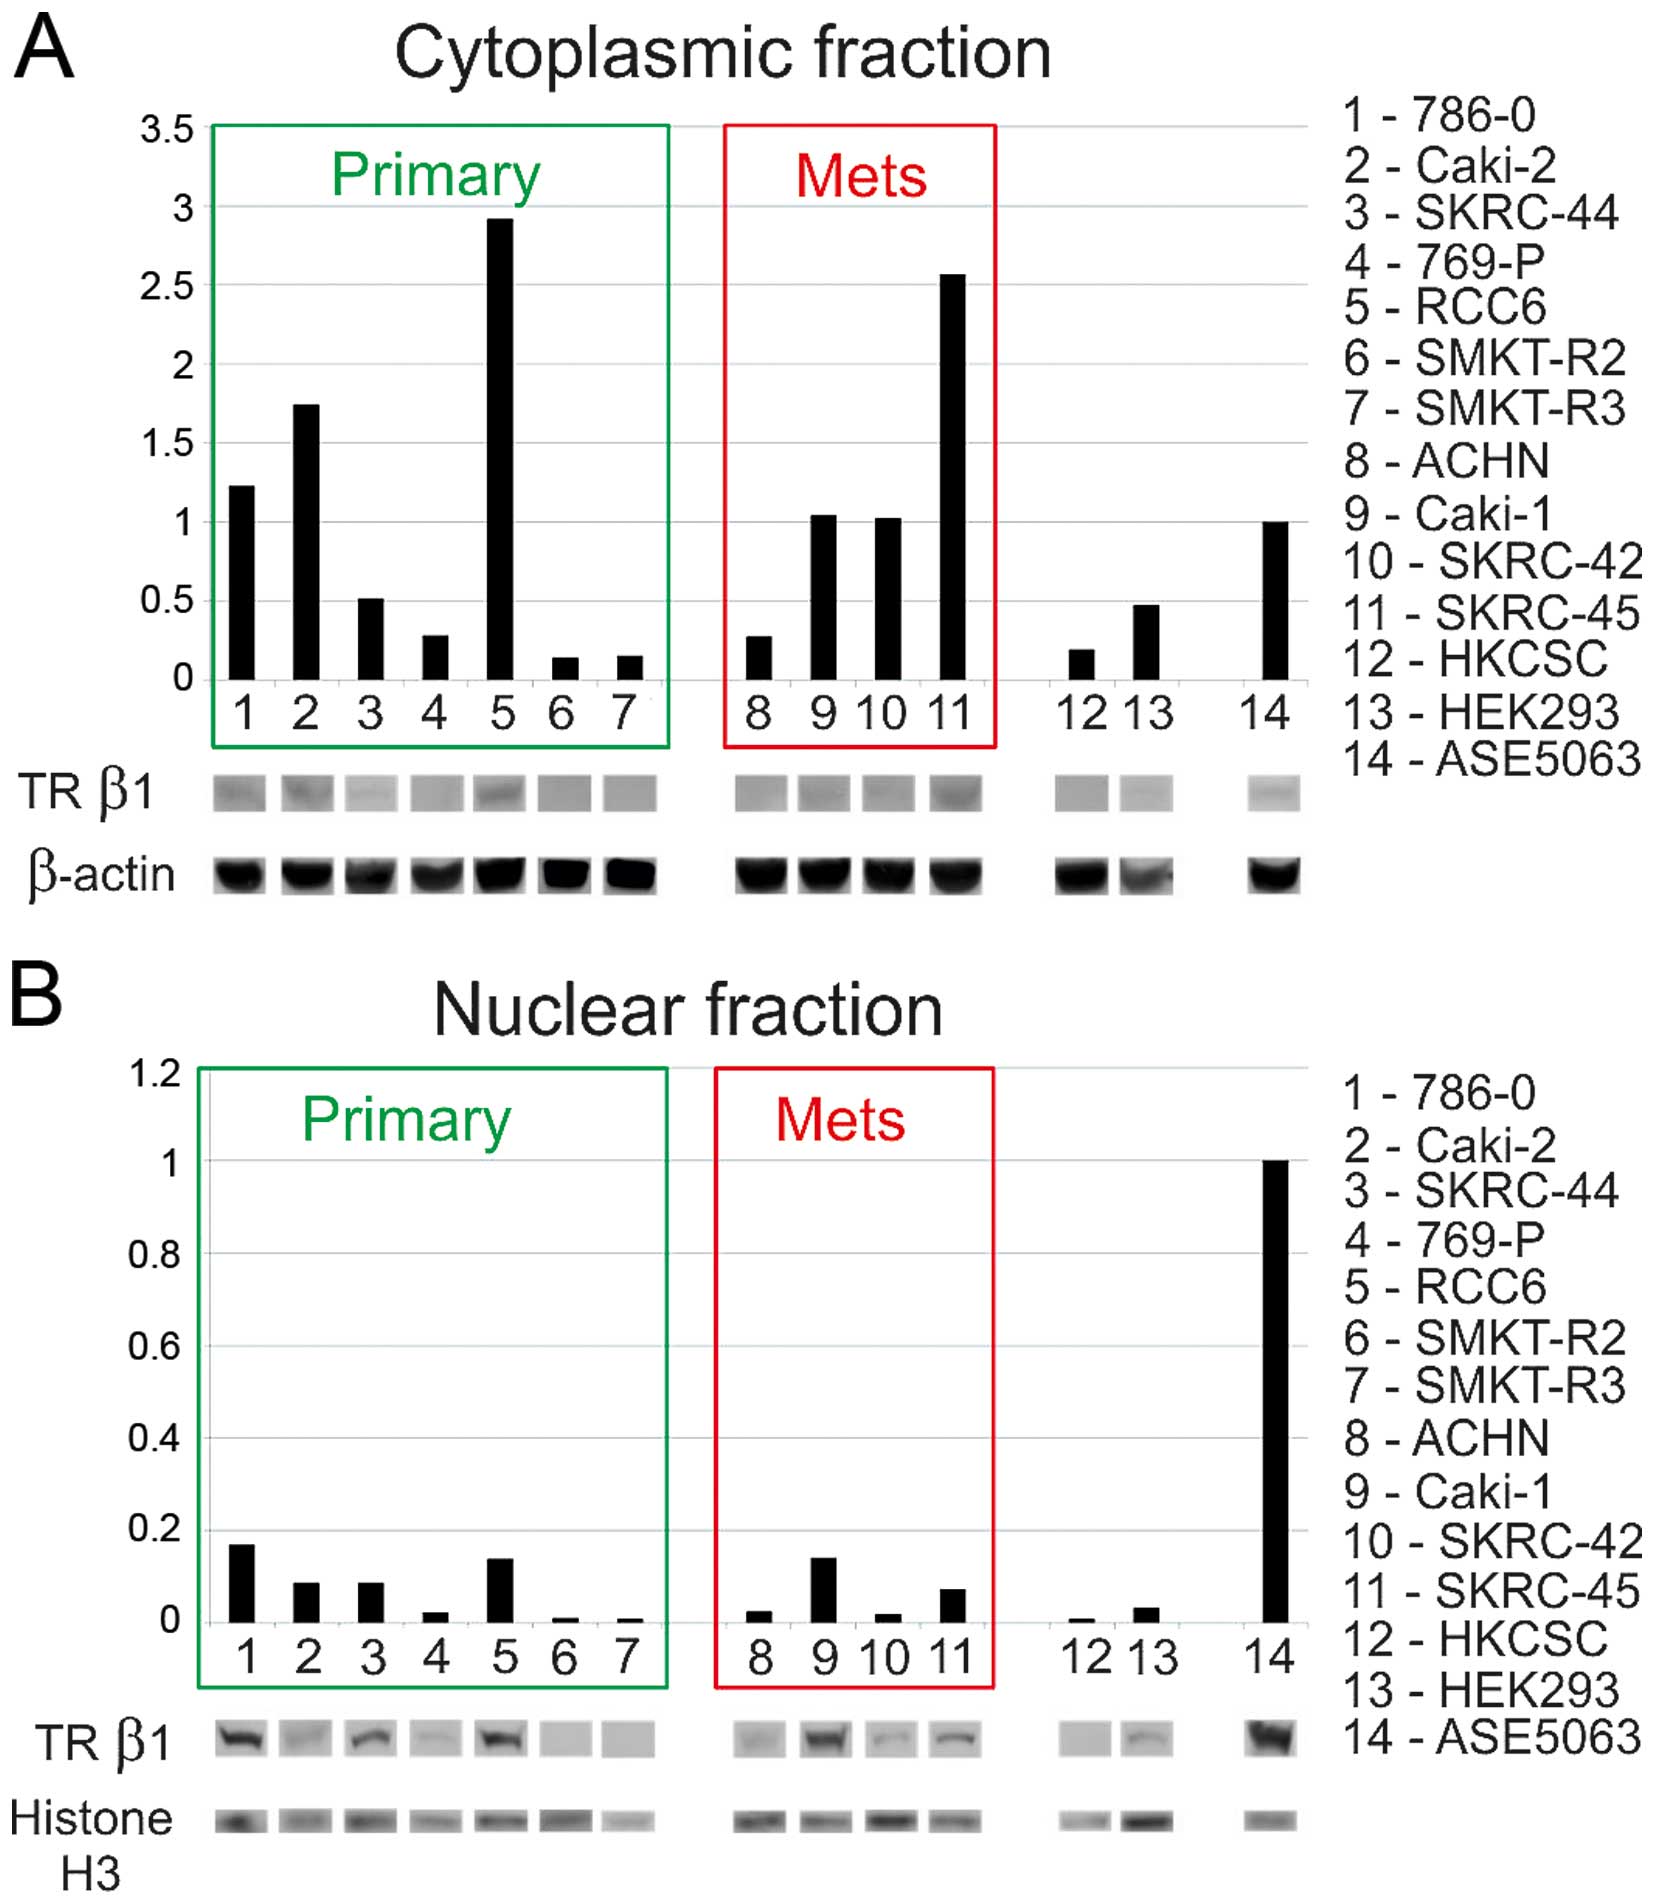
downregulated. A subsequent western blot analysis of cytosolic and
nuclear proteins confirmed the presence of TRβ1 in both fractions.
In comparison to normal proximal tubule cells RCC expression and
accumulation of TRβ1 in the cytoplasmic fraction was higher in the
786-O, Caki-2, RCC6, and SKRC-45 cells, than in normal renal cells
(Fig. 8). The protein level of
TRβ1 in the SKRC-44 and 769-P primary tumor cells, metastatic ACHN
cells, embryonic HEK293 cells, and HKCSC stem cells was
downregulated. In cells with a high cytoplasmic level of TRβ, the
level of the TRβ protein in the nuclear fraction was not as high as
with the lowest in HKCSC, SKRC-42, ACHN, and 769-P. The analysis
showed that the expression levels of mRNA and proteins were
correlated. No difference from reference sequence was found in the
analyzed coding sequence of the TRβ gene and since reference
sequence that is referred as normal sequence no mutation was
expected. Synonymous polymorphisms were found in three cases
(Table II).
| Table IITRβ gene sequence polymorphisms found
in RCC cell lines and their protein consequences. |
Table II
TRβ gene sequence polymorphisms found
in RCC cell lines and their protein consequences.
| Cell line | Origin | Mutation | AA |
|---|
| 786-O | Primary | 735C>T | F245F |
| SK-RC-42 | Metastatic | 735C>T | F245F |
| HEK293 | Human embryonic
kidney | 735C>T | F245F |
Discussion
The goal of this study was to verify the influence
of T3 stimulation on renal cell cancer cells. This research was
designed to verify of prolonged survival of hypothyroid RCC
patients is epidemiological or cell biology phenomenon. We also aim
to verify interaction of T3 and TKI on RCC cells. Understanding the
effect of hypothyreosis and normothyreosis on RCC cells is of
clinical importance, as hypothyroidism was reported in >80% of
RCC patients treated with sunitinib (18), up to 20% of those treated with
sorafenib (19), and up to 100% of
those treated with axitinib (50).
Furthermore, hypothyroidism was shown to be an independent
predictive marker of treatment outcomes in patients with metastatic
RCC (20). Hypothyroidism that
developed during the treatment of RCC patients was associated with
significantly longer progression-free survival, overall survival,
and better objective response rates (51), but hormone replacement with
l-thyroxine had no influence on patient survival (52). In a meta-analysis, the observed
advantage of acquired hypothyroidism in terms of overall survival
was not clear, and the authors indicated that any perceived
benefits should be interpreted with caution (53). Data on direct T3 activity in RCC
tumor cells was not available. First step undertaken in order to
verify the influence of T3 on RCC cell was development of
physiologically relevant cell culture model for the study.
To support the growth of cancer cell lines in
vitro generally standard media (RPMI/DMEM/F12), supplemented
with fetal bovine/calf serum (FBS/FCS) are used. We confirmed that
for modelling of RCC cell physiology FBS, that was used in control
experiments, has relevant T3/fT3 concentration for simulation of
healthy euthyreosis conditions. The uptake of T4, T3, and reverse
(r) T3 by kidney cells is mediated by an active transport process,
which is dependent on ATP availability and Na+ gradient
across kidney cell membrane. Transport of hormones into kidney
cells is a rate-limiting step in the metabolism of these THs in the
kidney (54). The binding of T3 to
the nuclear T3 receptor of the target cell induces the activity of
the hormone. The binding of T3-TRβ1 complex to the nuclei targets
occurs slowly and attains a maximal value after 2–3 h of induction.
The peak effect of T3 mediated gene expression occurs not earlier
than 1–2 h after stimulation with hormone (12,14).
In typical cell culture model-based experiments, the T3 hormone
binds mitochondrial and cytosol fractions at a concentration in the
range of 10−12 to 10−8 M (1 pM–10 nM), but
the nuclear fraction only up to 1–10−10 M (100 pM). At
higher concentrations of 100 pM (0.1 nM), T3 binds to high-capacity
non-specific nuclear sites (14,55).
The T3 dissociation constant of the TR (both isoforms) is between
10−9 and 10−10 M (100 pM–1 nM), the
half-maximal effective concentration (EC50) of the TR is
1–2 nM, and the TR mediates TH-regulated gene expression (35,56).
T3 binds in vitro translated full-length TRβ with an
apparent equilibrium (Kd) of 108 pM, and the T3-TR saturation curve
is characterized by a single component (one-phase exponential
growth) (57). In the
cortical-collecting tubules of the kidney, T3 at a concentration of
10−11 M (10 pM) increased Na/K-ATPase activity and the
trans-epithelial voltage (58),
but T3 at a concentration in the range of 10−10 to
10−7 M had no effect on inducible nitric oxide synthase
(iNOS) protein expression in renal cells (59). In addition, 6.5 pg/ml of T3 were
reported to be required for maturation of CD133/1+
papillary renal cells into tubular epithelial cells in the kidney
(60). Based on this cell
physiology data it may be concluded that 100 pM-1 nM T3 stimulation
is required to investigate the effect of T3 on renal cell cancer
cells, as confirmed in this study. Our result is supported by a
previous study confirming that FBS was relevant for studying
T3-dependent effects in cell culture. In cells cultured in minimal
essential medium (MEM) with 10% TH-depleted FBS, the expression of
3-hydroxy-3-methylglutaryl coenzyme A reductase was downregulated
by 70.1%. This deregulation of gene expression was normalized when
the cells were transferred to medium supplemented with regular FBS
or TH-depleted FBS supplemented with 10−6 M T3 for 48 h
(61). However, due to the
presence of endogenous THs in FBS/FCS, it is impossible to control
the effects of low (physiological and supra-physiological) levels
of THs on cells (62). To study
the effect of T3/T4 charcoal-stripped FBS, and serum-free
chemically defined medium, must be used instead of standard media
(63) and concordant physiological
T3 amount must be supplemented. Therefore, we analyzed
hormone-deprived serum, chemically-defined media with panel of T3
concentrations and focused on pM and nM T3 effects (Fig. 1Figure 2–3). The goal of this model was to mimic
conditions of RCC cells in vivo in euthyreosis and
hypothyreosis. Before now renal cells were cultured in 100 nM of T3
and this T3 concentration was reported to inhibit the proliferation
of a human proximal tubule cell line (HK2) and stimulate
proliferation of Caki-2 and Caki-1 cell lines (4). Such a dose of T3 can be considered
hyperstimulation, as a physiological T3 dose was defined before as
10 nM, and a supraphysiological dose was defined as 100 nM
(64). Moreover, it was
demonstrated that short (4 days) and prolonged (3 months) exposure
to regular (1.0 nM) and supra-normal T3 concentrations (25.0 nM)
supports maximal cell growth rates and induces significant
increases in global translation rate (65). Along with this T3 dosing
restriction, the research of Rosen et al with 100 nM T3 must
also be interpreted as used to verify the effect of hormonal
hyperstimulation of TRs in RCC, but not the effect of physiological
T3 concentration found in RCC patients serum (38).
By focusing on in vivo-like T3
supplementation and using more cell lines, this study confirmed
that both hyperstimulatory and physiological conditions promote the
viability of not only Caki-1 and Caki-2 cells but also that of
other cancer cell lines of both clear-cell cancer and papillary
cancer subtype (e.g., ACHN, 786-0, RCC-6; Figs. 1Figure 2–3). Our data are generally in accordance
with the findings of Poplawski and Nauman (4). In our study in standard T3
concentration (FBS-derived) normal renal cells (ASE) were not
stimulated by addition of supraphysiological T3 up to final
concentration of 100 nM, while in the study of Poplawski and Nauman
(4) normal renal cells (HK-2) were
inhibited by 100 nM T3. Moreover, we have confirmed that the
depletion of T3 decreases the proliferation of healthy renal cells.
We concluded that the difference between HK-2 and ASE-5063, both
cell lined derived from normal proximal tube of the kidney, cells
should be applied to differences in cell biology between the lines.
ASE-5063 cells represent passage 0–2 of normal cells (primary
culture), while HK-2s are proximal tubular cells immortalized by
transduction with human papilloma virus 16 (HPV-16) E6/E7 genes
(66). It was shown that HPV E6
and E7 proteins are able to directly interact with thyroid hormone
receptor (67), and HPV E2 protein
interacts with thyroid hormone receptor and with its co-activators
GRIP1 (glucocorticoid receptor-interacting protein 1) and Zac1
(zinc-finger protein which regulates apoptosis and cell cycle
arrest 1), and as a consequence influence transcriptional
activation of TRβ1 (68). As a
result of HPV proteins interaction with thyroid hormone receptor,
the TRβ1 activation in HK-2 cells is to be different that in
primary cultures of renal proximal tubule (ASE-5063) cells. We
believe that analysis of primary culture represents the in
vivo state more closely than investigation of immortalized
cells (69).
It is important to consider the mechanism of
metabolic regulation in HIF-1 overexpression state in which local
TH signaling is reduced through the induction of local thyroxine
deiodinase D3 (70). In this
study, the supplementation of RCC cells culture with T3 promoted
proliferation and oxidative phosphorylation metabolism when
compared with T3/T4-depleted serum (BBI solutions serum or
FreeStyle media). T3 promoted the proliferation of RCC cells at a
concentration as low as 1 μM when compared to T3-free conditions. A
concentration of 1 μM fT3 represents hypothyroidism, with normal
limit being 3 μM. At the same time, without T3 exogenous
supplementation, the RCC cells still proliferated when other
chemically-defined factors were present. The low-molecular weight
TR antagonist (CAS 251310-57-3) did not inhibit the prostimulatory
effect of T3 on the RCC cells to any great extent and other
inhibitors should be considered in the future. T3 stimulation was
not sufficient to overpower the inhibitory effect of sunitinib on
the RCC cells, as shown in the Alamar-Blue-based cell viability
test. This test was effectively used as cell health indicator and
measure of the reducing power of living cells and quantitative
measure of cell line proliferation allowing to establish relative
cytostimulatory and cytotoxicity of T3, T3-inhibitor, and
sunitinib.
In our study the effect of T3 on the cell cycle was
dependent on the RCC line, as well as the overall speed of the
division of these cells (Table I).
Regardless of the genetic variation between the individual tumors
from which the cell lines were isolated, the impact of hormonal T3
induction was possible to describe when the same cell line under
controlled conditions of supplementation and deprivation of THs was
compared. In this study, T3 stimulation had little impact on the
distribution of the cell cycle phase and cell cycle progression of
RCC cells. Nevertheless trend of decreasing number of cells in G1
with concurrent increasing in S phase was shown (Table I and Fig. 4). In conclusion, T3 cell cycle
regulation changes in the cell cycle may be related to the
checkpoint of the cell cycle in the late G1 phase referred as to
nutrient-sensing cell growth checkpoint (71) and may depend on the impact of
hormonal stimulation on cyclins (72). As the S and G2/M phases of
mammalian cells are relatively invariant in length, with changing
interdivision time, a decrease in the interdivision time due to the
increased rate of mass synthesis necessarily leads to a shortening
of the G1 phase (72), which is
taking place in most investigated RCC cells. Our result are
supported by a previous study which has shown that T3 signaling
disturbances result in improper G1/S phase progression in Caki1 and
Caki-2 cells (4). These authors
have also shown that in RCC T3 regulate proliferation, acting as a
stimulator and inhibits of the proliferation of normal immortalized
kidney (HK2) cells. This difference was explained by T3-deregulated
expression of transcription factors E2F4 and E2F5, along with
Retinoblastoma-like 1 protein (p107) and retinoblastoma-like 2
protein (p130) activity in cancer cells. E2F4 and E2F5 factors in
complexes with p107 or p130 stop cancer cells in G1 phase and
repress cell cycle progression and gene transcription. At the same
time, p107 and p130 may inhibit the activity of cyclin/cdk2
complexes and promote cell cycling (4). Fibroblast cell cycle analysis showed
that the G0/G1 phase transition is mainly affected by T3 and that
number of cells in S phase is reduced after T3 stimulation
(73) and the same phenomenon we
observed in RCC cancer stem cells. In cell cycle analysis it should
not be forgotten that TRβ expression levels increase in a cell
cycle-dependent manner (74). The
levels of TR proteins was also specifically shown to fluctuate in
HK2 cells, and increase during cell cycle progression. In contrast,
in Caki-2 cells, the expression profile was improper, with protein
levels dropping during progression (4). Collectively, we believe that T3
although significant factor in RCC cell cycle regulation has cancer
case to case-specific effect that must be explained by background
mutations.
To determine whether T3 signaling was disturbed in
studied RCC cells, THβ was analyzed at the mRNA and protein levels.
Previous studies reported inconsistent data on the expression of
TRα and TRβ in RCC. One study reported that the expression of TRβ
at the mRNA level was upregulated in 30% and downregulated in 70%
of RCC cases when compared with adjacent normal renal tissue
(40). In RCC tissues with THRB
underexpression, the measured amount of specific mRNA was ~2.5±3
times lower in cancer tissue when compared with the surrounding
tissue and ~2.2 times lower in comparison with that of other
healthy kidneys (40). However,
investigated kidneys affected by other pathologies, including
cysts, which could represent some gene expression abnormalities.
The expression levels of mRNA TRβ were reported to be lower in G1
tumors than in G2 and G3 tumors. Among RCC with TRβ gene
overexpression (6/20 cases), the tumors were mostly poorly
differentiated (G2 and G3) and clinically more advanced, including
T3b, T3c, and T4b (40). TRβ mRNA
amount was significantly different between tumors and surrounding
tissues only in G3 cases. The same study reported that TRβ mRNA was
underexpressed in 33.6, 34.2, and 40.1% of G1, G2, and G3 tumors,
respectively (40). Our results
showed that the TRβ transcript level was decreased in SKRC-44 and
769-P primary tumor cells, metastatic ACHN cells, embryonic HEK293
cells, and HKCSC stem cells, and it was increased in 786-O, Caki-2,
RCC6, and SKRC-45 cells when compared to the level in cells derived
from healthy kidney proximal tubules. Measurement of the TRβ
transcript revealed cells with high expression (cell line SKRC-42)
and low expression (cell lines 769-P, HKCSC, SKRC-45). In the first
group, the expression was up to 12 times higher in RCC cells in
comparison to that of healthy renal cells. There was no difference
in the expression of the TRβ transcript in papillary RCC cells
(i.e., Caki-2, ACHN, and HKCSC) when compared with that of
clear-cell RCC (i.e., Caki-1, 786-0, and 796-P). There was also no
difference in the expression of the TRβ transcript in cells
originating from metastatic tumors and those originating from
primary tumors. Our results represent therefore additional evidence
for TRβ1 expression deregulation in RCC.
In previous studies an interesting discrepancy
between mRNA and protein levels was described, with a low level of
protein found in RCC cells with overexpression of TRβ mRNA
(40). In tissue analysis by
Master et al (41) TR mRNA
and protein levels were reported to be reduced by 70 and 91%,
respectively, in ccRCC tissues. This phenomenon was accompanied by
an absence of the TRβ1 target gene, the type 1 deiodinase enzyme
(DIO1) protein, and a 58% reduction in the tissue concentration of
T3, which is generated mainly by DIO1. The observed discordance in
the magnitude of the change in TR mRNA and protein was explained by
the influence of aberrant splicing of TR mRNA 5′UTRs, leading to
differences in the translation efficacy and expression of the
miRNA-204, inhibitor of TR mRNA 3′UTR. The authors concluded that
the THRB expression in RCC cells is subject to complex
post-transcriptional regulation Master et al (41). In our study, the high TR mRNA level
was not correlated with a low TRβ1 protein level in the nuclear
fraction, suggesting that nuclear translocation is important for
the activity of TRβ. Complementary to our data abnormalities in TR
mRNA translation reported in RCC were shown to be cancer specific.
In normal renal cells, the major TR transcript contains variant A
(AY286465.1) of the 5′UTR. In RCC, this is deregulated. A loss of
transcript variants IVS4B (GeneBank: GQ919288.1) and F1 (GQ456950)
was reported in ccRCC. A functional analysis of the influence of
the 5′UTR variant on protein expression in an RCC cell line,
Caki-2, showed that weakly folded variant A promoted the highest
level of receptor expression. In contrast, variants F (AY286470.1)
or F1 (GQ456950), which were strongly folded, resulted in low
transcription, low translation rates, and low receptor expression.
In >70% of RCC cases, a reduction in the TRβ1 mRNA coding
sequence has been reported. Furthermore, reduced expression of A
and F 5′UTR variants has been reported in 75 and 62% of tumors,
respectively (41). Finally TRβ1
protein level in cancer tissues was barely detectable. An analysis
of the protein level of TRs in nuclear extracts from RCC tumors
revealed that the TRβ1 protein level was decreased in 87% (20/23)
of tumors when compared with that of normal tissue from the same
kidney. The level of the TRβ1 protein was decreased 1.2–16 times.
The expression level of the TRα1 protein was 1.6 times higher in
tumors than in healthy tissue, and the expression level of TRβ1 was
1.7 times lower in tumors than in healthy controls (40). In Caki-2 and Caki-1 cancer cell
lines the level of TR proteins was lower than in healthy kidney HK2
cells (4). In this study, we
showed a low level of expression of TRβ in the RCC nuclear fraction
compared with that of the healthy kidney cells. The distribution of
the cytoplasmic fraction level was more variable, suggesting that
the cell localization and activity are altered in RCC and that the
cytoplasmic pool represents a quiescent fraction of the protein. In
cases with a high cytoplasmic level of TRβ, the level of the TRβ
protein in the nuclear fraction was not as high. This confirms and
extends the findings of a previous study, which demonstrated a low
level of TRβ in pseudotriploid cells derived from human embryonic
kidney (HEK293) with deregulated cell cycle control pathways and
apoptosis but lacking a VHL or c-MET pathway (75).
In this study, the RCC cells did not harbor TR
coding sequence differences when compared with those of a standard
reference sequence deposited in the NCBI database and they did not
contain mutations reported previously (33,54,76).
In a previous study, TR genes from 22 tumor tissues, 20
corresponding controls, and seven non-cancerous kidney tissues were
sequenced and compared with those of a control (wild-type TRβ1
cloned from non-cancerous kidneys) (33). The authors reported that the
mutations were clustered in T3-binding domains (D and E). In
particular, one TRβ1 (3TRβ1) mutant was isolated from an RCC grade
G1 tumor (25% of all G1 tumors tested), three TRβ1 (25TRβ1, 8TRβ1,
18TRβ1) mutants were isolated from G2 (33%) tumors, and three TRβ1
(15TRβ1, 32TRβ1, 6TRβ1) mutants were isolated from G3 (42.8%)
tumors. In total, nine of all analyzed RCC cases (40.9%) had at
least one mutation in a ligand (T3)-binding domain or DNA-binding
domain. Of these mutations, seven were missense, and these were
also mostly clustered in T3-binding domains (33). In a subsequent functional analysis,
mutant TRβ1 was shown to have impaired T3 association and DNA
binding capacities. The transcriptional activity of many mutants
was also reported to be downregulated or lost. Mutations in the
T3-binding domains (i.e., Y321H, E299K, H412R, L456S, and S380F)
reduced the T3 binding activity by ~35–60%, and other mutations
(i.e., W219L, F451I, F451S, Q252R, A387P, and F417L) resulted in a
loss of almost 100% of T3 binding activity. These mutants also
displayed significantly reduced DNA affinity (50–100%). A mutation
in the DNA binding domain (i.e., K155E), which interferes with the
TH-response element interaction, resulted in the loss of up to 100%
DNA-binding activity. Furthermore, some mutations (e.g., F415S)
exhibited a dominant negative effect on the wild-type TRβ receptor,
and the TRβ mutants lost receptor transactivation activity. A
previous study investigated the effect of mutations found in RCC in
a HepG2 cell (HCC) model and performed detailed analyses of the
impact of these two mutations on gene regulation (38). The authors showed that the target
gene specificity of TR mutants isolated from RCC cells was greatly
expanded. The targets of the TR mutants overlapped to a large
extent between RCC cases but minimally overlapped with wild-type
TR-specific genes or with target genes found in other cancers
including HCC. The mutant TR targets included solute carriers,
metallothioneins, glycolytic enzymes, and other metabolism genes.
In the same study, 69 genes were repressed by a TRβ1 mutant
(rc15-RTβ1 = P453S hormone-binding domain mutant). Although most of
the targeted genes were not controlled by the wild-type receptor
and were new targets, some of the mutant-repressed genes were
activated by the wild-type receptor. The majority of the genes
repressed by the mutant receptor were not affected by stimulation
or hyperstimulation by T3 and were regulated in a
hormone-independent manner. The authors suggested that the
different target specificity was the result of changes in the
binding of co-activator proteins and therefore the binding of
different response elements, broadening the ability of the
receptors to recognize different sequences at −1 and −2 positions.
As a result, the mutants attained the ability to recognize a
distinct set of genes, different from those recognized by the
wild-type receptor (38). In the
study by Rosen et al (38),
other mutations associated with RCC were mostly localized in the
DNA-bonding domain and were dominant-negative. These showed altered
co-repressor splice variant selectivity and impaired co-repressor
release in response to T3 stimulation. These mutations localized
mostly in helix 12 of the receptor and were dominant negative at T3
concentrations of >10 nM, >100 nM, and >1,000 nM. Other
mutations (e.g., rc8-TRβ1) required higher than normal T3
concentrations to bind coactivators and stimulate gene expression.
Therefore, they may not be active in euthyreosis or hypothyreosis
found in RCC patients. According to Rosen and Privalsky (35), these mutations were more likely to
deregulate cell homeostasis in cells with specific co-repressor and
co-activator variant expression. All the TR mutations may play
specific roles in carcinogenesis, angiogenesis, and tumor
progression mediated through the activity of target genes (38). Defects in the function of TRs may
serve as a second hit, after VHL mutations, that triggers, or
participates in, the transition from a renal cyst to a clear-cell
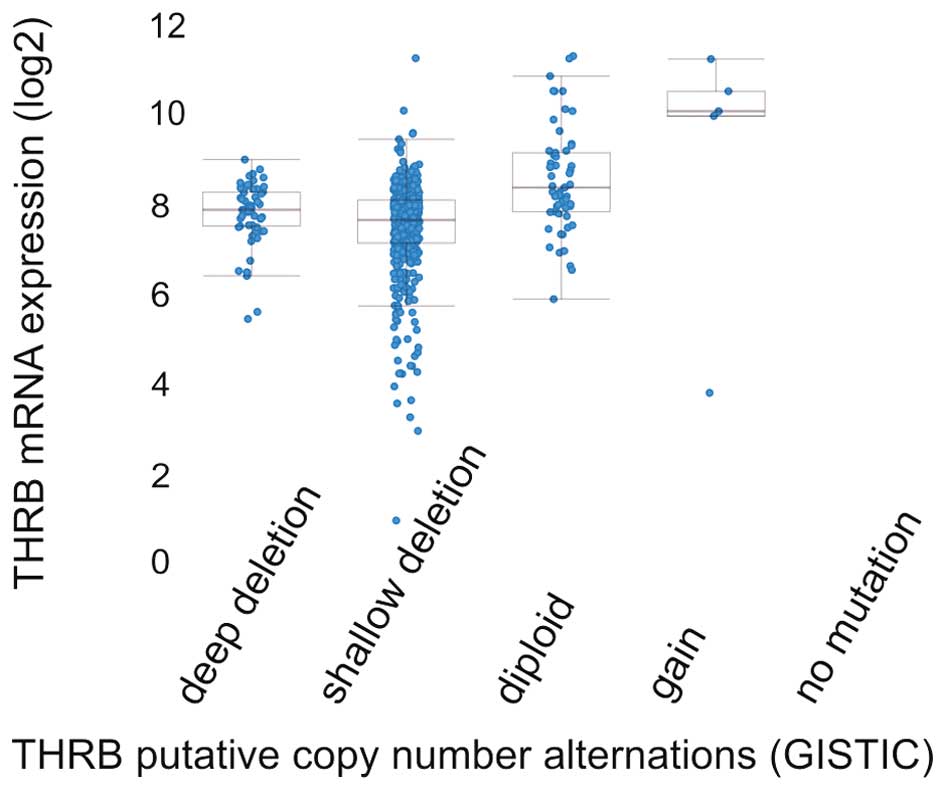
carcinoma (34). As complement to
cell line sequencing, our analysis of cBio Cancer Genomics Portal
data showed that THRB gene is altered in 57 of 538 (10.6%) ccRCC
patients available for analysis (77,78).
Identification of somatic copy-number alterations (SCNAs) driving
cancer growth by GISTIC2.0 method (79) has shown that most common events
reported in ccRCC are heterozygous deletion, followed by homozygous
deletions and that gain of copy number is exceptional (Fig. 9). In the TCGA analysis of ccRCC, 15
of the 418 (3.6%) cases described harbored deletions of THRB gene
with majority of hemizygous deletions (32) suggesting that TR gene may be lost
in RCC carcinogenesis, but it may also be mutated and be expressed
as protein with novel transcription regulation functions.
In conclusion, we have shown that TR expression is
deregulated in RCC cells, both in mRNA and protein level. RCC cells
are also responsive to T3 stimulation and increase proliferation
rate in most cases. Significant cell cycle shift towards S phase
was apparent in RCC cancer stem cells. This could be one of the
reasons why patients with hypothyreosis have better tumor shrinkage
while treated with TKI. Nevertheless some tumors may be considered
as T3-independent which may represent especially aggressive
phenotype, where receptor is activated also in the absence of the
ligand. On the contrary proliferation induced by deregulated VHL
and or c-Met pathways may transgress normal T3 mediated regulation
of the cell cycle.
Acknowledgements
This study was supported by Juventus PLUS project
IP2011008171 [8736 0081/IP/2011/71] (head AMC). Medical English
proofreading (Scribendi Inc., Canada) was covered by AMC.
References
|
1
|
Chen Y, Sun Y, Rao Q, Xu H, Li L and Chang
C: Androgen receptor (AR) suppresses miRNA-145 to promote renal
cell carcinoma (RCC) progression independent of VHL status.
Oncotarget. 6:31203–31215. 2015.PubMed/NCBI
|
|
2
|
King S, Bray S, Galbraith S, Christie L
and Fleming S: Evidence for aldosterone-dependent growth of renal
cell carcinoma. Int J Exp Pathol. 95:244–250. 2014. View Article : Google Scholar : PubMed/NCBI
|
|
3
|
Min KJ, Jang JH, Lee JT, Choi KS and Kwon
TK: Glucocorticoid receptor antagonist sensitizes TRAIL-induced
apoptosis in renal carcinoma cells through up-regulation of DR5 and
down-regulation of c-FLIP(L) and Bcl-2. J Mol Med (Berl).
90:309–319. 2012. View Article : Google Scholar
|
|
4
|
Poplawski P and Nauman A: Thyroid hormone
- triiodothyronine - has contrary effect on proliferation of human
proximal tubules cell line (HK2) and renal cancer cell lines
(Caki-2, Caki-1) - role of E2F4, E2F5 and p107, p130. Thyroid Res.
1:52008. View Article : Google Scholar : PubMed/NCBI
|
|
5
|
Mellemgaard A, From G, Jørgensen T,
Johansen C, Olsen JH and Perrild H: Cancer risk in individuals with
benign thyroid disorders. Thyroid. 8:751–754. 1998. View Article : Google Scholar : PubMed/NCBI
|
|
6
|
Prinzi N, Sorrenti S, Baldini E, De Vito
C, Tuccilli C, Catania A, Coccaro C, Bianchini M, Nesca A, Grani G,
et al: Association of thyroid diseases with primary extra-thyroidal
malignancies in women: Results of a cross-sectional study of 6,386
patients. PLoS One. 10:e01229582015. View Article : Google Scholar : PubMed/NCBI
|
|
7
|
Videla LA, Fernández V, Cornejo P, Vargas
R and Castillo I: Thyroid hormone in the frontier of cell
protection, survival and functional recovery. Expert Rev Mol Med.
17:e102015. View Article : Google Scholar : PubMed/NCBI
|
|
8
|
Shin DH, Lee MJ, Lee HS, Oh HJ, Ko KI, Kim
CH, Doh FM, Koo HM, Kim HR, Han JH, et al: Thyroid hormone
replacement therapy attenuates the decline of renal function in
chronic kidney disease patients with subclinical hypothyroidism.
Thyroid. 23:654–661. 2013. View Article : Google Scholar : PubMed/NCBI
|
|
9
|
Katz AI, Emmanouel DS and Lindheimer MD:
Thyroid hormone and the kidney. Nephron. 15:223–249. 1975.
View Article : Google Scholar : PubMed/NCBI
|
|
10
|
Puzianowska-Kuznicka M, Pietrzak M,
Turowska O and Nauman A: Thyroid hormones and their receptors in
the regulation of cell proliferation. Acta Biochim Pol. 53:641–650.
2006.PubMed/NCBI
|
|
11
|
Basu G and Mohapatra A: Interactions
between thyroid disorders and kidney disease. Indian J Endocrinol
Metab. 16:204–213. 2012. View Article : Google Scholar : PubMed/NCBI
|
|
12
|
Humes HD, Cieslinski DA, Johnson LB and
Sanchez IO: Triiodothyronine enhances renal tubule cell replication
by stimulating EGF receptor gene expression. Am J Physiol.
262:F540–F545. 1992.PubMed/NCBI
|
|
13
|
Samad MA, Haque MM, Shah MK, Islam MR and
Mia MC: Evaluation of TSH, T4 and T3 in human serum:
Standardization on normal individuals American. J Mod Phys.
2:202–207. 2013.
|
|
14
|
Samuels HH and Tsai JS: Thyroid hormone
action in cell culture: Domonstration of nuclear receptors in
intact cells and isolated nuclei. Proc Natl Acad Sci USA.
70:3488–3492. 1973. View Article : Google Scholar : PubMed/NCBI
|
|
15
|
Maia AL, Goemann IM, Meyer EL and Wajner
SM: Deiodinases: the balance of thyroid hormone: type 1
iodothyronine deiodinase in human physiology and disease. J
Endocrinol. 209:283–297. 2011. View Article : Google Scholar : PubMed/NCBI
|
|
16
|
Niemczyk S, Dudek M, Bartoszewicz Z,
Szamotulska K, Woźniacki L, Brodowska-Kania D, Niemczyk L, Małek W
and Matuszkiewicz-Rowińska J: Determining the enzymatic activities
of iodothyronine 5′-deiodinases in renal medulla and cortex.
Endokrynol Pol. 64:182–185. 2013.
|
|
17
|
Pachucki J, Ambroziak M, Tanski Z, Luczak
J, Nauman J and Nauman A: Type I 5′-iodothyronine deiodinase
activity and mRNA are remarkably reduced in renal clear cell
carcinoma. J Endocrinol Invest. 24:253–261. 2001. View Article : Google Scholar : PubMed/NCBI
|
|
18
|
Rini BI, Tamaskar I, Shaheen P, Salas R,
Garcia J, Wood L, Reddy S, Dreicer R and Bukowski RM:
Hypothyroidism in patients with metastatic renal cell carcinoma
treated with sunitinib. J Natl Cancer Inst. 99:81–83. 2007.
View Article : Google Scholar : PubMed/NCBI
|
|
19
|
Tamaskar I, Bukowski R, Elson P,
Ioachimescu AG, Wood L, Dreicer R, Mekhail T, Garcia J and Rini BI:
Thyroid function test abnormalities in patients with metastatic
renal cell carcinoma treated with sorafenib. Ann Oncol. 19:265–268.
2008. View Article : Google Scholar
|
|
20
|
Schmidinger M, Vogl UM, Bojic M, Lamm W,
Heinzl H, Haitel A, Clodi M, Kramer G and Zielinski CC:
Hypothyroidism in patients with renal cell carcinoma: Blessing or
curse? Cancer. 117:534–544. 2011. View Article : Google Scholar
|
|
21
|
Mousa SA, Lin HY, Tang HY, Hercbergs A,
Luidens MK and Davis PJ: Modulation of angiogenesis by thyroid
hormone and hormone analogues: Implications for cancer management.
Angiogenesis. 17:463–469. 2014. View Article : Google Scholar : PubMed/NCBI
|
|
22
|
Liu X, Zheng N, Shi YN, Yuan J and Li L:
Thyroid hormone induced angiogenesis through the integrin
αvβ3/protein kinase D/histone deacetylase 5
signaling pathway. J Mol Endocrinol. 52:245–254. 2014. View Article : Google Scholar : PubMed/NCBI
|
|
23
|
Davis PJ, Davis FB and Mousa SA: Thyroid
hormone-induced angiogenesis. Curr Cardiol Rev. 5:12–16. 2009.
View Article : Google Scholar
|
|
24
|
Borek C, Guernsey DL, Ong A and Edelman
IS: Critical role played by thyroid hormone in induction of
neoplastic transformation by chemical carcinogens in tissue
culture. Proc Natl Acad Sci USA. 80:5749–5752. 1983. View Article : Google Scholar : PubMed/NCBI
|
|
25
|
Guernsey DL, Borek C and Edelman IS:
Crucial role of thyroid hormone in x-ray-induced neoplastic
transformation in cell culture. Proc Natl Acad Sci USA.
78:5708–5711. 1981. View Article : Google Scholar : PubMed/NCBI
|
|
26
|
Moeller LC and Führer D: Thyroid hormone,
thyroid hormone receptors, and cancer: A clinical perspective.
Endocr Relat Cancer. 20:R19–R29. 2013. View Article : Google Scholar : PubMed/NCBI
|
|
27
|
Kim WG and Cheng SY: Thyroid hormone
receptors and cancer. Biochim Biophys Acta. 1830:3928–3936. 2013.
View Article : Google Scholar
|
|
28
|
Yalcin M, Bharali DJ, Lansing L, Dyskin E,
Mousa SS, Hercbergs A, Davis FB, Davis PJ and Mousa SA:
Tetraidothyroacetic acid (tetrac) and tetrac nanoparticles inhibit
growth of human renal cell carcinoma xenografts. Anticancer Res.
29:3825–3831. 2009.PubMed/NCBI
|
|
29
|
van der Hout AH, van der Vlies P, Wijmenga
C, Li FP, Oosterhuis JW and Buys CH: The region of common allelic
losses in sporadic renal cell carcinoma is bordered by the loci
D3S2 and THRB. Genomics. 11:537–542. 1991. View Article : Google Scholar : PubMed/NCBI
|
|
30
|
Yokota J, Mori N, Akiyama T, Shimosato Y,
Sugimura T and Terada M: Multiple genetic alterations in small-cell
lung carcinoma. Princess Takamatsu Symp. 20:43–48. 1989.PubMed/NCBI
|
|
31
|
Hu CY, Mohtat D, Yu Y, Ko YA, Shenoy N,
Bhattacharya S, Izquierdo MC, Park AS, Giricz O, Vallumsetla N, et
al: Kidney cancer is characterized by aberrant methylation of
tissue-specific enhancers that are prognostic for overall survival.
Clin Cancer Res. 20:4349–4360. 2014. View Article : Google Scholar : PubMed/NCBI
|
|
32
|
Network TCGAR; Cancer Genome Atlas
Research Network. Comprehensive molecular characterization of clear
cell renal cell carcinoma. Nature. 499:43–49. 2013. View Article : Google Scholar : PubMed/NCBI
|
|
33
|
Kamiya Y, Puzianowska-Kuznicka M, McPhie
P, Nauman J, Cheng SY and Nauman A: Expression of mutant thyroid
hormone nuclear receptors is associated with human renal clear cell
carcinoma. Carcinogenesis. 23:25–33. 2002. View Article : Google Scholar : PubMed/NCBI
|
|
34
|
Rosen MD and Privalsky ML: Thyroid hormone
receptor mutations in cancer and resistance to thyroid hormone:
Perspective and prognosis. J Thyroid Res. 2011:3613042011.
View Article : Google Scholar : PubMed/NCBI
|
|
35
|
Rosen MD and Privalsky ML: Thyroid hormone
receptor mutations found in renal clear cell carcinomas alter
corepressor release and reveal helix 12 as key determinant of
corepressor specificity. Mol Endocrinol. 23:1183–1192. 2009.
View Article : Google Scholar : PubMed/NCBI
|
|
36
|
Turowska O, Nauman A, Pietrzak M,
Popławski P, Master A, Nygard M, Bondesson M, Tanski Z and
Puzianowska-Kuznicka M: Overexpression of E2F1 in clear cell renal
cell carcinoma: A potential impact of erroneous regulation by
thyroid hormone nuclear receptors. Thyroid. 17:1039–1048. 2007.
View Article : Google Scholar : PubMed/NCBI
|
|
37
|
Nauman A, Turowska O, Poplawski P, Master
A, Tanski Z and Puzianowska-Kuznicka M: Elevated cyclin E level in
human clear cell renal cell carcinoma: Possible causes and
consequences. Acta Biochim Pol. 54:595–602. 2007.PubMed/NCBI
|
|
38
|
Rosen MD, Chan IH and Privalsky ML: Mutant
thyroid hormone receptors (TRs) isolated from distinct cancer types
display distinct target gene specificities: A unique regulatory
repertoire associated with two renal clear cell carcinomas. Mol
Endocrinol. 25:1311–1325. 2011. View Article : Google Scholar : PubMed/NCBI
|
|
39
|
Wojcicka A, Piekielko-Witkowska A,
Kedzierska H, Rybicka B, Poplawski P, Boguslawska J, Master A and
Nauman A: Epigenetic regulation of thyroid hormone receptor beta in
renal cancer. PLoS One. 9:e976242014. View Article : Google Scholar : PubMed/NCBI
|
|
40
|
Puzianowska-Kuznicka M, Nauman A, Madej A,
Tanski Z, Cheng S and Nauman J: Expression of thyroid hormone
receptors is disturbed in human renal clear cell carcinoma. Cancer
Lett. 155:145–152. 2000. View Article : Google Scholar : PubMed/NCBI
|
|
41
|
Master A, Wójcicka A, Piekiełko-Witkowska
A, Bogusławska J, Popławski P, Tański Z, Darras VM, Williams GR and
Nauman A: Untranslated regions of thyroid hormone receptor beta 1
mRNA are impaired in human clear cell renal cell carcinoma. Biochim
Biophys Acta. 1802:995–1005. 2010. View Article : Google Scholar : PubMed/NCBI
|
|
42
|
Ebert T, Bander NH, Finstad CL, Ramsawak
RD and Old LJ: Establishment and characterization of human renal
cancer and normal kidney cell lines. Cancer Res. 50:5531–5536.
1990.PubMed/NCBI
|
|
43
|
Tanaka T, Torigoe T, Hirohashi Y, Sato E,
Honma I, Kitamura H, Masumori N, Tsukamoto T and Sato N:
Hypoxia-inducible factor (HIF)-independent expression mechanism and
novel function of HIF prolyl hydroxylase-3 in renal cell carcinoma.
J Cancer Res Clin Oncol. 140:503–513. 2014. View Article : Google Scholar : PubMed/NCBI
|
|
44
|
Gati A, Da Rocha S, Guerra N, Escudier B,
Moretta A, Chouaib S, Angevin E and Caignard A: Analysis of the
natural killer mediated immune response in metastatic renal cell
carcinoma patients. Int J Cancer. 109:393–401. 2004. View Article : Google Scholar : PubMed/NCBI
|
|
45
|
Beck-Peccoz P, Chatterjee VK, Chin WW,
DeGroot LJ, Jameson JL, Nakamura H, Refetoff S, Usala SJ and
Weintraub BD: Nomenclature of thyroid hormone receptor beta-gene
mutations in resistance to thyroid hormone: Consensus statement
from the first workshop on thyroid hormone resistance, July 10–11,
1993, Cambridge, United Kingdom. J Clin Endocrinol Metab.
78:990–993. 1994.PubMed/NCBI
|
|
46
|
Sakurai A, Nakai A and DeGroot LJ:
Structural analysis of human thyroid hormone receptor beta gene.
Mol Cell Endocrinol. 71:83–91. 1990. View Article : Google Scholar : PubMed/NCBI
|
|
47
|
Curran PJ, Obeidat K and Losardo D: Twelve
frequently asked questions about growth curve modeling. J Cogn Dev.
11:121–136. 2010. View Article : Google Scholar : PubMed/NCBI
|
|
48
|
Yuan JS, Reed A, Chen F and Stewart CN Jr:
Statistical analysis of real-time PCR data. BMC Bioinformatics.
7:852006. View Article : Google Scholar : PubMed/NCBI
|
|
49
|
Hoch FL: Biochemistry of hyperthyroidism
and hypothyroidism. Postgrad Med J. 44:347–362. 1968. View Article : Google Scholar : PubMed/NCBI
|
|
50
|
Ohba K, Takayama T, Matsunaga H,
Matsushita A, Sasaki S, Oki Y, Ozono S and Nakamura H:
Inappropriate elevation of serum thyrotropin levels in patients
treated with axitinib. Thyroid. 23:443–448. 2013. View Article : Google Scholar
|
|
51
|
Bozkurt O, Karaca H, Hacibekiroglu I, et
al: Is sunitinib-induced hypothyroidism a predictive clinical
marker for better response in metastatic renal cell carcinoma
patients? J Chemother. 1973947815Y0000000039. 2015.PubMed/NCBI
|
|
52
|
Riesenbeck LM, Bierer S, Hoffmeister I,
Köpke T, Papavassilis P, Hertle L, Thielen B and Herrmann E:
Hypothyroidism correlates with a better prognosis in metastatic
renal cancer patients treated with sorafenib or sunitinib. World J
Urol. 29:807–813. 2011. View Article : Google Scholar
|
|
53
|
Nearchou A, Valachis A, Lind P, Akre O and
Sandström P: Acquired hypothyroidism as a predictive marker of
outcome in patients with metastatic renal cell carcinoma treated
with tyrosine kinase inhibitors: A literature-based meta-analysis.
Clin Genitourin Cancer. 13:280–286. 2015. View Article : Google Scholar
|
|
54
|
Krenning EP, Docter R, Visser TJ and
Hennemann G: The significance of plasma membrane transport of
iodothyronines in the regulation of thyroid hormone
bioavailability. Acta Med Austriaca. 15(Suppl 1): 15–17.
1988.PubMed/NCBI
|
|
55
|
Samuels HH, Tsai JS and Cintron R: Thyroid
hormone action: A cell-culture system responsive to physiological
concentrations of thyroid hormones. Science. 181:1253–1256. 1973.
View Article : Google Scholar : PubMed/NCBI
|
|
56
|
Yen PM: Physiological and molecular basis
of thyroid hormone action. Physiol Rev. 81:1097–1142.
2001.PubMed/NCBI
|
|
57
|
Cunha Lima ST and Rodrigues ED: The
oligomeric state of thyroid receptor regulates hormone binding
kinetics. J Endocrinol. 210:125–134. 2011. View Article : Google Scholar : PubMed/NCBI
|
|
58
|
Capasso G, De Santo NG and Kinne R:
Thyroid hormones and renal transport: Cellular and biochemical
aspects. Kidney Int. 32:443–451. 1987. View Article : Google Scholar : PubMed/NCBI
|
|
59
|
Trachtman H, Jacques C, Citron J and
Futterweit S: Effect of triiodothyronine on nitric oxide production
in mesangial cells and renal tubular epithelial cells. Res Commun
Mol Pathol Pharmacol. 93:69–78. 1996.PubMed/NCBI
|
|
60
|
Ward HH, Romero E, Welford A, Pickett G,
Bacallao R, Gattone VH II, Ness SA, Wandinger-Ness A and Roitbak T:
Adult human CD133/1(+) kidney cells isolated from papilla integrate
into developing kidney tubules. Biochim Biophys Acta.
1812:1344–1357. 2011. View Article : Google Scholar : PubMed/NCBI
|
|
61
|
Choi JW and Choi HS: The regulatory
effects of thyroid hormone on the activity of
3-hydroxy-3-methylglutaryl coenzyme A reductase. Endocr Res.
26:1–21. 2000. View Article : Google Scholar : PubMed/NCBI
|
|
62
|
Moeller LC, Wardrip C, Niekrasz M,
Refetoff S and Weiss RE: Comparison of thyroidectomized calf serum
and stripped serum for the study of thyroid hormone action in human
skin fibroblasts in vitro. Thyroid. 19:639–644. 2009. View Article : Google Scholar : PubMed/NCBI
|
|
63
|
Alini M, Kofsky Y, Wu W, Pidoux I and
Poole AR: In serum-free culture thyroid hormones can induce full
expression of chondrocyte hypertrophy leading to matrix
calcification. J Bone Miner Res. 11:105–113. 1996. View Article : Google Scholar : PubMed/NCBI
|
|
64
|
de Oliveira M, Luvizotto RA, Olimpio RM,
De Sibio MT, Conde SJ, Biz Rodrigues Silva C, Moretto FC and
Nogueira CR: Triiodothyronine increases mRNA and protein leptin
levels in short time in 3T3-L1 adipocytes by PI3K pathway
activation. PLoS One. 8:e748562013. View Article : Google Scholar : PubMed/NCBI
|
|
65
|
Reynolds AM, Surks MI and Shapiro LE: The
effects of chronic exposure to supraphysiological concentrations of
3, 5, 3′ triiodo-L-thyronine (T3) on cultured GC cells. J Cell
Physiol. 149:544–547. 1991. View Article : Google Scholar : PubMed/NCBI
|
|
66
|
Ryan MJ, Johnson G, Kirk J, Fuerstenberg
SM, Zager RA and Torok-Storb B: HK-2: An immortalized proximal
tubule epithelial cell line from normal adult human kidney. Kidney
Int. 45:48–57. 1994. View Article : Google Scholar : PubMed/NCBI
|
|
67
|
Wang WM, Chung MH and Huang SM: Regulation
of nuclear receptor activities by two human papillomavirus type 18
oncoproteins, E6 and E7. Biochem Biophys Res Commun. 303:932–939.
2003. View Article : Google Scholar : PubMed/NCBI
|
|
68
|
Wu MH, Huang CJ, Liu ST, Liu PY, Ho CL and
Huang SM: Physical and functional interactions of human
papillomavirus E2 protein with nuclear receptor coactivators.
Biochem Biophys Res Commun. 356:523–528. 2007. View Article : Google Scholar : PubMed/NCBI
|
|
69
|
Bens M and Vandewalle A: Cell models for
studying renal physiology. Pflugers Arch. 457:1–15. 2008.
View Article : Google Scholar : PubMed/NCBI
|
|
70
|
Simonides WS, Mulcahey MA, Redout EM,
Muller A, Zuidwijk MJ, Visser TJ, Wassen FW, Crescenzi A, da-Silva
WS, Harney J, et al: Hypoxia-inducible factor induces local thyroid
hormone inactivation during hypoxic-ischemic disease in rats. J
Clin Invest. 118:975–983. 2008.PubMed/NCBI
|
|
71
|
Foster DA, Yellen P, Xu L and Saqcena M:
Regulation of G1 cell cycle progression: Distinguishing the
restriction point from a nutrient-sensing cell growth
checkpoint(s). Genes Cancer. 1:1124–1131. 2010. View Article : Google Scholar
|
|
72
|
Cooper S: On the interpretation of the
shortening of the G1-phase by overexpression of cyclins in
mammalian cells. Exp Cell Res. 238:110–115. 1998. View Article : Google Scholar : PubMed/NCBI
|
|
73
|
Pernitsky AN and Anderson JE: Differential
effects of 3,5,3′-triio-dothyronine on control and mdx myoblasts
and fibroblasts: Analysis by flow cytometry. Exp Cell Res.
227:214–222. 1996. View Article : Google Scholar : PubMed/NCBI
|
|
74
|
Maruvada P, Dmitrieva NI, East-Palmer J
and Yen PM: Cell cycle-dependent expression of thyroid hormone
receptor-beta is a mechanism for variable hormone sensitivity. Mol
Biol Cell. 15:1895–1903. 2004. View Article : Google Scholar : PubMed/NCBI
|
|
75
|
Lin YC, Boone M, Meuris L, Lemmens I, Van
Roy N, Soete A, Reumers J, Moisse M, Plaisance S, Drmanac R, et al:
Genome dynamics of the human embryonic kidney 293 lineage in
response to cell biology manipulations. Nat Commun. 5:47672014.
View Article : Google Scholar : PubMed/NCBI
|
|
76
|
Jansson M, Philipson L and Vennström B:
Isolation and characterization of multiple human genes homologous
to the oncogenes of avian erythroblastosis virus. EMBO J.
2:561–565. 1983.PubMed/NCBI
|
|
77
|
Cerami E, Gao J, Dogrusoz U, Gross BE,
Sumer SO, Aksoy BA, Jacobsen A, Byrne CJ, Heuer ML, Larsson E, et
al: The cBio cancer genomics portal: An open platform for exploring
multidimensional cancer genomics data. Cancer Discov. 2:401–404.
2012. View Article : Google Scholar : PubMed/NCBI
|
|
78
|
Gao J, Aksoy BA, Dogrusoz U, Dresdner G,
Gross B, Sumer SO, Sun Y, Jacobsen A, Sinha R, Larsson E, et al:
Integrative analysis of complex cancer genomics and clinical
profiles using the cBio-Portal. Sci Signal. 6:pl12013. View Article : Google Scholar
|
|
79
|
Mermel CH, Schumacher SE, Hill B, Meyerson
ML, Beroukhim R and Getz G: GISTIC2.0 facilitates sensitive and
confident localization of the targets of focal somatic copy-number
alteration in human cancers. Genome Biol. 12:R412011. View Article : Google Scholar : PubMed/NCBI
|