Introduction
Ewing sarcomas (ES) are rare, aggressive mesenchymal
tumours affecting bones and soft tissues with a peak incidence in
childhood and adolescence (1). In
~85% of patients a t(11;22) (q24;q12) chromosomal translocation can
be detected leading to expression of a chimeric fusion protein
composed of the Ewing sarcoma breakpoint region 1 (EWS) gene
on chromosome 22 and the Fried leukaemia integration 1
(FLI1) gene on chromosome 11. Moreover, other less common
fusion proteins have been described mostly comprising the EWS
transactivation domain (2). The
aberrant transcription factor EWS-FLI1 activates several signalling
pathways promoting proliferation and apoptosis resistance (3–5).
The standard of care for ES is a neo-adjuvant
chemotherapy including doxorubicin, vincristine, cyclophosphamide,
actinomycin D, ifosfamide and etoposide followed by surgery,
conceivably radiation therapy and adjuvant chemotherapy (6,7).
Five-year survival rates for localised disease are ~70%. However,
patients with metastases expect only 5-year survival rates of
20–30% (1).
Multidrug resistance is a common problem in
metastatic and recurrent ES and increases during prolonged therapy
(8). Multidrug resistance
associated protein 1 (MRP1) overexpression is a common feature of
ES, whereas multidrug resistance protein 1 (MDR1) expression is
less common (9). Substrate
specificity of both ABC transporters includes etoposide,
doxorubicin and vincristine implicating their role in therapeutic
resistance of ES (10).
Several clinical trials specifically targeting
receptor tyrosine kinases such as insulin-like growth factor
receptor 1 (IGF-1R), kit, platelet-derived growth factor receptor
(PDGFR), epidermal growth factor receptor (EGFR), vascular growth
factor receptor (VEGFR) or other proteins including Aurora kinase
A, mammalian target of rapamycin (mTOR) or poly (ADP-ribose)
polymerase 1 (PARP1) in ES family tumours are currently in phase I
and II. However, response rates in ES are usually <30% (1). Combination therapy using cytotoxic
drugs and targeted therapeutics may be an opportunity to overcome
drug resistance and improve survival.
The glioma associated oncogene family 1 (GLI1)
transcription factor is a direct transcriptional target of the
EWS-FLI1 fusion protein (11–13).
In several types of cancer, including ES and rhabdomyosarcoma
(RMS), GLI1 has been associated with proliferation and survival
(12,14). Targeting GLI by arsenic trioxide
(ATO) has been shown to reduce viability of several ES cell lines
with an IC50 of ~1 μM using a WST-1 viability assay
(15). Additionally, ATO inhibits
migration and invasion capacity of RD-ES and A673 cells (16). Moreover, Matsumoto et al
reported that GANT61, another GLI inhibitor, was capable of
inducing caspase-3 and -7 independent cell death in the ES cell
line SK-N-LO (17).
In this study, we determined whether GLI inhibition
using ATO or GANT61 specifically and efficiently compromises three
different ES cell lines compared to mesenchymal stem cells (MSC).
Based on our results, we selected ATO for combination experiments
with etoposide and doxorubicin. Especially, the combination of ATO
and etoposide significantly exceeded the effect of each single drug
on viability reduction, clonal growth and cell death induction in
ES cell lines, whereas MSC were hardly compromised by the drug
doses applied in the experiments.
Materials and methods
Reagents
ATO (Trisenox, Pharmacy of University Hospital
Tuebingen) was dissolved in purified water, GANT61 (Abcam,
Cambridge, UK), etoposide and doxorubicin (Selleckchem, Munich,
Germany) were dissolved in dimethyl sulfoxide. For cell culture
treatment stock solutions were further diluted in culture
medium.
Cell lines and culture
RD-ES and A673 cells were obtained from CLS Cell
Lines Service GmbH (Eppelheim, Germany). SK-N-MC were purchased
from ATCC (Manassas, VA, USA). RD-ES and SK-N-MC cells were
maintained in RPMI-1640 with L-glutamine (Gibco, Life Technologies,
Darmstadt, Germany) supplemented with 15% FCS (Biochrom, Berlin,
Germany). A673 cells were cultivated in Dulbecco's modified Eagle's
medium with GlutaMAX, 4.5 g/l D-glucose (Gibco, Life Technologies)
supplemented with 10% FCS (Biochrom). Bone marrow derived MSC were
isolated at the University Hospital Tuebingen after written
informed consent of the patients (approved by The Ethics Committee
of the Medical Faculty, project no. 401/2013 BO2),
propagated as described before (18) and confirmed to represent
multi-lineage differentiation potential toward chondrocytes,
adipocytes and osteocytes (data not shown). All cells were
cultivated at 37°C in humidified atmosphere containing 5%
CO2.
RNA isolation and qRT-PCR
RNA was isolated using the innuPREP RNA Mini kit
(Analytik Jena AG, Jena, Germany). RNA (1 μg) was reverse
transcribed using the innuSCRIPT reverse transcriptase (Analytik
Jena AG). cDNA (50 ng) was analysed in duplicate reactions by
quantitative RT-PCR (qRT-PCR) using gene-specific primers and the
SYBR Select Master mix for CFX (Life Technologies GmbH) in a total
volume of 10 μl. qRT-PCR was carried out in a CFX96 real-time
device (Bio-Rad, Munich, Germany) and was analysed using the CFX
ManagerTM software (Bio-Rad). Relative expression levels
were calculated as fold change compared to MSC using the ΔΔCt
(2−ΔΔCt) method with TATA box binding protein (TBP) as a
reference gene. Hh pathway primers were used according to
Laurendeau et al (19).
Cytotoxicity assay
Cell Titer 96® AQueous One Solution Cell
Proliferation (MTS) assay (Promega, Mannheim, Germany) was used to
measure cell viability via redox enzyme activity, according to the
protocol provided by the manufacturer. A673, RD-ES, SK-N-MC and MSC
(0.5–1×10⁴ cells/well) were grown in 96-well plates.
Twenty-four hours after seeding, the cells were incubated in the
presence of ATO, GANT61, etoposide, doxorubicin or inhibitor
combinations for another 96 h at 37°C in a humidified atmosphere of
5% CO2 in air. At the end of the incubation period, MTS
reagent was added to the wells, and the plate was incubated for 1.5
h protected from light. Absorbance was recorded at 490 nm with a
reference wavelength of 630 nm using an EL 800 reader (BioTek,
Winooski, VT, USA).
IC50 determination
IC50 values of ATO, GANT61, etoposide and
doxorubicin were determined for the different cell lines by
non-linear regression using GraphPad Prism V6.0 software.
Colony formation assay
A673 cells were plated at a density of
1×10³ cells/well, RD-ES cells were plated at a density
of 0.5×10³ cells/well and SK-N-MC were plated at a
density of 1.5×10³ cells/well in a 6-well plate and
incubated with increasing concentrations of ATO, etoposide,
doxorubicin or inhibitor combinations for 72 h, followed by
substitution of the culture medium. After 10 days subsequent growth
in standard growth medium, cells were fixed using ice cold methanol
for 10 min, washed and stored in PBS. Visualisation of fixed cell
colonies was achieved by incubating the cells with 0.5% (w/v)
crystal violet for 30 min. Excess crystal violet was removed by
washing with ddH2O. Visible colonies consisting of ≥50
cells were counted. The colony formation rate was determined:
(number of colonies/number of plated cells) × 100.
Spheroid assay
For generation of 3D spheroids 0.5×10⁴
cells of the ES cell line A673 or 0.25×10⁴ cells of the
ES cell line SK-N-MC were seeded in ultra-low-attachment, U-bottom
96-well plates (Thermo Scientific, Rochester, NY, USA). After 96 h
spheroid formation was documented by micrographs and ATO, etoposide
and doxorubicin were added to the culture medium as indicated.
Ninety-six hours later a second documentation by micrographs was
performed.
Western blot analysis
A673, RD-ES, SK-N-MC or MSC (2.5×10⁵
each) were incubated in 12-well plates with inhibitor
concentrations indicated for 48 h. For analysis, cells were washed
with PBS and lysed in protein lysis buffer (40 mM Tris/HCl pH 7.4,
300 mM NaCl, 2 mM EDTA, 20% glycerol, 2% Triton X-100) supplemented
with proteinase inhibitor at 4°C. Insoluble material was removed by
centrifugation. The protein concentration in the supernatant was
determined by Bradford protein assay. Protein samples (40 μg) were
separated by 10% SDS-PAGE and transferred to a hydrophobic
polyvinylidene difluoride (PVDF) membrane (Immobilon-P; Merck KGaA,
Darmstadt, Germany). After blocking with 5% powdered milk (Carl
Roth, Karlsruhe, Germany) in TBS-T, membranes were incubated with
primary antibodies [GLI1 rabbit pAb #2553, β-tubulin (9F3) rabbit
mAb #2128, cleaved caspase-3 (5A1E) rabbit mAb #9664, anti-cleaved
PARP (DE64E10) rabbit mAb #5625, all 1:1,000, Cell Signaling
Technology, Leiden, The Netherlands; GLI2 (H300) rabbit pAb, 1:200,
sc-28674, Santa Cruz Biotechnology Inc., Dallas, TX, USA] with
gentle shaking overnight at 4°C according to the manufacturer's
protocols. Membranes were washed three times with TBS-T. Secondary
antibody (horseradish peroxidase-conjugated anti-rabbit pAb,
1:10,000, Jackson Immuno Research, West Grove, PA, USA) was added
for 2 h, and the membranes were washed another three times with
TBS-T. Proteins were detected using ECL Western Blotting Substrate
(Thermo Scientific, Waltham, MA, USA) with membranes exposed to
Amersham Hyperfilm ECL (GE Healthcare, Pittsburgh, PA, USA). A
pre-stained protein ladder (PageRuler Plus, Thermo-Scientific) was
used for determination of molecular weights. ImageJ (NIH) was
utilised for western blot quantification.
Flow cytometry
Cell membrane integrity as indicator for cell death
was determined using the fixable viability dye eFluor®
450 (eBioscience, San Diego, CA, USA). A673 (2.5×10⁵),
RD-ES (1.5×10⁵), SK-N-MC (1×10⁵) or MSC
(2.5×10⁵) were incubated with inhibitor concentrations
indicated for 72 h, washed with PBS, detached with trypsin, and
stained for 30 min at 4°C in the dark. Cells were washed with PBS
and fixed with 0.5% formaldehyde diluted in PBS before being
resuspended in FACS buffer (PBS containing 2% FCS, 2 mM EDTA). Flow
cytometric analysis was performed on an LSRII flow cytometer
(Becton-Dickinson, Franklin Lakes, NJ, USA) using FlowJo Software
(Tree Star Inc., Ashland, OR, USA) for data evaluation.
Statistical analysis
All statistical tests were performed using GraphPad
Prism V6.0 software and statistical differences were analysed by
two-way ANOVA with p≤0.05, p≤0.01 and p≤0.001 considered as
statistically significant. Multiple comparisons between groups were
performed using Tukey's test.
Results
Expression of hedgehog pathway genes in
ES cell lines
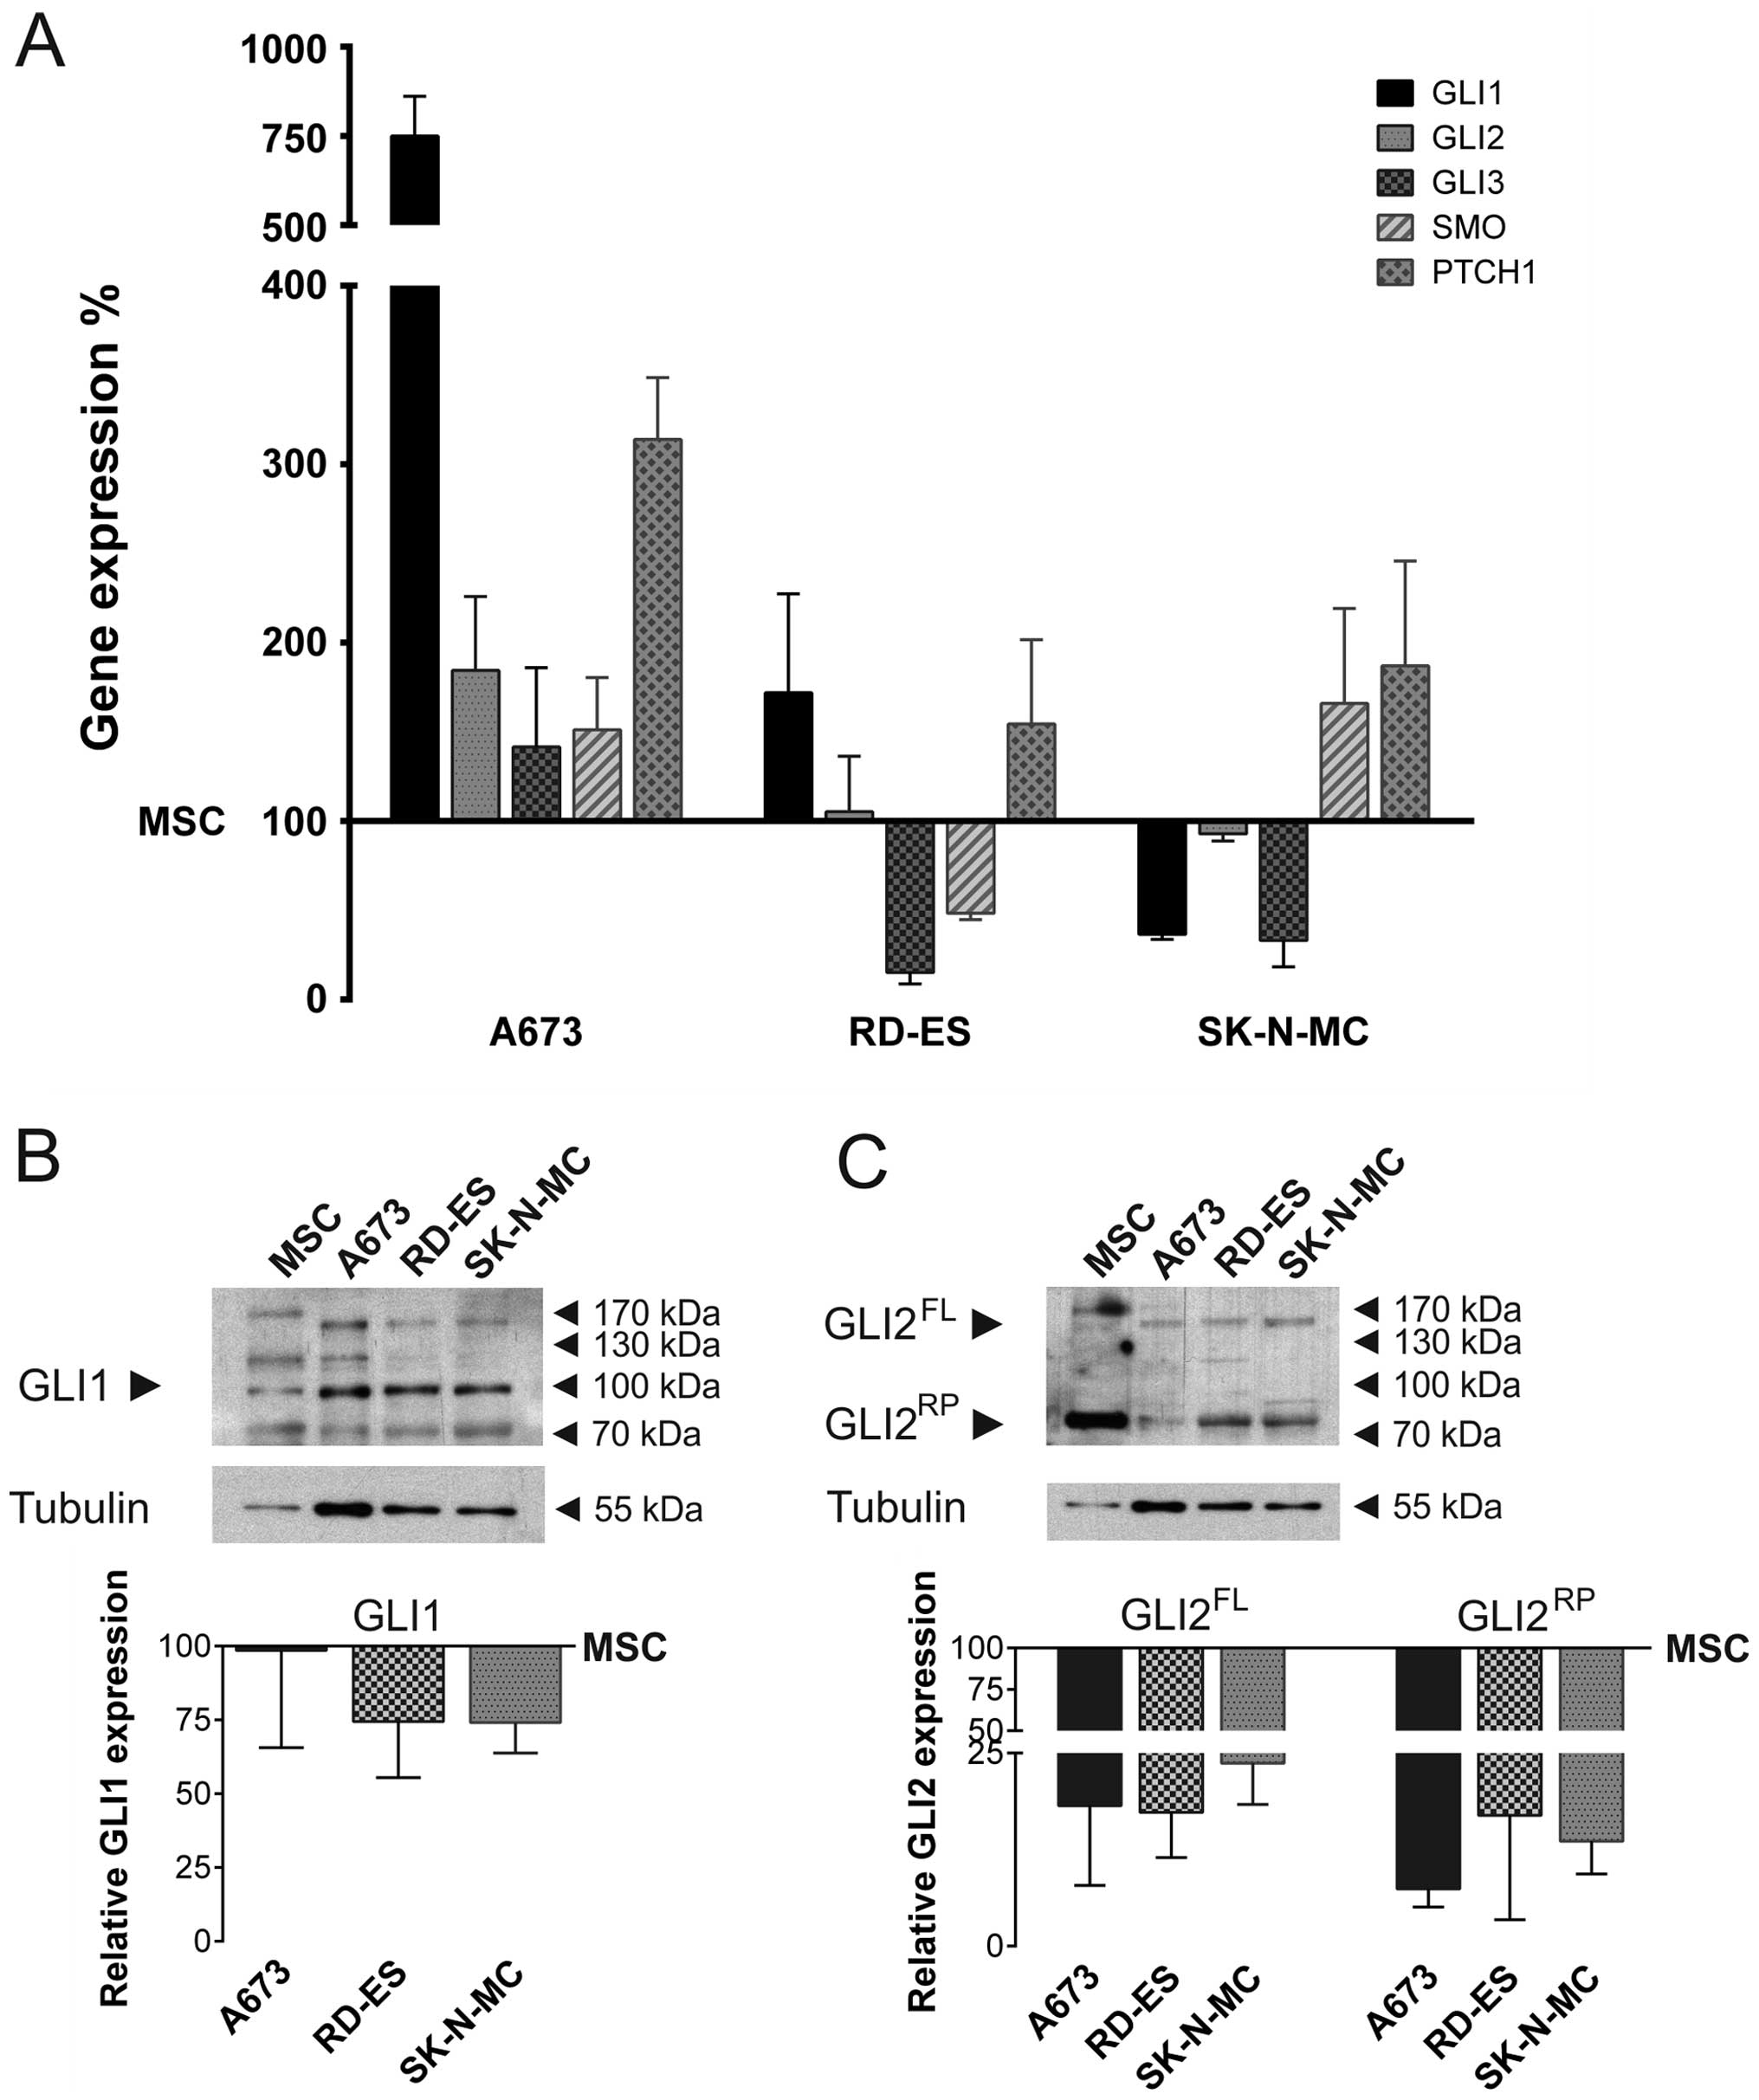
Hh pathway gene expression was determined in three
human ES cell lines, compared to MSC (Fig. 1A). Quantitative real-time PCR
revealed that GLI1 mRNA expression was considerably elevated in
A673 cells compared to MSC, whereas it was downregulated in
SK-N-MC. Also GLI2 mRNA was slightly overexpressed in A673, whereas
its expression level in RD-ES and SK-N-MC resembled the MSC
control. GLI3 mRNA was marginally overexpressed in A673, but
downregulated in RD-ES and SK-N-MC. SMO mRNA expression was
slightly enhanced in A673 and SK-N-MC compared to MSC, whereas it
was downregulated in RD-ES. Hh receptor PTCH1 mRNA was
overexpressed in all ES cell lines compared to MSC, however only
A673 cells showed a strong overexpression.
GLI1 protein expression was analysed by western
blotting in ES cell lines and MSC (Fig. 1B). All splice variants ≥100 kDa
were quantified and normalised to tubulin expression. The graph
shows the full length GLI1 protein expression relative to MSC. In
contrast to the overexpression of GLI1 mRNA, GLI1 protein
expression of A673 cells mostly resembled MSC. In RD-ES and SK-N-MC
GLI1 protein expression was reduced compared to MSC. In addition,
GLI2 protein expression was determined by western blotting. The
abundance of the full length and repressor form was quantified and
normalised to tubulin expression. Both, GLI2 full length and
repressor protein was expressed in all ES cell lines, however being
very faint compared to the expression in MSC (Fig. 1C).
GLI inhibition and cytotoxic drugs reduce
viability of human ES cell lines
MTS viability assays were performed to determine
IC50 values of ATO, GANT61, etoposide and doxorubicin in
the three ES cell lines and MSC (Table
I). While viability of MSC was still 82.4% after 96 h of
incubation with 10 μM ATO, the IC50 values for the ES
cell lines ranged from 0.23 μM in A673 to 4.42 μM in SK-N-MC. This
indicates that ATO specifically reduced viability of the tumour
cell lines using doses ≤5 μM. The second GLI inhibitor, GANT61,
inhibited the viability of A673 cells with an IC50 of
12.01 μM. A similar IC50 of 16.05 μM was obtained in
MSC. In contrast, both RD-ES (IC50 35.37 μM) and SK-N-MC
(IC50 59.56 μM) were significantly more resistant to
GANT61. Using 35 μM of the topoisomerase inhibitor etoposide 85.6%
of MSC were viable. In contrast, the IC50 values
obtained in the ES cell lines were 0.88 μM (A673), 1.06 μM (RD-ES)
and 1.11 μM (SK-N-MC) revealing a high sensitivity. Doxorubicin, a
DNA intercalating anthracycline, reduced the viability of A673
cells with an IC50 of 27.18 nM. SK-N-MC (IC50
75.15 nM) and RD-ES (IC50 115 nM) were more resistant.
MSC (58.6±1%) were still viable at the highest doxorubicin dose
used (150 nM), recommending the use of lower doxorubicin doses to
specifically target the tumour cells.
 | Table IHh pathway inhibition and cytostatic
drugs reduce viability in human ES cell lines. |
Table I
Hh pathway inhibition and cytostatic
drugs reduce viability in human ES cell lines.
| Inhibitor | Cell line |
IC50 |
|---|
| ATO | MSC | >10.00 μM |
| A673 | 0.23 μM |
| RD-ES | 1.91 μM |
| SK-N-MC | 4.42 μM |
| GANT61 | MSC | 16.05 μM |
| A673 | 12.01 μM |
| RD-ES | 35.37 μM |
| SK-N-MC | 59.56 μM |
| Etoposide | MSC | >35.00 μM |
| A673 | 0.88 μM |
| RD-ES | 1.06 μM |
| SK-N-MC | 1.11 μM |
| Doxorubicin | MSC | >150.00 nM |
| A673 | 27.18 nM |
| RD-ES | 115.00 nM |
| SK-N-MC | 75.15 nM |
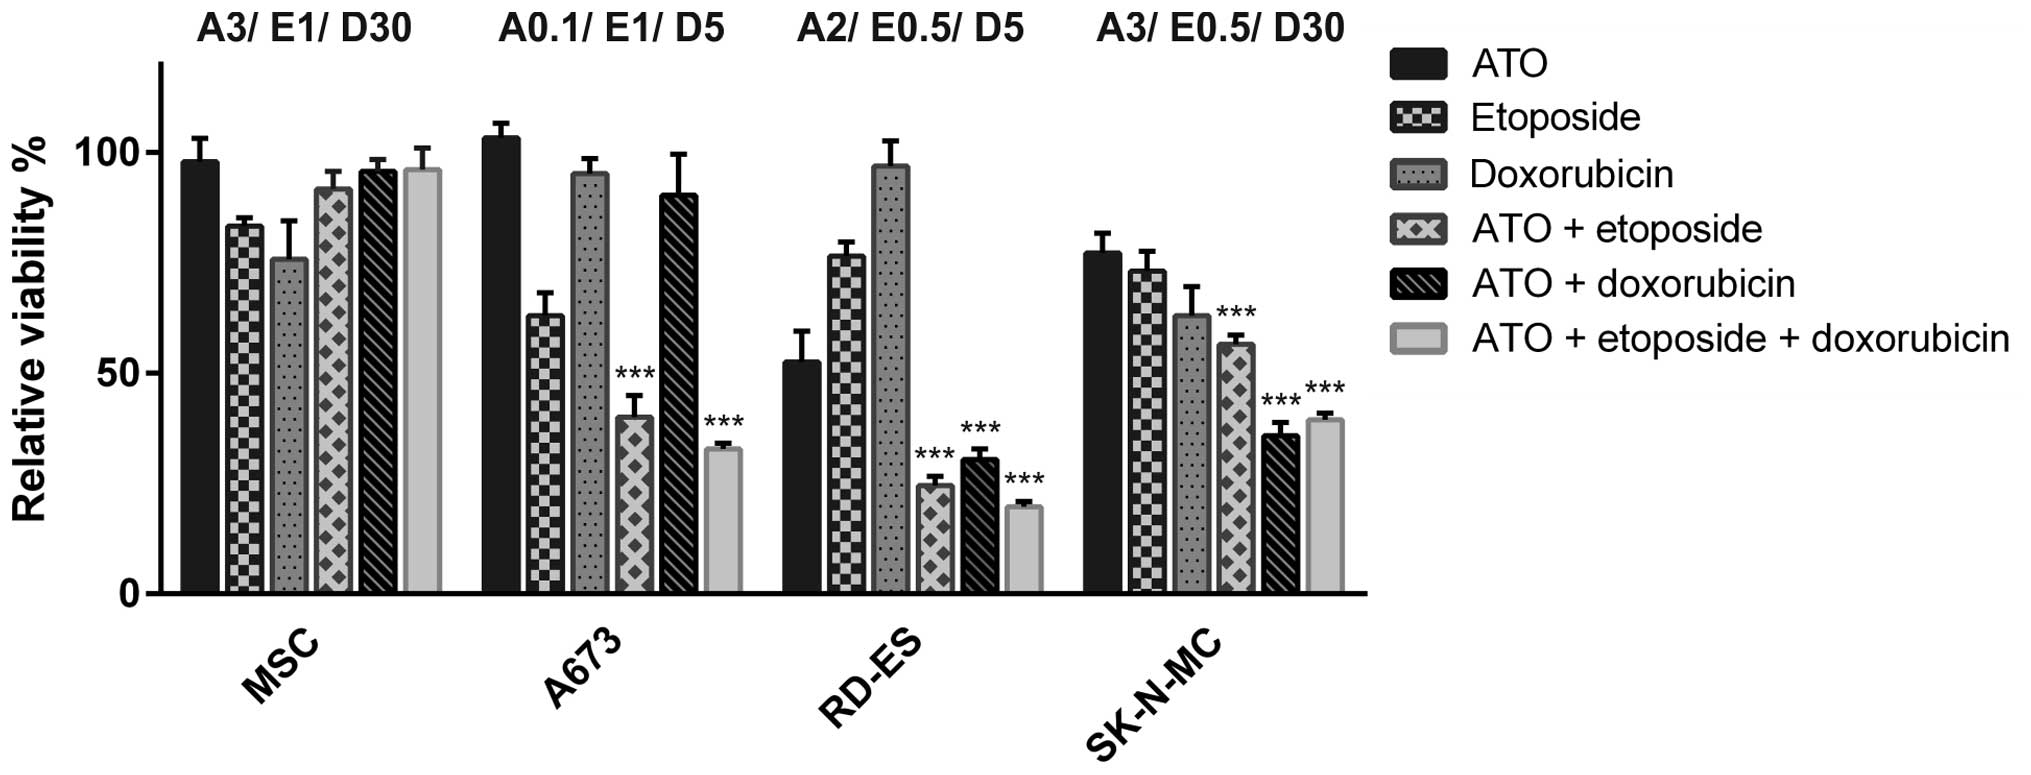
Combination of ATO with etoposide and
doxorubicin augments viability reduction
To determine potential additive effects of ATO and
the cytostatic agents etoposide and doxorubicin, low doses of ATO
and both chemotherapeutics were used in combination experiments.
The individual concentrations were adjusted for each cell line to
consider specific sensitivities for each substance (Fig. 2). A673 cells showed a significant
viability reduction to 40.1±4.9% compared to mock-treated control
after the combination of 0.1 μM ATO and 1 μM etoposide, whereas
additional application of 5 nM doxorubicin reduced viability to
32.8±1.3%. After the double treatment with the respective ATO and
doxorubicin doses viability was hardly affected, while the single
application of 1 μM etoposide was sufficient to reduce the
metabolic activity of A673 cells to 63.1±5.1%. Due to the very
distinct sensitivity of the A673 cell metabolism to ATO,
combination experiments were performed with extremely low ATO
concentrations. The etoposide dose applied for these cells
corresponded to the half maximal inhibitory concentration. In RD-ES
cells a combination of 2 μM ATO and 0.5 μM etoposide or 5 nM
doxorubicin reduced the viability <30% of mock-treated control,
which was only slightly enhanced by the triple combination
(19.8±1.1%). Regarding the single drug applications used, the dose
of 2 μM ATO was most efficient (52.5±7%) in RD-ES cells,
representing the half maximal inhibitory concentration. With the
exception of etoposide, SK-N-MC cells were more resistant to the
single drugs compared to the other ES cell lines. Best results for
combination treatment were achieved after incubation with 3 μM ATO
and 30 nM doxorubicin (35.8±3.1% viable cells). The combination of
3 μM ATO with 0.5 μM etoposide was less effective (56.6±2.1% viable
cells) and also the triple combination did not exceed the combined
ATO and doxorubicin effect (39.5±1.5%). MSC were not severely
affected by the highest substance doses of 3 μM ATO, 1 μM etoposide
and 30 nM doxorubicin used for the ES cells. Indeed, viability was
still higher after treatment with drug combinations compared to the
applied etoposide (83.39±1.9% viable cells) and doxorubicin
(75.84±8.7% viable cells) concentrations alone.
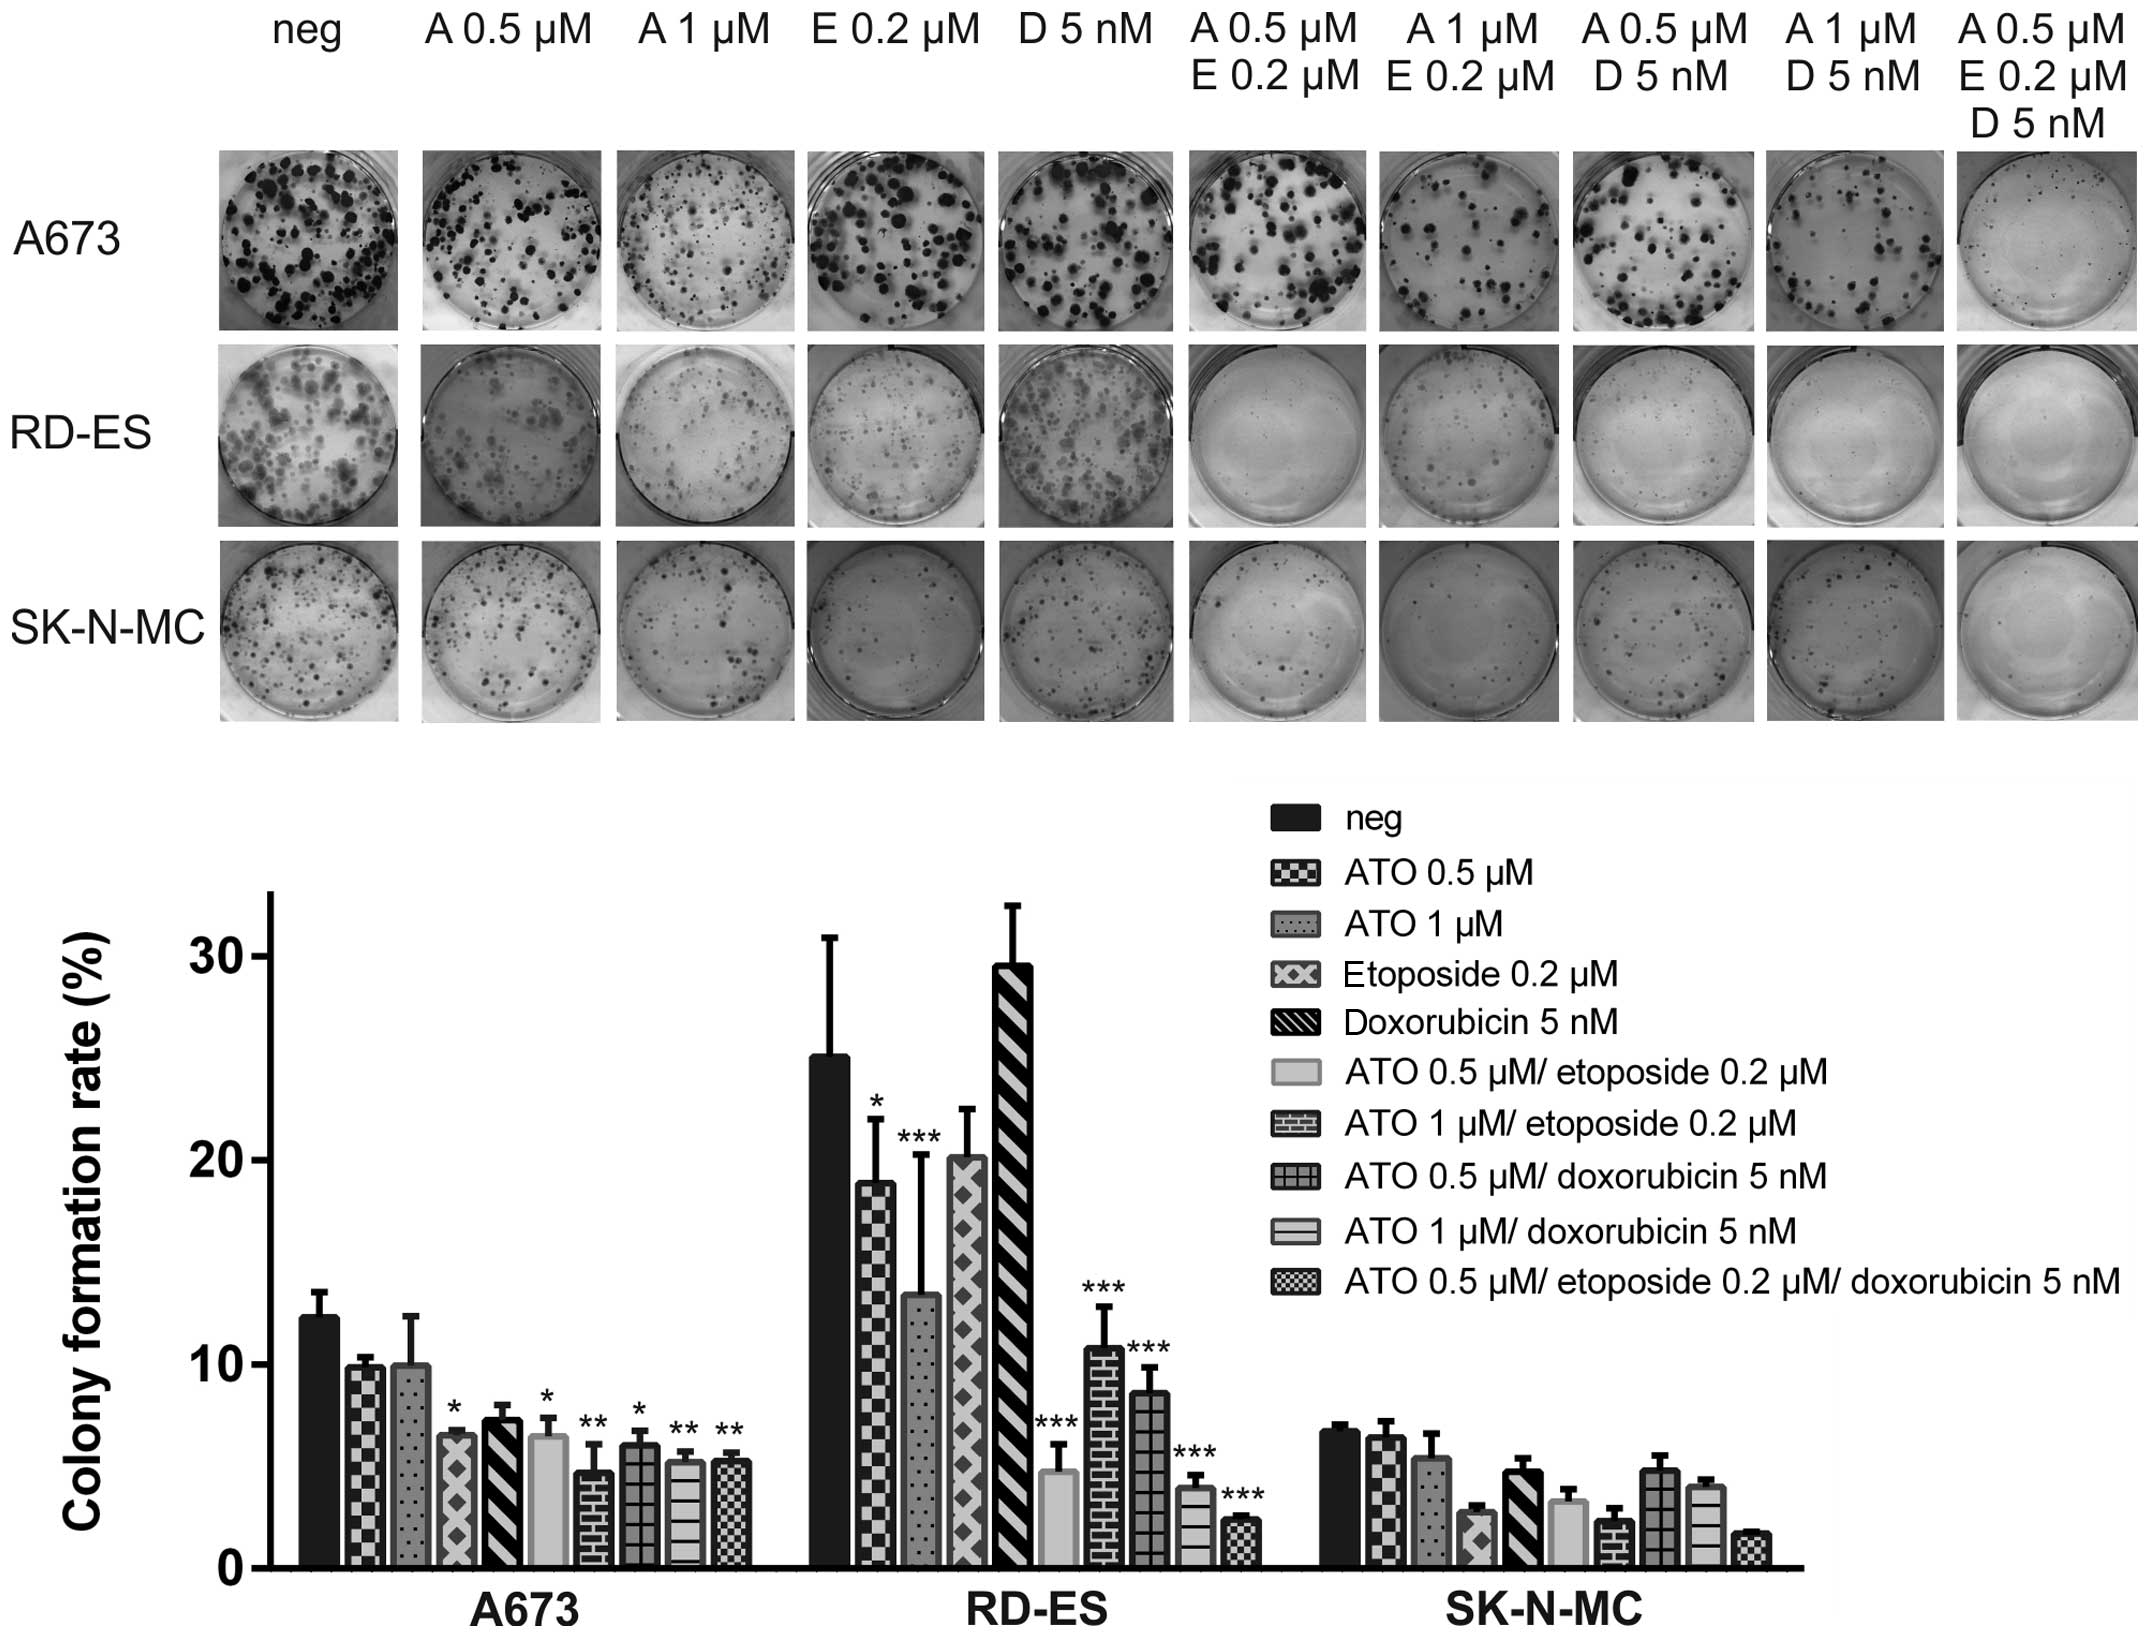
ATO in combination with etoposide and
doxorubicin impairs colony formation of ES cell lines
Colony formation assays were performed in the ES
cell lines A673, RD-ES and SK-N-MC using 0.5 μM or 1 μM ATO in
combination with 0.2 μM etoposide or 5 nM doxorubicin (Fig. 3). The colony formation rate of
mock-treated RD-ES cells (25.1±5.8%) was higher compared to A673
(12.3±1.3%) or even SK-N-MC, where only 6.7±0.3% of the plated
cells formed colonies. Single application of 0.2 μM etoposide
significantly reduced colony numbers in A673 cells (6.5±0.3%) and
the combination of 0.2 μM etoposide and 1 μM ATO exceeded the
effect of the single treatment (colony formation rate 4.7±1.4%).
Also combination of 5 nM doxorubicin with 1 μM ATO (5.2±0.5%
remaining colonies) was superior compared to the single agents in
A673. The triple combination using 0.5 μM ATO, 0.2 μM etoposide and
5 nM doxorubicin was equally efficient compared to both double
treatments utilising 1 μM ATO. Interestingly, just A673 cells,
being extremely ATO sensitive in the viability assays, were quite
resistant in these experiments with several small colonies
remaining even after the triple treatment.
In RD-ES cells, ATO single treatment was already
sufficient to significantly reduce colony formation (colony
formation rate 0.5 μM ATO: 9.9±0.5%, 1 μM ATO: 9.9±2.4%), whereas
0.2 μM etoposide or 5 nM doxorubicin had less impact. Combination
of both ATO concentrations with etoposide or doxorubicin
potentiated the decline of colony formation with the combination of
5 nM doxorubicin and 1 μM ATO (colony formation rate 3.9±0.6%)
being the most efficient. The triple combination was still superior
to all double combinations reducing the colony formation rate to
2.4±0.2%.
Due to generally restricted colony formation of
SK-N-MC cells no treatment led to a significant reduction of colony
numbers counted. However, etoposide as well as the combination of 1
μM ATO and 0.2 μM etoposide reduced the colony formation rate
<3%, whereas the triple combination was the most efficient
(1.7±0.1% residual colonies).
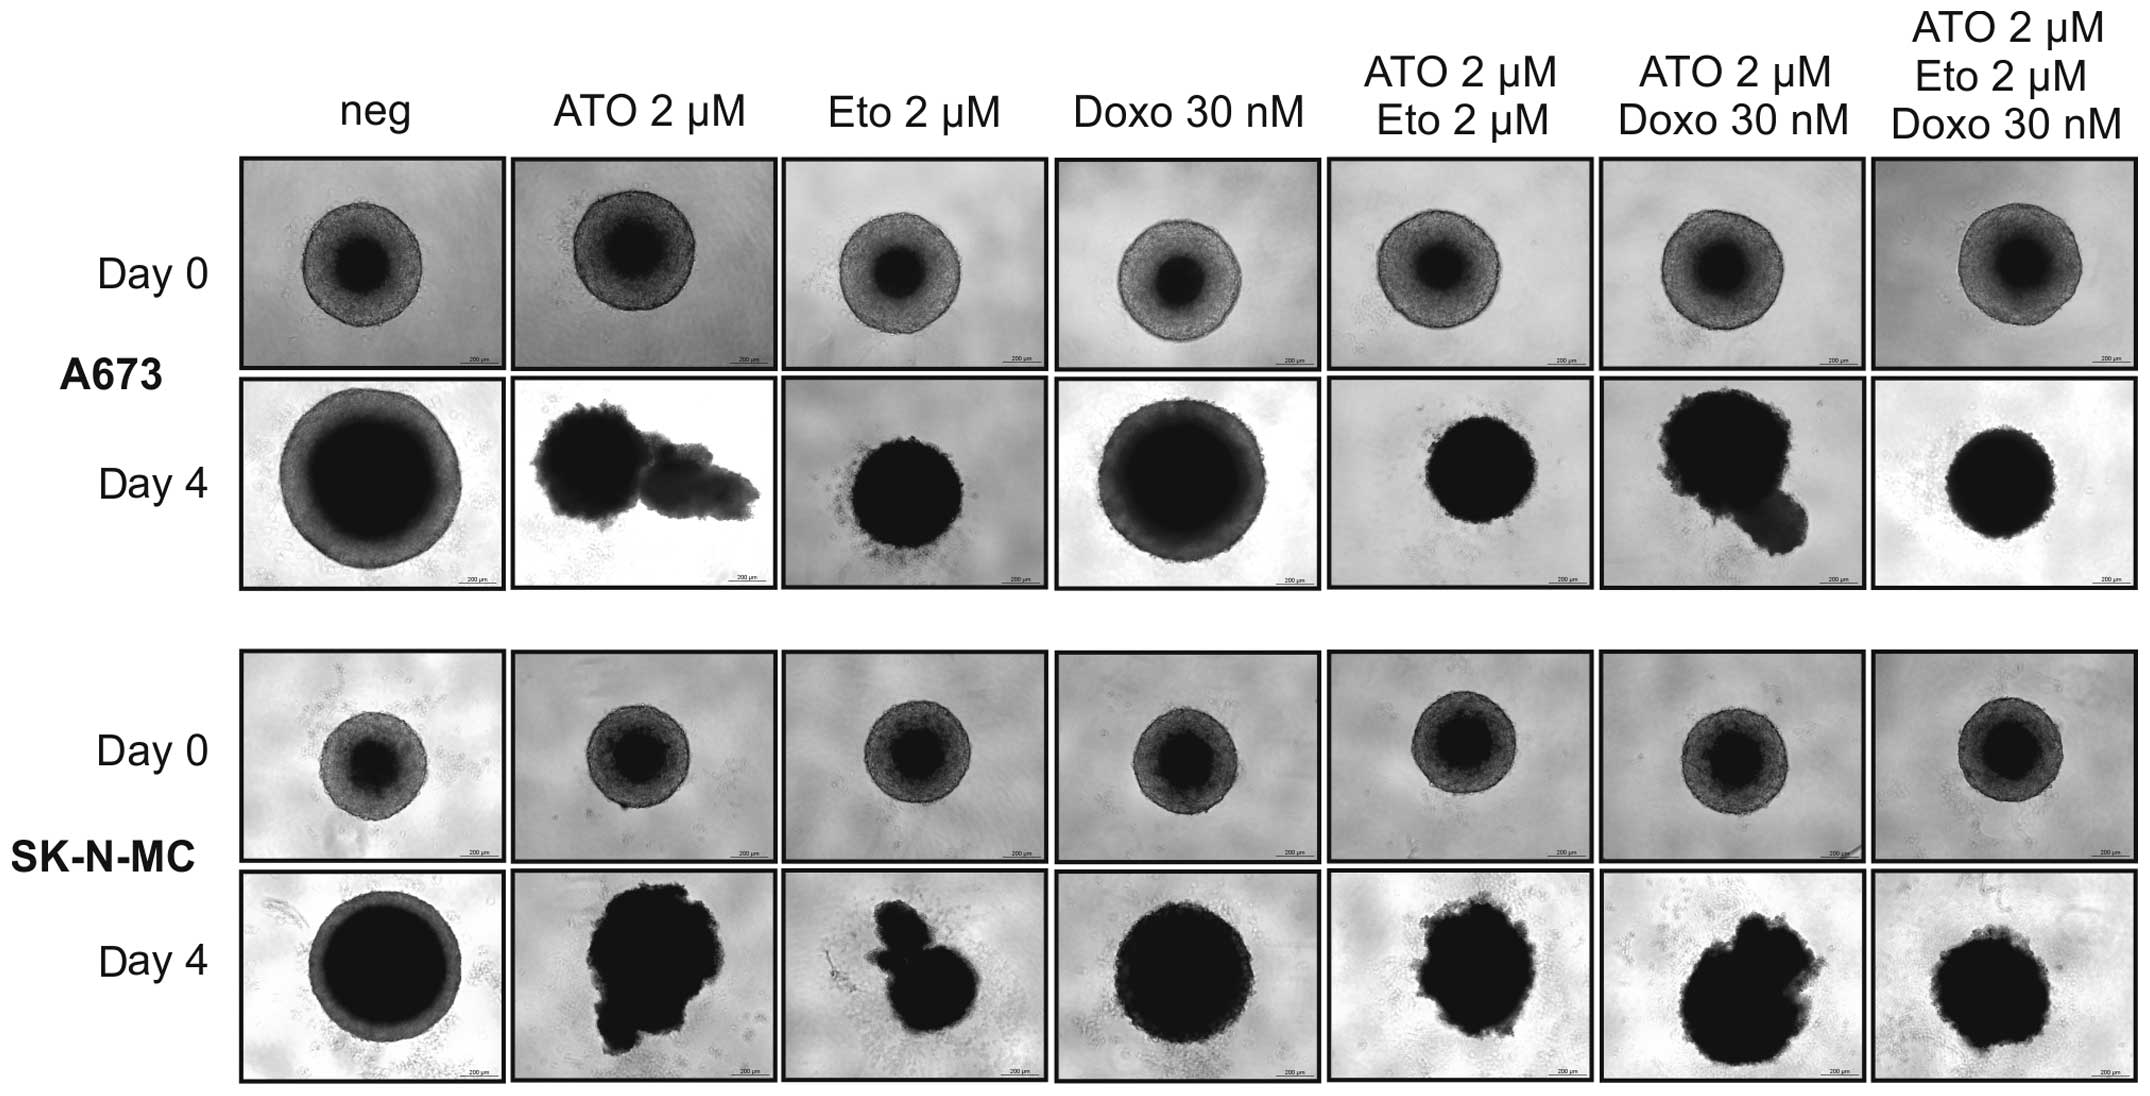
Etoposide, ATO and combinations thereof
reduce ES cell growth in 3D spheroid cultures
To simulate gradients in nutrition and oxygen
availability as well as drug penetration in vivo we used 3D
spheroid cultures of A673 and SK-N-MC cells (Fig. 4). The cell line RD-ES refused to
form stable 3D cultures and had to be excluded from this
experiment. Drug concentrations used in single, double and triple
application in this assay were 2 μM ATO, 2 μM etoposide and 30 nM
doxorubicin. Especially 2 μM etoposide reduced the spheroid size
and cohesion after four days of incubation in both ES cell lines.
ATO (2 μM) also partially lysed the spheroids, whereas 30 nM
doxorubicin were less efficient compared to the other agents. For
both, A673 and SK-N-MC cells, none of the combinations outranked
the effect of etoposide single treatment.
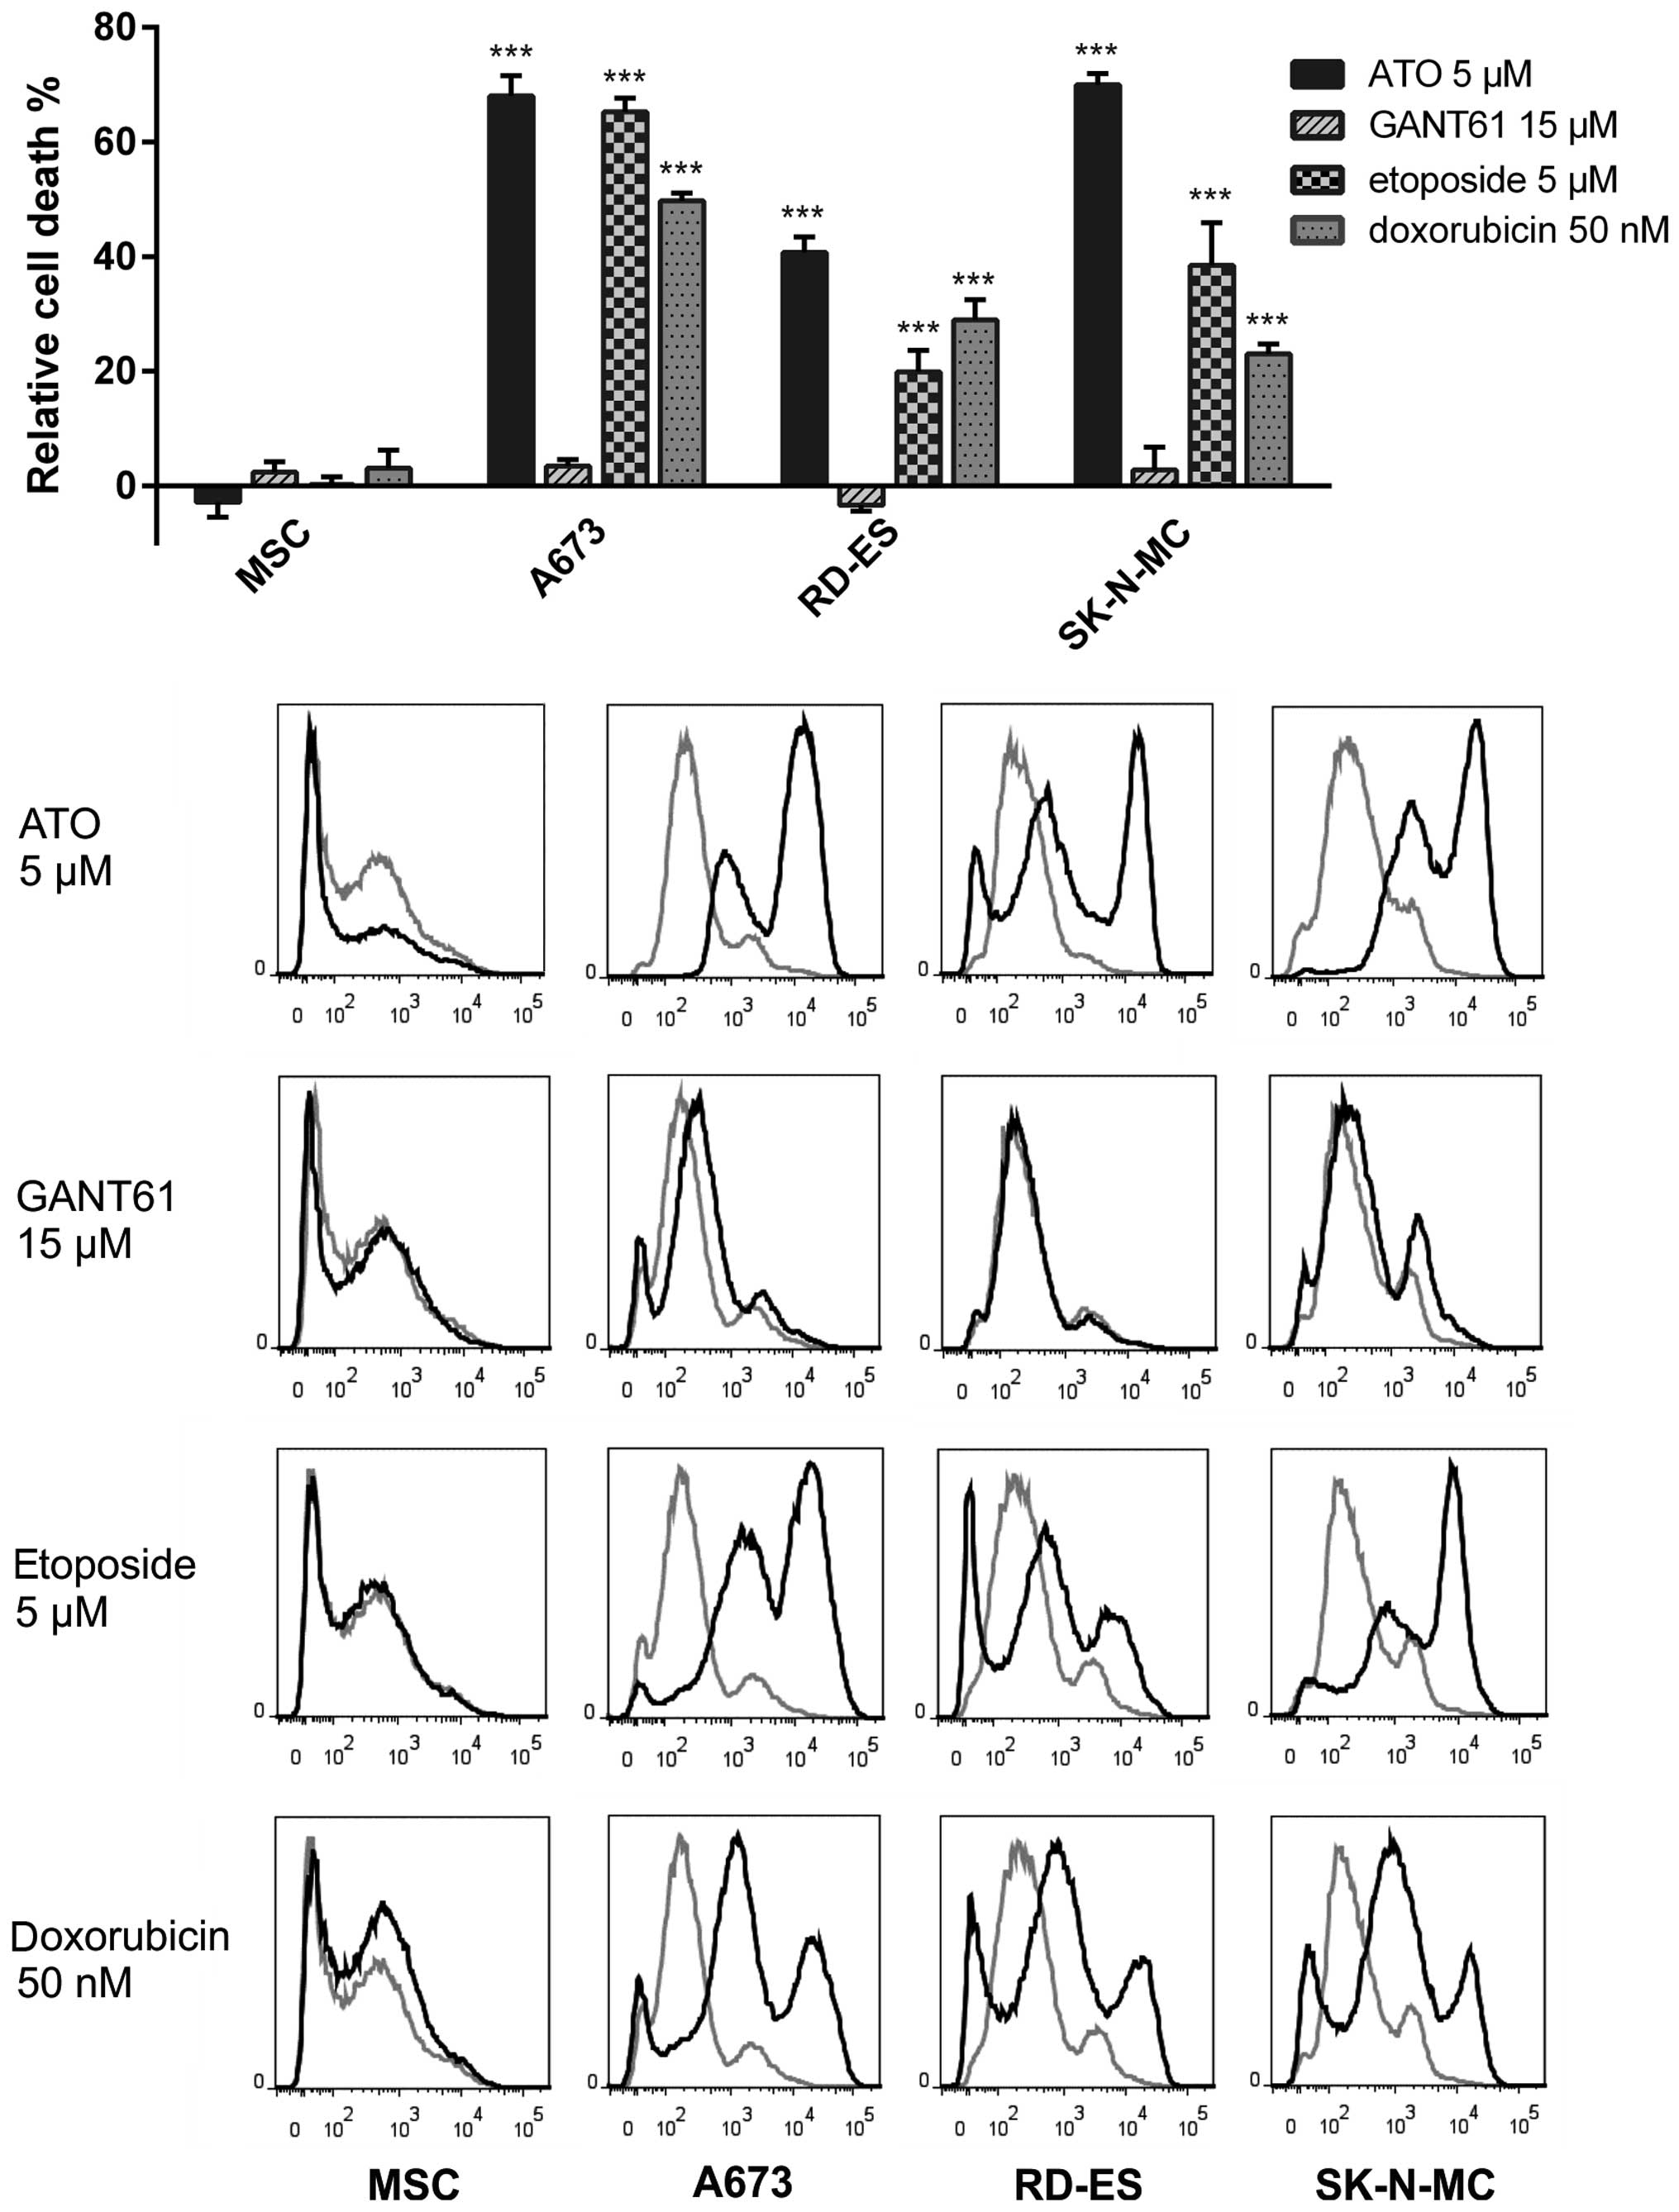
ATO, etoposide and doxorubicin induce
cell death in ES cell lines
To exclude that the drugs have only transient growth
arresting and viability reducing properties, flow cytometry
analysis to detect incorporation of the fixable viability dye
eFluor® 450 was performed. The dye is excluded from
cells with intact membranes, therefore apoptotic or necrotic cells
with membrane degradation can be quantified using this method. The
ES cell lines A673, RD-ES and SK-N-MC as well as MSC were incubated
with ATO, GANT61, etoposide or doxorubicin for three days (Fig. 5). ATO (5 μM) was sufficient to
induce maximum cell death compared to the other treatments in this
assay. Indeed, within the ES cell lines RD-ES exhibited the lowest
amount of dead cells (41±2.7%) after incubation with 5 μM ATO,
whereas 70±1.9% of SK-N-MC and 68±3.6 of A673 cells lost membrane
integrity three days after application of this dose. GANT61, on the
other hand, failed to induce significant cell death in all three ES
cell lines at the concentration of 15 μM. Also treatment with 5 μM
etoposide was sufficient to induce significant death rates in A673
cells (65.2±2.4%). The response of RD-ES cells was much less
distinct (19.9±3.8%), while SK-N-MC exhibited an intermediate death
rate of 38.5±7.4% compared to mock-treated control. As for the
other substances, the death rate after incubation with 50 nM
doxorubicin obtained in A673 cells was higher (49.7±1.4%) than in
RD-ES (28.9±3.6%) or SK-N-MC (23±1.7%). For MSC no significant cell
death induction was detectable using any of the substances.
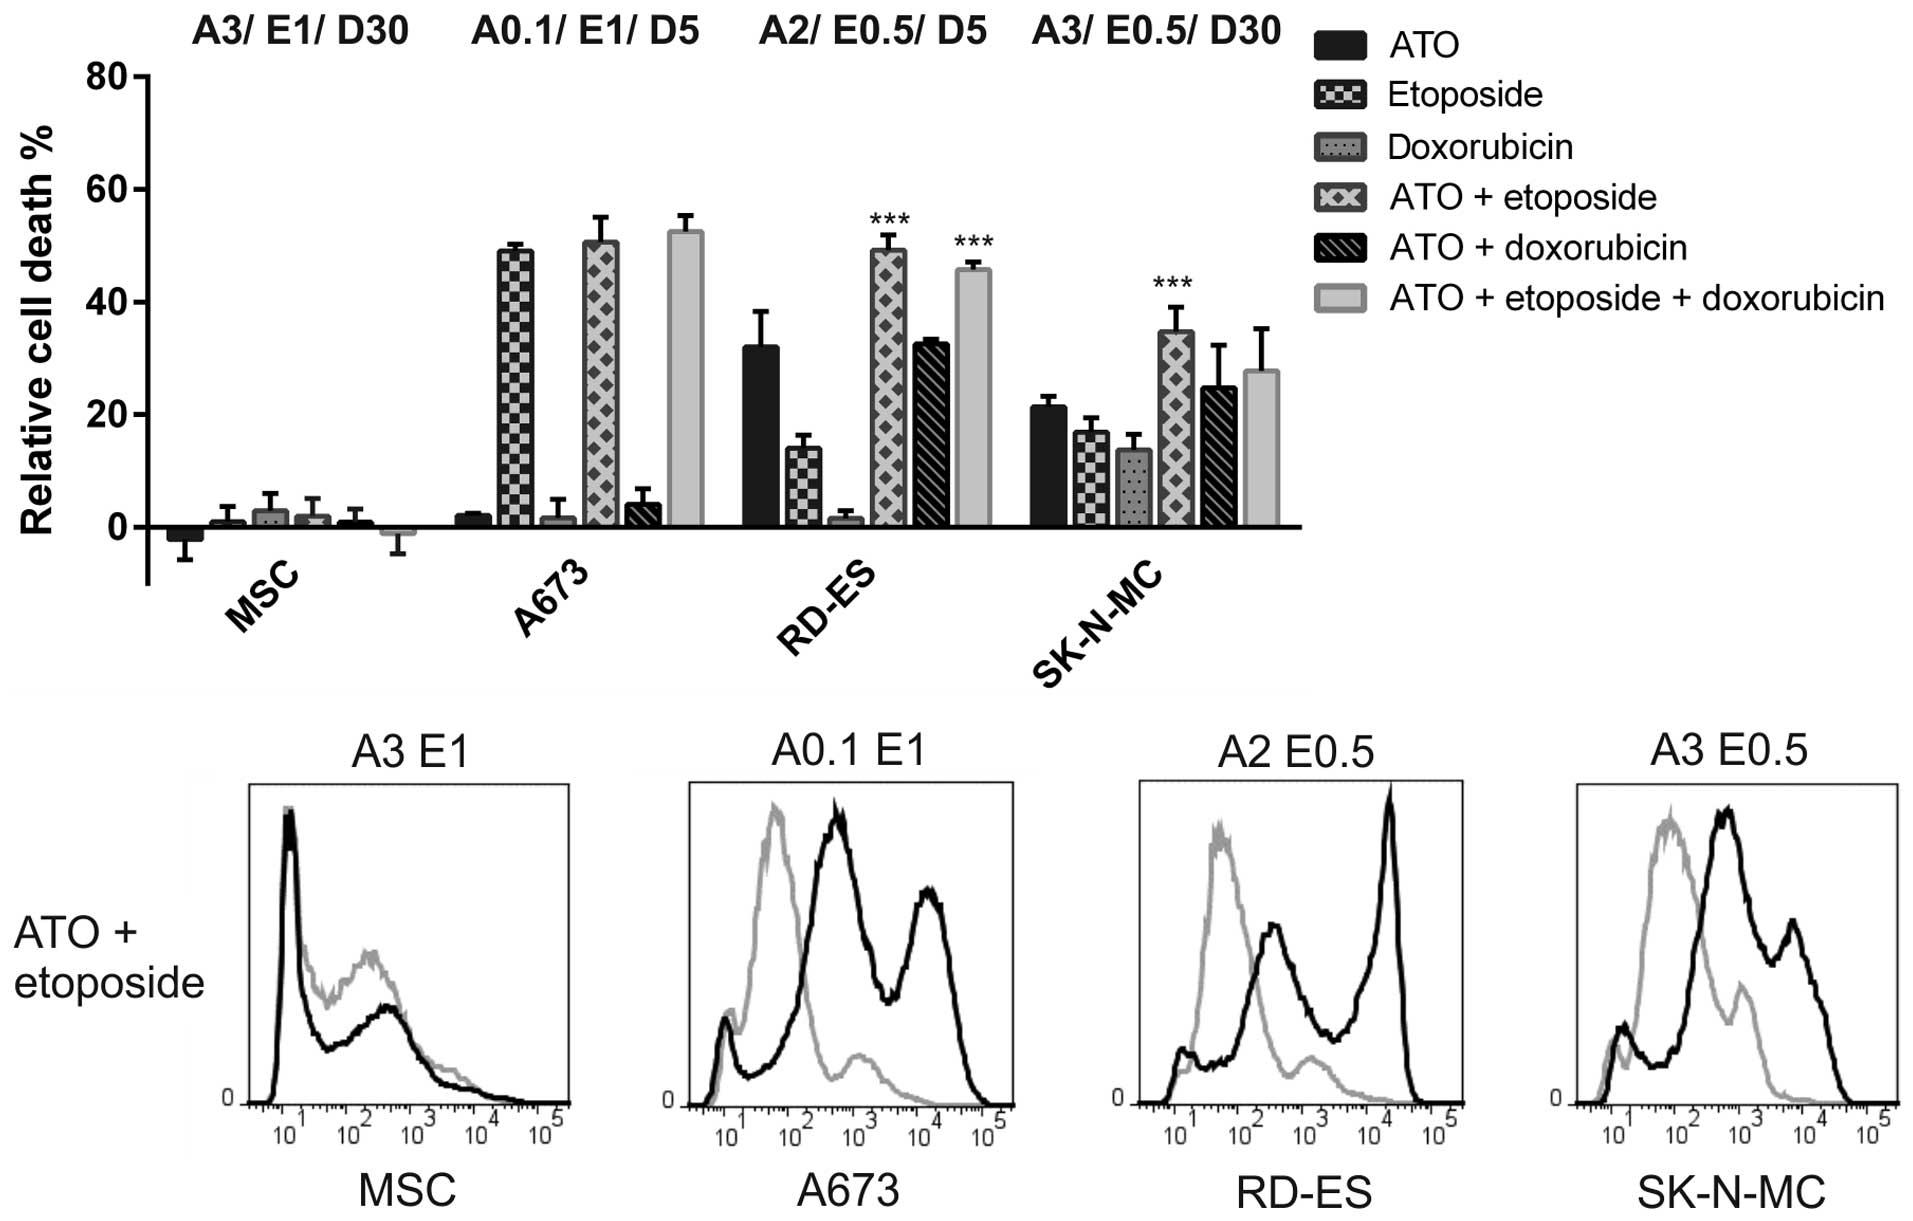
Combination of ATO and etoposide
potentiates the cell death induction in ES cell lines
In combination experiments detecting incorporation
of the fixable viability dye eFluor® 450 (Fig. 6) ATO, etoposide and doxorubicin
concentrations were used according to the MTS approach. In A673
cells 1 μM etoposide was sufficient to induce 49.1±1.2% cell death,
which was, in contrast to the viability assay, not exceeded by the
combination with 0.1 μM ATO (50.6±4.4%) or the triple combination
including 5 nM doxorubicin (52.5±2.8%). Membrane integrity was not
affected by the low ATO and doxorubicin concentrations applied. In
RD-ES cells, both the combination of 2 μM ATO and 0.5 μM etoposide
as well as the triple combination including 5 nM doxorubicin
clearly surpassed the efficiency of each single substance. However,
the death rate after application of the triple combination
(45.7±1.4%) was not higher compared to the double treatment using
ATO and etoposide (49.2±2.7%). The ATO-doxorubicin combination
showed a comparable impact (32.6±0.8% dead cells) as 2 μM ATO
(32.1±6.3%). In SK-N-MC only the combination of 3 μM ATO and 0.5 μM
etoposide induced a significantly stronger death response
(34.7±4.4%) compared to the single substances, whereas the triple
combination was less efficient (27.7±7.5%). Basically, the
combination of ATO and etoposide appeared to be most efficient in
all ES cell lines and, with the exception of A673 cells, clearly
superior compared to both single applications.
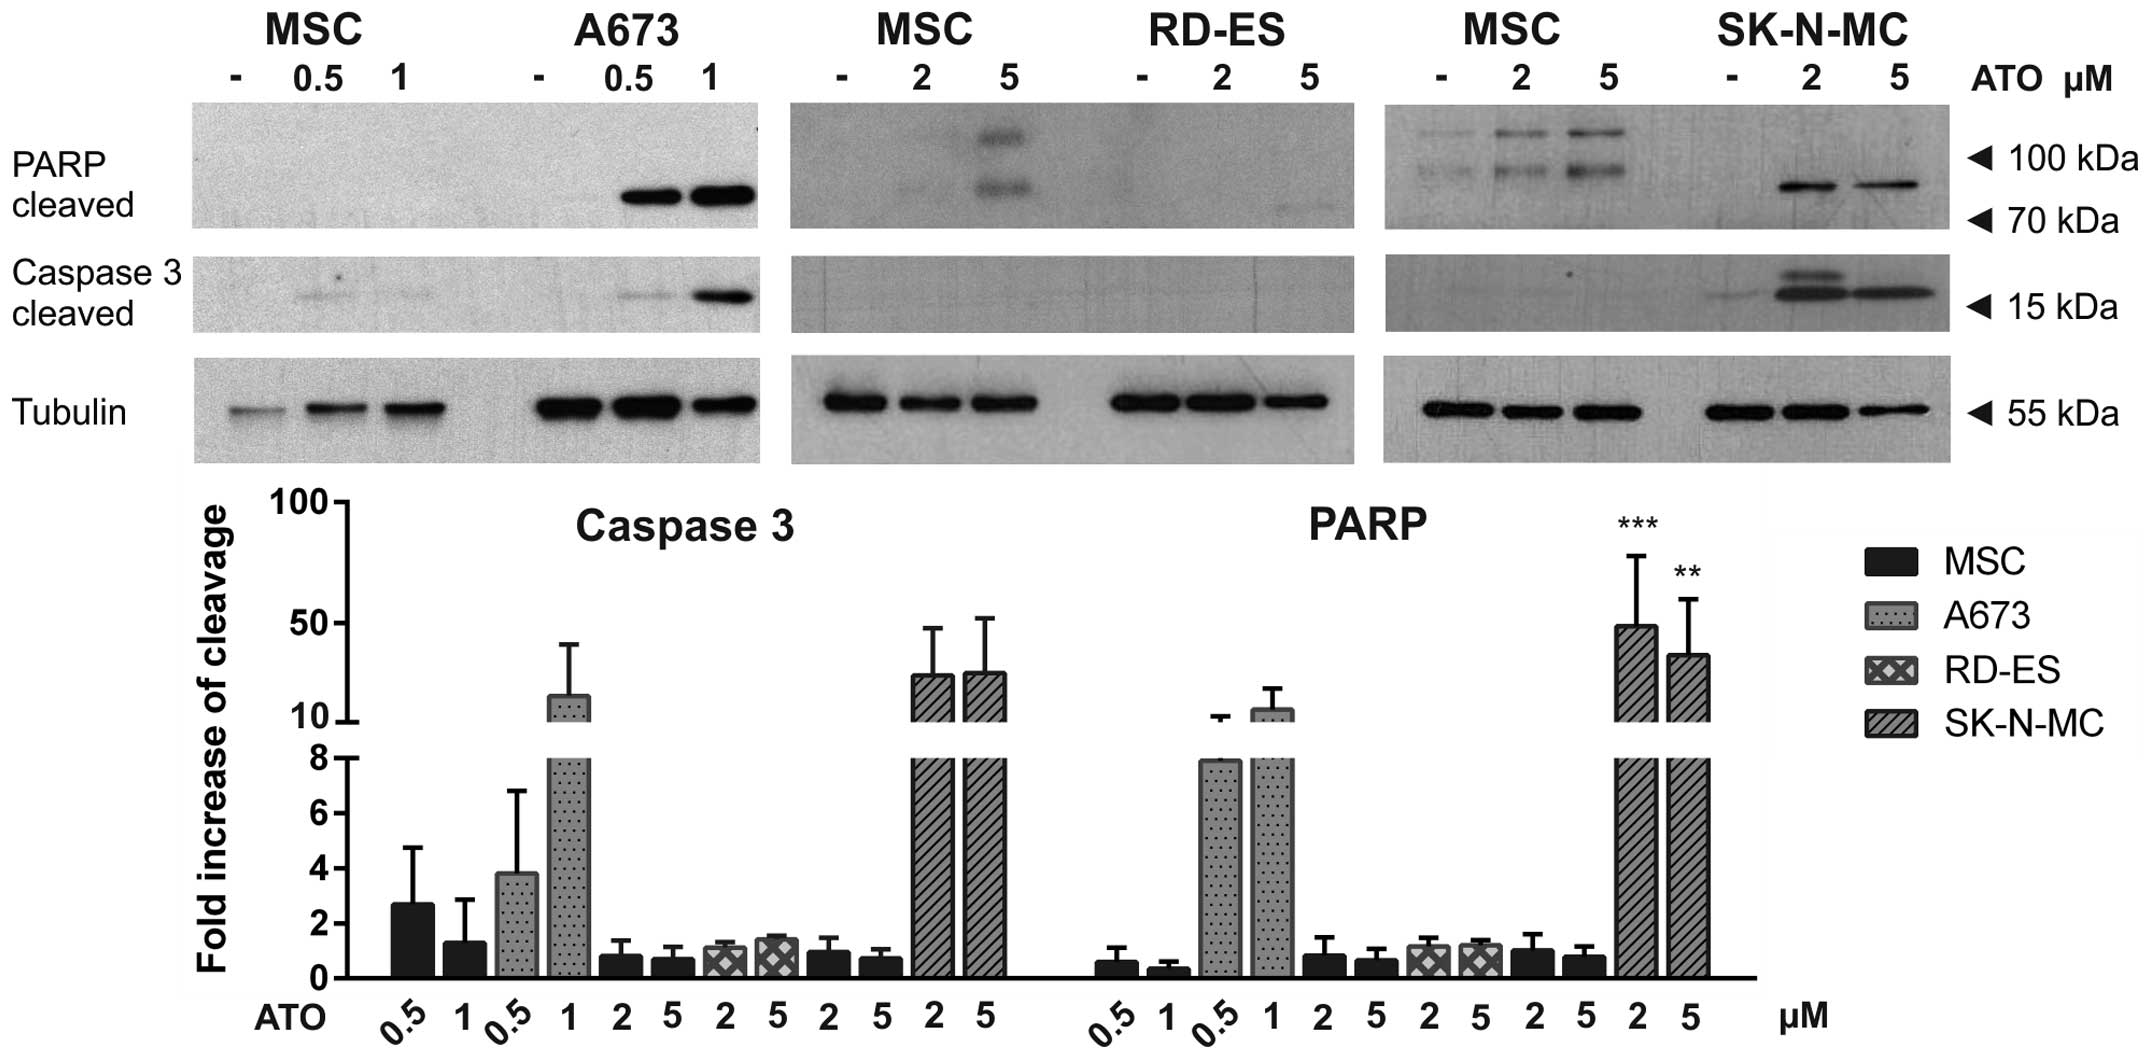
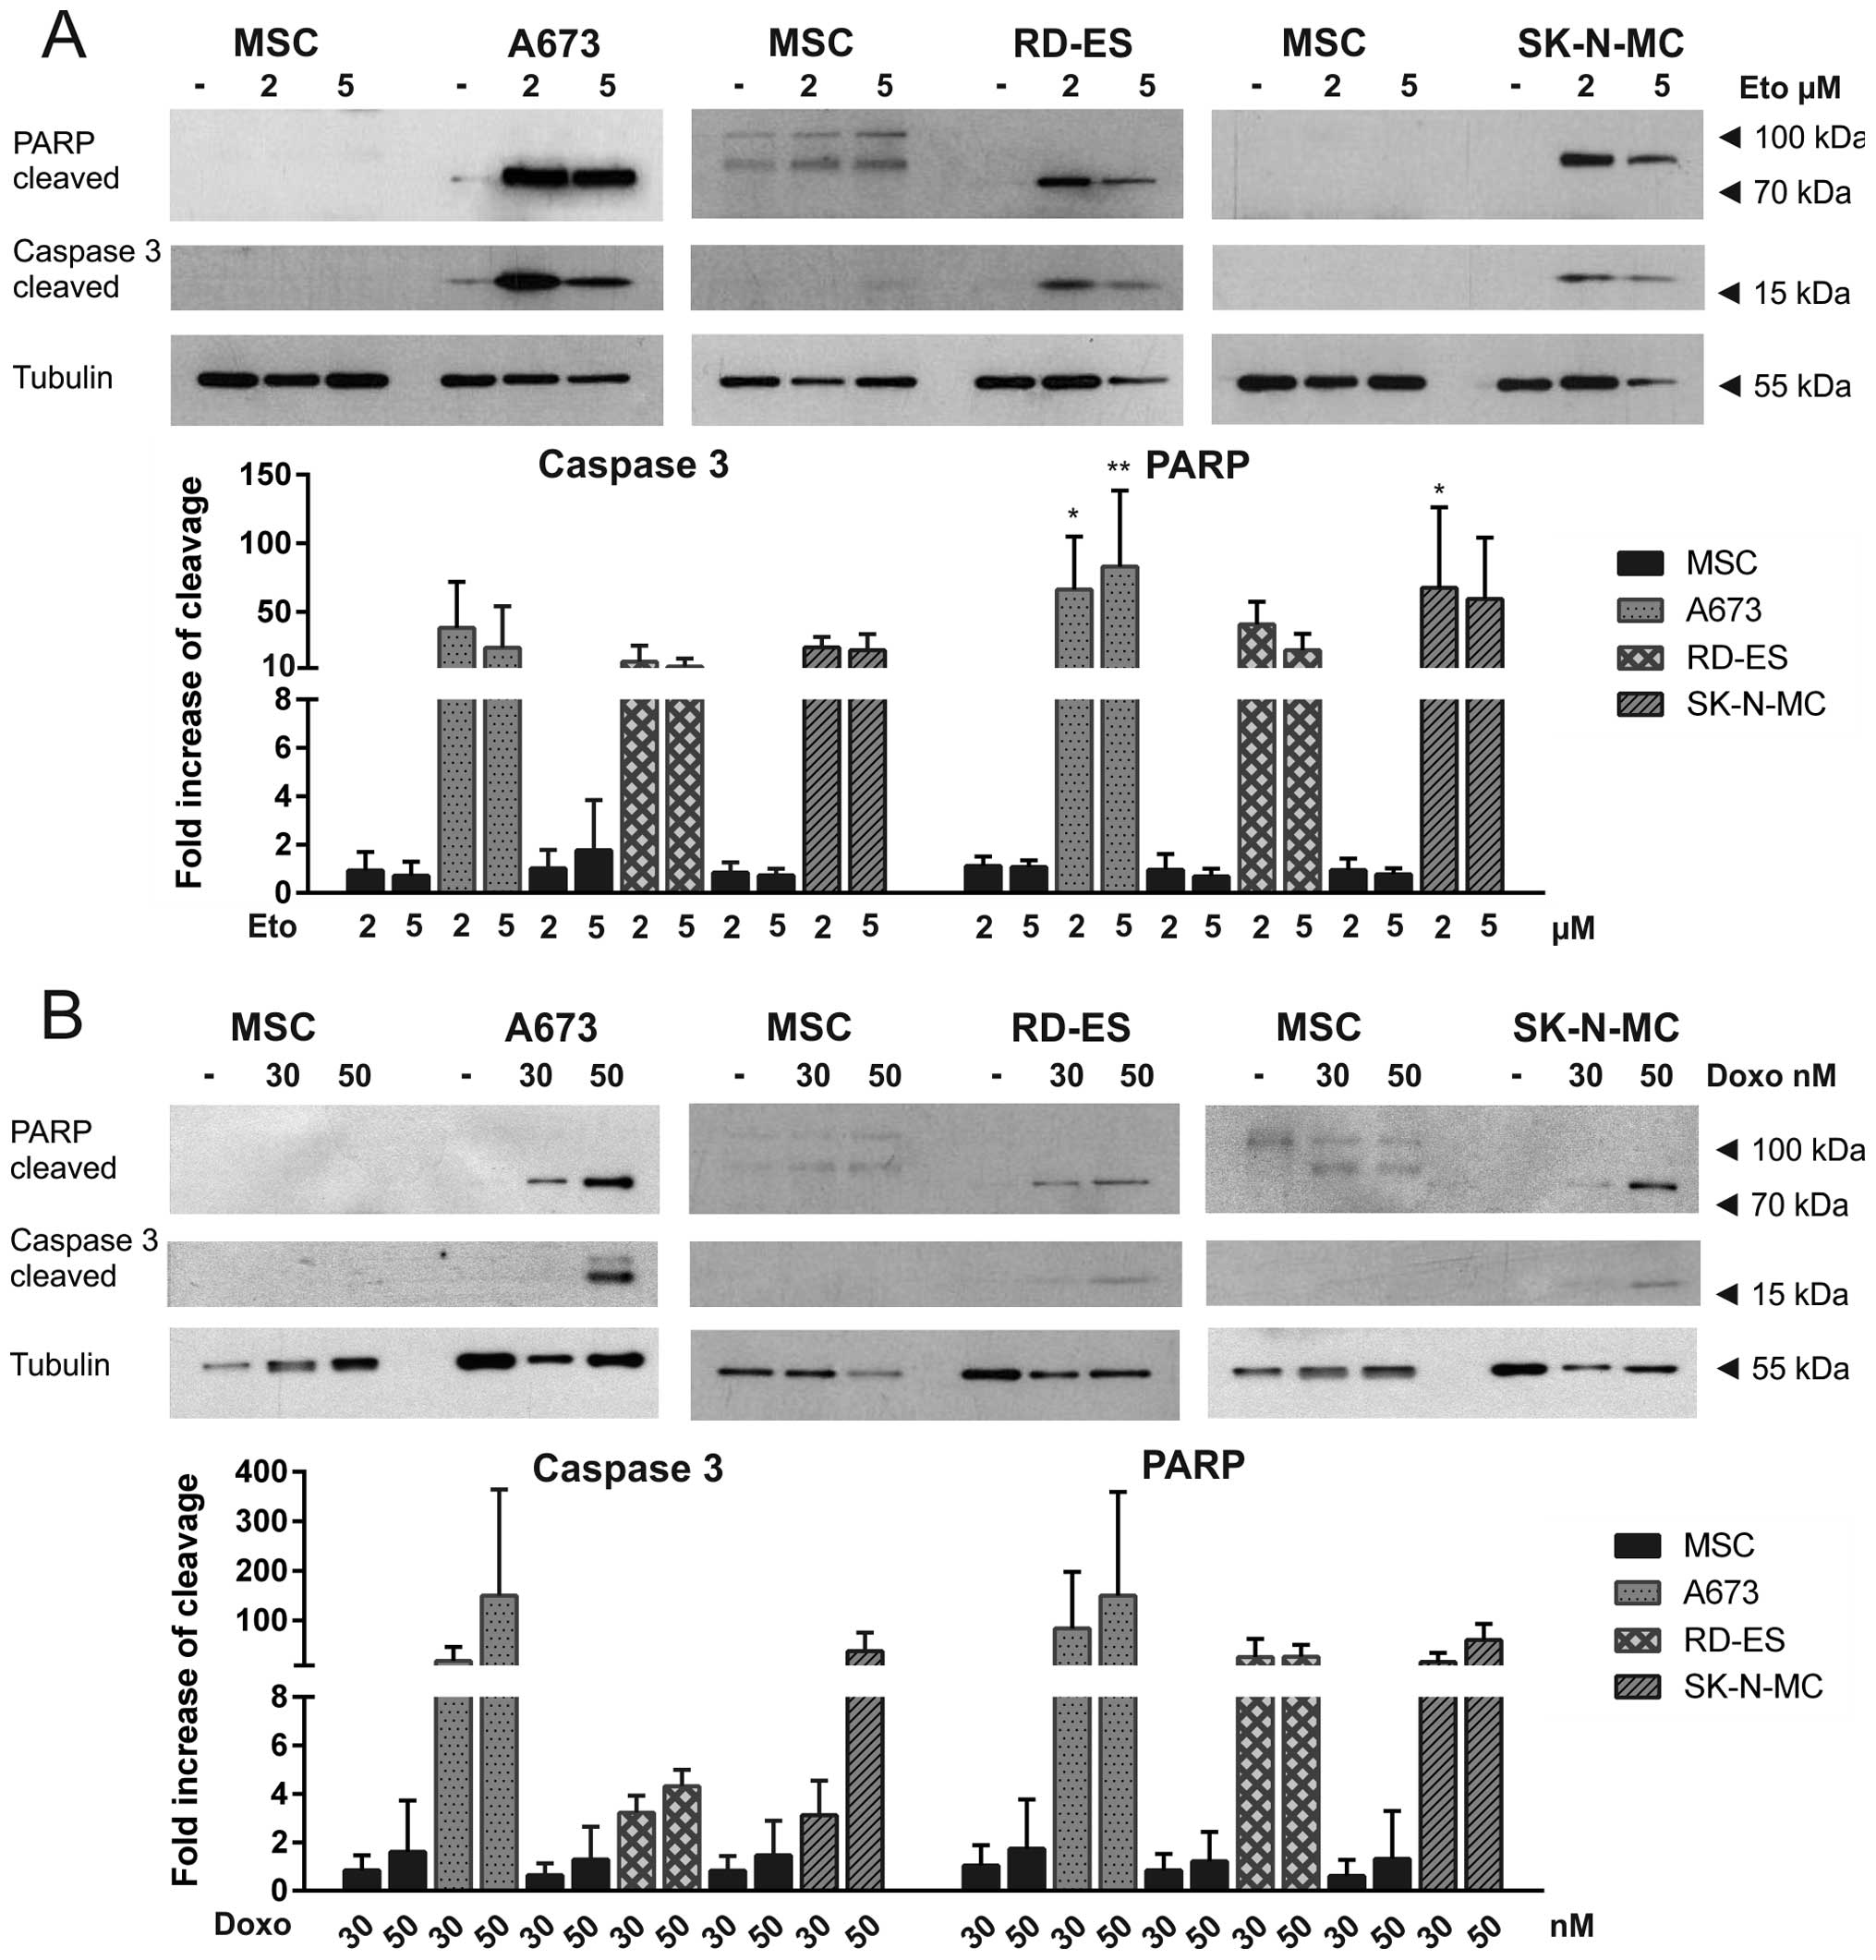
ATO, etoposide and doxorubicin induce
apoptosis in ES cell lines
To distinguish apoptotic from necrotic cell death,
western blot analysis was performed in the three ES cell lines
compared to MSC, detecting apoptotic PARP cleavage, as indicated by
an 89-kDa fragment and caspase-3 cleavage represented by a 17-kDa
fragment (Figs. 7 and 8). ATO induced dose-dependent apoptosis
in A673 cells. Also in SK-N-MC cells, both PARP and caspase-3 were
cleaved after ATO incubation. Interestingly, in RD-ES cells neither
PARP cleavage nor caspase-3 cleavage could be detected, indicating
ATO induced cell death in these cells to be dependent on another
mechanism (Fig. 7). Both
cytostatics etoposide and doxorubicin induced apoptosis in all
three ES cell lines as demonstrated by PARP and caspase-3 cleavage
(Fig. 8 ). After long exposure of
the western blots higher molecular weight PARP bands could be
detected in MSC, whereas obvious caspase-3 cleavage was not
observed in MSC.
Discussion
Despite initial chemo-responsiveness of primary ES,
chemoresistance is observed in most patients with metastases at the
time of diagnosis or upon relapse. Even using an intensive
combination of vincristine, ifosfamide, doxorubicin and etoposide
(VIDE), ES patients with metastatic high-risk disease expect
event-free survival rates of only 20–30% (1). Drug resistance often emerges upon
first line chemotherapy selecting adapted tumour cells in the whole
tumour population (8). Therefore,
innovative therapeutic strategies combining established
chemotherapeutics with new targeted therapies are urgently needed.
In this study we demonstrate that a combination of ATO with
etoposide efficiently and selectively suppressed viability and
colony formation accompanied by cell death induction in the
EWS-FLI1 expressing ES cell lines A673, RD-ES and SK-N-MC
representing three different subtypes (extraosseous, osseous and
Askin's tumour = peripheral PNET, respectively) of the ES family of
tumours.
Aberrant activation of the Hh signalling pathway has
been found in several cancers including ES (12,20,21).
However, in ES the Hh pathway is activated downstream of PTCH1 or
SMO via EWS-FLI1 dependent GLI1 transcription. For this reason, SMO
inhibitors are not beneficial in ES (3,12),
although expression of SMO mRNA could be validated for A673, RD-ES
and SK-N-MC cells. Interestingly, we found the GLI1 protein
expression to be slightly lower in the ES cell lines examined
compared to MSC, which are widely believed to be the cells of ES
origin (22,23). The strong GLI1 mRNA expression
observed in A673 cells could not be confirmed at the protein level
indicating regulatory mechanisms restricting GLI1 protein
translation or stability. The second activating transcription
factor of the Hh pathway, GLI2, is regulated independently of
EWS-FLI1 and is also no direct target of the Hh pathway itself
(24). Although GLI2 mRNA
expression of ES cells was similar or, in case of A673 cells,
slightly elevated compared to MSC, GLI2 full length and repressor
protein expression appeared to be extremely low in relation to MSC,
indicating proliferation and viability of the ES cell lines A673,
RD-ES and SK-N-MC to be rather dependent on GLI1 than GLI2
activity.
ATO is an FDA approved drug for treatment of acute
promyelocytic leukaemia (APL) (25) and has been shown to bind both GLI1
and GLI2, thus inhibiting transactivation of their target genes and
inducing GLI degradation (26,27).
Beauchamp et al determined IC50 values <1 μM
for ATO in A673 cells and RD-ES using WST-1 viability assays
(15). We found similar
sensitivities of A673 and RD-ES cells in the MTS assays.
Particularly, all ES cell lines examined, including SK-N-MC, were
significantly more sensitive to ATO compared to MSC, showing the
high specificity of this drug, which we could also demonstrate for
RMS cells in comparison to primary skeletal muscle cells (SKMC)
(14). ATO plasma levels obtained
in leukaemia patients are 2–5 μM, indicating clinically achievable
concentrations in our experiments (28). A direct effect of ATO on EWS-FLI1
protein abundance in A673 and RD-ES cells has been excluded
previously (16,29). However, in addition to targeting
GLI transcription factors, cytotoxic effects of ATO also include
oxidative stress and DNA damage (30,31).
GANT61, a second GLI inhibitor, also compromised MSC
viability at doses below the half maximal inhibitory concentration
determined for RD-ES and SK-N-MC, whereas cell death, assessed by
eFluor® 450 incorporation, was neither induced in the ES
cell lines nor in MSC using 15 μM GANT61. In contrast to the study
of Matsumoto et al, we found SK-N-MC metabolic activity to
be largely unaffected by GANT61 concentrations <30 μM. Moreover,
cell death of the ES cell line SK-N-LO after treatment with 30 μM
GANT61 appeared to be rather dependent on GLI2 inhibition, while
GLI1 protein expression was hardly detectable in these cells
(17). Therefore, ATO was selected
for all combination experiments with etoposide and doxorubicin
performed in this study.
Multidrug resistance of tumour cells emerges upon
different cellular events promoting the efflux of cytostatic drugs,
increasing detoxification, enhancing repair of DNA damage or
impeding apoptosis (32,33). The multidrug transporter MRP1 and
MDR1 are transcriptionally regulated by GLI1 (34). Especially MRP1 expression is known
to be abundant in ES (9) and we
could confirm its mRNA expression in all three ES cell lines
examined (data not shown). Therefore, ATO might also reduce MRP1
expression augmenting the cytotoxic effects of the MRP1 substrates
etoposide and doxorubicin. Apart from that, arsenic-GSH conjugates
are substrates of MRP1 themselves, so that MRP1 might be
additionally involved in ATO resistance (35). Moreover, in MG63 osteosarcoma cells
ATO has been shown to reverse doxorubicin resistance through
downregulation of stathmin expression (36). Indeed, a preliminary report of Guo
et al mentioned the potential usefulness of ATO in
combination with etoposide in Ewing sarcoma patients (37). For this reason we investigated the
impact of ATO in combination with the cytostatics etoposide and
doxorubicin on ES cell growth and survival.
All ES cell lines examined exhibited etoposide
IC50 values of ~1 μM in the MTS assays. May et al
reported clinically achievable etoposide doses of 10 μg/ml, which
are clearly not obtained by our maximal applied etoposide dose of 5
μM (2.94 μg/ml) in the cell death and apoptosis assays (8). ATO in combination with etoposide
significantly potentiated the viability decline and cell death
induction in RD-ES and SK-N-MC cells compared to single treatments.
In A673 cells, whose metabolism appeared to be extremely ATO
sensitive, 0.1 μM ATO was not sufficient to augment cell death
induction by 1 μM etoposide, whereas the viability was
significantly reduced by the combination of these drug doses
compared to single treatment. Also colony formation of A673 and
RD-ES cells was clearly suppressed by the combination of ATO and
etoposide compared to single application, whereas in SK-N-MC cells
this effect did not become significant due to generally low colony
formation rates.
RD-ES and SK-N-MC cells showed a higher resistance
to doxorubicin compared to A673, determined by MTS viability
assays, which was also reflected by the cell death rates obtained.
This might depend on previous doxorubicin treatment of the patients
as it is recorded for SK-N-MC (8).
Indeed, the clinically achievable concentration of 30 ng/ml (55 nM)
doxorubicin is lower than the IC50 values obtained for
RD-ES and SK-N-MC cells (8). The
combination of the ATO and doxorubicin doses applied was less
effective compared to the ATO-etoposide combinations. Nevertheless,
the combined effect on viability reduction was significant in RD-ES
and SK-N-MC cells, whereas colony formation was significantly
compromised by the drug combination in A673 and RD-ES cells.
Application of the triple treatment consisting of
ATO, etoposide and doxorubicin clearly reduced viability and
induced cell death in all three ES cell lines, while MSC were not
compromised by the highest concentrations used. Though, this
treatment did not significantly outrank the combinations of ATO
with etoposide. On the other hand, lowest colony numbers were found
after the triple treatment of RD-ES and SK-N-MC.
Interestingly, RD-ES cells showed no PARP or
caspase-3 cleavage upon ATO application, indicating cell death
induction upon ATO in these cells to be dependent on another
mechanism. Indeed, in addition to GLI inhibition, ATO has been
implicated in MAPK inhibition, breakdown of mitochondrial membrane
potential and ROS release leading to apoptosis, necrosis or
autophagy, but also differentiation (29,38).
Moreover, p53 mutations present in all ES cell lines examined, or
loss of p16/p14 in A673 cells, may interfere with individual drug
sensitivities (8).
This study shows, that a combination of low dose,
physiologically tolerable ATO and etoposide concentrations
efficiently and selectively suppressed viability and colony
formation in ES cell lines, whereas cell death was enhanced.
Although the exact mechanism of action of this combined effect
still remains elusive, this approach appears to enhance the
effectiveness of etoposide and might also prevent potential drug
resistance. Moreover, adverse effects may be reduced, since
individual doses can be diminished.
Acknowledgements
This study was supported by grants from the ‘IZKF
Promotionskolleg’ of the Medical Faculty Tuebingen (PK-2014-2-15)
and the AXIS Foundation (Hamburg, Germany).
Abbreviations:
|
ATO
|
arsenic trioxide
|
|
EGFR
|
epidermal growth factor receptor
|
|
ES
|
Ewing sarcoma
|
|
EWS
|
Ewing sarcoma breakpoint region 1
|
|
FLI1
|
Fried leukaemia integration 1
|
|
GLI
|
glioma associated oncogene family
|
|
GSH
|
glutathion
|
|
Hh
|
hedgehog
|
|
IGF-1R
|
insulin-like growth factor receptor
1
|
|
MAPK
|
mitogen activated protein kinase
|
|
MDR1
|
multidrug resistance protein 1
|
|
MRP1
|
multidrug resistance associated
protein 1
|
|
MSC
|
mesenchymal stem cells
|
|
mTOR
|
mammalian target of rapamycin
|
|
PARP
|
poly (ADP-ribose) polymerase 1
|
|
PDGFR
|
platelet-derived growth factor
receptor
|
|
PTCH1
|
patched 1
|
|
RMS
|
rhabdomyosarcoma
|
|
SKMC
|
primary skeletal muscle cells
|
|
SMO
|
smoothened
|
|
VEGFR
|
vascular growth factor receptor
|
References
|
1
|
Jiang Y, Ludwig J and Janku F: Targeted
therapies for advanced Ewing sarcoma family of tumors. Cancer Treat
Rev. 41:391–400. 2015. View Article : Google Scholar : PubMed/NCBI
|
|
2
|
de Alava E and Gerald WL: Molecular
biology of the Ewing's sarcoma/primitive neuroectodermal tumor
family. J Clin Oncol. 18:204–213. 2000.PubMed/NCBI
|
|
3
|
Cidre-Aranaz F and Alonso J: EWS/FLI1
target genes and therapeutic opportunities in Ewing sarcoma. Front
Oncol. 5:1622015. View Article : Google Scholar : PubMed/NCBI
|
|
4
|
Toomey EC, Schiffman JD and Lessnick SL:
Recent advances in the molecular pathogenesis of Ewing's sarcoma.
Oncogene. 29:4504–4516. 2010. View Article : Google Scholar : PubMed/NCBI
|
|
5
|
Smith R, Owen LA, Trem DJ, Wong JS,
Whangbo JS, Golub TR and Lessnick SL: Expression profiling of
EWS/FLI identifies NKX2.2 as a critical target gene in Ewing's
sarcoma. Cancer Cell. 9:405–416. 2006. View Article : Google Scholar : PubMed/NCBI
|
|
6
|
Liebner DA: The indications and efficacy
of conventional chemotherapy in primary and recurrent sarcoma. J
Surg Oncol. 111:622–631. 2015. View Article : Google Scholar : PubMed/NCBI
|
|
7
|
Paulussen M, Craft AW, Lewis I, Hackshaw
A, Douglas C, Dunst J, Schuck A, Winkelmann W, Köhler G, Poremba C,
et al; European Intergroup Cooperative Ewing's Sarcoma Study-92.
Results of the EICESS-92 Study: Two randomized trials of Ewing's
sarcoma treatment - cyclophosphamide compared with ifosfamide in
standard-risk patients and assessment of benefit of etoposide added
to standard treatment in high-risk patients. J Clin Oncol.
26:4385–4393. 2008. View Article : Google Scholar : PubMed/NCBI
|
|
8
|
May WA, Grigoryan RS, Keshelava N, Cabral
DJ, Christensen LL, Jenabi J, Ji L, Triche TJ, Lawlor ER and
Reynolds CP: Characterization and drug resistance patterns of
Ewing's sarcoma family tumor cell lines. PLoS One. 8:e800602013.
View Article : Google Scholar : PubMed/NCBI
|
|
9
|
Oda Y, Dockhorn-Dworniczak B, Jürgens H
and Roessner A: Expression of multidrug resistance-associated
protein gene in Ewing's sarcoma and malignant peripheral
neuroectodermal tumor of bone. J Cancer Res Clin Oncol.
123:237–239. 1997. View Article : Google Scholar : PubMed/NCBI
|
|
10
|
Gottesman MM: Mechanisms of cancer drug
resistance. Annu Rev Med. 53:615–627. 2002. View Article : Google Scholar : PubMed/NCBI
|
|
11
|
Beauchamp E, Bulut G, Abaan O, Chen K,
Merchant A, Matsui W, Endo Y, Rubin JS, Toretsky J and Uren A: GLI1
is a direct transcriptional target of EWS-FLI1 oncoprotein. J Biol
Chem. 284:9074–9082. 2009. View Article : Google Scholar : PubMed/NCBI
|
|
12
|
Joo J, Christensen L, Warner K, States L,
Kang HG, Vo K, Lawlor ER and May WA: GLI1 is a central mediator of
EWS/FLI1 signaling in Ewing tumors. PLoS One. 4:e76082009.
View Article : Google Scholar : PubMed/NCBI
|
|
13
|
Zwerner JP, Joo J, Warner KL, Christensen
L, Hu-Lieskovan S, Triche TJ and May WA: The EWS/FLI1 oncogenic
transcription factor deregulates GLI1. Oncogene. 27:3282–3291.
2008. View Article : Google Scholar
|
|
14
|
Boehme KA, Zaborski JJ, Riester R,
Schweiss SK, Hopp U, Traub F, Kluba T, Handgretinger R and
Schleicher SB: Targeting hedgehog signalling by arsenic trioxide
reduces cell growth and induces apoptosis in rhabdomyosarcoma. Int
J Oncol. 48:801–812. 2016.
|
|
15
|
Beauchamp EM, Ringer L, Bulut G, Sajwan
KP, Hall MD, Lee YC, Peaceman D, Ozdemirli M, Rodriguez O,
Macdonald TJ, et al: Arsenic trioxide inhibits human cancer cell
growth and tumor development in mice by blocking Hedgehog/GLI
pathway. J Clin Invest. 121:148–160. 2011. View Article : Google Scholar :
|
|
16
|
Zhang S, Guo W, Ren TT, Lu XC, Tang GQ and
Zhao FL: Arsenic trioxide inhibits Ewing's sarcoma cell
invasiveness by targeting p38(MAPK) and c-Jun N-terminal kinase.
Anticancer Drugs. 23:108–118. 2012. View Article : Google Scholar
|
|
17
|
Matsumoto T, Tabata K and Suzuki T: The
GANT61, a GLI inhibitor, induces caspase-independent apoptosis of
SK-N-LO cells. Biol Pharm Bull. 37:633–641. 2014. View Article : Google Scholar : PubMed/NCBI
|
|
18
|
Battula VL, Treml S, Bareiss PM, Gieseke
F, Roelofs H, de Zwart P, Müller I, Schewe B, Skutella T, Fibbe WE,
et al: Isolation of functionally distinct mesenchymal stem cell
subsets using antibodies against CD56, CD271, and mesenchymal stem
cell antigen-1. Haematologica. 94:173–184. 2009. View Article : Google Scholar :
|
|
19
|
Laurendeau I, Ferrer M, Garrido D, D'Haene
N, Ciavarelli P, Basso A, Vidaud M, Bieche I, Salmon I and Szijan
I: Gene expression profiling of the hedgehog signaling pathway in
human meningiomas. Mol Med. 16:262–270. 2010. View Article : Google Scholar : PubMed/NCBI
|
|
20
|
Kelleher FC, Cain JE, Healy JM, Watkins DN
and Thomas DM: Prevailing importance of the hedgehog signaling
pathway and the potential for treatment advancement in sarcoma.
Pharmacol Ther. 136:153–168. 2012. View Article : Google Scholar : PubMed/NCBI
|
|
21
|
Amakye D, Jagani Z and Dorsch M:
Unraveling the therapeutic potential of the Hedgehog pathway in
cancer. Nat Med. 19:1410–1422. 2013. View Article : Google Scholar : PubMed/NCBI
|
|
22
|
Lin PP, Wang Y and Lozano G: Mesenchymal
stem cells and the origin of Ewing's sarcoma. Sarcoma.
2011:2764632011. View Article : Google Scholar
|
|
23
|
Sand LG, Szuhai K and Hogendoorn PC:
Sequencing overview of Ewing sarcoma: A journey across genomic,
epigenomic and transcriptomic landscapes. Int J Mol Sci.
16:16176–16215. 2015. View Article : Google Scholar : PubMed/NCBI
|
|
24
|
Aberger F and Ruiz I Altaba A:
Context-dependent signal integration by the GLI code: The oncogenic
load, pathways, modifiers and implications for cancer therapy.
Semin Cell Dev Biol. 33:93–104. 2014. View Article : Google Scholar : PubMed/NCBI
|
|
25
|
Watts JM and Tallman MS: Acute
promyelocytic leukemia: What is the new standard of care? Blood
Rev. 28:205–212. 2014. View Article : Google Scholar : PubMed/NCBI
|
|
26
|
Raju GP: Arsenic: A potentially useful
poison for Hedgehog-driven cancers. J Clin Invest. 121:14–16. 2011.
View Article : Google Scholar :
|
|
27
|
Kim J, Aftab BT, Tang JY, Kim D, Lee AH,
Rezaee M, Kim J, Chen B, King EM, Borodovsky A, et al: Itraconazole
and arsenic trioxide inhibit Hedgehog pathway activation and tumor
growth associated with acquired resistance to smoothened
antagonists. Cancer Cell. 23:23–34. 2013. View Article : Google Scholar : PubMed/NCBI
|
|
28
|
Au WY, Tam S, Fong BM and Kwong YL:
Determinants of cerebrospinal fluid arsenic concentration in
patients with acute promyelocytic leukemia on oral arsenic trioxide
therapy. Blood. 112:3587–3590. 2008. View Article : Google Scholar : PubMed/NCBI
|
|
29
|
Mathieu J and Besançon F: Clinically
tolerable concentrations of arsenic trioxide induce p53-independent
cell death and repress NF-kappa B activation in Ewing sarcoma
cells. Int J Cancer. 119:1723–1727. 2006. View Article : Google Scholar : PubMed/NCBI
|
|
30
|
Emadi A and Gore SD: Arsenic trioxide - An
old drug rediscovered. Blood Rev. 24:191–199. 2010. View Article : Google Scholar : PubMed/NCBI
|
|
31
|
Sordet O, Liao Z, Liu H, Antony S, Stevens
EV, Kohlhagen G, Fu H and Pommier Y: Topoisomerase I-DNA complexes
contribute to arsenic trioxide-induced apoptosis. J Biol Chem.
279:33968–33975. 2004. View Article : Google Scholar : PubMed/NCBI
|
|
32
|
Tan B, Piwnica-Worms D and Ratner L:
Multidrug resistance transporters and modulation. Curr Opin Oncol.
12:450–458. 2000. View Article : Google Scholar : PubMed/NCBI
|
|
33
|
Melguizo C, Prados J, Rama AR, Ortiz R,
Álvarez PJ, Fernández JE and Aranega A: Multidrug resistance and
rhabdomyosarcoma (Review). Oncol Rep. 26:755–761. 2011.PubMed/NCBI
|
|
34
|
Santisteban M: ABC transporters as
molecular effectors of pancreatic oncogenic pathways: The
Hedgehog-GLI model. J Gastrointest Cancer. 41:153–158. 2010.
View Article : Google Scholar : PubMed/NCBI
|
|
35
|
Leslie EM, Haimeur A and Waalkes MP:
Arsenic transport by the human multidrug resistance protein 1
(MRP1/ABCC1). Evidence that a tri-glutathione conjugate is
required. J Biol Chem. 279:32700–32708. 2004. View Article : Google Scholar : PubMed/NCBI
|
|
36
|
Feng T, Qiao G, Feng L, Qi W, Huang Y, Yao
Y and Shen Z: Stathmin is key in reversion of doxorubicin
resistance by arsenic trioxide in osteosarcoma cells. Mol Med Rep.
10:2985–2992. 2014.PubMed/NCBI
|
|
37
|
Guo W, Tang XD, Tang S and Yang Y:
Preliminary report of combination chemotherapy including Arsenic
trioxide for stage III osteosarcoma and Ewing sarcoma. Zhonghua Wai
Ke Za Zhi. 44:805–808. 2006.(In Chinese). PubMed/NCBI
|
|
38
|
Zhao YY, Yu L, Liu BL, He XJ and Zhang BY:
Downregulation of P-gp, Ras and p-ERK1/2 contributes to the arsenic
trioxide-induced reduction in drug resistance towards doxorubicin
in gastric cancer cell lines. Mol Med Rep. 12:7335–7343.
2015.PubMed/NCBI
|