Introduction
Antiangiogenic therapy is currently the dominating
experimental therapeutic strategy for glioma (1). Traditional antiangiogenic therapy is
aimed at endothelial angiogenesis via the sprouting of new vessels
from the existing ones, thus, limited the volume of tumor in
certain stages (2). However, it
failed to eliminate tumor probably because of the existence of
other supplemental blood supply systems, e.g., vasculogenic mimicry
(VM) (3). VM is a formation of
de novo vasculogenic-like matrix-embedded networks, i.e.
vascular-like structures, containing plasma and red blood cells and
ultimately contributing to blood circulation (4). VM helped to keep tumor cells
nourished in hypoxic and ischemic environment (5), thus, weakened the effect of
antiangiogenic therapy or even elicited greater malignancy
(6,7). Consequently, researchers suggested
that both antiangiogenic and anti-VM treatments should be applied
during antitumor therapy (8,9).
To date, the capability of VM formation has been
considered to be a marker of patients’ prognosis according to some
research (10–12). Therefore, it is important to
clarify the mechanism of VM formation and block its signaling
pathways accordingly. Chen and Chen (9) suggested that anti-VM therapy should
focus on inhibiting tumor cell plasticity as well as blocking the
biochemical and molecular pathways remodeling the ECM and tumor
microenvironment in VM. Tumor cell plasticity means their capacity
to adapt to the selective pressures they encounter during tumor
development (13). In some cases,
highly malignant tumor cells could turn back into an embryonic
‘stem’ state and acquire multi-potential capacity. With the
embryonic ‘stem’ state, tumor cells were able to either mimic the
biological behavior of endothelial cells (VM) or differentiate into
endothelial cells for supporting the circulation (14). However, the mechanism and process
of ‘stem’ transition has not been understood clearly.
In recent years, epithelial-mesenchymal transition
(EMT) has been reported to contribute to VM formation (15,16).
EMT is a process that epithelial-type cells undergo a developmental
switch associated with the downregulation of epithelial cell
surface markers and cytoskeleton components (e.g., E-cadherin and
cytokeratins) and the upregulation of mesenchymal markers and
extracellular matrix components (e.g., N-cadherin and fibronectin)
(17). Once the EMT process was
inhibited, the invasive behavior of tumor cells would be suppressed
(18). It is increasingly
acknowledged that EMT is a very important process of conferring
stem cell properties to normal cancer cells (19). Loss of epithelial characteristics
and acquisition of a mesenchymal phenotype not only enhanced the
migratory and invasive potential of tumor cells, but also enabled
their self-renewal and tumor-initiating capabilities (20). In the EMT process, transforming
growth factor-β (TGF-β) played a key role. It was suggested that
TGF-β-induced EMT and cell transformation is one of the earliest
events in tumor progression (21).
TGF-β inhibition could impair the capability of angiogenesis by
suppressing the secretion of vascular endothelial growth factor
(VEGF) (22,23). In addition, our previous study
showed that TGF-β inhibition led to an impaired in vitro VM
formation in glioma cell line U251MG by suppressing the expression
of MT1-MMP (24). MT1-MMP promoted
the pro-MMP transition into its active form. Then, MMP2 activation
leads to LAMC2 chain cleavage into pro-migratory C2′ and C2×
fragments. These fragments are deposited in the ECM and participate
in matrix plasticity, cell migration, invasion and VM formation
(25). Based on the above, we
wondered whether the TGF-β-induced EMT participated in the process
of glioma VM formation. If so, we would investigate its inner
mechanism. For this purpose, we established in vitro and
in vivo models of a less invasive glioma cell line SHG44
pre-transfected with lentivirus loaded with scramble gene or TGF-β
cDNA. SB203580, a specific inhibitor of p38/MAP kinase signaling
pathway was also used to block the process of EMT without impact on
TGF-β in the present study.
Materials and methods
Construction of lentivirus vector loaded
with TGF-β cDNA
The GV358 vector (data not shown) was provided by
Shanghai Genechem, Co., Ltd., (Shanghai, China) and re-confirmed by
sequencing. TGF-β mRNA was extracted and cDNA was synthesized using
quantitative PCR with primers containing enzymatic digestion sites
for AgeI/AgeI, according to the manufacturer’s
instructions. The primers corresponded to NCBI Reference Sequence
(NM_000660) forward, 5′-GAG GAT CCC CGG GTA CCG GTC GCC ACC ATG CCG
CCC TCC GGG CT-3′ and reverse, 5′-TCC TTG TAG TCC ATA CCG CTG CAC
TTG CAG GAG CGC ACG-3′. The TGF-β cDNA (data not shown) was packed
into the GV358 vector to form the pLV-TGFβ vector. Following the
sequencing, the recombinant segment of the correct clone was
incised by AgeI/AgeI. The pLV-TGFβ clones were
sequenced and the correct clones were amplified and identified by
restriction enzyme digestion. The 293T cells were transfected with
the pLV-TGFβ for virus packing. The supernatants of transfected
293T cells were collected and tested for virus titer by ELISA.
Empty GV358 vector served as a negative control.
Cell culture and grouping
The human SHG44 glioma cell line (Laboratory Animal
Center of Sun Yat-sen University, Guangzhou, China) was maintained
in high glucose Dulbecco’s modified Eagle’s medium (DMEM;
Invitrogen, 11995065) supplemented with 10% fetal bovine serum
(FBS; HyClone Laboratories, SV30087.02) in 5% CO2 at
37°C. Cultures were passaged every 2 to 3 days until 80% confluent.
The specific inhibitor of p38/MAPK signaling pathway, SB203580 was
purchased from Selleck Chemicals, Co., Ltd. (Houston, TX, USA).
Three groups of cells were established, i.e. NC group (transfected
with empty GV358), pLV-TGFβ+SB203580 group (transfected with GV358
loaded with TGF-β cDNA, added with 10 μM/day SB203580), and
pLV-TGFβ group (transfected with GV358 loaded with TGF-β cDNA,
without SB203580).
Establishment of a stable transfected
cell line
SHG44 cells were seeded into a 24-well plate at a
density of 105 cells/well. Twelve hours later, the cells
were transiently transfected with pLV-TGFβ with a titer of
106 each well. Two days after transfection, green
fluorescence could be observed using a fluorescence inverted
microscope (DMI4000; Leica Microsystems, Inc., Wetzlar, Germany).
Later, puromycin (Genomeditech, Co., Ltd., Shanghai, China;
GM-040401-1) at a concentration of 5 μg/ml was used to screen cells
that were successfully transfected. After screening for 5 days,
enriched transfected cell populations were picked out and
maintained with puromycin at a concentration of 2 μg/ml for further
experiments. Clones were expanded for another 2 weeks.
In vitro tube formation, invasion and
migration assays
Tube formation assay was carried out as previously
described (24). Briefly, wells of
24-well plate were coated with Matrigel basement membrane matrix
(BD Biosciences, San Jose, CA, USA) at 0.2 ml/well. It was allowed
to polymerase at 37°C for 1 h. Cells were resuspended and seeded
into a well at a density of 5×10⁵ cells/ml, then
incubated without serum in 5% CO2 at 37°C for 24 h.
Cultures were photographed using fluorescence inverted microscope
(DMI4000; Leica Microsystems) 24 h later. The total length of tubes
per field was quantified by counting in 5 randomly chosen 100X
scopes using Leica application suite v3.60 (Leica Microsystems).
The cell invasion assay was evaluated using Transwell filters with
6.5 mm diameters and 8 μm pore sizes (Corning, 3422). The filters
were coated with 50 μl Matrigel diluted with serum-free medium
(1:3) for 30 min at 37°C according to the manufacturer’s
instructions. The cells (1×10⁵) were seeded with 100 μl
serum-free medium into the upper chamber while 500 μl complete
medium (containing 10% FBS) was placed in the lower chamber. The
plates were placed at 37°C in 5% CO2 for 24 h. The upper
chambers were fixed with 4% PFA and stained with 0.1% crystal
violet for 30 min. The cells on the upper surface of the chamber
were removed, and the stained cells on the lower surface of the
chamber were counted. Images of at least ten random fields per
chamber were captured (magnification, ×20). The cells for wound
healing assay were allowed to grow to 80% and scratched using a 1
ml pipette tip in the central area. For removing floating cells and
slowing down the growth, the medium was changed to serum-free. The
cells were incubated for 48 h to close the wound. Images were taken
at the same position of the wound at 24 and 48 h.
Cell proliferation assay
The cell proliferation assay was evaluated using a
Cell Counting kit-8 (CCK-8) (Shanghai Haoran Biotechnology, Co.,
Ltd., Shanghai, China). In short, cells were planted into wells of
a 96-well plate with 10% FBS in the culture medium at a density of
1×10³ cells/well, and then daily added with 10 μl CCK-8
for 7 days. Cultures were incubated in 5% CO2 at 37°C
for 4 h following daily CCK-8 administration. Supernatants were
obtained by centrifuging at 1,000 × g for 20 min. The absorbance of
the supernatant from each well was detected at 450 nm using a
microplate reader (model 550; Bio-Rad Laboratories, Inc., Hercules,
CA, USA).
Establishment of tumor xenograft model
and grouping
Four to six weeks old BALB/c-nu nude mice were
bought from Vital River Experimental Animal Technology, Co., Ltd.
(Beijing, China). All experiments were performed in accordance with
the official recommendations of the Chinese Community Guidelines.
SHG44 transfected with empty vector or TGF-β cDNA vector (pLV-TGFβ)
were prepared. Cells were resuspended at a density of
5×10⁷/ml and subcutaneously injected into the right
flank of each nude mouse. Three groups of mice (n=6) were
established, i.e. NC group (cells transfected with empty GV358),
pLV-TGFβ+SB203580 group (cells transfected with pLV-TGFβ, with 250
μM SB203580 dissolving in drinking water), and pLV-TGFβ group
(cells transfected with pLV-TGFβ, without SB203580 feeding). Twelve
days after injection, the subcutaneous tumors were palpable. One
month later, animals were euthanized and the xenografts were
obtained for further experiments.
Enzyme-linked immunosorbent assay
(ELISA)
The concentration of TGF-β in the supernatant of
cell medium was detected using a TGF-β ELISA kit (Invitrogen,
LHG0121). The supernatant was collected and assayed following the
manufacturer’s instructions. Absorbance detection was performed at
450 nm using a microplate reader (Bio-Rad Laboratories).
Semi-quantitative reverse
transcriptase-polymerase chain reaction (RT-PCR)
Total RNA was extracted from cells or xenografts
using TRIZol (Invitrogen, 15596026). Then, we synthesized cDNA
using a reverse transcription kit (Invitrogen, 28025021) following
the manufacturer’s instructions. Primer sequences used for PCR were
synthesized by Invitrogen as shown in Table I. Platinum PCR SuperMix High
Fidelity (Invitrogen, 12532016) was used for PCR amplifications.
The conditions were as follows: 5 min at 94°C for denaturation,
followed by 30 sec at 94°C, 30 sec at 55°C and 1 min at 72°C for 35
cycles and 5 min at 72°C for final elongation. The PCR products
were electrophoretically analysed in 1.5% agarose (Invitrogen,
16500500) and visualized by ethidium bromide (Sigma-Aldrich, 46065)
staining. Then the agarose gel was photographed using a PM-CBAD
image system (Olympus, Tokyo, Japan). Bands were analyzed using
ImageJ v1.48 software (National Institutes of Health, Bethesda, ME,
USA). β-actin served as internal control.
 | Table IPrimers sequences for RT-PCR. |
Table I
Primers sequences for RT-PCR.
| Gene | Primer
sequence | Product (bp) |
|---|
| Smad2 | Sense:
5′-TTCCAGACTTTGTGCTGTCCAGTAA-3′
Antisense: 5′-AGGGCAGAGGCTCCACTGAGTA-3′ | 120 |
| p38 | Sense:
5′-TCGAGACCGTTTCAGTCCAT-3′
Antisense: 5′-CCACGGACCAAATATCCACT-3′ | 463 |
| TGF-β | Sense:
5′-GACTACTACGCCAAGGAG-3′
Antisense: 5′-TGAGGTATCGCCAGGAAT-3′ | 244 |
| E-cadherin | Sense:
5′-AGGCCTCTACGGTTTCATAA-3′
Antisense: 5′-AATGTTGGAGGAATTACGTCA-3′ | 540 |
| N-cadherin | Sense:
5′-TGCGGTACAGTGTAACTGGGCCAGG-3′
Antisense: 5′-TGCGGTACAGTGTAACTGGGCCAGG-3′ | 438 |
| MT1-MMP | Sense:
5′-AGCAACTTTATGGGGGTGAGT-3′
Antisense: 5′-CCAGACTTTGATGTTCTTGGGG-3′ | 530 |
| LAMC2 | Sense:
5′-AGCAGAAAGCCACGTTGAGT-3′
Antisense: 5′-CAGGGACTTGGTTTTCTCCA-3′ | 187 |
| β-actin | Sense:
5′-CTCCATCCTGGCCTCGCTGT-3′
Antisense: 5′-GCTGTCACCTTCACCGTTCC-3′ | 268 |
Immunohistochemistry
Standard immunohistochemical staining was performed
on paraffin-embedded tumor sections, at 5 μm. Slides were
deparaffinized using xylene and absolute ethanol, rinsed in
distilled water, exposed to 3% H2O2 for 10
min, and then immersed in sodium citrate antigen-unmasking
solution. The antigen-unmasking solution together with the slides
were heated in an oven at 90°C for 15 min, and then cooled to room
temperature. The sections were rinsed with PBS and blocked
subsequently with 10% goat serum. Sections were stained with
primary antibodies for 1 h at 36.5°C, and then incubated for 40 min
at 36.5°C with biotinylated immunoglobulins in PBS. The following
primary antibodies were used to detect the positive cells:
E-cadherin (Abcam, ab40772), N-cadherin (Abcam, ab18203) and CD34
(Abcam, ab81289). Sections were exposed to diaminobenzidine
tetrahydrochloride chromogen for 5 min, and rinsed in distilled
water (all the reagents were purchased from Wuhan Boster Biological
Technology, Ltd., Wuhan, China). Finally, slides were
counterstained with Mayer’s hematoxylin (Wuhan Boster Biological
Technology) for 1 min and coverslipped with a permanent mounting
medium. Immuno-positive area in each slide was calculated using
Image-Pro Plus (Media Cybernetics, Inc., Rockville, MD USA). The
assessment of immunohistochemistry results was completed by two
independent investigators blinded to the animal data.
CD34 and periodic acid-Schiff (PAS) dual
staining and in vivo tube formation assay
CD34-PAS dual staining was carried out following Yue
and Chen (26). Briefly, standard
immunohistochemical staining was performed on paraffin-embedded
tumor sections, at 5 μm. The details of CD34 immunohistochemistry
were described previously. Sections were exposed to periodic acid
(Wuhan Boster Biological Technology) for 15 min, then with Schiff
reagent (Wuhan Boster Biological Technology) for 60 min. Finally,
they were counterstained with Mayer’s hematoxylin for 10 min and
coverslipped. These slides were observed under a light microscope.
The presence of VM [CD34-negative and PAS-positive tubes, evaluated
according to the criteria of Folberg et al (27)] and endothelial vessels
(CD34-positive and PAS-positive tubes) were assessed. The number of
VM was quantified in 5 randomly chosen 200× scopes using LEICA
application suite v3.60 (Leica Microsystems).
Western blot analysis
Cells or kibbling tissue of xenografts were lysed
with cold RIPA buffer (50 mM of Tris-HCl, pH 8.0, 150 mM of NaCl,
0.5% sodium deoxycholate, 1.0% NP-40, 0.1% SDS, 100 μl/ml of
proteinase inhibitor aprotinin) for 30 min (all the reagents above
were from Wuhan Boster Biological Technology). Then, the lysates
were centrifuged at 12,000 × g for 15 min at 4°C. Protein
concentration was confirmed using the Bradford assay. Average
amounts of protein were mixed with loading buffer (0.125 M
Tris-HCl, pH 6.8, 10% glycerol, 2% β-mercaptoethanol, 2% SDS and
0.1% bromophenol blue) and boiled for 10 min (all the reagents were
from Wuhan Boster Biological Technology). After electrophoresis,
proteins were transferred to PVDF membrane using a standard
protocol. The membrane was blocked in 2% BSA for 2 h, rinsed and
then incubated with primary antibody for 1 h at 37°C. The following
primary antibodies were used to detect bands on the protein blots:
MT1-MMP (Abcam, ab53712), LAMC2 (Abcam, ab96327), P38 (Abcam,
ab7952), phospho-P38 (Abcam, ab4822), Smad2 (Abcam, ab63576),
phospho-Smad2 (Abcam, ab53100), E-cadherin (Abcam, ab40772),
N-cadherin (Abcam, ab18203), β-actin (Abcam, ab129348). Thereafter,
membranes were washed with TBST (TBS containing 0.01% Tween-20) and
incubated for 1 h at 37°C with HRP-conjugated secondary antibodies.
Bands were visualized by an enhanced chemiluminescence (ECL) kit
(Invitrogen, WP20005), exposed to radiography film and analyzed
using ImageJ v1.43 software. β-actin served as internal
control.
Gelatin zymography analysis
Gelatin zymography was employed to detect MMP-2 and
MMP-9 activities. The supernatants of serum-free cultures were
collected and centrifuged at 2,000 × g for 10 min and then
subjected to SDS-PAGE with 0.1% gelatin and 30% polyacrylamide gel.
Electrophoresis was run at constant 80 V in spacer gel and at
constant 120 V in separation gel at 4°C. Then the gel was washed
with eluent (2.5% Triton X-100, 50 mmol/l Tris-HCl, 5 mmol/l
CaCl2, 1 mmol/l ZnCl2, pH 7.6) for 1 h, later
with rinse water (50 mmol/l Tris-HCl, 5 mmol/l CaCl2, 1
mmol/l ZnCl2, pH 7.6) for 30 min. Thereafter, the gel
was incubated at 37°C for 24 h in conditioned fluid (50 mmol/l
Tris-HCl, 5 mmol/l CaCl2, 1 mmol/l ZnCl2,
0.02% Brij 35 pH 7.6). Then stained with Coomassie R250 and
destained with methanol and acetic acid. Gelatinolytic activities
were performed as clear zones against dark blue background. The
images were photographed with a PM-CBAD image system. Bands were
analyzed using ImageJ v1.43 software.
Statistical analysis
The data were representative of at least 3
independent experiments. It was recorded as mean ± SD (standard
deviation) and evaluated by SPSS13.0 (SPSS, Inc., Chicago, IL,
USA). Differences between groups were analyzed by one-way analysis
of variance (ANOVA) or Student’s unpaired t-test. Tests of
homogeneity of variances were run before post hoc multiple
comparisons. With equal variances the LSD-test was used, or else
the Games-Howell test would be used. P<0.05 was considered to
indicate a statistically significant result.
Results
pLV-TGFβ transfected cells were under an
EMT process that could be reversed by SB203580
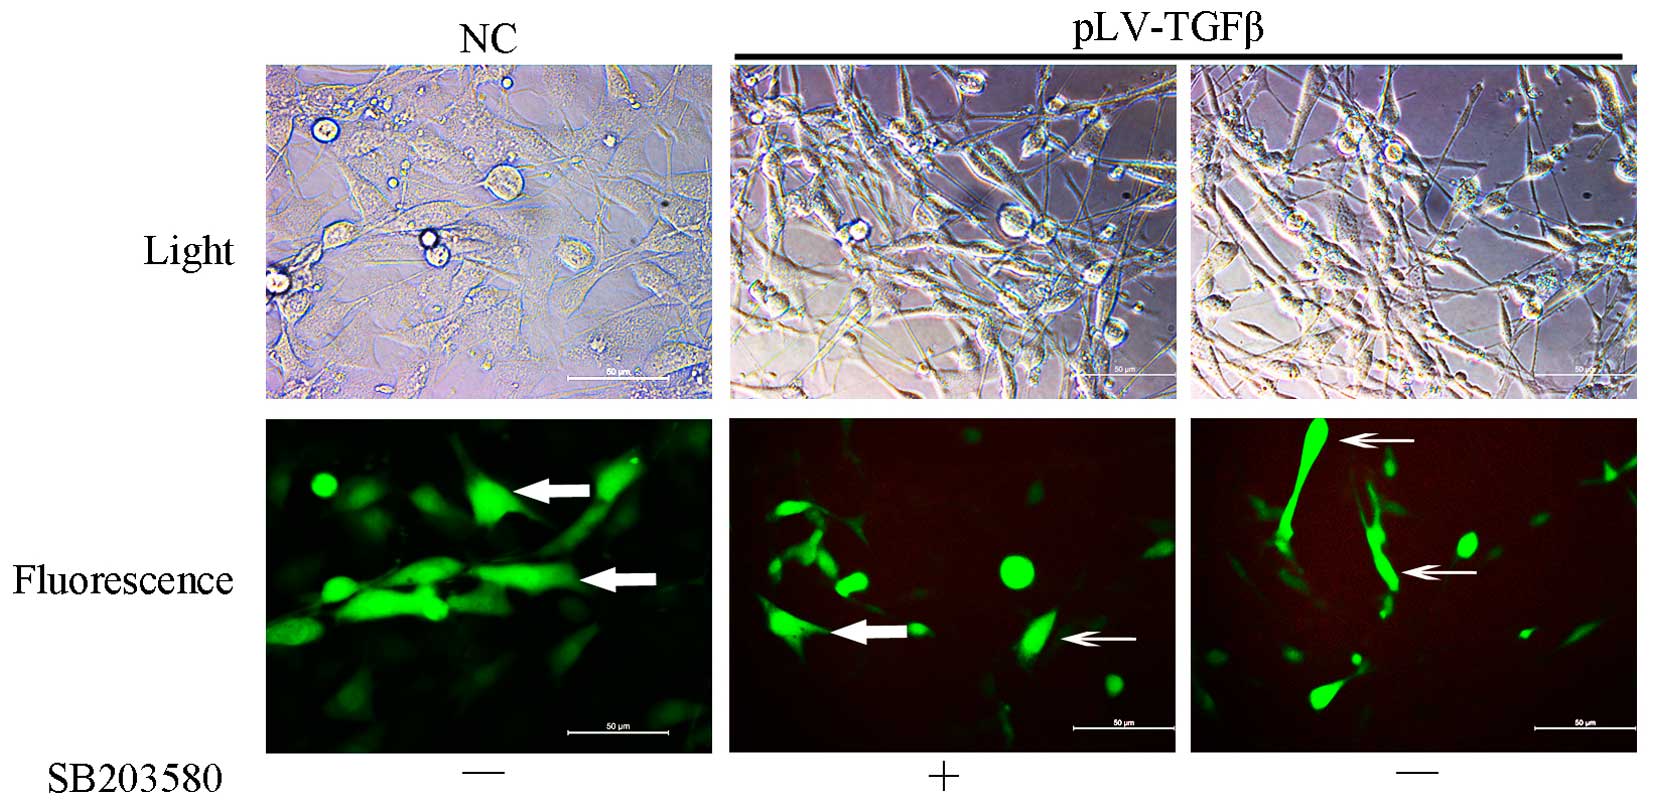
Cells transfected with pLV-TGFβ showed a more
mesenchymal morphology compared with those transfected with empty
vector. The appearance of cells switched from an astrocytic shape
to a fibroblastic one, which could be observed under a fluorescence
microscope (Fig. 1). With the
addition of SB203580, cells had a less slender shape and regained
their ‘envelope synapses’. To explore the gene and protein
expression of the cells, we conducted RT-PCR, western blot analysis
and ELISA. RT-PCR results (Fig. 2A and
B) showed that: smad2 transcript in pLV-TGFβ group was
significantly higher than that in NC group (P<0.001), but was
almost at the same level with that in pLV-TGFβ+SB203580 group
(P=0.349); p38 transcript in pLV-TGFβ group was significantly
higher than that in NC group (P<0.001), but was almost at the
same level with that in pLV-TGFβ+SB203580 group (P=0.421); TGF-β
transcript in pLV-TGFβ group was significantly higher than that in
NC group (P<0.001), but was almost at the same level with that
in pLV-TGFβ+SB203580 group (P=0.387); E-cadherin transcript in
pLV-TGFβ group was significantly lower than that in NC group
(P=0.001) and pLV-TGFβ+SB203580 group (P<0.001), and E-cadherin
transcript in pLV-TGFβ+SB203580 group was significantly higher than
that in NC group (P<0.001); N-cadherin transcript in pLV-TGFβ
group was significantly higher than that in NC group (P<0.001)
and pLV-TGFβ+SB203580 group (P<0.001), but N-cadherin transcript
in pLV-TGFβ+SB203580 group was significantly lower than that in NC
group (P=0.024); MT1-MMP transcript in pLV-TGFβ group was
significantly higher than that in NC group (P<0.001), and was
almost at the same level with that in pLV-TGFβ+SB203580 group
(P=0.180). Western blot results (Fig.
2C and D) showed that p-smad2 expression in pLV-TGFβ group was
significantly higher than that in NC group (P<0.001), but was
almost at the same level with that in pLV-TGFβ+SB203580 group
(P=0.132); smad2 expression in pLV-TGFβ group was significantly
higher than that in NC group (P=0.004), but was almost at the same
level with that in pLV-TGFβ+SB203580 group (P=0.863); p-p38
expression in pLV-TGFβ group was significantly higher than that in
NC group (P=0.002) and pLV-TGFβ+SB203580 group (P=0.001), and p-p38
expression in pLV-TGFβ+SB203580 group was significantly lower than
that in NC group (P<0.001); p38 expression in pLV-TGFβ group was
significantly higher than that in NC group (P<0.001), but was
almost at the same level with that in pLV-TGFβ+SB203580 group
(P=0.089); E-cadherin expression in pLV-TGFβ group was
significantly lower than that in NC group (P=0.001) and
pLV-TGFβ+SB203580 group (P<0.001), and E-cadherin expression in
pLV-TGFβ+SB203580 group was significantly higher than that in NC
group (P<0.001); N-cadherin expression in pLV-TGFβ group was
significantly higher than that in NC group (P<0.001) and
pLV-TGFβ+SB203580 group (P<0.001), and N-cadherin expression in
pLV-TGFβ+SB203580 group was significantly lower than that in NC
group (P<0.001); MT1-MMP expression in pLV-TGFβ group was
significantly higher than that in NC group (P=0.030), and was
almost at the same level with that in pLV-TGFβ+SB203580 group
(P=0.569). As the smad2 phosphorylation is a reliable indicator of
downstream TGF-β signaling, we compared the ratio of p-smad2 to
smad2 among groups. The extent of phosphorylation of smad2
(Fig. 2E) had no difference
between pLV-TGFβ group and pLV-TGFβ+SB203580 group (P=0.988). The
extent of phosphorylation of p38 (Fig.
2F) in pLV-TGFβ group was much higher than that in
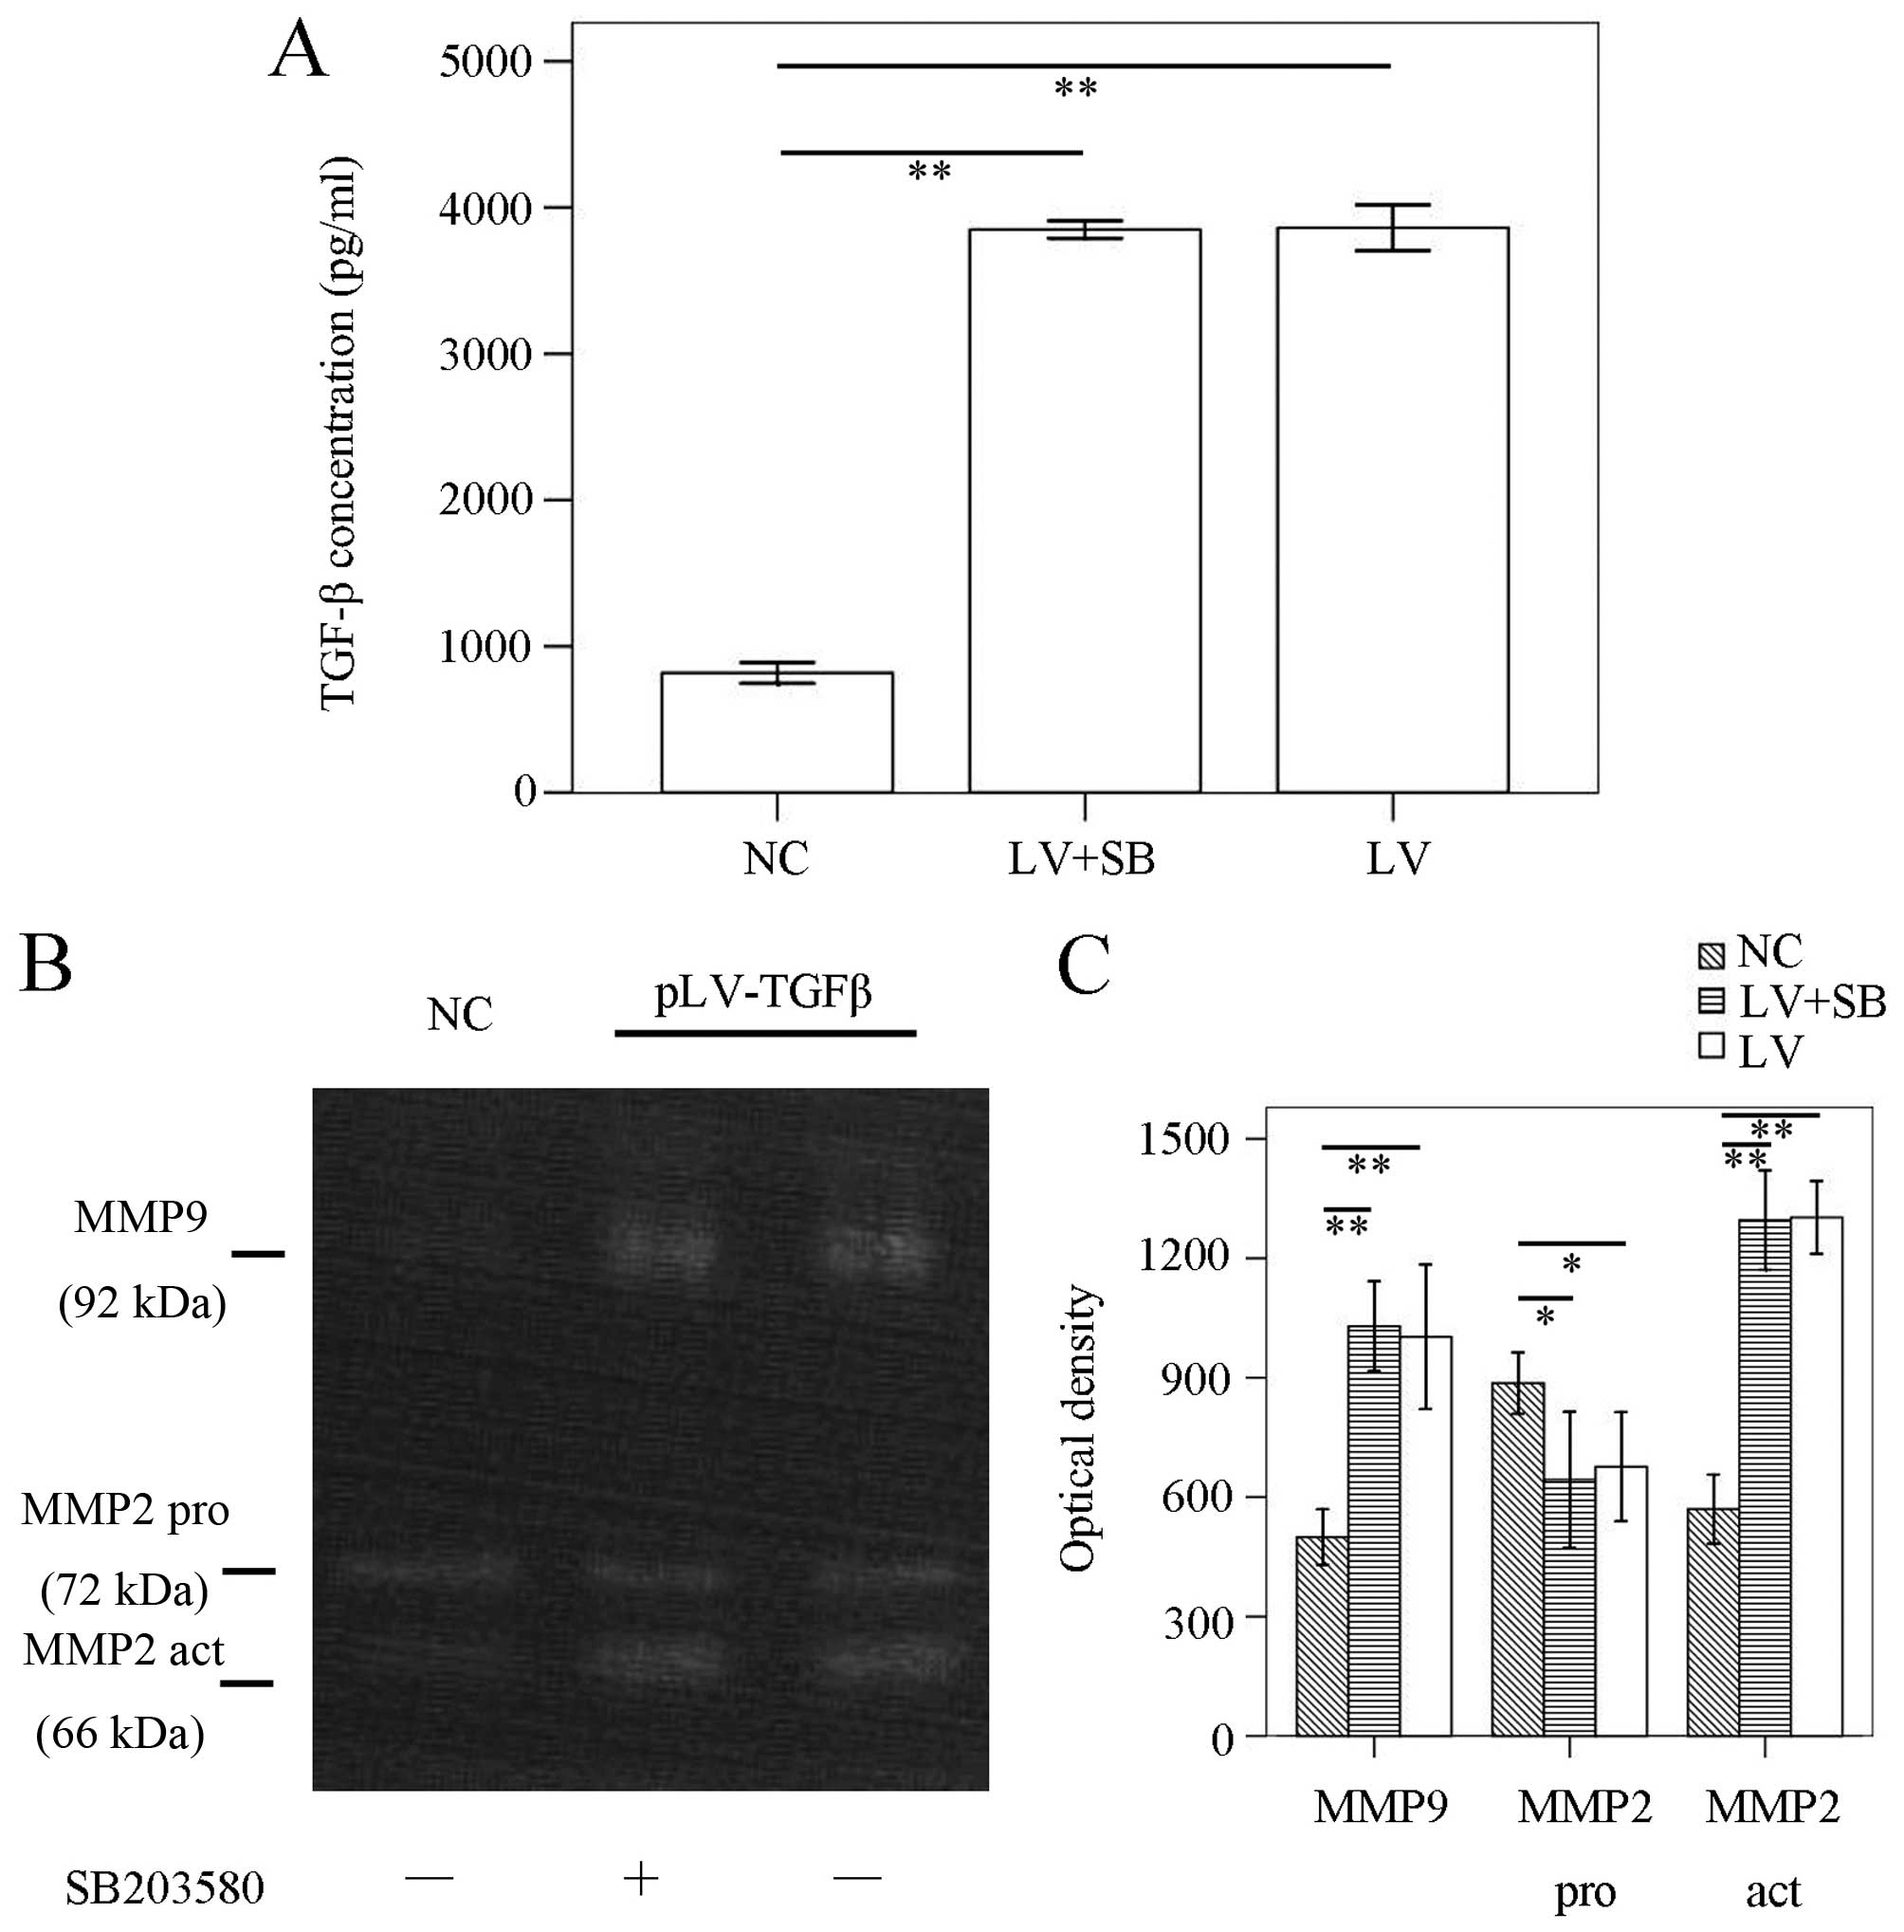
pLV-TGFβ+SB203580 group (P<0.001). ELISA results (Fig. 3A) showed that TGF-β concentration
in pLV-TGFβ group was significantly higher than that in NC group
(P<0.001), but was almost at the same level with that in
pLV-TGFβ+SB203580 group (P=0.752). To detect the MMPs activation of
the cells, we conducted gelatin zymography. The results (Fig. 3B and C) showed that there was no
difference between pLV-TGFβ group and pLV-TGFβ+SB203580 group in
MMP9 activity (P=0.555) or MMP2 activity (P=0.850).
 | Figure 2Gene transcripts and protein
expression in the three groups of cells. (A and B) RT-PCR assays.
Upregulation of smad2, p38, TGF-β, N-cadherin, MT1-MMP and
downregulation of E-cadherin were observed when SHG44 cells were
transfected with pLV-TGFβ. SB203580 inhibited the transcript of
N-cadherin, while enhanced the transcript of E-cadherin. (C and D)
Western blot assays. Upregulation of p-smad2, smad2, p-p38, p38,
N-cadherin, MT1-MMP and downregulation of E-cadherin were observed
when SHG44 cells were transfected with pLV-TGFβ. SB203580 inhibited
the expression of p-p38 and N-cadherin, while enhanced the
expression of E-cadherin. (E) The phosphorylation of smad2 had no
differences among groups. (F) The phosphorylation of p38 was
inhibited by SB203580. β-actin served as internal control.
*P<0.05, **P<0.01,
***P<0.001. |
The in vitro VM formation, cell
migration, invasion and proliferation of pLV-TGFβ transfected cells
were inhibited by SB203580
To explore the effect of SB203580 on biological
properties of pLV-TGFβ transfected cells, we conducted in
vitro VM formation assays, wound healing assays, Transwell
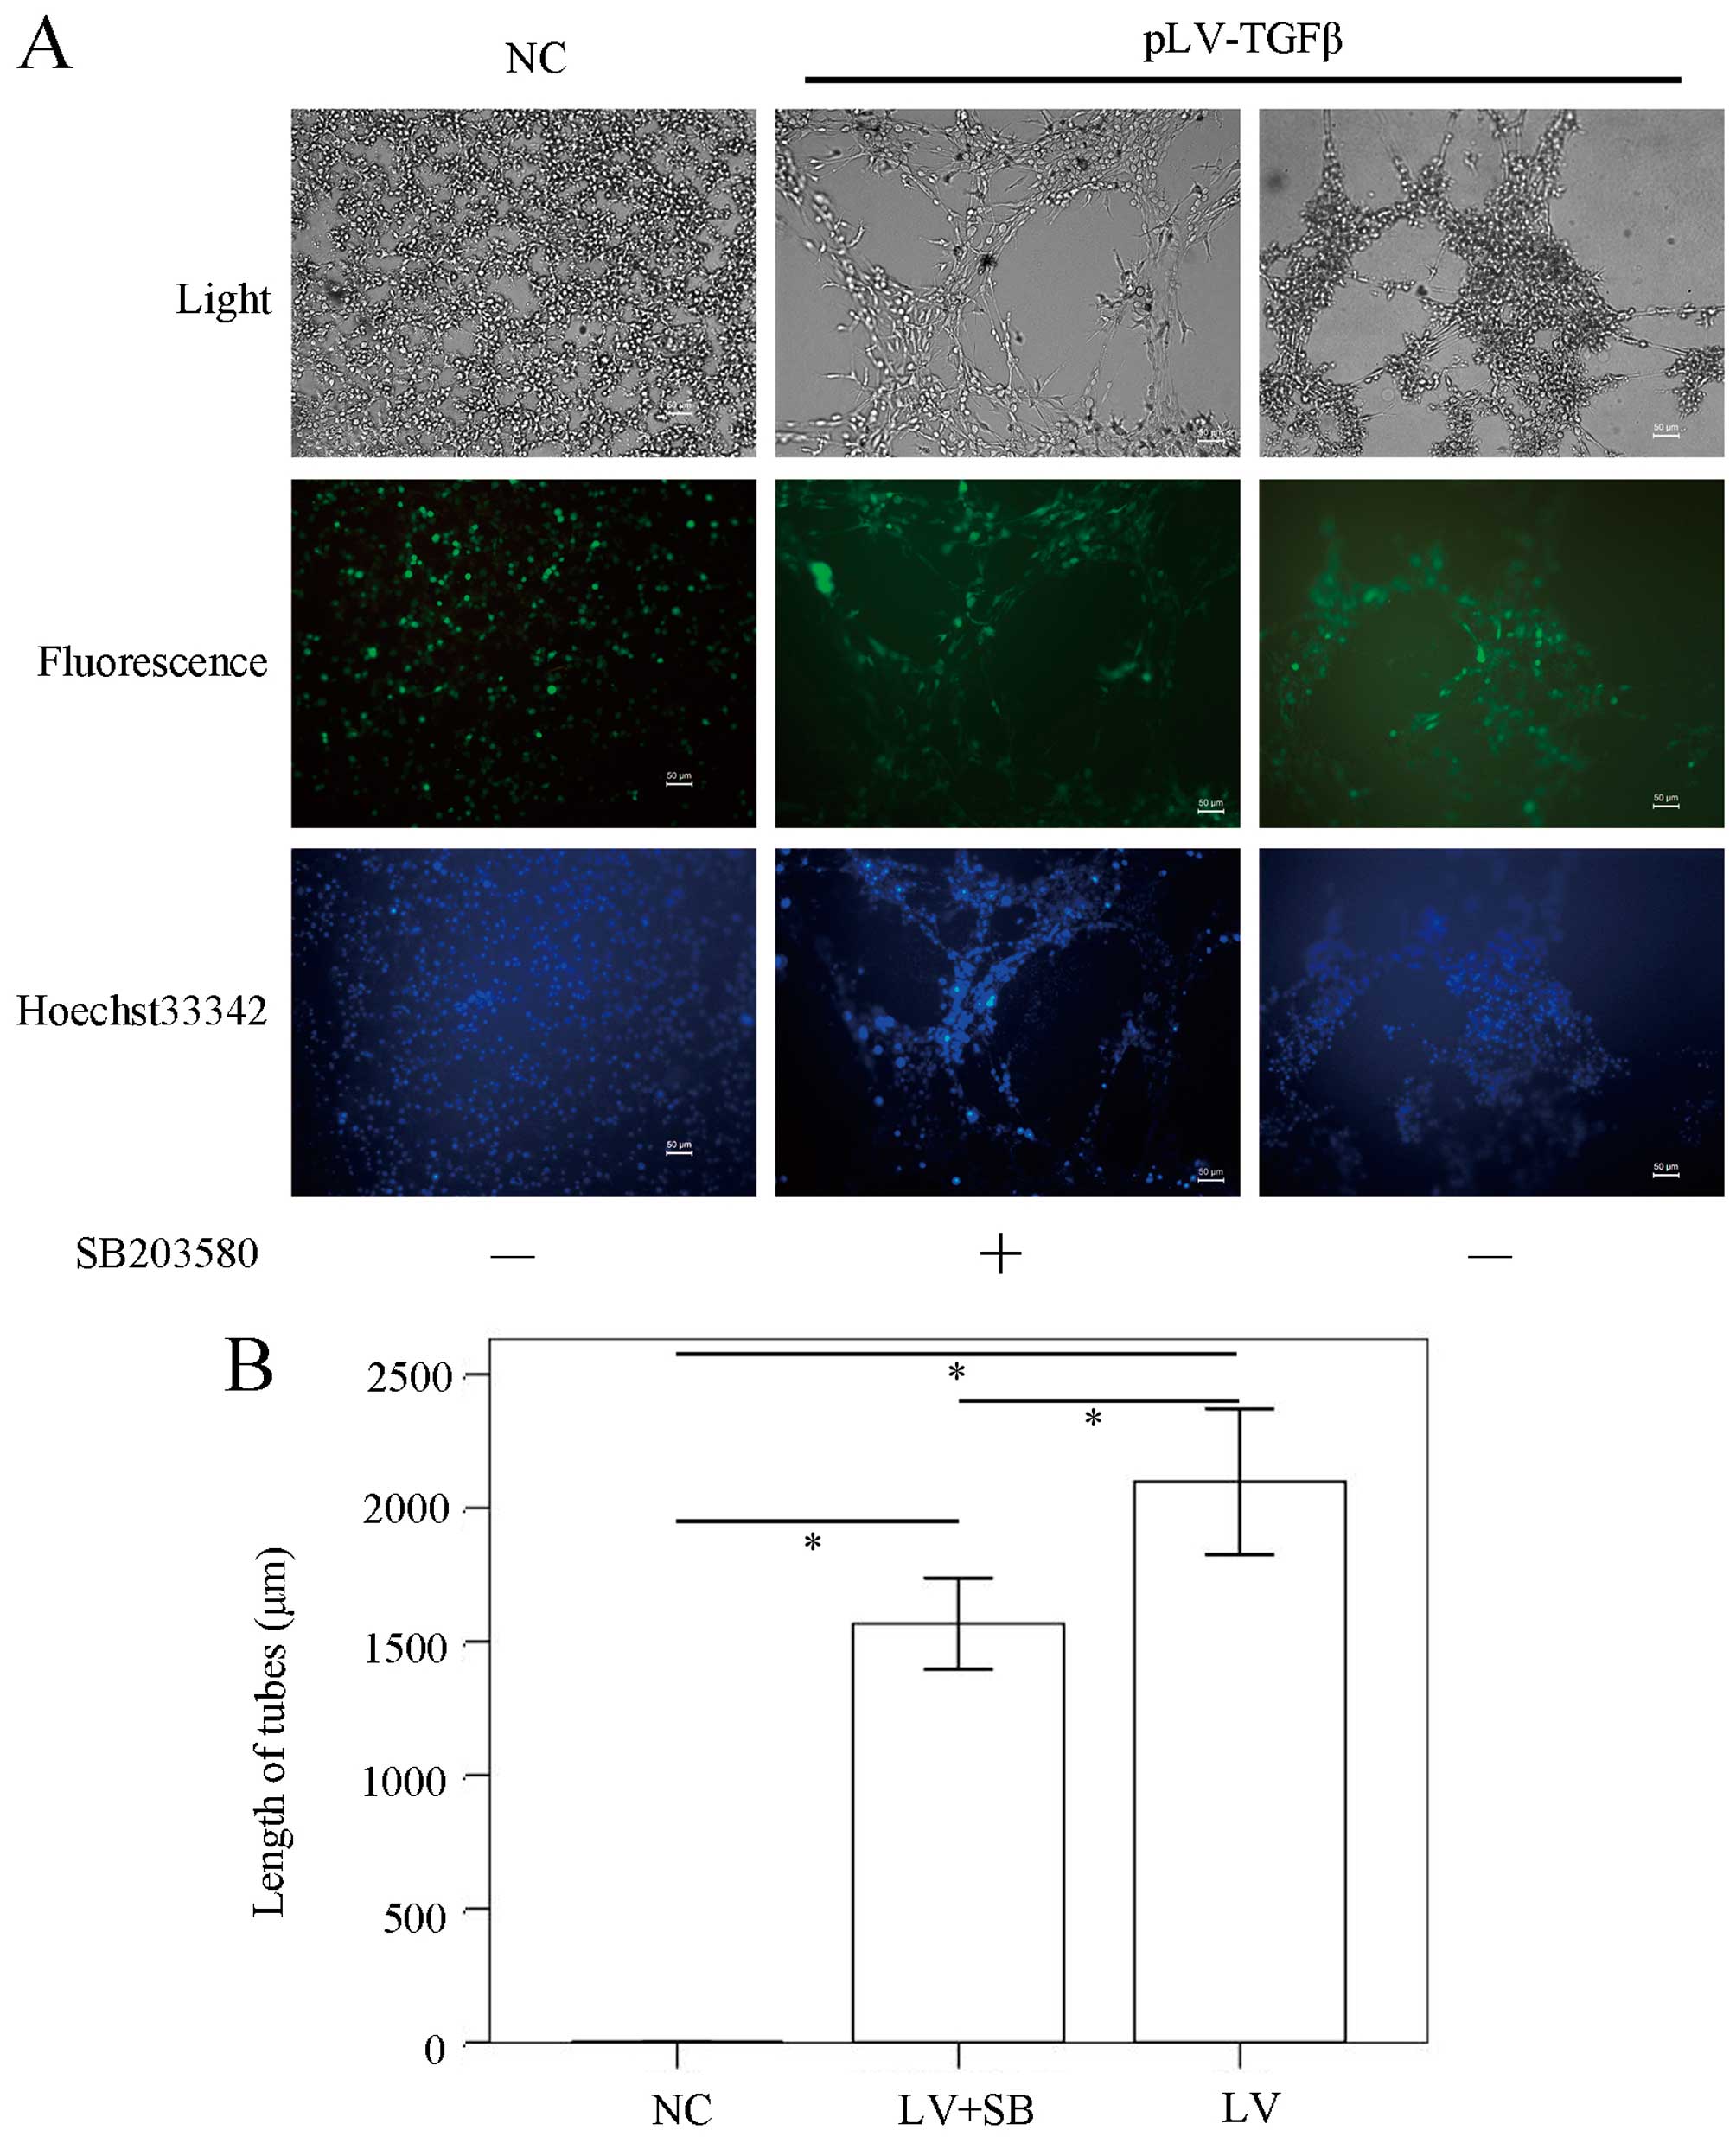
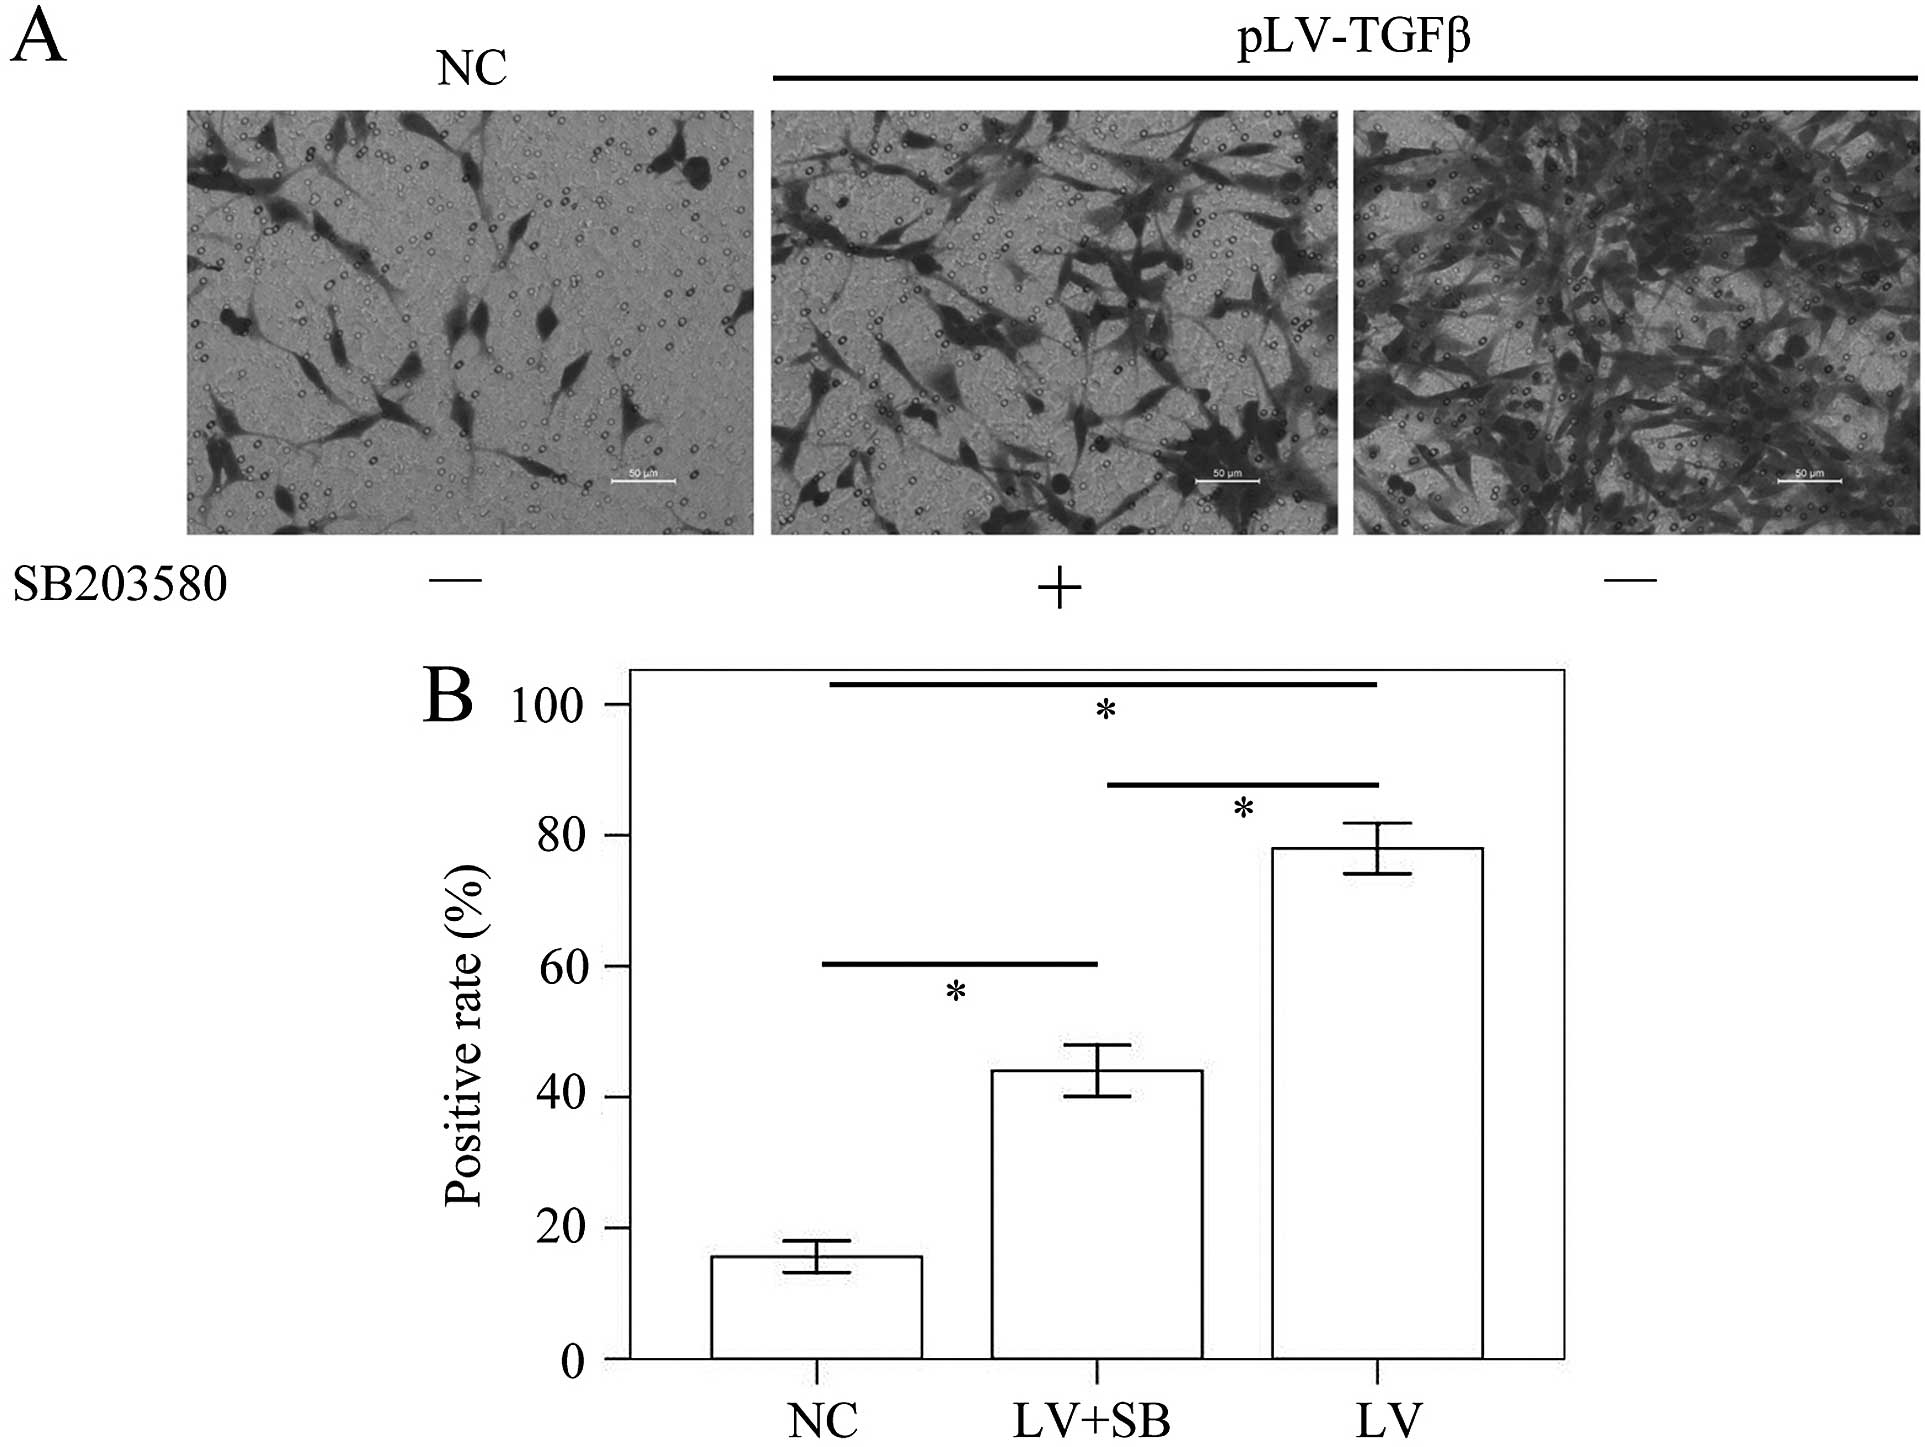
assays and CCK-8 assays. The in vitro VM formation assay
results (Fig. 4) showed that the
mean length of VM tubes in pLV-TGFβ group was significantly longer
than that in NC group (P<0.001) and pLV-TGFβ+SB203580 group
(P=0.005), and the mean length of VM tubes in pLV-TGFβ+SB203580
group was significantly longer than that in NC group (P<0.001).
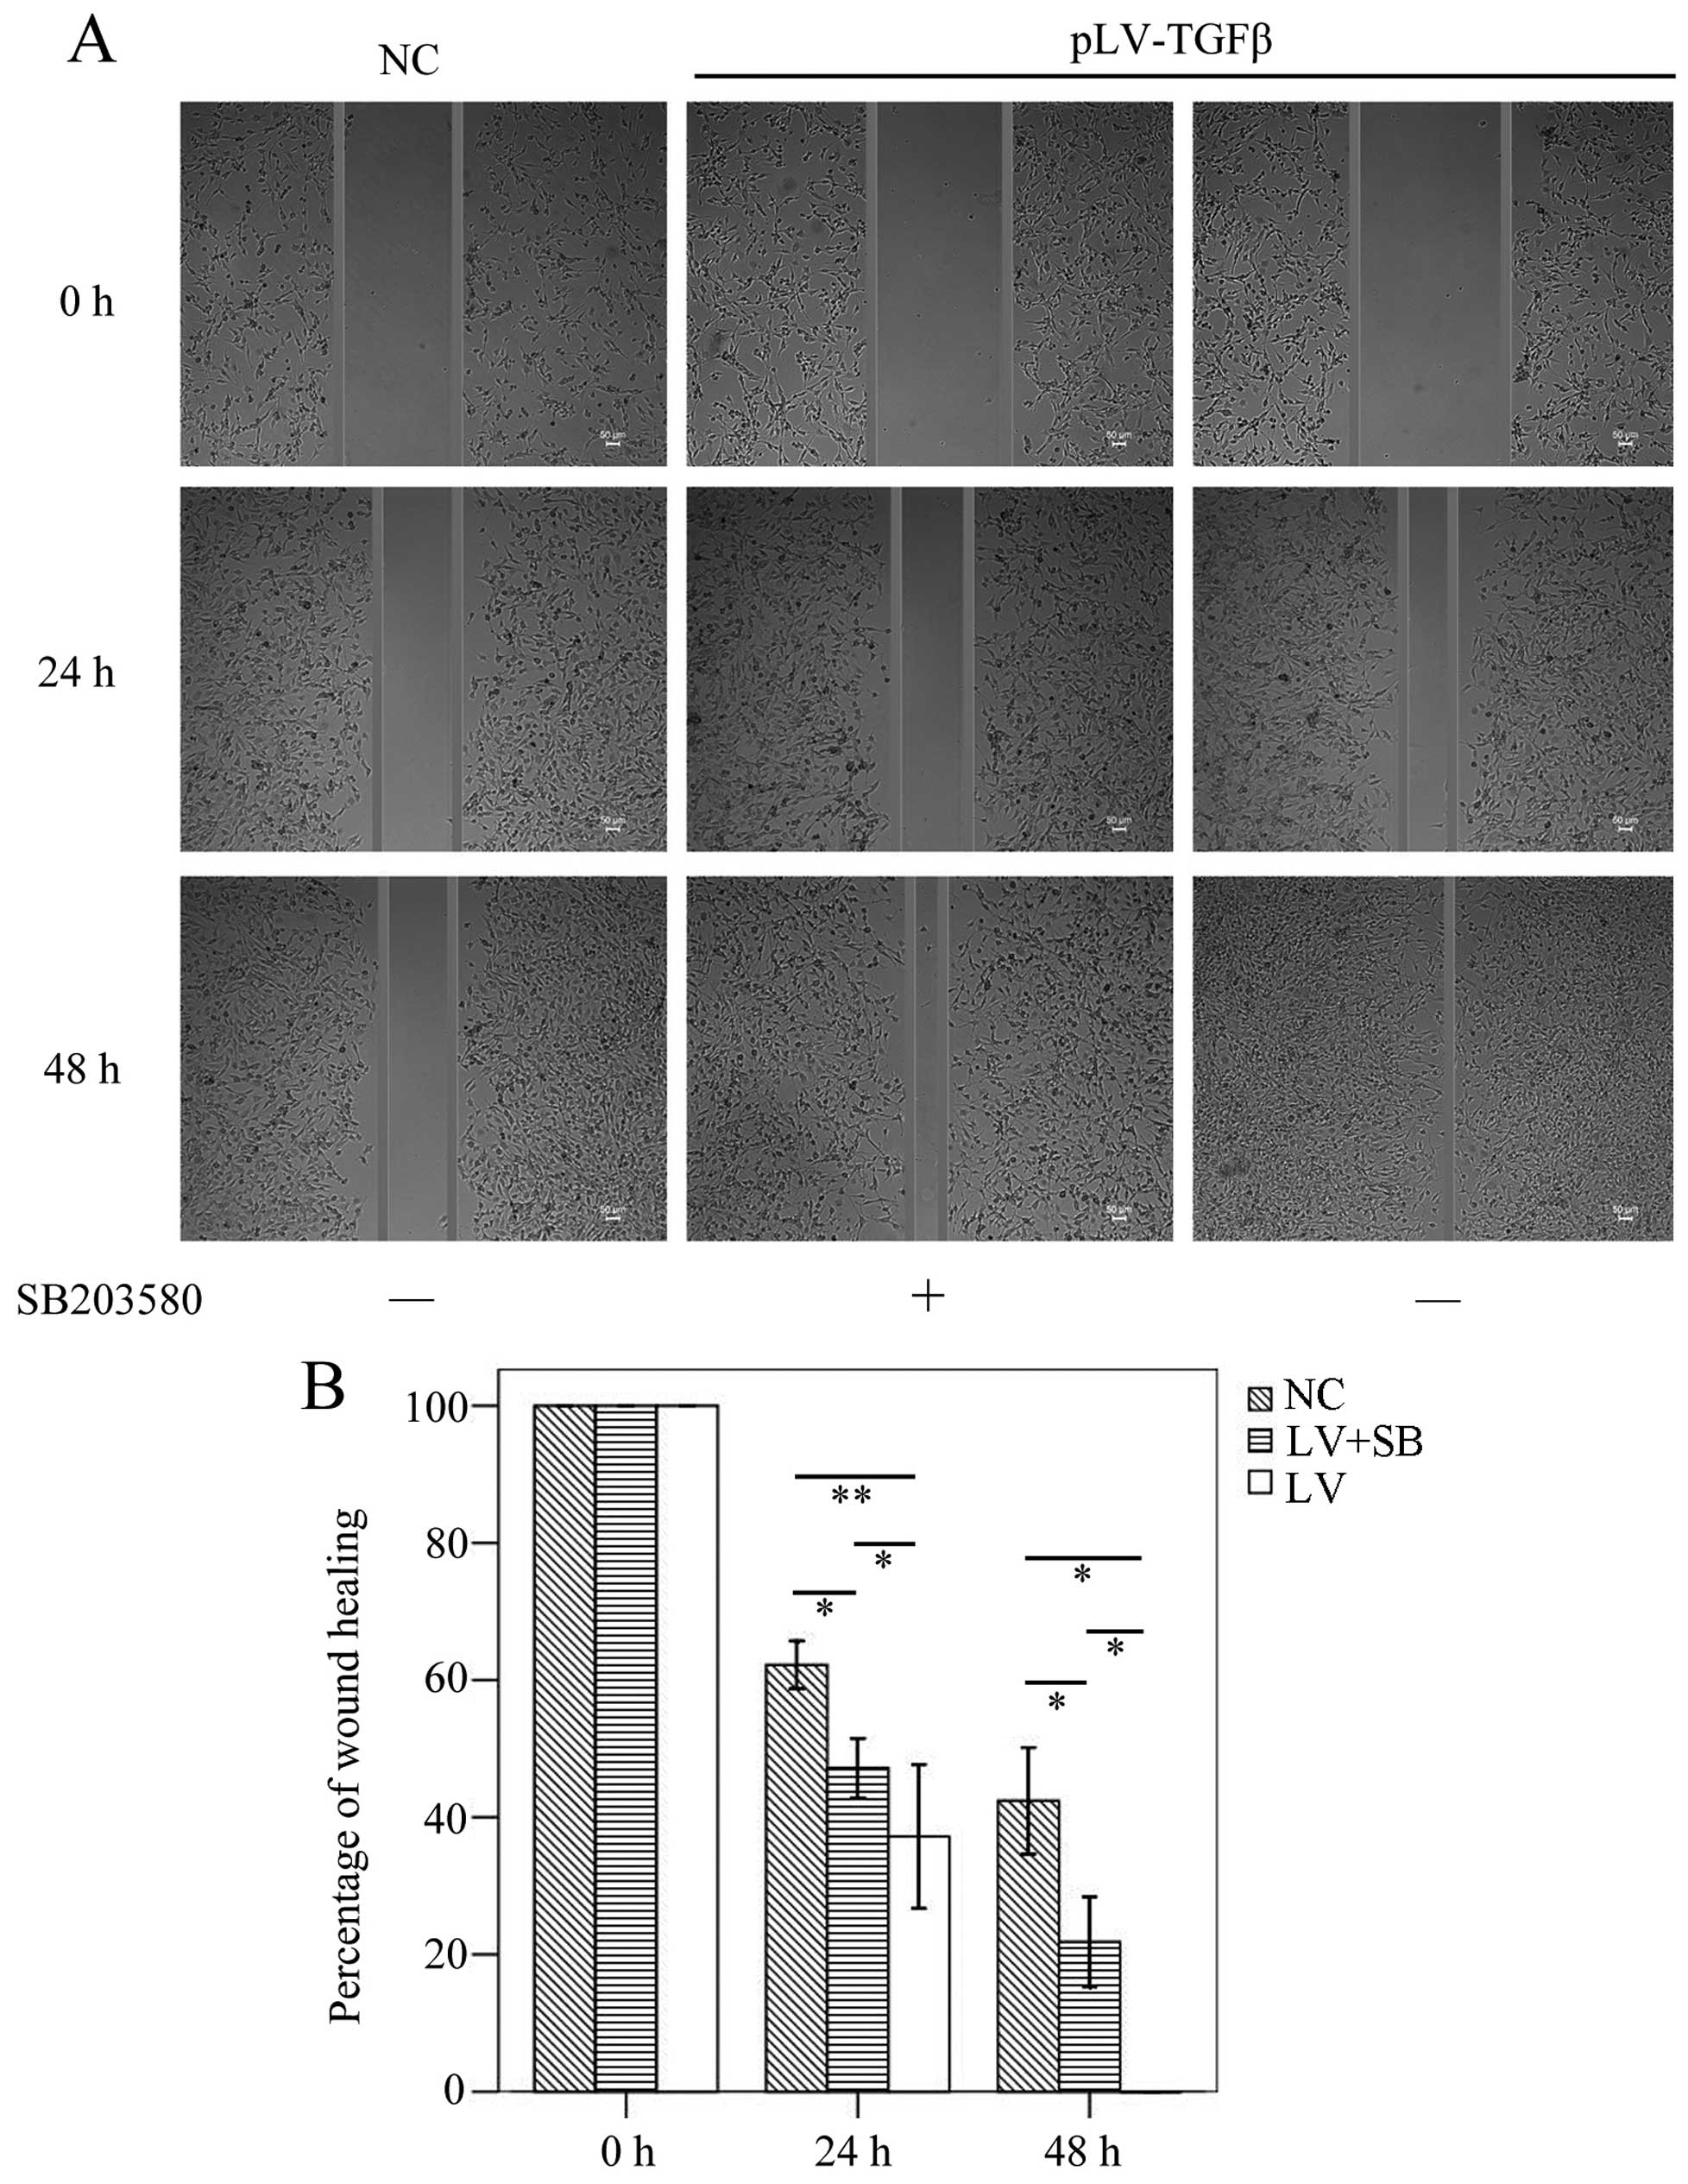
The wound healing assay results (Fig.
5) showed that the mean gap in pLV-TGFβ group was significantly
smaller than that in NC group (P<0.001/P=0.003) or
pLV-TGFβ+SB203580 group (P=0.004/P=0.009) at 24/48 h, and the mean
gap in pLV-TGFβ+SB203580 group was significantly smaller than that
in NC group (P=0.001/P=0.002) at 24/48 h. The wound was actually
closed at 48 h in pLV-TGFβ group. The Transwell assay results
(Fig. 6) showed that the mean
stained area in pLV-TGFβ group was significantly larger than that
in NC group (P<0.001) and pLV-TGFβ+SB203580 group (P<0.001),
and the mean stained area in pLV-TGFβ+SB203580 group was
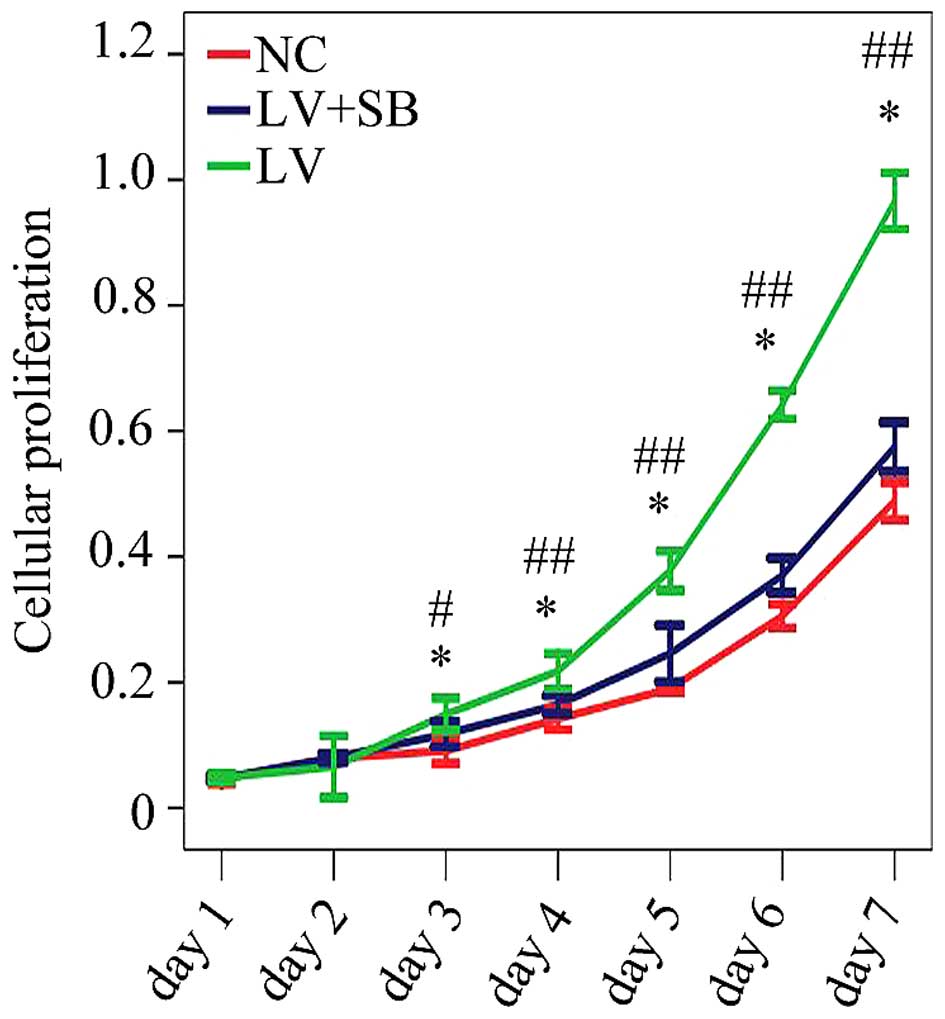
significantly larger than that in NC group (P<0.001). The CCK-8
assay results (Fig. 7) showed that
the optical density from the 3rd day to the 7th day in pLV-TGFβ
group was significantly higher than that in NC group; the optical
density from the 3rd day to the 7th day in pLV-TGFβ+SB203580 group
was significantly lower than that in pLV-TGFβ group.
The volume and VM density of the
xenograft formed by pLV-TGFβ transfected cells were inhibited by
SB203580
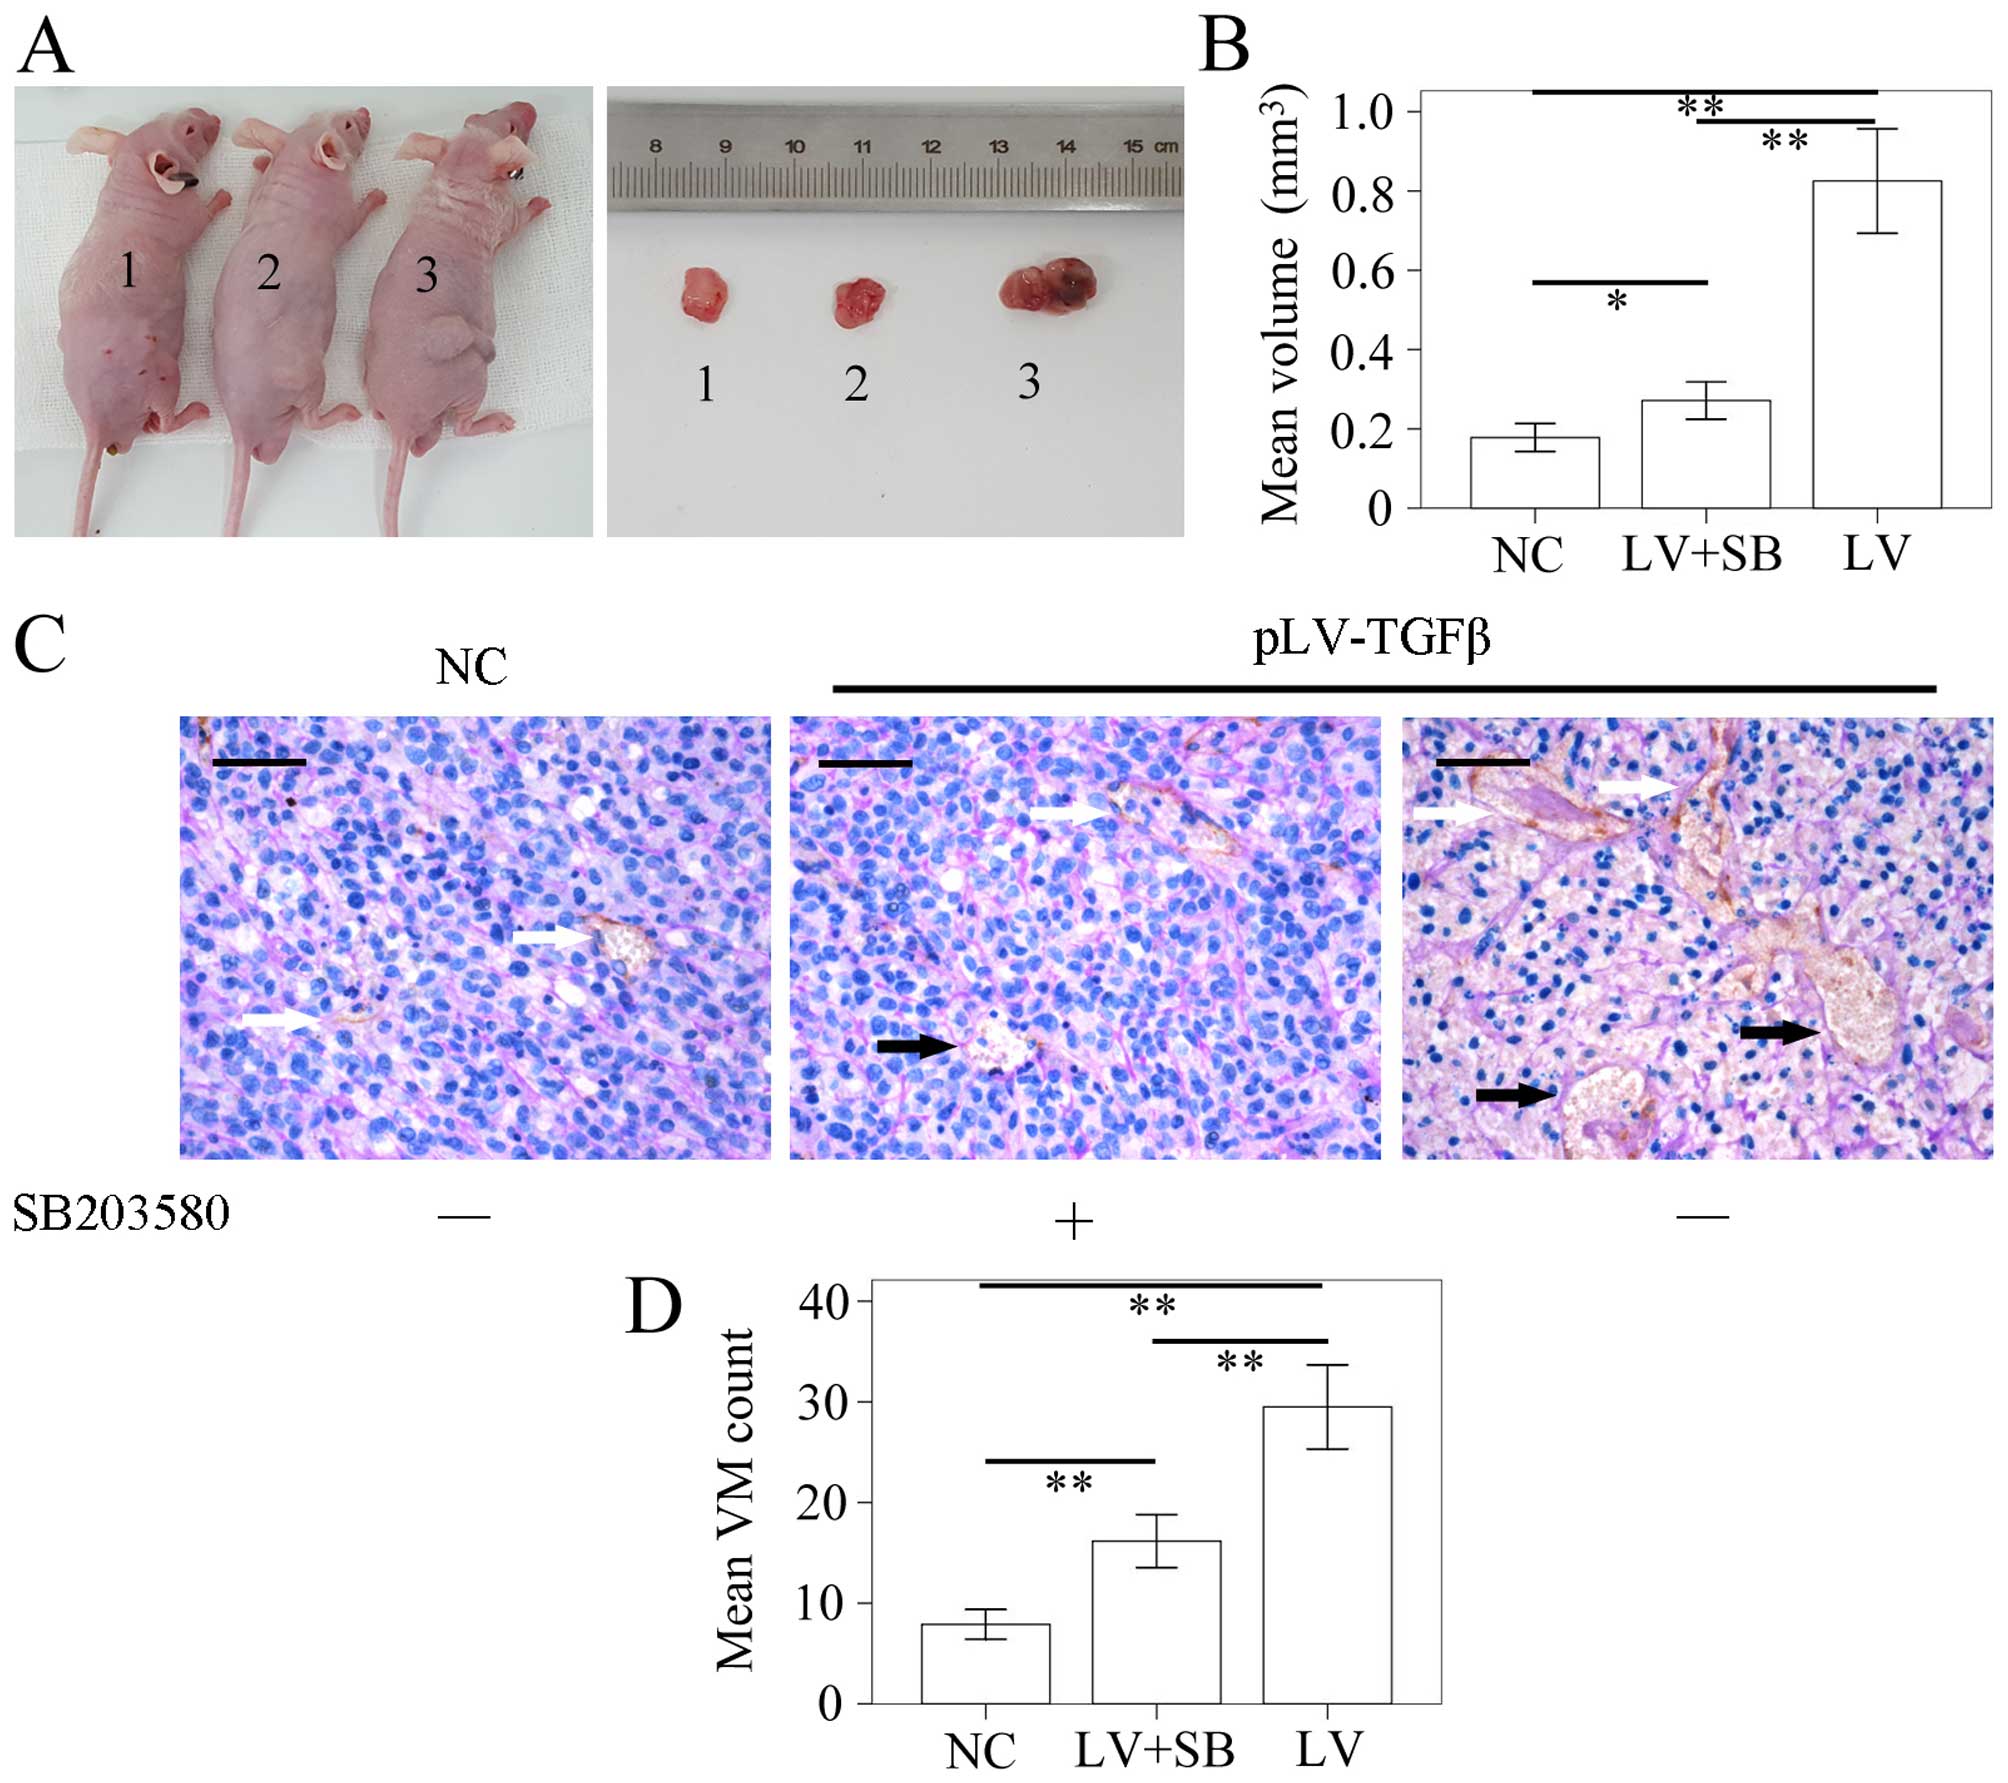
The model of SHG44 tumor-bearing nude mouse was
successfully established. The tumor volume was detected using a
vernier caliper according to the formula: π/6 × W2 × L.
The L stands for the long axis, and the W for the short axis. The
results (Fig. 8A and B) showed
that the mean volume of tumor in pLV-TGFβ group was significantly
larger than that in NC group (P<0.001) and pLV-TGFβ+SB203580
group (P<0.001), and the mean volume of tumor in
pLV-TGFβ+SB203580 group was significantly larger than that in NC
group (P=0.005). We also assessed the capability of tumor cells to
form VM in vivo by counting the CD34-negative vessels as
previously described. The results (Fig. 8C and D) showed that the amount of
VM tubes in pLV-TGFβ group was significantly more than that in NC
group (P<0.001) and pLV-TGFβ+SB203580 group (P<0.001), and
the amount of VM tubes in pLV-TGFβ+SB203580 group was significantly
more than that in NC group (P<0.001).
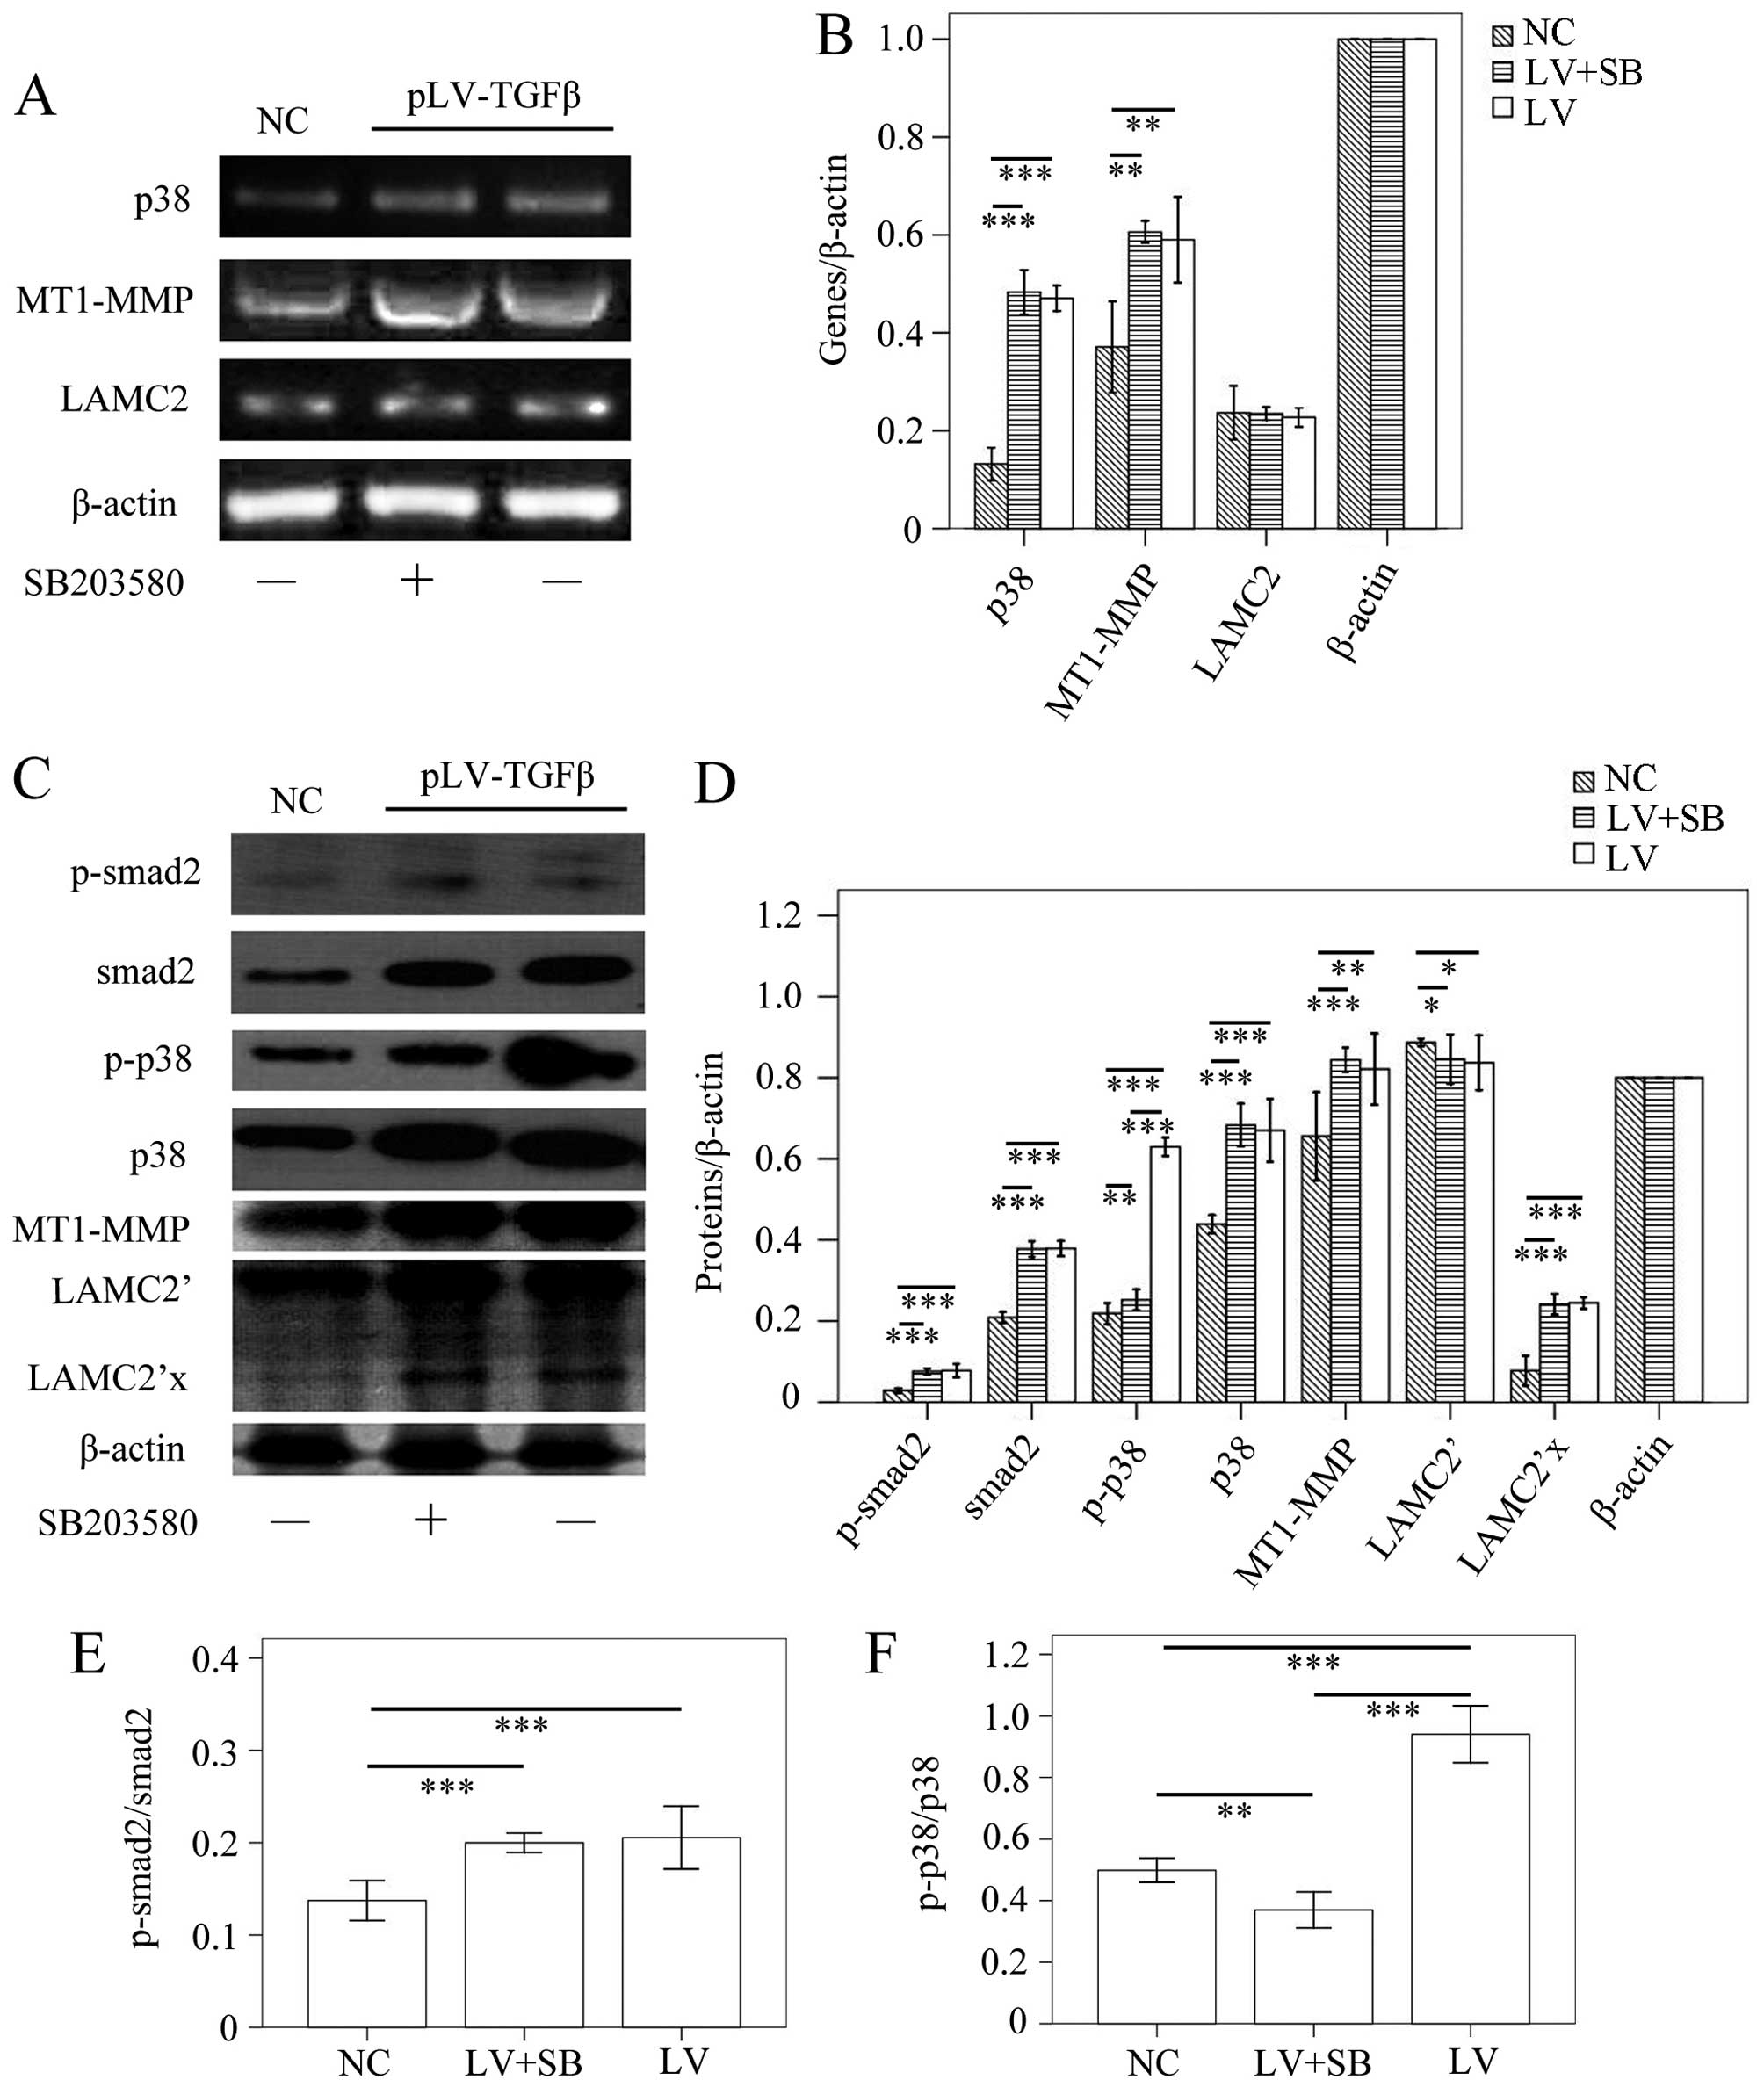
The MT1-MMP/LAMC2 signaling pathways were
not affected by EMT reversion induced by SB203580
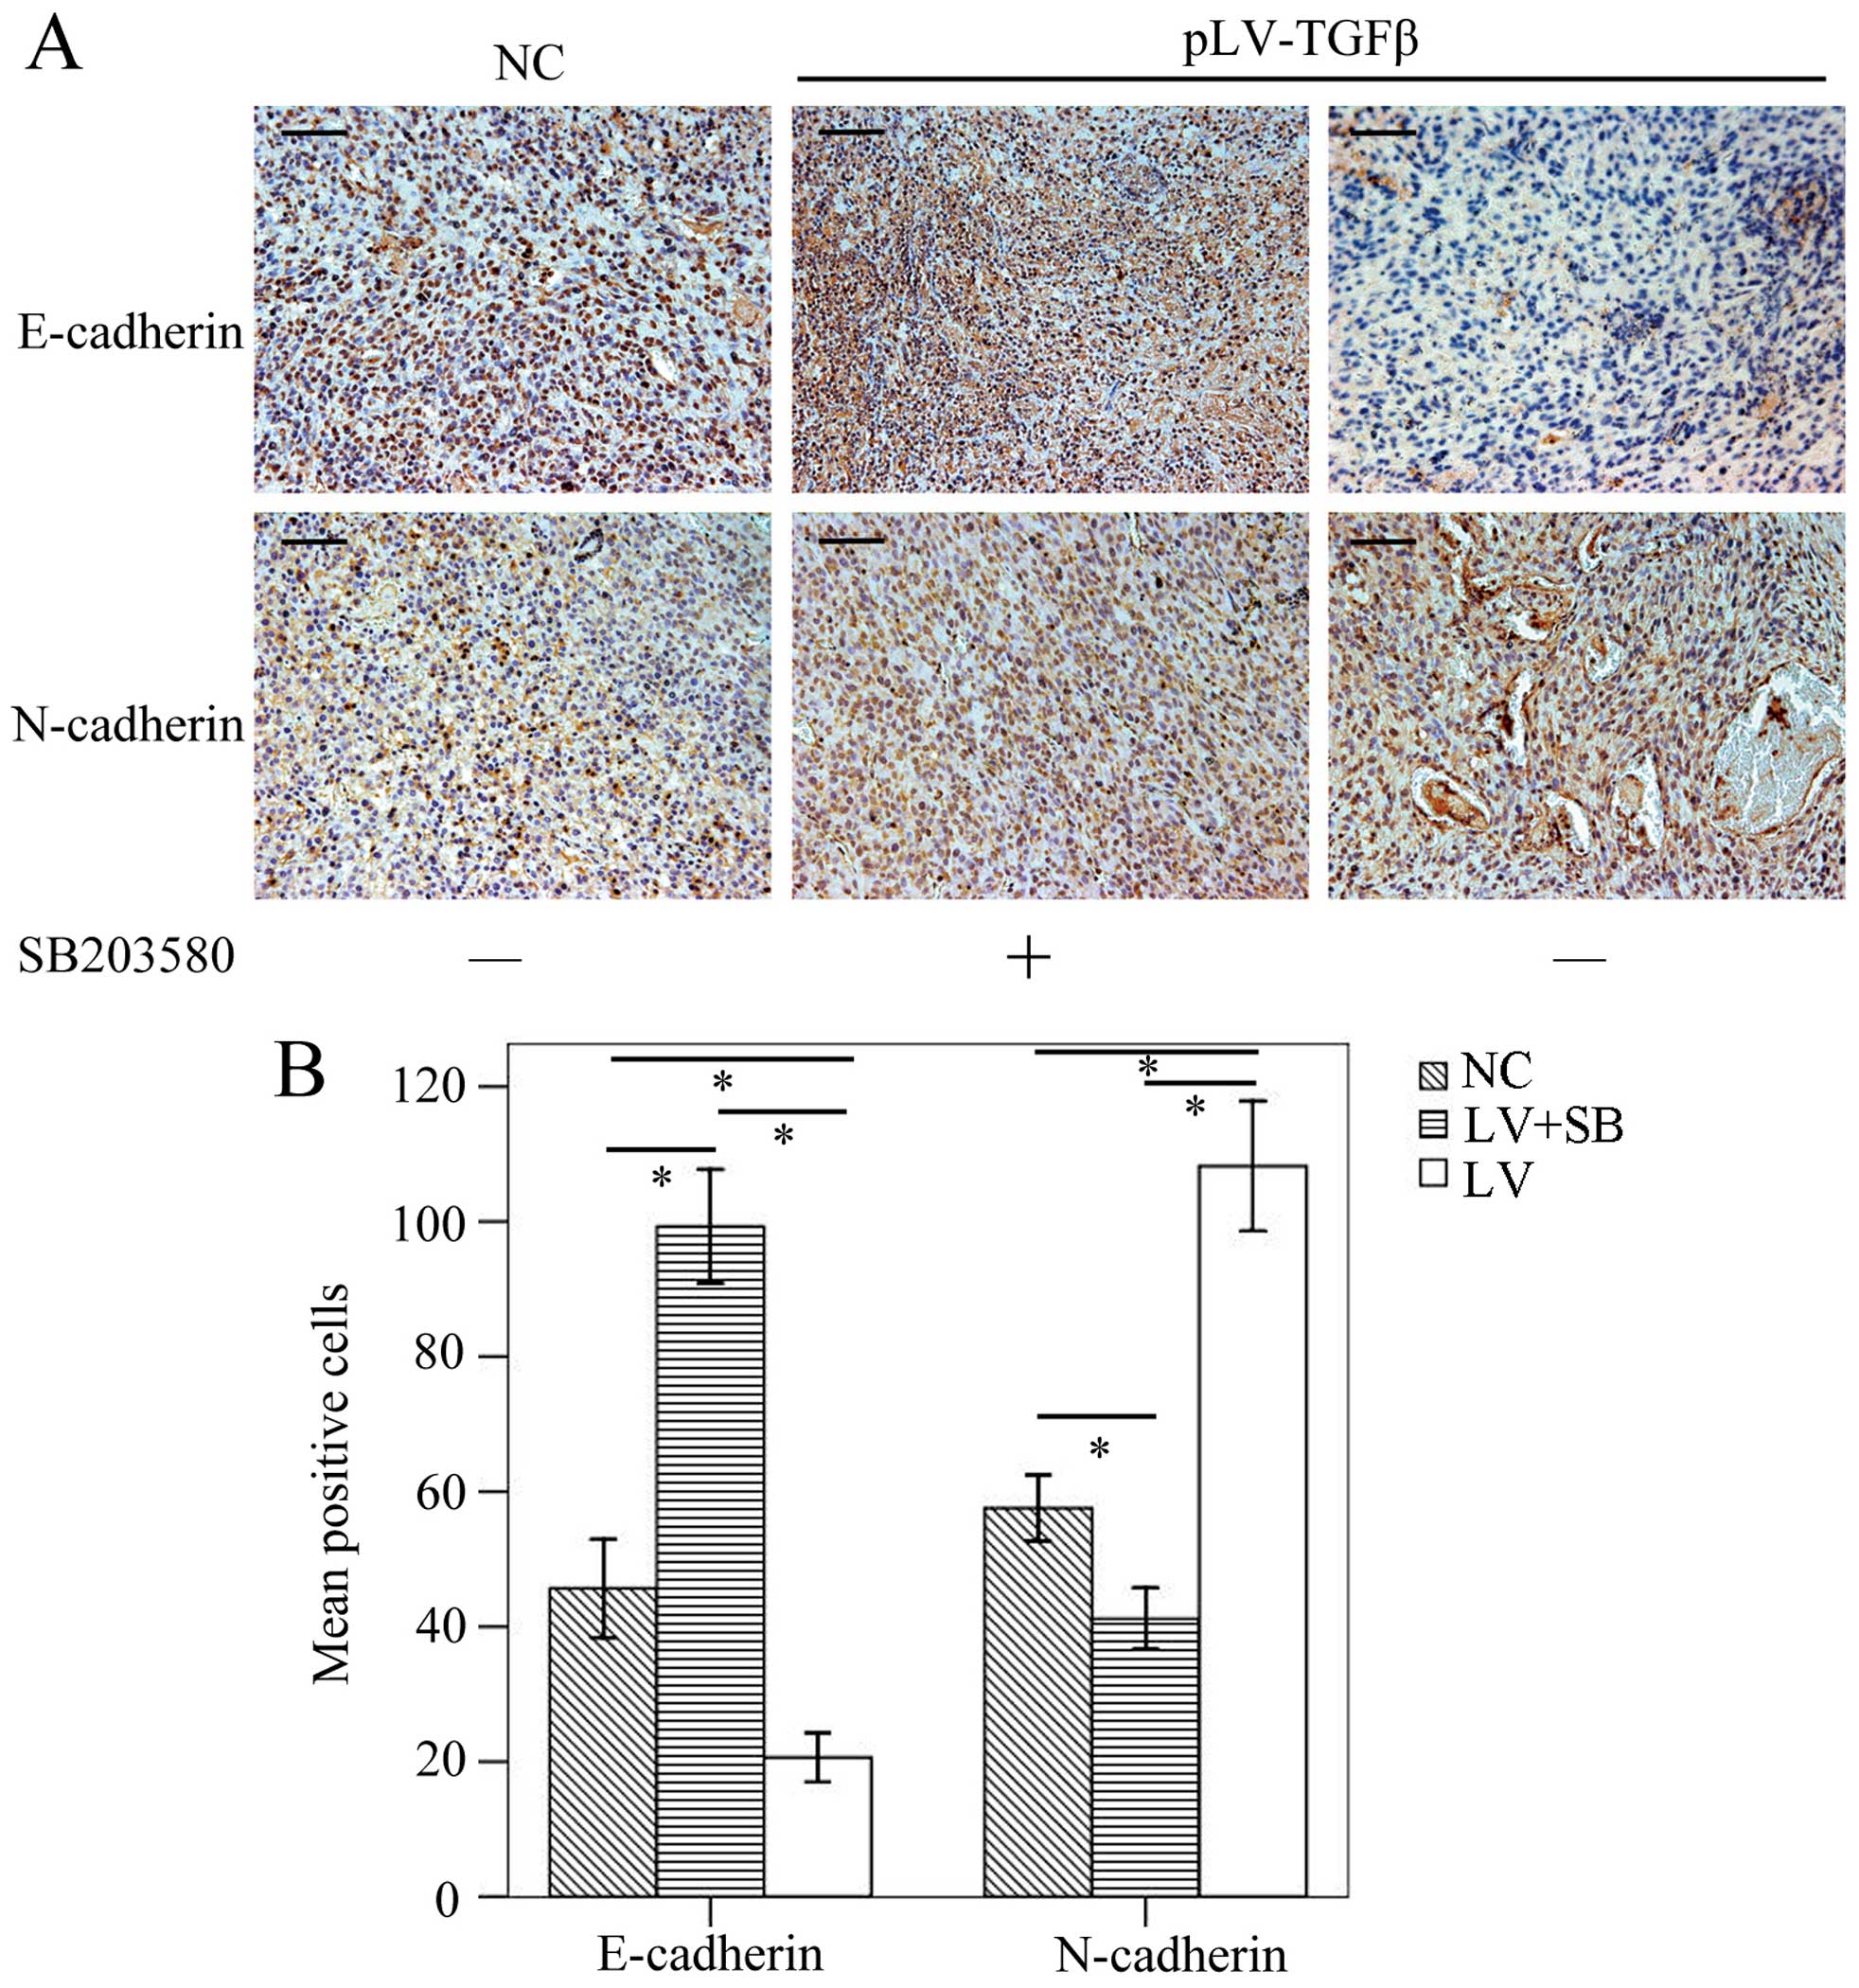
To determine the EMT effect of TGF-β overexpression
and reversal effect of SB203580, we carried out
immunohistochemistry assay to detect the expression of E-cadherin
and N-cadherin. The results (Fig.
9) showed that E-cadherin-positive cells in pLV-TGFβ group were
significantly less than those in NC group (P<0.001) and
pLV-TGFβ+SB203580 group (P<0.001), and E-cadherin-positive cells
in pLV-TGFβ+SB203580 group were significantly more than those in NC
group (P<0.001); N-cadherin-positive cells in pLV-TGFβ group
were significantly more than those in NC group (P<0.001) and
pLV-TGFβ+SB203580 group (P<0.001), and N-cadherin-positive cells
in pLV-TGFβ+SB203580 group were significantly less than those in NC
group (P<0.001). RT-PCR and western blot analysis were employed
to detect the gene transcripts and protein expression of p38,
MT1-MMP and LAMC2. The RT-PCR results (Fig. 10A and B) showed that p38
transcript in pLV-TGFβ group was significantly higher than that in
NC group (P<0.001), but was almost at the same level with that
in pLV-TGFβ+SB203580 group (P=0.328); MT1-MMP transcript in
pLV-TGFβ group was significantly higher than that in NC group
(P=0.002), and was almost at the same level with that in
pLV-TGFβ+SB203580 group (P=0.562); LAMC2 transcript had no
difference among groups (P=0.648). In the western blot assay, LAMC2
was detected to be cleaved into LAMC2′ partly. The results
(Fig. 10C and D) showed that
p-smad2 expression in pLV-TGFβ group was significantly higher than
that in NC group (P<0.001), but was almost at the same level
with that in pLV-TGFβ+SB203580 group (P=0.536); smad2 expression in
pLV-TGFβ group was significantly higher than that in NC group
(P<0.001), but was almost at the same level with that in
pLV-TGFβ+SB203580 group (P=0.864); p-p38 expression in pLV-TGFβ
group was significantly higher than that in NC group (P<0.001)
and pLV-TGFβ+SB203580 group (P<0.001); p-p38 expression in
pLV-TGFβ+SB203580 group was significantly higher than that in NC
group (P=0.006); p38 expression in pLV-TGFβ group was significantly
higher than that in NC group (P<0.001), but was almost at the
same level with that in pLV-TGFβ+SB203580 group (P=0.501); MT1-MMP
expression in pLV-TGFβ group was significantly higher than that in
NC group (P<0.001), and was almost at the same level with that
in pLV-TGFβ+SB203580 group (P=0.105); LAMC2′ expression in either
pLV-TGFβ group or pLV-TGFβ+SB203580 group was significantly lower
than that in NC group (P=0.040/P=0.026); LAMC2′ expression in
pLV-TGFβ group and pLV-TGFβ+SB203580 group were almost at the same
level (P=0.744); LAMC2′x expression in either pLV-TGFβ group or
pLV-TGFβ+SB203580 group was significantly higher than that in NC
group (P<0.001); LAMC2′x expression in pLV-TGFβ group and
pLV-TGFβ+SB203580 group were almost at the same level (P=0.512).
The extent of phosphorylation of smad2 (Fig. 10E) had no difference between
pLV-TGFβ group and pLV-TGFβ+SB203580 group (P=0.503). The extent of
phosphorylation of p38 (Fig. 10F)
in pLV-TGFβ group was much higher than that in pLV-TGFβ+SB203580
group (P<0.001).
Discussion
Since VM was known as a supplemental blood supply
system in tumor, anti-angiogenic therapies should target both
endothelial neovessels and VM. In recent years, researchers are
increasingly concerned about frontier of anti-angiogenic therapies
and interested in a new concept, i.e. vascular normalization.
Vascular normalization means that anti-angiogenic treatment merely
affects the immature vasculature and leaves the mature vessels
unaltered (28). It is thought to
interrupt the growth of immature vessels and a subsequent increase
in tumor hypoxia (29). In order
to achieve vascular normalization, several potential targets
besides anti-VEGF therapy need to co-exist, including blockage of
TGF-β signaling (30). Considering
that our former study had revealed that the blockage of TGF-β could
impair VM formation in malignant glioma (24), we suggested that anti-VM treatment
by blocking TGF-β signaling might be a part of vascular
normalization. Furthermore, the detailed mechanism of VM formation
induced by TGF-β awaited investigation.
Both the EMT signaling pathways and VM played
important roles in tumor metastasis and invasion. However, few
studies exist on the relationship between them. TGF-β was suggested
to be a major inducer of EMT (31,32),
with downstream signaling mainly involving smad and non-smad
pathways. The non-smad pathways were composed of PI3K/Akt,
NF-kappaB, FAK and p38/MAPK sub-pathways according to the research
by Morrison et al (33).
The final effect of these signaling pathways would result in
downregulation of epithelial markers (e.g. E-cadherin and zonula
occludens-1) and upregulation of mesenchymal markers (e.g.
N-cadherin and vimentin), which were considered to be universal
features of EMT (34). Besides,
TGF-β inhibition was found to weaken the capability of VM formation
in malignant glioma cell line (24). Hence, we wished to investigate
whether TGF-β could be a connection between EMT and VM.
To clarify this, we stably upregulated the TGF-β
expression in a less aggressive glioma cell line SHG44. It was
found that the TGF-β-induced p38 signaling pathways were activated,
leading to downregulation of E-cadherin and upregulation of
N-cadherin. With the genetical variation, the morphology and
biological behavior of SHG44 cells changed, which became more
mesenchymal and aggressive according to the results of cell
migration/invasion assays and tube formation assays. Besides, TGF-β
also stimulated SHG44 cells to proliferate according to the CCK-8
assays. It was consistent with the theory of TGF-β paradox rather
than inhibiting cell proliferation in normal tissue, TGF-β promotes
tumor growth and progression in cancer tissue (35). To investigate the possible
mechanism, we detected the gene/protein expression and MMP zymogram
of cells in different groups. On the one hand, TGF-β activated
p38/Smad2 sub-pathways, resulting in EMT occurrence. On the other
hand, TGF-β elevated MT1-MMP expression and MMP2/9 activation.
These results were consistent with the study by Zhao et al
(36) that TGF-β/p38/Smad2 pathway
played a key role in growth and metastasis of glioma cells.
However, the results of tube formation assays seemed to contradict
with our previous report that SHG44 could not form VM in
Matrigel-coated wells even when we added exogenous TGF-β into the
culture medium (24). We
speculated that the capability of VM formation in pLV-TGFβ
transfected SHG44 cells originated from the long-term effect of
elevated TGF-β in autocrine manner. Adding exogenous cellular
factors into medium in a short period might change the
transcriptional level, but it might not affect the biological
behavior of cells. Besides, we also noted that long-term effect of
TGF-β upregulation increased the transcripts of p38 and smad2. As
most studies had only considered the phosphorylation level of TGF-β
towards its downstream signaling, the exact mechanism was still
uncertain and needs further investigation. In the future, we intend
to silence TGF-β transcript via RNAi technology to see if p38 and
smad2 could be influenced on the transcriptional level.
In animal tests, stable overexpression was achieved
of TGF-β at least in one month when the pLV-TGFβ transfected SHG44
cells were injected subcutaneously into the nude mice. This enabled
the in vivo EMT to occur. Similar to the in vitro
tests, the in vivo capability of VM formation was also
enhanced, thereby providing enough nutrition, probably partly
resulting in larger volume of tumors. These findings were
consistent with the others that low expression of TGF-β helped to
control cell migration, invasion and volume growth of the tumor
(37,38). Thus, the TGF-β-induced VM formation
might play an important role in tumor-initiating at the first
stage. Furthermore, TGF-β-upregulated xenografts performed
downregulation of E-cadherin, upregulation of N-cadherin, p38,
smad2 and MT1-MMP. The upregulation of MT1-MMP increased the LAMC2
cleavage, which might be responsible for the enhanced capability of
VM formation in vivo.
On the basis of the in vitro and in
vivo consequences above, it was suggested that TGF-β had
positive effects on inducing EMT and VM formation. However, it was
not able to clarify whether the enhanced capability of VM formation
resulted from the complex effects of both enhanced EMT and
MT1-MMP-upregulation or just from MT1-MMP-upregulation alone. Since
VM was discovered, the MMP-LAMC2 chain had been considered as the
key signaling pathways that eventually resulted in VM network
formation (4). As the key
component and functional role of remodeling the extracellular
matrix (ECM), LAMC2 was proteolytically cleaved by active MMP-2,
which was activated by MT1-MMP (25). Blocking any of these components
would lead to the collapse of VM. It was reported that the PI3K
signaling pathways were responsible for the activation of MMP-LAMC2
chain in a tumor (39). We
wondered if there were some other factors participating in the
TGF-β-induced VM formation besides MT1-MMP. Thus, we tried to
inhibit EMT in the TGF-β-induced VM model with minimized influence
on MMP-LAMC2 chain by using SB203580, a specific p38/MAPK signaling
inhibitor which was reported to block EMT process in tumor via
non-smad signaling pathways (40,41).
It was employed to see if EMT played a role in VM formed by
pLV-TGFβ transfected SHG44 glioma cells. The results showed that
both in vitro and in vivo, capabilities of VM
formation were impaired by EMT inhibition via non-smad signaling
pathways. The main features of EMT inhibition by SB203580 were
upregulation of E-cadherin and downregulation of N-cadherin, which
might originate from blockage of p38 phosphorylation. Additionally,
EMT inhibition also caused reversion of cell shape transformation,
cell migration and invasion, and enlarged volume of xenografts.
These findings suggested that EMT might serve as a promoter of
tumor cell plasticity contributing to VM formation. Furthermore, we
noted that EMT inhibition via p38/MAPK (non-smad) signaling
pathways could not fully collapse VM formation. Taken together, we
attributed the possible mechanism to that EMT might be an
alternative mechanism of VM formation in epithelial tumor different
from the mesenchymal tumor which depend more on remodeling of ECM.
Therefore, TGF-β-induced VM formation in glioma might be due to the
common effects of elevated cell plasticity caused by EMT and
remodeled ECM formed by activated MMP-LAMC2 chain. The present
study provided a better understanding of the relationship between
EMT and VM. More evidence should be collected in future
investigations.
Although the current preliminary study indicated
possible relationship between EMT and VM, major limitations should
not be ignored. First of all, our observation was only based on one
single cell line, which might be deficient in universality. In the
further work, we might explore if the strong capability of VM
formation in protogenetic highly malignant glioma is also resulted
from combine effects of elevated cell plasticity caused by EMT and
remodeled ECM. To address this, at least two different kinds of
antagonist should be used to distinguish their exact effects.
However, it would be disturbed in animal tests until better plans
be carried out. Secondly, the inhibition of p38 signaling pathways
in the present study was carried out solely by using a p38 chemical
inhibitor instead of siRNA or clustered regularly interspaced short
palindromic repeats (CRISPR). It might be able to fully suppress
certain target expression by gene silence technology. To date,
several researchers have claimed that they established high
efficient carriers for systemic delivery of small interfering RNA
(siRNA) to solid tumors (42,43).
Based on these new technologies, we would be able to achieve more
convincing results in future studies.
In conclusion, the mechanism of TGF-β-induced VM
formation in glioma might be due to the common effects of elevated
cell plasticity caused by EMT and remodeled ECM formed by activated
MMP-LAMC2 chain. EMT played an important role in TGF-β-induced VM
formation, which might largely depend on improving tumor cell
plasticity. EMT inhibition via p38/MAPK signaling pathways would
partly impair TGF-β-induced VM formation in glioma.
Acknowledgements
The present study was supported by the National
Natural Science Foundation of China (grant no. 81302177).
References
|
1
|
Seystahl K and Weller M: Is there a world
beyond bevacizumab in targeting angiogenesis in glioblastoma?
Expert Opin Investig Drugs. 21:605–617. 2012. View Article : Google Scholar : PubMed/NCBI
|
|
2
|
Hillen F and Griffioen AW: Tumour
vascularization: Sprouting angiogenesis and beyond. Cancer
Metastasis Rev. 26:489–502. 2007. View Article : Google Scholar : PubMed/NCBI
|
|
3
|
Maniotis AJ, Folberg R, Hess A, Seftor EA,
Gardner LM, Pe’er J, Trent JM, Meltzer PS and Hendrix MJ: Vascular
channel formation by human melanoma cells in vivo and in vitro:
Vasculogenic mimicry. Am J Pathol. 155:739–752. 1999. View Article : Google Scholar : PubMed/NCBI
|
|
4
|
Paulis YW, Soetekouw PM, Verheul HM,
Tjan-Heijnen VC and Griffioen AW: Signalling pathways in
vasculogenic mimicry. Biochim Biophys Acta. 1806:18–28.
2010.PubMed/NCBI
|
|
5
|
van der Schaft DW, Hillen F, Pauwels P,
Kirschmann DA, Castermans K, Egbrink MG, Tran MG, Sciot R, Hauben
E, Hogendoorn PC, et al: Tumor cell plasticity in Ewing sarcoma, an
alternative circulatory system stimulated by hypoxia. Cancer Res.
65:11520–11528. 2005. View Article : Google Scholar : PubMed/NCBI
|
|
6
|
van der Schaft DW, Seftor RE, Seftor EA,
Hess AR, Gruman LM, Kirschmann DA, Yokoyama Y, Griffioen AW and
Hendrix MJ: Effects of angiogenesis inhibitors on vascular network
formation by human endothelial and melanoma cells. J Natl Cancer
Inst. 96:1473–1477. 2004. View Article : Google Scholar : PubMed/NCBI
|
|
7
|
Pàez-Ribes M, Allen E, Hudock J, Takeda T,
Okuyama H, Viñals F, Inoue M, Bergers G, Hanahan D and Casanovas O:
Antiangiogenic therapy elicits malignant progression of tumors to
increased local invasion and distant metastasis. Cancer Cell.
15:220–231. 2009. View Article : Google Scholar : PubMed/NCBI
|
|
8
|
Folberg R and Maniotis AJ: Vasculogenic
mimicry. APMIS. 112:508–525. 2004. View Article : Google Scholar : PubMed/NCBI
|
|
9
|
Chen YS and Chen ZP: Vasculogenic mimicry:
A novel target for glioma therapy. Chin J Cancer. 33:74–79. 2014.
View Article : Google Scholar :
|
|
10
|
Yang Z, Sun B, Zhao X, Shao B, An J, Gu Q,
Wang Y, Dong X, Zhang Y and Qiu Z: Erythropoietin and
erythropoietin receptor in hepatocellular carcinoma: Correlation
with vasculogenic mimicry and poor prognosis. Int J Clin Exp
Pathol. 8:4033–4043. 2015.PubMed/NCBI
|
|
11
|
Liu T, Sun B, Zhao X, Li Y, Gu Q, Dong X
and Liu F: OCT4 expression and vasculogenic mimicry formation
positively correlate with poor prognosis in human breast cancer.
Int J Mol Sci. 15:19634–19649. 2014. View Article : Google Scholar : PubMed/NCBI
|
|
12
|
Wang SY, Ke YQ, Lu GH, Song ZH, Yu L, Xiao
S, Sun XL, Jiang XD, Yang ZL and Hu CC: Vasculogenic mimicry is a
prognostic factor for postoperative survival in patients with
glioblastoma. J Neurooncol. 112:339–345. 2013. View Article : Google Scholar : PubMed/NCBI
|
|
13
|
Puisieux A, Brabletz T and Caramel J:
Oncogenic roles of EMT-inducing transcription factors. Nat Cell
Biol. 16:488–494. 2014. View
Article : Google Scholar : PubMed/NCBI
|
|
14
|
Ping YF and Bian XW: Consice review:
Contribution of cancer stem cells to neovascularization. Stem
Cells. 29:888–894. 2011. View
Article : Google Scholar : PubMed/NCBI
|
|
15
|
Wang W, Lin P, Sun B, Zhang S, Cai W, Han
C, Li L, Lu H and Zhao X: Epithelial-mesenchymal transition
regulated by EphA2 contributes to vasculogenic mimicry formation of
head and neck squamous cell carcinoma. Biomed Res Int.
2014:8039142014.PubMed/NCBI
|
|
16
|
Yang Z, Sun B, Li Y, Zhao X, Zhao X, Gu Q,
An J, Dong X, Liu F and Wang Y: ZEB2 promotes vasculogenic mimicry
by TGF-β1 induced epithelial-to-mesenchymal transition in
hepatocellular carcinoma. Exp Mol Pathol. 98:352–359. 2015.
View Article : Google Scholar : PubMed/NCBI
|
|
17
|
Lee JM, Dedhar S, Kalluri R and Thompson
EW: The epithelial-mesenchymal transition: New insights in
signaling, development, and disease. J Cell Biol. 172:973–981.
2006. View Article : Google Scholar : PubMed/NCBI
|
|
18
|
Kang H, Lee M and Jang SW: Celastrol
inhibits TGF-β1-induced epithelial-mesenchymal transition by
inhibiting Snail and regulating E-cadherin expression. Biochem
Biophys Res Commun. 437:550–556. 2013. View Article : Google Scholar : PubMed/NCBI
|
|
19
|
May CD, Sphyris N, Evans KW, Werden SJ,
Guo W and Mani SA: Epithelial-mesenchymal transition and cancer
stem cells: A dangerously dynamic duo in breast cancer progression.
Breast Cancer Res. 13:2022011. View
Article : Google Scholar : PubMed/NCBI
|
|
20
|
Mani SA, Guo W, Liao MJ, Eaton EN, Ayyanan
A, Zhou AY, Brooks M, Reinhard F, Zhang CC, Shipitsin M, et al: The
epithelial-mesenchymal transition generates cells with properties
of stem cells. Cell. 133:704–715. 2008. View Article : Google Scholar : PubMed/NCBI
|
|
21
|
Lindsey S and Langhans SA: Cross talk of
oncogenic signaling pathways during epithelial-mesenchymal
transition. Front Oncol. 4:3582014. View Article : Google Scholar
|
|
22
|
Kang Y, Siegel PM, Shu W, Drobnjak M,
Kakonen SM, Cordón-Cardo C, Guise TA and Massagué J: A multigenic
program mediating breast cancer metastasis to bone. Cancer Cell.
3:537–549. 2003. View Article : Google Scholar : PubMed/NCBI
|
|
23
|
Sánchez-Elsner T, Botella LM, Velasco B,
Corbí A, Attisano L and Bernabéu C: Synergistic cooperation between
hypoxia and transforming growth factor-beta pathways on human
vascular endothelial growth factor gene expression. J Biol Chem.
276:38527–38535. 2001. View Article : Google Scholar : PubMed/NCBI
|
|
24
|
Ling G, Wang S, Song Z, Sun X, Liu Y,
Jiang X, Cai Y, Du M and Ke Y: Transforming growth factor-β is
required for vasculogenic mimicry formation in glioma cell line
U251MG. Cancer Biol Ther. 12:978–988. 2011. View Article : Google Scholar : PubMed/NCBI
|
|
25
|
Seftor RE, Seftor EA, Koshikawa N, Meltzer
PS, Gardner LM, Bilban M, Stetler-Stevenson WG, Quaranta V and
Hendrix MJ: Cooperative interactions of laminin 5 gamma2 chain,
matrix metalloproteinase-2, and membrane
type-1-matrix/metalloproteinase are required for mimicry of
embryonic vasculogenesis by aggressive melanoma. Cancer Res.
61:6322–6327. 2001.PubMed/NCBI
|
|
26
|
Yue WY and Chen ZP: Does vasculogenic
mimicry exist in astrocytoma? J Histochem Cytochem. 53:997–1002.
2005. View Article : Google Scholar : PubMed/NCBI
|
|
27
|
Folberg R, Hendrix MJ and Maniotis AJ:
Vasculogenic mimicry and tumor angiogenesis. Am J Pathol.
156:361–381. 2000. View Article : Google Scholar : PubMed/NCBI
|
|
28
|
Jain RK: Normalization of tumor
vasculature: An emerging concept in antiangiogenic therapy.
Science. 307:58–62. 2005. View Article : Google Scholar : PubMed/NCBI
|
|
29
|
De Bock K, Cauwenberghs S and Carmeliet P:
Vessel abnormalization: Another hallmark of cancer? Molecular
mechanisms and therapeutic implications. Curr Opin Genet Dev.
21:73–79. 2011. View Article : Google Scholar
|
|
30
|
Dieterich LC, Mellberg S, Langenkamp E,
Zhang L, Zieba A, Salomäki H, Teichert M, Huang H, Edqvist PH,
Kraus T, et al: Transcriptional profiling of human glioblastoma
vessels indicates a key role of VEGF-A and TGFβ2 in vascular
abnormalization. J Pathol. 228:378–390. 2012. View Article : Google Scholar : PubMed/NCBI
|
|
31
|
Lamouille S, Xu J and Derynck R: Molecular
mechanisms of epithelial-mesenchymal transition. Nat Rev Mol Cell
Biol. 15:178–196. 2014. View
Article : Google Scholar : PubMed/NCBI
|
|
32
|
Song J: EMT or apoptosis: A decision for
TGF-beta. Cell Res. 17:289–290. 2007. View Article : Google Scholar : PubMed/NCBI
|
|
33
|
Morrison CD, Parvani JG and Schiemann WP:
The relevance of the TGF-β paradox to EMT-MET programs. Cancer
Lett. 341:30–40. 2013. View Article : Google Scholar : PubMed/NCBI
|
|
34
|
Willis BC and Borok Z: TGF-β-induced EMT:
Mechanisms and implications for fibrotic lung disease. Am J Physiol
Lung Cell Mol Physiol. 293:L525–L534. 2007. View Article : Google Scholar : PubMed/NCBI
|
|
35
|
Wendt MK, Tian M and Schiemann WP:
Deconstructing the mechanisms and consequences of TGF-β-induced EMT
during cancer progression. Cell Tissue Res. 347:85–101. 2012.
View Article : Google Scholar
|
|
36
|
Zhao HW, Li YW, Feng R, Yu JB, Li J, Zhang
Y, Li JC and Wang YX: TGF-β/Smad2/3 signal pathway involves in U251
cell proliferation and apoptosis. Gene. 562:76–82. 2015. View Article : Google Scholar : PubMed/NCBI
|
|
37
|
Liu Z, Bandyopadhyay A, Nichols RW, Wang
L, Hinck AP, Wang S and Sun LZ: Blockade of autocrine TGF-β
signaling inhibits stem cell phenotype, survival, and metastasis of
murine breast cancer cells. J Stem Cell Res Ther. 2:1–8. 2012.
View Article : Google Scholar
|
|
38
|
Liu J, Liao S, Diop-Frimpong B, Chen W,
Goel S, Naxerova K, Ancukiewicz M, Boucher Y, Jain RK and Xu L:
TGF-β blockade improves the distribution and efficacy of
therapeutics in breast carcinoma by normalizing the tumor stroma.
Proc Natl Acad Sci USA. 109:16618–16623. 2012. View Article : Google Scholar
|
|
39
|
Lu XS, Sun W, Ge CY, Zhang WZ and Fan YZ:
Contribution of the PI3K/MMPs/Ln-5γ2 and EphA2/FAK/Paxillin
signaling pathways to tumor growth and vasculogenic mimicry of
gall-bladder carcinomas. Int J Oncol. 42:2103–2115. 2013.PubMed/NCBI
|
|
40
|
Chen HH, Zhou XL, Shi YL and Yang J: Roles
of p38 MAPK and JNK in TGF-β1-induced human alveolar epithelial to
mesenchymal transition. Arch Med Res. 44:93–98. 2013. View Article : Google Scholar : PubMed/NCBI
|
|
41
|
Milone MR, Pucci B, Bruzzese F, Carbone C,
Piro G, Costantini S, Capone F, Leone A, Di Gennaro E, Caraglia M,
et al: Acquired resistance to zoledronic acid and the parallel
acquisition of an aggressive phenotype are mediated by p38-MAP
kinase activation in prostate cancer cells. Cell Death Dis.
4:e6412013. View Article : Google Scholar : PubMed/NCBI
|
|
42
|
Yi Y, Kim HJ, Mi P, Zheng M, Takemoto H,
Toh K, Kim BS, Hayashi K, Naito M, Matsumoto Y, et al: Targeted
systemic delivery of siRNA to cervical cancer model using cyclic
RGD-installed unimer polyion complex-assembled gold nanoparticles.
J Control Release. Aug 30–2016.pii: S0168-3659(16)30626-5.
View Article : Google Scholar : PubMed/NCBI
|
|
43
|
Basha G, Ordobadi M, Scott WR, Cottle A,
Liu Y, Wang H and Cullis PR: Lipid nanoparticle delivery of siRNA
to osteocytes leads to effective silencing of SOST and inhibition
of sclerostin in vivo. Mol Ther Nucleic Acids. 5:e3632016.
View Article : Google Scholar : PubMed/NCBI
|