Introduction
The increase in the incidence of various types of
cancers associated with dismal prognoses, such as gliomas (1) and melanomas (2) has not been paralleled by improved
therapeutic options. A large proportion of these cancer patients
fail to respond to conventional chemotherapy because of the
intrinsic resistance of their cancer to pro-apoptotic stimuli
and/or the acquisition of multidrug (MDR) phenotype during chronic
chemotherapy (1,2). To improve the arsenal of
chemotherapeutics we have looked to natural products which can
provide a rich source of novel compounds with wide structural and
functional diversity, biochemical specificity and desirable
molecular properties (3).
Consequently, in the present study we have further investigated the
compound ophiobolin A (OphA) which has been shown to exhibit growth
inhibitory activity in vitro in A549 non-small cell lung
cancer (4), SKMEL28 melanoma
(4), Hs683 and U373 glioma
(5–7), RD rhabdomyosarcoma (8) and OVCAR3 ovarian cancer (9) cell lines. OphA also displays in
vivo anticancer activity in the murine B16F10 melanoma
(6) and in a human glioma
(10) models.
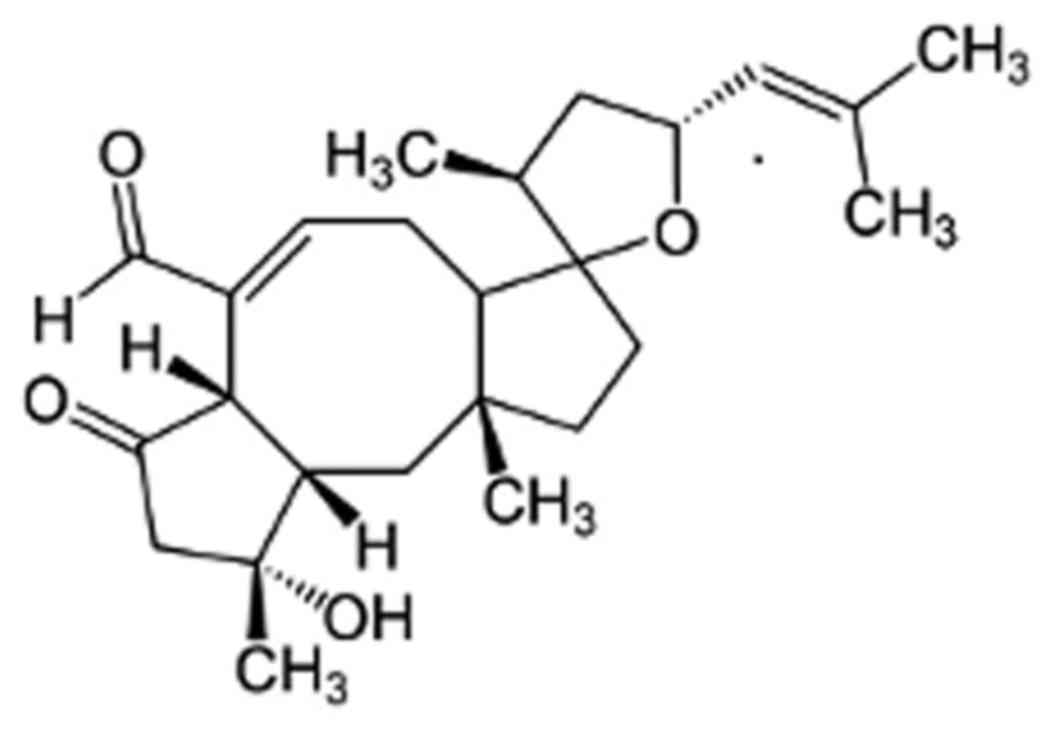
OphA is a phytotoxin produced by the fungal pathogen
Drechslera gigantea and other Bipolaris spp (11,12).
The sesterterpene-type compound (C25) is one of a group of over 25
Ophiobolin analogues (13), which
are characterized by the unique 5-8-5 carbotricyclic skeleton
(Fig. 1).
Historically, much research has focussed on the
effects of OphA on plant tissues, which includes rapid
disorganization of the cell membrane resulting in electrolyte and
sugar leakage and inhibition of calmodulin-activated cyclic
nucleotide phosphodiesterase. The phytotoxin is also known to bind
and irreversibly antagonize calmodulin and blocks the activation of
calmodulin-dependent phosphodiesterase with an IC50
value of 9 µM (14) by
binding covalently to conserved lysine residues (13,15).
However, while the mode of action has been well studied in plants,
the interaction of OphA with mammalian cells is not well
understood. We have observed that when tested on eight cancer cell
lines, concentrations <1 µM OphA inhibited growth by 50%
after 3 days of culture irrespective of their multidrug resistance
(MDR) phenotypes and their resistance levels to pro-apoptotic
stimuli (6). It is, thus, unlikely
that ophiobolin A exerts these in vitro growth-inhibitory
effects in cancer cells through the sole activation of
pro-apoptotic processes. We have also shown that OphA induces
paraptosis-like cell death in glioblastoma multiforme (GBM) cells,
with concomitant vacuolization that may occur from the swelling and
fusion of mitochondria and/or endoplasmic reticulum, without the
activation of caspases (7). Other
studies have shown that in mouse leukaemia cells (16) cell death proceeds via an apoptotic
mechanism, and also in a rhabdomyosarcoma cell line (RD) with
microvesicle release (8).
Since OphA targets calmodulin (CaM) in plant cells,
a similar mechanism could operate in mammalian cells. It is known
that tumour cells have anomalous concentrations of CaM and other
calcium binding proteins; and this can modify the ways in which
calcium is mobilized, with important implications for tumour
development and progression (17,18).
Increases in intracellular Ca2+ trigger the formation of
a Ca2+/CaM complex, as monitored in intact cells,
followed by modulation of the functionality of the target proteins
(19,20). The transient increase in the
concentration of free Ca2+ in the cytosol and its spread
to the nucleus upon cell activation by a broad range of stimuli
including mitogenic factors and other agonists is recognized as the
principal event responsible for the initiation of many signal
transduction processes (21).
Cell death can be triggered by a range of
intracellular stresses including cytosolic Ca2+
overload, DNA damage, oxidative stress and the accumulation of
misfolded proteins (22). We have
therefore investigated the effect of OphA to induce these stresses
and how they affect the mitochondria and endoplasmic reticulum. A
systematic study of the effects on cell organelles was used to
investigate the modes of OphA-induced cell death in tumour cell
lines of differing histological origin.
Materials and methods
Ophiobolin A preparation
Ophiobolin A (OphA) was obtained as white crystals
from Drechslera gigantea culture filtrates according to the
procedure previously reported (11). The purity of OphA was determined by
RP-HPLC-UV to be >95%. Stock OphA solutions were prepared by
dissolving OphA in ethanol (Sigma-Aldrich) at a concentration of
2500 µM and further dilutions were carried out in
phosphate-buffered saline (PBS; Sigma-Aldrich).
Cell culture
The biological effect of OphA was tested in
vitro on 8 cancer cell lines obtained from the American Type
Culture Collection (ATCC; Manassas, VA, USA). These 8 cell lines
include the RD (ATCC code CCL-136) and RH30 (ATCC code CRL-7763)
rhabdomyosarcoma, the MCF 7 (ATCC code HTB-22) and MDA-MB-231 (ATCC
code HTB-26) breast cancer, the HeLa (ATCC code CCL-2) cervix
cancer, the KB 3-1 (ACC code 158) epidermoid cancer, the U-87 MG
glioma (ATCC code HTB-14) and the U2OS osteosarcoma (ATCC code
HTB-96) models. Cells were grown in growth medium (Dulbecco's
modified Eagle's medium (DMEM; Sigma-Aldrich) supplemented with 10%
fetal calf serum (FCS; Sigma-Aldrich), 2 mM L-glutamine
(Sigma-Aldrich), 100 U/ml penicillin (Sigma-Aldrich) and 0.1 mg/ml
streptomycin (Sigma-Aldrich) and incubated at 37°C in a 5%
CO2 atmosphere. Cells were passaged every three to four
days.
Crystal violet cell viability
staining
Cells were seeded in 96-well plates at
1×10⁴ cells/well in growth media and left overnight in
the incubator for the cells to adhere. The following day cells were
treated for 24 h with 0–100 µM OphA. After treatment, the
media on the cells was removed and the cells were washed in PBS
twice. Cells were fixed in 100 µl of 1% (v/v) glutaraldehyde
(aq; Sigma-Aldrich) for 30 min and stained with 100 µl of
0.5% (w/v) crystal violet solution (aq; Sigma-Aldrich) for at least
1 h. The plate was washed with water, dried overnight and cells
were solubilized using 150 µl of solubilising solution [1%
(w/v) sodium dodecyl sulphate (SDS; Fisher Fisher Scientific) and
10% (v/v) acetic acid (Sigma-Aldrich)]. The absorbance of the
solution was measured at 590 nm using a Tecan Infinite F200
microplate reader. Samples were blank corrected and expressed as a
percentage of the control cell viability. Experiments were
performed in triplicate and repeated on three separate
occasions.
Staining of cell mitochondria using
MitoTracker® Green and tetramethylrhodamine
Cells were seeded in 24-well plates at
8×10⁴ cells/well in growth media and left overnight in
the incubator for the cells to adhere. The following day cells were
pre-stained with 200 nM MitoTracker® Green (Invitrogen),
50 nM tetramethylrhodamine methyl ester (TMRM; Invitrogen) and 10
nM Hoechst for 30 min. After staining was confirmed cells were
washed in fresh media and treated for 1 h with either i) PBS; ii) 1
µM OphA; or iii) 10 µM OphA in triplicate. The cells
were imaged with a Motic AE31 microscope equipped with a mercury
lamp and filters for DAPI (Ex. 345 nm, Ex. 455 nm), TRITC (Ex. 547
nm, Em. 572 nm) and FITC (Ex. 495 nm, Em. 519 nm). Experiments were
performed in triplicate and repeated on at least two separate
occasions.
Staining of reactive oxygen species in
the cells using 2′,7′-dichlorodihydrofluorescein diacetate
(CM-H2DCFDA)
Cells were seeded in 24-well plates at
8×10⁴ cells/well in growth media and left overnight in
the incubator for the cells to adhere. The following day cells were
pre-stained with 1 µM CM-H2DCFDA (Invitrogen) for
45 min. After staining was confirmed, cells were washed in fresh
media and treated for 1 h with either: i) PBS; ii) 1 µM
OphA; or iii) 10 µM OphA in triplicate. Cells were imaged
using a Motic AE31 microscope with filters for FITC. Experiments
were performed in triplicate and repeated on at least two separate
occasions.
Cellular calcium concentration
Cells were seeded in 96-well plates at
1×10⁴ cells/well in growth media and left overnight in
the incubator for the cells to adhere. The following day cells were
washed in PBS and then pre-stained with 2 µM Fluo4
(Invitrogen) in PBS for 1 h. After staining was confirmed cells
were washed in PBS twice and then the following treatments were
applied: i) PBS; ii) 1 µM OphA; and iii) 10 µM OphA.
The change in Fluo4 fluorescence over 6 h, at 5-min intervals, was
measured using a Tecan Infinite F200 series microplate reader
equipped with filters for FITC (Ex. 495 nm, Em. 519 nm). Samples
were blank corrected and the maximum slope of the linear region of
each curve was calculated. Experiments were performed in triplicate
on two separate occasions.
Flow cytometry
For all flow cytometric experiments, cells were
seeded in either 12- or 24-well plates at 15×104 or
8×10⁴ cells/well respectively in growth media and left
overnight in the incubator for the cells to adhere. Cells were
treated with OphA and samples were prepared by collecting the
supernatant containing the non-adherent cells while the adherent
cells were washed and trypsinized (Trypsin-EDTA; Sigma-Aldrich) and
then combined with the first supernatant. The combined cells were
then centrifuged and washed in PBS or Annexin V binding buffer
twice, before being resuspended in 50 µl of PBS or Annexin V
binding buffer. Cells were stained with dyes of interest.
Subsequently, 200 µl of PBS or Annexin V binding buffer was
added to the cells and then at least 10,000 cells from the samples
were analysed using a BD FACSCalibur flow cytometer. Flowing
software version 2 (www.flowingsoftware.com) was used to visualise the
cell data as dot and histogram plots and subsequently to analyse
the data. Experiments were performed in triplicate and repeated on
at least two separate occasions.
Cell size
Cells were treated for 24 h with either: i) PBS; ii)
1 µM OphA; iii) 10 µM OphA; or iv) 100 µM in
triplicate. The change in cell size was investigated by monitoring
the change in median forward scatter (FSC) signal intensity.
Forward-scattered light is proportional to cell-surface area or
size, and is a measurement of mostly diffracted light which is
independent of fluorescence.
Quantification of mitochondrial membrane
potential using TMRM
Cells were treated for 1 h with either: i) PBS; ii)
1 µM OphA; or iii) 10 µM OphA in triplicate. Cells
were stained with 500 nM MitoTracker® Green and 50 nM
TMRM for 30 min at room temperature. The change in mitochondrial
membrane potential was investigated by monitoring the change in
median TMRM fluorescence intensity.
Quantification of reactive oxygen species
in the cells using CM-H2DCFDA
Cells were treated for 1 h with either; i) PBS; ii)
1 µM OphA; or iii) 10 µM OphA, in triplicate. Cell
were stained with 1 µM CM-H2DCFDA and 120 mM PI
for 45 min at room temperature. PI stains cells with a permeable
membrane. The reactive oxygen species production was investigated
by monitoring the change in median CM-H2DCFDA
fluorescence intensity of the live cells (PI negative).
Quantification of phosphatidylserine
translocation to the outer membrane
Annexin V binds PS and can be used as a probe for
cell death via an apoptotic pathway. Combination of Annexin V and
PI (which stains the DNA of cells with a permeable membrane, i.e.
necrotic cells) can determine early apoptotic cells which are
Annexin V positive and PI negative (AV+/PI−).
Late apoptotic cells are AV+/PI+ and necrotic
cells are AV−/PI+. Cells were treated for 24
h with either; i) PBS; ii) 1 µM OphA; iii) 10 µM
OphA; or iv) 100 µM in triplicate. Cells were dyed with 2.5
µl of APC-Annexin V (BioLegend, San Diego, CA, USA) to probe
phosphatidylserine translocation onto the outer membrane, and 150
mM PI. The number of cells which showed positive APC Annexin V
(AV+) staining with negative PI (PI−)
staining and those with an AV+/PI+ and
AV−/PI+, pattern were recorded. The
AV+/PI− cells are in early apoptosis, while
AV+/PI+ cells are in late apoptosis.
AV−/PI+ cells are necrotic.
Automated high throughput image
acquisition and analysis
Cells were seeded in 96-well plates at
7.5×10³ cells/well in growth media and left overnight in
the incubator for the cells to adhere. The following day cells were
treated for 24 h with either: i) PBS or ii) 1 µM OphA, in
triplicate. Cells were then washed in PBS, fixed in 4%
paraformaldehyde (PFA) for 15 min, washed again in PBS and left in
PBS until staining. The endoplasmic reticulum (ER) was stained with
calnexin (Santa Cruz Biotechnology), the mitochondria with TOM20
(Santa Cruz Biotechnology) and the nucleus with DAPI. Alexa Fluor
secondary antibodies were used to stain the ER green (Alexa Fluor
488; Life Technologies) and the mitochondria red (Alexa Fluor 488;
Life Technologies). Staining was performed within seven days of
fixing.
Image acquisition was performed using an automated
imaging platform IN Cell Analyzer 1000 (GE Healthcare Life
Sciences) equipped with a Nikon Fluor ELWD 40 × 0.6 objective. Six
fields of view were taken from each well in all three fluorescence
modes (FITC, TRITC and DAPI). Raw images were processed and
parameters obtained using a customised protocol in the IN Cell
Developer Toolbox software (GE Healthcare Life Sciences). Cells
were segmented using DAPI (cell nuclei) and properties of the
endoplasmic reticulum and mitochondria were obtained. The total
area of the endoplasmic reticulum and the mitochondria and the
mitochondrial size and branching network were investigated.
Experiments were performed in triplicate and repeated on at least
two separate occasions.
Immunoblotting
Cells were seeded in T25 flasks at 75×104
cells/flask in growth media and cells were allowed to adhere to the
flask overnight in the incubator. The following day cells were
treated for 24 h with either: i) PBS; or ii) 1 µM OphA. Cell
lysates were prepared using 200 µl of cOmplete Lysis-M kit
supplemented with protease and phosphatase inhibitors (Roche
Diagnostics) and scraping the cells from the bottom of the flasks.
Cell lysates were centrifuged to separate cell debris, and the
protein concentration of the supernatant was determined using the
BCA assay (Pierce). Protein (10 µg per sample) was mixed
with loading buffer, boiled for 4 min and subjected to SDS-PAGE at
120 V followed by a transfer to PVDF membrane for 50 min at 30 V.
Membranes were blocked with 5% milk in TBST for 1 h at room
temperature and subsequently probed with BiP/GRP78 (1:1,000), PDI
(1:1,000), CHOP (1:1,000), cleaved PARP (1:1,000) or β-actin
(1:100,000) as a primary antibody overnight at 4°C. Horseradish
peroxidase-conjugate secondary antibodies were used and blots were
revealed by ECL. Experiments were performed on two separate
occasions.
Statistical analysis
The cell viability data and flow cytometric data are
presented as mean ± standard deviation (SD) of triplicate samples.
The high throughput image acquisition and analysis data are
presented as mean ± standard error of the mean (SE) of each cell
measured due to the high, >432, number of cells per sample
imaged. Statistical analysis was performed by a two tailed Students
t-test in Excel. P<0.05 was taken as the criteria for
statistical significance.
Results
Determination of the lethal dose
(LD50) after 24 h of cell culture
A number of cell lines from differing tissues of
origin were used to investigate the effects of OphA. We have used
the breast cancer cell lines MCF 7 and MDA-MB-231 which differ in
their metastatic potential; MCF 7 is non-invasive while MDA-MB-231
is an invasive breast cancer (23). The sarcoma cell lines used were the
osteosarcoma line U2OS and the rhabdomyosarcoma lines RD and RH30.
The latter are representative of the two major histological
subtypes, eRMS and the more metastatic aRMS (24). The cervical cancer cell line HeLa
and the derived cell line KB 3-1 were also investigated. The
cervical cell lines differ in the expression of the folate receptor
(FR) with HeLa being FR (+), whilst KB 3-1 overexpresses FR (++)
(25). U-87 MG was also
investigated as an example of glioblastoma, being the most common
primary malignant brain tumour. The mutations found in the
cancerous cells lines are shown in Table I.
 | Table ISummary of the mutations found in the
cell lines used in the present study. |
Table I
Summary of the mutations found in the
cell lines used in the present study.
| Cell line | Tissue type | Mutation | Ref. |
|---|
| RD | Muscle | NRAS, TP53 | (26) |
| RH30 | Muscle | TP53 | (27) |
| MDA-MB-231 | Breast | CDKN2A, KRAS,
TP53 | (26) |
| MCF 7 | Breast | CDKN2A, PIK3CA,
caspase-3 | (26,28) |
| HeLa | Cervix | Mutations in cell
cycling and DNA repair signalling pathways | (29) |
| KB 3-1 | HeLa
contaminant | Likely to be
similar to HeLa | |
| U2OS | Bone | Wild-type
TP53A | (30) |
| U-87 MG | Brain | CDKN2A, PTEN | (26) |
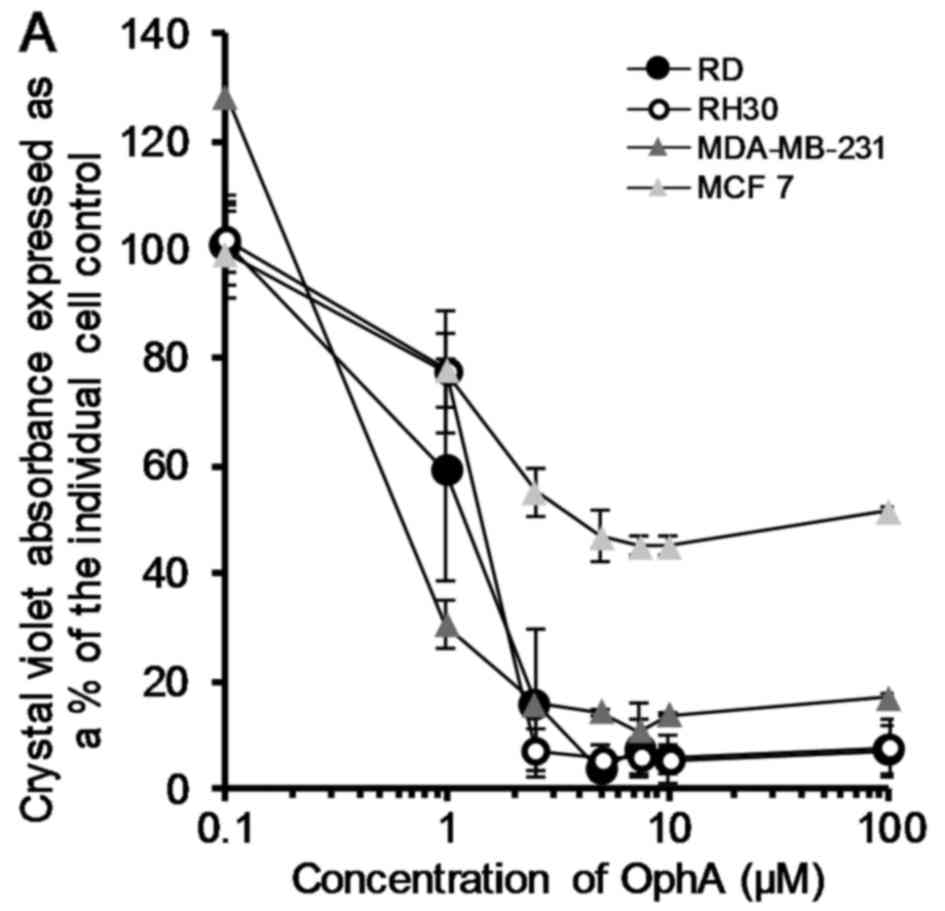
OphA was assessed in terms of its ability to effect
cell death in all eight cell lines using the crystal violet test.
Data was plotted and fitted to logarithmic curves (except HeLa
which showed a sigmoidal fit) and the LD50 calculated
from the trendline equation. The LD50 values ranged from
0.5 to 5.8 µM for MDA-MB-231 and HeLa cells, respectively
(Fig. 2).
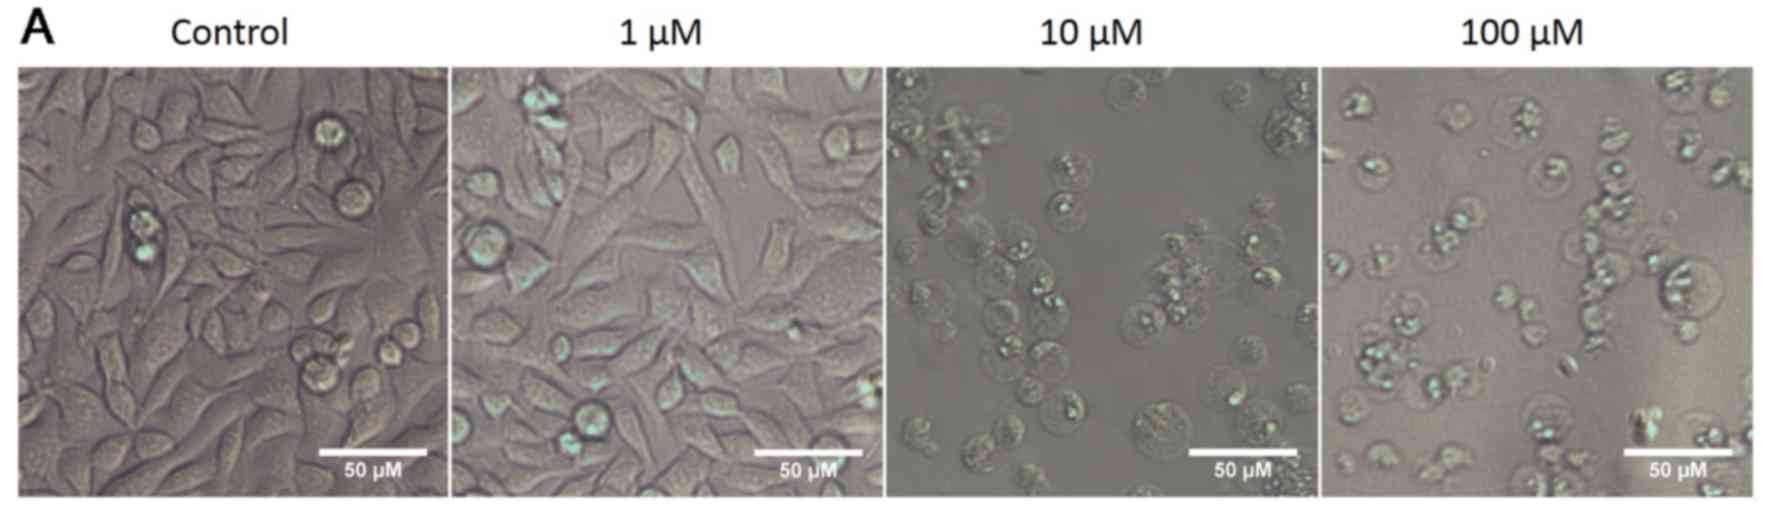
OphA affects cancer cell size
In all the cell lines tested OphA caused the cells
to round up and become more spherical. Representative bright field
images of RH30 rhabdomyosarcoma cells treated with 1–100 µM
OphA are provided as an example in Fig. 3A.
Cells are known to change size during cell death:
for example, cells are known to shrink during apoptosis while they
are known to swell during necrosis (31). Changes in cell size, after 24 h
treatment with OphA, were monitored using the FSC channel on the
flow cytometer. The data are shown as the median cell size and
expressed as the change in size compared to the same cell line
without OphA. After 24 h of OphA treatment either cell shrinkage,
cell swelling or no change in cell size was observed depending on
the cell line treated (Fig. 3B).
There was little difference in the size of the cells after 24 h
treatment at the lower concentration. However, treatment with 10
µM OphA showed a highly statistically significant decrease
in size for RD, RH30, MDA-MB-231 and MCF cells. There was a
significant increase in size for HeLa cells and U2OS cells.
Treatment with the lower concentration of 1 µM OphA for 24 h
resulted in little significant change in cell size for any of the
cell lines tested (Fig. 3B).
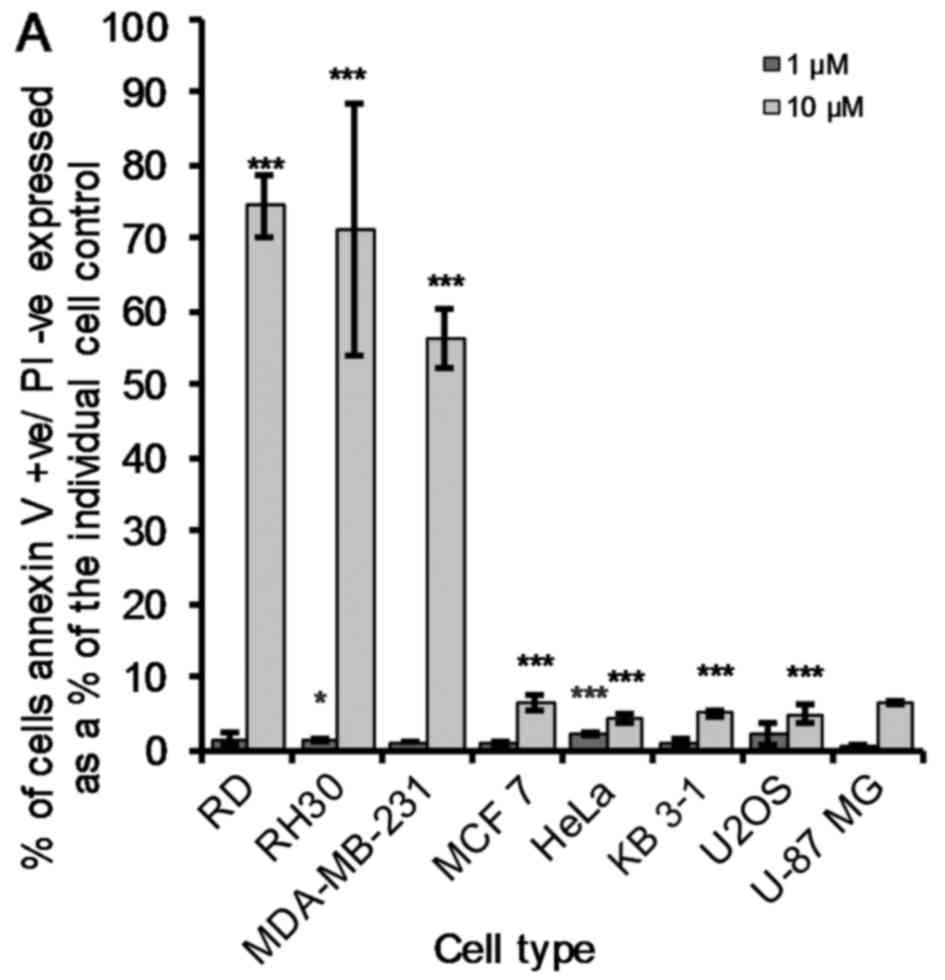
Pro-apoptotic vs. necrotic effects
induced by OphA in cancer cells
Phosphatidylserine (PS) is an important phospholipid
membrane component. The PS is held facing the cytosolic (inner)
cell membrane by the enzyme flippase. When a cell undergoes
apoptosis it is no longer restricted to the cytosolic domain and is
free to flip to the extracellular surface. As such, flow cytometry
was used to quantify these AV+/PI−,
AV+/PI+ and AV−/PI+
cancer cells after 24 h of OphA tre atment. OphA-induced early
apoptotic effects (10 µM) were the most pronounced
(P<0.005) in RD, RH30 and MDA-MB-231 cells (Fig. 4A). The remaining five cancer cell
lines showed a much smaller but still significant increase in the
percentage of early apoptotic cells (AV+/PI−)
compared to the untreated cells (Fig.
4A). The LD50 values of all the cancer cell lines
under study are <5 µM (Fig.
2). Fig. 4A shows that 10
µM OphA induces <20% of early apoptosis in these five
remaining cancer cell lines (MCF 7, HeLa, KB 3-1, U2OS and U-87
MG). OphA (10 µM) induced late apoptosis
(AV+/PI+) in all cell lines under study, but
as previously seen (early apoptotic effects; Fig. 4A) the effect was less marked in KB
3-1, U2OS and U-87 MG cancer cells (Fig. 4B). It was clear, however, that the
KB 3-1, U2OS and U-87 MG cancer cells were the most sensitive to
OphA-induced necrotic (AV−/PI+) effects
(Fig. 4C).
Of note, three of the most sensitive cancer cell
lines in terms of OphA-induced decrease in cell size, i.e. RD, RH30
and MDA-MB-231 (Fig. 3B) were also
the most sensitive to the OphA-induced early apoptotic effects
(Fig. 4A). In the same manner of
the four cancer cells lines in which OphA did not induce a decrease
in terms of cell size (HeLa, KB 3-1, U2OS and U-87 MG; Fig. 3B), three appeared actually very
sensitive to OphA-induced necrotic effects (Fig. 4C). It thus seems that OphA-induced
modifications in cancer cell size is somewhat paralleled with
OphA-induced early and/or late apoptosis vs. necrosis.
Poly(ADP-ribose) polymerase (PARP) is inactivated in
apoptosis due to cleavage caused by the caspase signalling pathway.
Therefore, cleaved PARP expression levels after 24 h of 1 µM
OphA treatment were investigated using western blot analyses in the
eight cancer cell lines under study. RD and RH30 rhabdomyosarcoma
cells showed an extremely large increase in cleaved PARP expression
after treatment with OphA, while such an increase was not apparent
in the remaining six cancer cell lines (Fig. 4D).
Taken together, the data illustrated in Figs. 2Figure 3–4 strongly suggest that OphA-induced
growth inhibition of various cancer cell lines (Fig. 2) in vitro may arise through
diverse cell death mechanisms.
Mitochondria sensitivity to OphA in
cancer cells
Mitochondrial size and branching
network
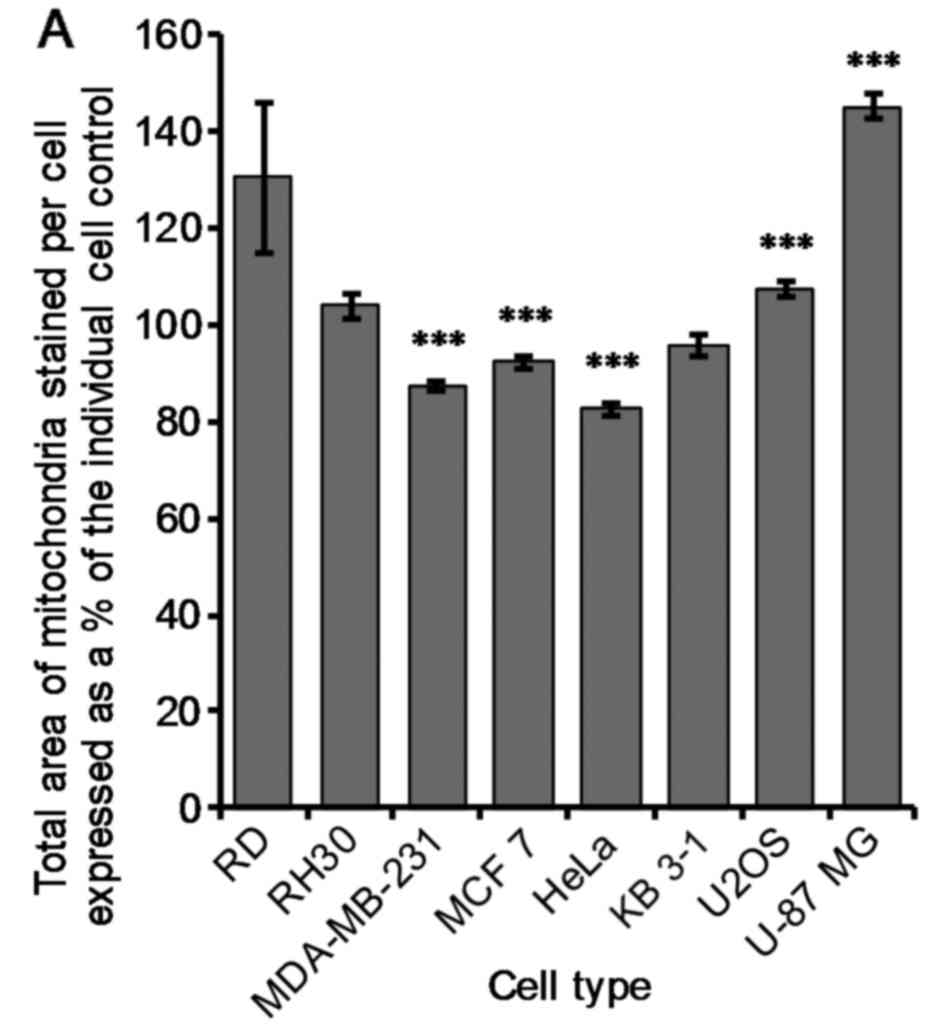
Mitochondria are known to be implicated in cell
death, and we therefore studied the effect of OphA on mitochondrial
area, size and branching network. To examine this we used an IN
Cell™ high throughput microscopy system to detect mitochondria
stained with TOM20. There was a very significant (P≤0.005) decrease
of 13±1, 8±1 and 17±1% in mitochondrial area per cell compared to
the control for MDA-MB-231, MCF 7 and HeLa cells when treated with
1 µM OphA, respectively (Fig.
5A). Conversely, there was a very significant (P≤0.005)
increase in mitochondrial area per cell of 7±2 and 45±3% for U2OS
and U-87 MG cells, respectively, compared to the control (Fig. 5A). There was no significant change
in mitochondrial area per cell for RD, RH30 and KB 3-1 cells
(Fig. 5A).
In all cell lines tested, the mitochondria became
shorter after treatment with OphA as shown by the increase in the
proportion of the mitochondria which are short compared to the
number which were long (data not shown). Lastly, there was a
suggestion that there was an increase in the number of
mitochondrial bifurcations after OphA treatment for MCF 7, HeLa, KB
3-1, U2OS and U-87 MG cells (Fig.
5B). However, higher resolution than provided by the IN Cell™
is required to confirm this.
Altogether these data nevertheless indicate that
mitochondria in cancer cells are sensitive to OphA-induced growth
inhibitory effects, while OphA-induced effects on cancer cell
mitochondria differ from one cancer cell line to another (Fig. 5).
Mitochondrial membrane
depolarization
In addition to the effect of OphA on mitochondrial
morphology, mitochondrial function was also investigated in cancer
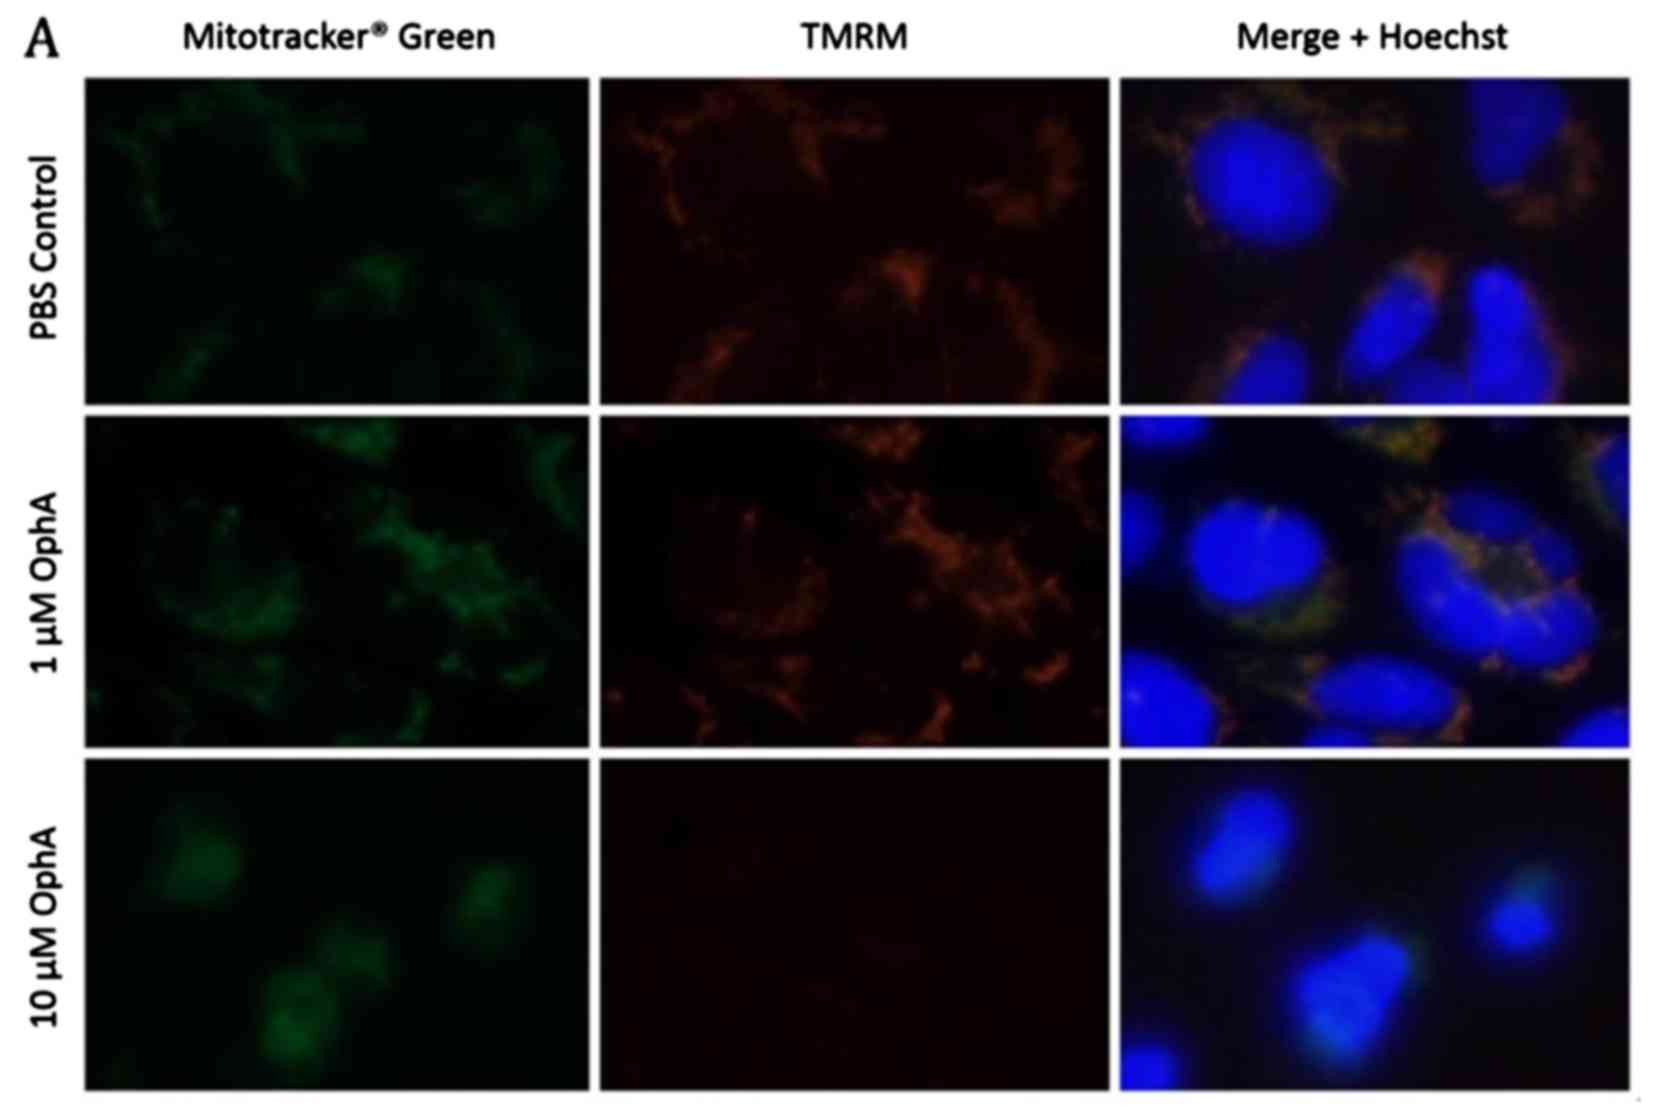
cells treated with OphA. Active mitochondria were stained with
tetramethylrhodamine (TMRM) while all the mitochondria were stained
with MitoTracker® Green (Fig. 6A). Immunofluorescence images of
control RD rhabdomyosarcoma cells show co-localisation of the
MitoTracker Green and the TMRM indicating that all the mitochondria
have been stained and are active (Fig.
6A). After 1 h treatment with 1 µM OphA the TMRM
fluorescence was similar to the control (Fig. 6A). However, after treatment with 10
µM OphA TMRM fluorescence had disappeared showing that the
mitochondria had been deactivated (Fig. 6A). The fluorescence intensity of
the TMRM is related to the mitochondrial membrane potential Δψm,
therefore, we used flow cytometry to quantify the change in Δψm
after 1 h OphA treatment (Fig.
6B). There was a significant increase (P≤0.05) of 40±18 and
22±12% in Δψm after 1 µM treatment in RH30 and U2OS cells,
respectively, compared to the untreated cells indicating
hyperpolarization (Fig. 6B).
However, there was a significant (P≤0.05) decrease of at least
24±10%, in Δψm after 10 µM OphA treatment for all cell lines
except MDA-MB-231 and KB 3-1 cells indicating depolarisation of the
mitochondrial membrane potential (Fig.
6B).
Generation of reactive oxygen species
(ROS)
ROS are constantly produced in cells that metabolize
oxygen. Mitochondria are believed to be the major intracellular
source of ROS and it is estimated that between 0.1 and 4.5% of ROS
escape from the mitochondria into the cytoplasm. This means that
109 ROS may arise in the cytoplasm per cell per day by
this route alone (32). While ROS
are used for cell signalling, excessive production can cause damage
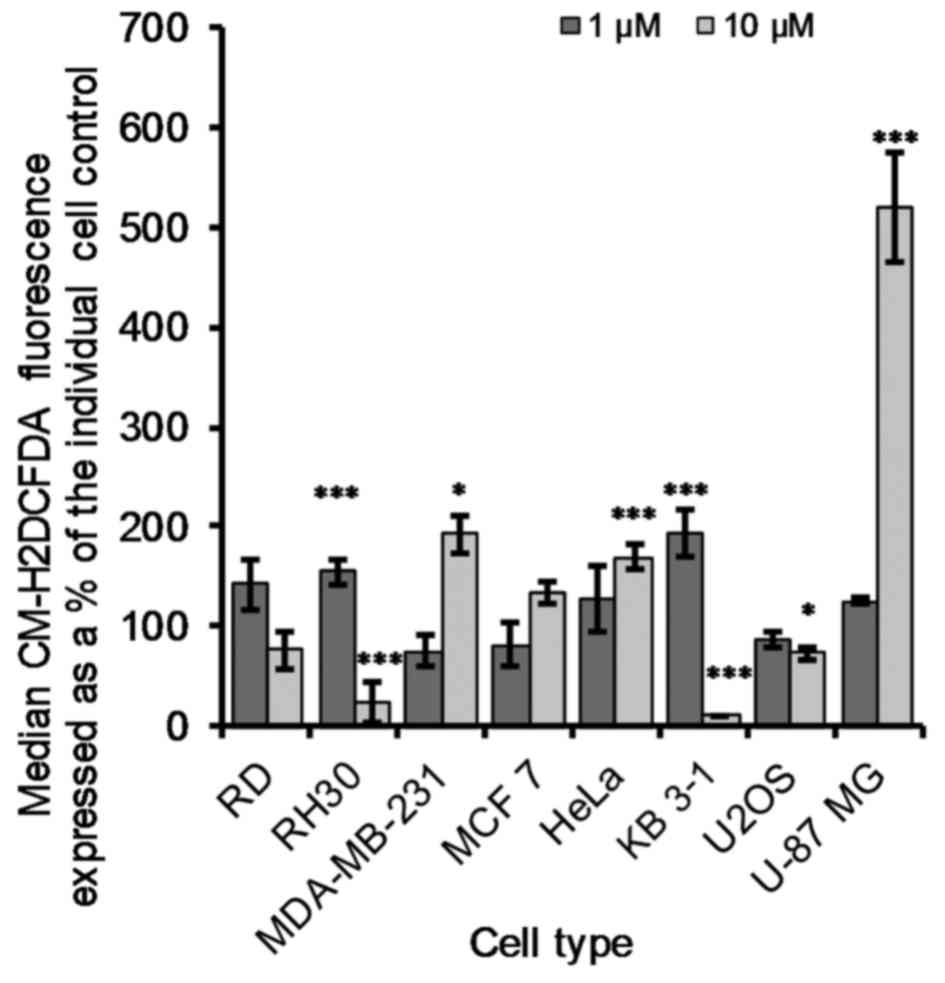
to cell organelles. To determine whether OphA treatment induced
increased ROS, cells were incubated with the drug for 1 h and the
fluorescent dye CM-H2DCFDA used to quantify ROS.
Immunofluorescence images of cells which were healthy and adherent
to the bottom of the plate showed no CM-H2DCFDA
fluorescence while the cells which had rounded up showed high
CM-H2DCFDA fluorescence (data not shown). After
treatment with 1 µM OphA the majority of the cells showed
low CM-H2DCFDA fluorescence while after treatment with
10 µM OphA cells appear rounded up and higher
CM-H2DCFDA fluorescence was observed (Fig. 7). Quantification of the
CM-H2DCFDA fluorescence was performed by flow cytometry
and showed that the basal ROS production varied between cell lines
(data not shown). There was a significant (P≤0.05) decrease of
17±7% in CM-H2DCFDA fluorescence for U2OS cells treated
with 10 µM OphA compared to the control cells (Fig. 7). After 10 µM OphA treatment
in RD, RH30 and KB 3-1 cells there was a decrease in
CM-H2DCFDA fluorescence (Fig. 7), which was due to the majority (at
least 97%) of the cells being dead and the remaining cells had low
CM-H2DCFDA fluorescence. The remaining cells all showed
a significant increase in ROS production at either 1 or 10
µM OphA treatment (Fig. 7).
U-87 MG glioma cells showed the largest increase in ROS generation
with an increase of 420±55% after 1 h of 10 µM OphA
treatment compared to the control cells (Fig. 7).
OphA-induced effects on the
endoplasmic reticulum (ER)
Functional and morphological evidence indicates that
mitochondria are in close contact with the ER (33) and that the proximity of the two
organelles may serve to control mitochondrial morphology through
the regulation of calcium levels. It could therefore be instructive
to investigate the effect of OphA on the ER in more detail. In a
similar manner to autophagy, the ER stress response is another
adaptive mechanism to support cell survival in response to
detrimental conditions such as low nutrient levels, hypoxia,
calcium imbalance or the accumulation of misfolded proteins
(34). When the stress conditions
become too long or too severe, the response activates cell death
pathways, as is also seen in autophagy. However, under less severe
conditions, ER stress responses and the UPR, may actually increase
tumour cell survival (34). There
are three main pathways of the ER stress response which are
initiated by three sensor proteins located on the ER membrane: i)
the inositol-requiring transmembrane kinase and endonuclease
(IRE1); ii) activating transcription factor 6 (ATF6); and iii)
protein kinase-like ER kinase (PERK) (31,35).
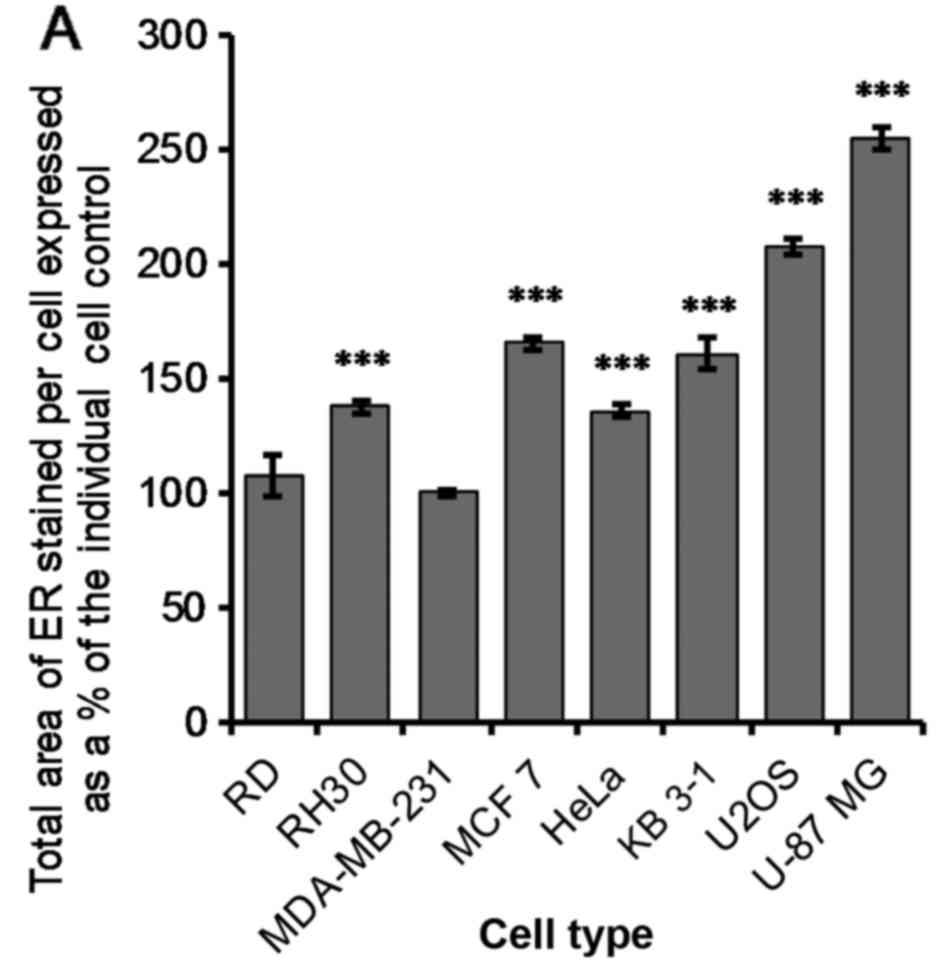
ER swelling
The change in ER total area was measured using an
automated high throughput image acquisition and analysis system (IN
Cell™ Analyzer). The ER was stained with calnexin and the IN Cell
Analyser Toolbox software was used to determine the change in ER
area after 24 h of treatment with 1 µM OphA. There was a
very significant increase (P≤0.005) in the ER area per cell after
treatment for all cell lines except RD and MDA-MB-231 (Fig. 8A).
The ER stress response was probed using
immunoblotting and antibodies for analysing BiP/GRP78, PDI and CHOP
expression, three proteins which are implicated in ER stress
response (34) as detailed in the
Discussion. The current data show that OphA (1 µM): i)
weakly increased BiP/GRP78 expression in RD, RH30, HeLa and U-87 MG
cancer cell lines; ii) markedly increased it in U2OS cancer cells;
iii) remained without clear effects in MDA-MB-231 and MCF 7 cancer
cells; while iv) it decreased BiP/GRP78 expression in KB 3-1 cancer
cells (Fig. 8B).
The current data also show that OphA (1 µM):
i) displayed no apparent effects on PDI expression in RD, RH30,
MDA-MB-231 and U-87 MG cancer cells; ii) increased its expression
in MCF 7, HeLa and U2OS; while iii) it decreased it in KB 3-1
cancer cells (Fig. 8C). Lastly,
the current data show that OphA (1 µM) displayed weak, if
any, effects on CHOP expression in the eight cancer cell lines
under study (Fig. 8D).
Intracellular calcium concentrations
[Ca2+]i
The most important intracellular calcium store in
the cell [Ca2+]i is the ER, and OphA is known to inhibit
the calcium binding protein calmodulin in plant cells (15). We therefore, investigated whether
there was a change in calcium concentrations in the cancer cells
under study after treatment. Cancer cells were pre-stained with a
calcium sensitive dye Fluo-4 AM, OphA treatment was applied and the
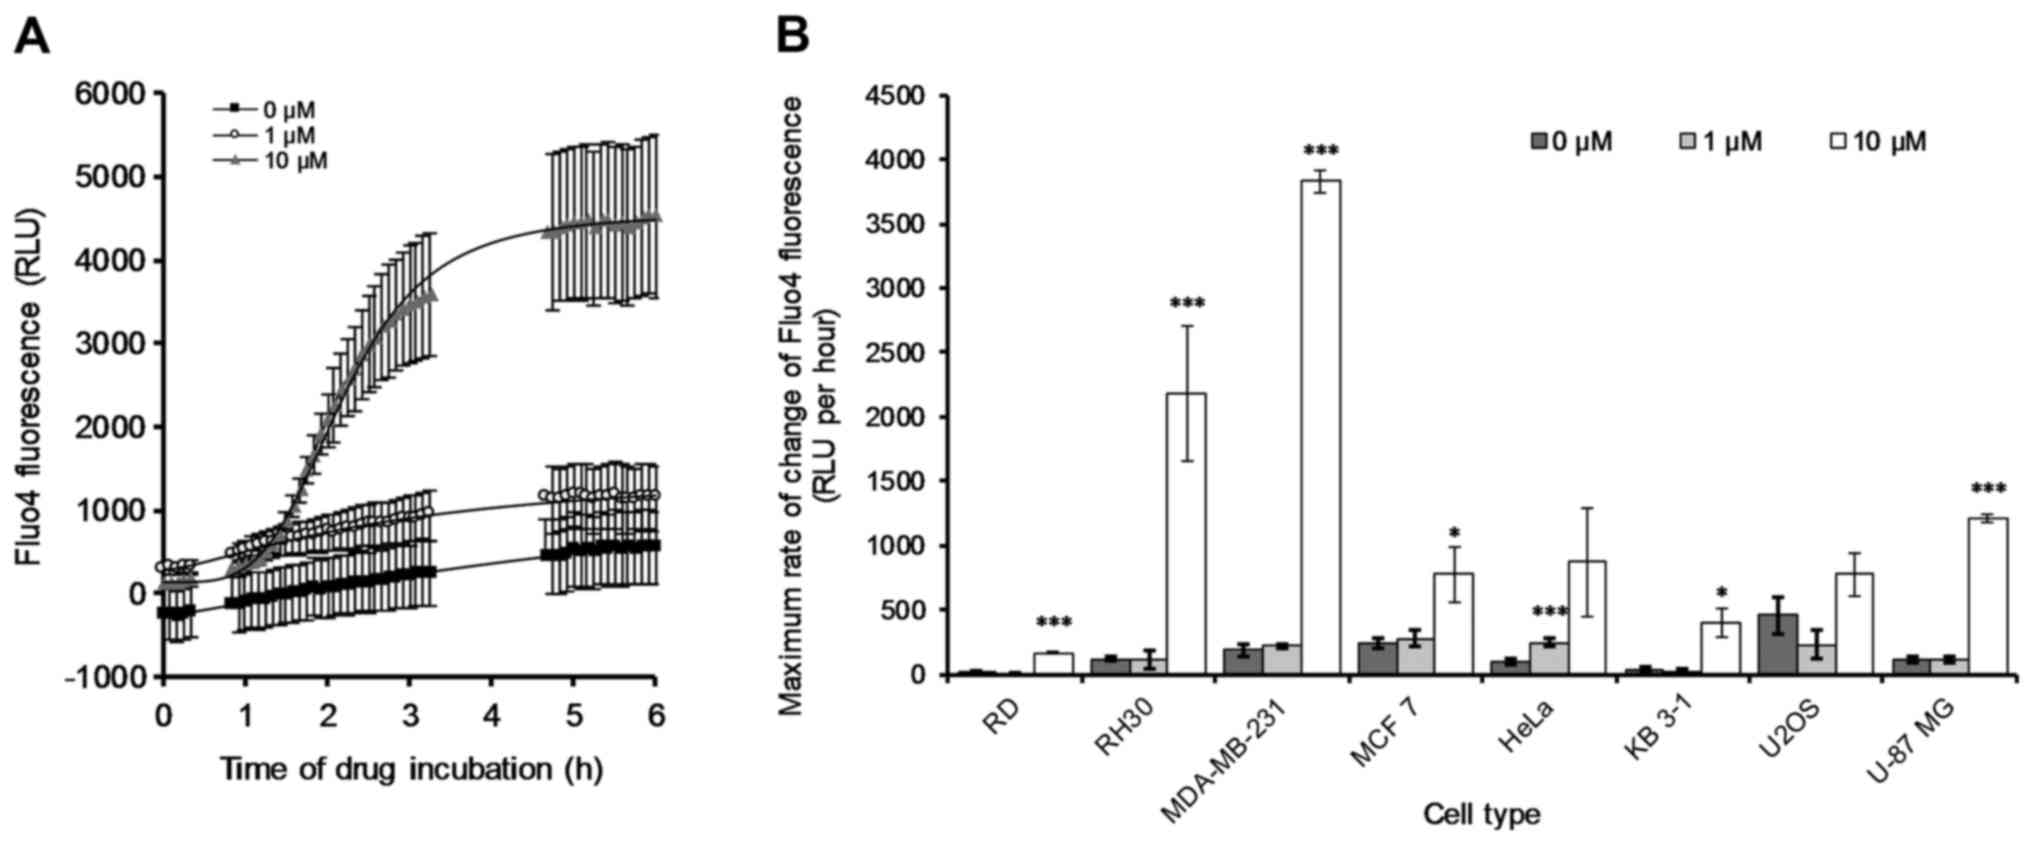
change in Fluo-4 fluorescence was monitored over time. There was an
increase in fluorescence (thus an OphA-induced [Ca2+]i
release) with time for all samples measured. An example of OphA
induced [Ca2+]i for the RH30 rhabdomyosarcoma cell line
is provided for reference (Fig.
9A). The remaining individual [Ca2+]i-related curves
with respect to the other seven cancer cell lines were also
determined (data not shown). The maximum rate of change of the
Fluo4 fluorescence (i.e. [Ca2+]i) was quantified
(Fig. 9B) from the data collected
(Fig. 9A and data not shown).
After 6 h of 10 µM treatment with OphA all the cancer cell
lines showed either an increase or no significant change from the
control (Fig. 9B). In particular,
RH30 and MDA-MB-231 showed very large increases in the rate of
change of [Ca2+]i after incubation with 10 µM
OphA, and RD and U-87 MG also showed significant increases.
Discussion
Cell death can be triggered by a range of
intracellular stresses such as DNA damage, oxidative stress,
cytosolic Ca2+ overload and the accumulation of
misfolded proteins (22). The
ability of OphA to induce cell death on eight human cancer cell
lines was investigated. Subsequently, the effects of OphA on cell,
mitochondrial and ER morphology were studied. Lastly, we
investigated the ability of OphA to modify [Ca2+]i, and
the ER stress/UPR responses in the eight cancer cell lines under
study. A qualitative summary of the data for all eight cell lines
tested is presented in Table
I.
OphA induced cell death (crystal violet assay) with
LD50 (lethal dose) values ranging between submicromolar
and low micromolar concentrations after having cultured the various
cancer cell lines in the absence (control) or the presence of OphA
(Table I). The LD50
values reported here for OphA match closely with the
GI50 (growth inhibitory concentration) data reported by
the National Cancer Institute (NCI, Bethesda, MD, USA) Natural
Product Repository.
Flow cytometric analyses relating to Annexin
V/propidium iodide staining revealed that of the eight cancer cell
lines under study, five of them (RD, RH30, MDA-MB-231, MCF 7 and
HeLa) underwent apoptosis following treatment with 10 µM
OphA, while the remaining three cancer cell lines (KB 3-1, U2OS and
U-87 MG) underwent necrosis (Table
II). Of the five cancer cell lines that underwent apoptosis
following OphA treatment, two of them (the rhabdomyosarcoma lines
RD and RH30) displayed marked PARP cleavage, a feature not observed
in the remaining cancer cell lines (Table II). Therefore, the possibility
remains that OphA can induce caspase-dependent vs.
caspase-independent cell death in those cancer cell lines in which
OphA-induced apoptosis was observed. Thus, while the
LD50-related values of OphA in the eight cancer cell
lines under study were relatively similar (i.e. in the single digit
micromolar concentrations), OphA seems to induce caspase-dependent
or caspase-independent apoptosis or necrosis depending on the
cancer cell line analysed (Table
II).
| Table IIQualitative summary of ophiobolin A
(Oph A)-induced effects at 1 and/or 10 µM in eight human
cancer cell lines. |
Table II
Qualitative summary of ophiobolin A
(Oph A)-induced effects at 1 and/or 10 µM in eight human
cancer cell lines.
| Cancer cell
lines | IC50
growth inhibitory concentration
(µM) | Cell size
(10 µM) | Cell death
| |
|---|
Apoptosis
| Necrosis
(10 µM) | Mitochondria
| Endoplasmic
reticulum
|
|---|
Early
(10 µM) | Late
(10 µM) | PARP
(10 µM) | TAM
(1 µM) | MB
(1 µM) | Δψm
(10 µM) | ROS
(10 µM) | ER
swelling
(1 µM) | BiP/GRP7
(1 µM) | PDI
(1 µM) | CHOP
(1 µM) |
[Ca2+]i
(10 µM) |
|---|
| RD (rhabd.) | 1.3 | --- | +++ | ++ | ++ | + | 0 | 0 | --- | 0 | 0 | + | 0 | 0 | + |
| RH30 (rhabd.) | 1.5 | --- | +++ | ++ | +++ | 0 | 0 | 0 | --- | -- | + | + | 0 | 0 | +++ |
| MDA (breast) | 0.7 | --- | +++ | ++ | 0 | 0 | -- | 0 | 0 | + | 0 | 0 | 0 | 0 | +++ |
| MCF 7 (breast) | 4.0 | --- | + | ++ | 0 | + | -- | +++ | -- | 0 | ++ | 0 | + | 0 | + |
| HeLa (cervix) | 4.5 | ++ | + | +++ | 0 | 0 | -- | ++ | --- | ++ | + | + | ++ | 0 | 0 |
| KB 3-1
(cervix) | 1.4 | 0 | + | + | 0 | ++ | 0 | ++ | 0 | --- | ++ | -- | -- | 0 | + |
| U2OS (osteos.) | 2.8 | ++ | + | + | 0 | +++ | -- | ++ | - | 0 | ++ | +++ | ++ | - | ++ |
| U-87 MG
(glioma) | 3.8 | + | + | + | 0 | ++ | ++ | ++ | --- | +++ | ++ | + | 0 | 0 | ++ |
Cell size monitoring permitted the distinction of
two groups of cancer cell lines, e.g. those cancer cell lines whose
size decreased under OphA treatment and that underwent apoptosis
(early and/or late), including both rhabdomyosarcoma lines (RD and
RH30) and both breast cancer lines (MDA-MB-231 and MCF 7), but not
HeLa models, compared to those cell lines whose size increased
during OphA treatment and that underwent necrosis, including the KB
3-1, U2OS and U-87 MG models (Table
II). It thus seems that an OphA-induced decrease in cell size
is related to OphA-induced apoptosis in cancer cells. Such a
feature has previously been observed with other phytotoxins in
cancer cells including, for example, sphaeropsidin A (SphA) that
induces apoptosis in cancer cells through marked cell volume
decrease (36). The SphA-induced
cell volume decrease in cancer cells occurs via the modulation of
ion-transporter activity with increased selectivity for melanoma
and kidney cancer cell lines in the NCI-60 panel (36). OphA also modulates the activity of
ion channel activity, including the big conductance
Ca2+-activated K+ channel (BKCa), which
results in the activation of paraptosis in apoptosis-resistant
glioblastoma cells (7). These
impairments of the so-called regulatory volume decrease (RVD) could
make SphA (36) and OphA (7) efficient compounds against multidrug
resistant (MDR) cancer cells.
Okada et al (37) emphasized that a fundamental
property of animal cells is the ability to regulate their own cell
volume and that even under hypotonic stress imposed by either
decreased extracellular or increased intracellular osmolarity, the
cells can re-adjust their volume after transient osmotic swelling
by the RVD mechanism. They report that osmotic swelling results in
a significant increase in the [Ca2+]i concentration
(37). Intracellular
[Ca2+]i is strictly regulated in cells by a combination
of the passive diffusion of calcium into the cell and by active
transport of calcium against a concentration gradient (38). An increase in intracellular calcium
levels can be a consequence of release from the ER stores, influx
of extracellular calcium and/or the release from other organelles
such as the mitochondria (39). A
decrease in calcium concentration can be due to calcium being
pumped out of the cell or by re-entering the calcium stores in the
ER and mitochondria through Ca2+ transport systems. The
present study shows that there was a delay of at least 1 h in
calcium being released into the cytosol for all cell lines after
OphA treatment compared to the control cells, indicating that OphA
affects calcium signalling (Fig.
8; other data not shown). Furthermore, some cell lines showed a
huge increase in the amount of cytosolic calcium release after 6 h
of treatment (Fig. 8; other data
not shown). In fact, OphA induced [Ca2+]i increases in
all cancer cell lines (except for the HeLa cervical carcinoma cell
line) (Table I). This point could
be more or less related to the fact that while OphA induced marked
apoptosis in HeLa cells, it increased HeLa cancer cell size without
inducing necrosis (Table II).
Kasim et al (40) observed
that actinomycin D induced apoptosis and apoptotic volume decrease
(AVD) in HeLa cells and that the loss of mitochondrial membrane
potential occurred at about the same time as blebbing. In the
present study, OphA induced a marked loss of mitochondrial membrane
potential in parallel to the observed increase in cell size
paralleled by marked apoptosis induction, while it did not alter
HeLa-related [Ca2+]i (Table II). Thus, the possibility remains
that the kinetics of OphA-induced modifications in all these
biological events differ from those in the remaining seven cancer
cell lines analysed and that we have missed these events due to the
experimental schedules used in the present study.
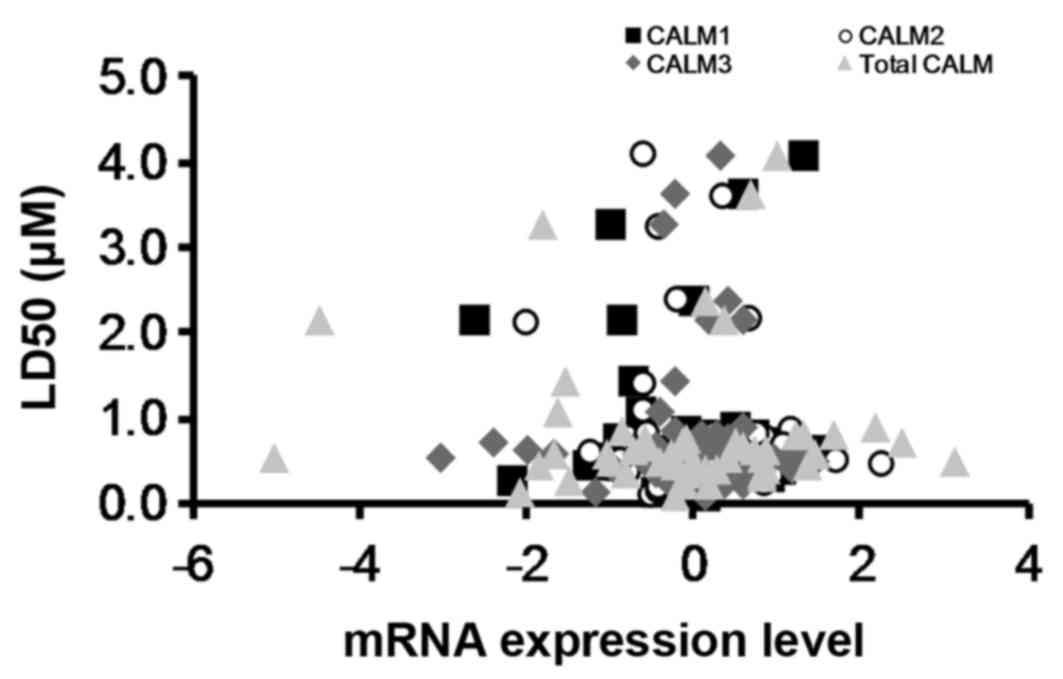
Historically, it was believed that OphA induced
cell death by inhibiting calmodulin (15). However, by obtaining
LD50 values from the National Cancer Institute (NCI)
Natural Products Repository (41)
(Fig. 10) for the NCI cell lines
treated with OphA and comparing these to calmodulin mRNA expression
levels for the same NCI cell lines from CBioPortal (42) it has been shown that there is no
correlation between calmodulin mRNA expression levels and OphA
toxicity (Fig. 10). This suggests
that, although OphA can inhibit calmodulin, it is not the only
molecular target for the molecule. Locato et al (43) reported that ophiobolin A leads to
cell cycle arrest at the S/G2 phases in tobacco plants, but also
shows the involvement of glutathione and associated redox
regulation. It is likely that there are similar mechanisms of
action in animal cells.
ROS can be produced by cells in response to stress
and can cause damage to proteins, lipids and DNA. Excessive
production of ROS results in cell death, for example ROS
facilitates the release of cytochrome c from the
mitochondria in apoptosis (44).
OphA (10 µM) significantly decreased ROS production in RH30
and KB 3-1 cancer cells (although this could be a consequence of
cell number), but showed little effect in RD, MCF 7 and U2OS cancer
cells, while ROS generation increased in MDA-MB-231, HeLa and U-87
MG cancer cells, under the conditions studied. An increase in ROS
production (indicating oxidative stress) does not seem to relate to
the OphA-induced cell death features observed in the present study.
In contrast, OphA reduced Δψm in 6 of the 8 cancer cell lines
analysed, suggesting that the mitochondria are affected by OphA in
most of the cancer cell lines analyzed (although not all); a
feature that was confirmed by the quantitative analyses of
mitochondria branching (Table
I).
A dissipation of the Δψm can occur after
mitochondrial outer membrane permeabilization (MOMP) through the
uncoupling of the mitochondrial respiratory chain or through the
opening of the mitochondrial permeability transition (MPT) pore
(45). MOMP is commonly associated
with apoptosis and the release of toxic proteins into the cytosol.
Opening of the MPT causes the mitochondria to become leaky to water
and other small molecules which results in mitochondrial swelling
eventually leading to necrosis (46). Therefore, while a sustained drop in
Δψm indicates that the cells are dying it does not elucidate the
mechanism of cell death. Bencsik et al (47) also showed that OphA could cause a
decrease in the mitochondrial membrane potential in boar
spermatozoa.
All the data we have previously accumulated
(6–8,10) as
well as in the present study (as qualitatively summarized in
Table II) suggests that OphA
induced major effects in the cancer cell leading either to
apoptosis (8) (Table II), paraptosis (7) or necrosis (Table I) and is related to the origin of
the cancer cell line analysed (with a panel of more than 10 cancer
cell lines analysed in all these studies). However, while OphA
induces distinct types of cell death in the various cancer cell
lines analysed, its LD50 values remain in the single
digit micro-molar in all cell lines analysed here (Table I) as well as in our previous
studies (6–8,10) a
fact that has also been confirmed by the NCI in the 60-cell line
panel (SI-4), and that we have also observed in MDR cancer cells
(6). It was therefore investigated
whether the ER stress response and/or the unfolded protein response
(UPR) could be involved in the OphA-induced cell response.
UPR is a survival mechanism of the cell in response
to ER stress which occurs when there is an accumulation of unfolded
or misfolded proteins in the lumen of the ER (48). Among the major functions of the UPR
are to halt protein translation, degrade misfolded proteins and to
upregulate the production of molecular chaperones involved in
protein folding. Bravo et al (34) also emphasized that the ability to
upregulate the UPR during the ER stress response appears to be
essential for tumour survival. They state that both the ATF6 and
IRE1 pathways induce BiP/GRP78 expression in conditions of ER
stress, that BiP/GRP78 promotes ER homeostasis and resistance to
apoptosis by interacting with BIK and caspase-7, and that the
capacity of IRE1 to sense ER stress depends on its dissociation
from BiP/GRP78. Furthermore, an important part of protein synthesis
is the folding and the proper assembly of the nascent polypeptide,
a process in which the protein disulphide isomerase (PDI), which is
a thiooxidoreductase, exerts important roles by catalysing
disulphide bond formation. CHOP is a downstream effector in both
the ATF6 and PERK pathways and it is actually involved in
pro-apoptotic functions (34). The
expression levels of BiP/GRP78, PDI and CHOP were therefore
assessed in the present study by western blot analysis. It was
shown that OphA induced a very heterogeneous pattern of expression
of BiP/GRP78 and PDI in the eight cancer cell lines under
investigation (Table I). If the
survival mechanism of the UPR fails and the stress encountered is
too excessive or too severe then the ER can enlist a death response
(34,49) and it seems that this is what
occurred with OphA in the present study (Table II). Excessive stress with a weak
UPR causes the phosphorylation of PERK and eIF2a which activates
the transcription of CHOP, which induces in turn a death response
in the mitochondria. OphA was not shown here to increase the
protein levels of CHOP in any of the cell lines tested (Table II), although this may be dependent
upon the experimental schedule undertaken. However, OphA induced
death in all the eight cancer cell lines analysed and it therefore
seems that OphA did not allow these cancer cell lines to defend
themselves via an ER response and/or UPR against the OphA-mediated
cell insults (Table II).
In conclusion, OphA has been shown to induce cell
death in all the eight cancer cell lines tested and cell death
occurred in these cancer cells via apoptosis (with or without PARP
cleavage) or necrosis depending on the cell line analyzed, and
appears to be related to the tissue of origin of the cell lines. We
have previously shown that OphA is also able to induce paraptosis
in apoptosis-resistant glioblastoma cells (7). OphA induced cell death with
LD50 values in the single digit micromolar concentration
(or even below) in this panel of eight cancer cell lines, a fact
that has been confirmed by previous studies as well as in the NCI
60-cell line panel. We have also shown previously that OphA is an
efficient compound against MDR cancer cells (6). The present study shows that cancer
cells are not able to defend themselves against OphA-induced
cytotoxic insults via a successful activation of the ER stress/UPR
responses. The current data also point to mitochondria as a central
player in OphA-induced cancer cell death, while further studies
will be necessary to precisely understand how. However, the fact
that OphA is not a selective compound may hamper translation to the
clinic. We have already successfully incorporated OphA into
mesoporous silica nanoparticles as a potential delivery system
(8). We are now working on other
systems of OphA vectorization to enable in vivo activity
against apoptosis- and/or MDR-resistant cancer models.
Abbreviations:
|
OphA
|
ophiobolin A
|
|
AV
|
Annexin V
|
|
BKCa
|
big conductance
Ca2+-activated K+ channel
|
|
CaM
|
calmodulin
|
|
CM-H2DCFDA
|
2′,7′-dichlorodihydrofluorescein
diacetate
|
|
DAPI
|
4′,6-diamidino-2-phenylindole
|
|
DMEM
|
Dulbecco's modified Eagle's
medium
|
|
ER
|
endoplasmic reticulum
|
|
FITC
|
fluorescein isothiocyanate
|
|
FR
|
folate receptor
|
|
GBM
|
glioblastoma multiforme
|
|
MDR
|
multidrug resistant
|
|
MOMP
|
mitochondrial outer membrane
permeabilization
|
|
MPT
|
mitochondrial permeability
transport
|
|
PARP
|
poly(ADP) ribose polymerase
|
|
PBS
|
phosphate-buffered saline
|
|
PERK
|
protein kinase-like receptor
kinase
|
|
PI
|
propidium iodide
|
|
PS
|
phosphatidyl serine
|
|
ROS
|
reactive oxygen species
|
|
SDS
|
sodium dodecyl sulphate
|
|
SphA
|
sphaeropsidin A
|
|
TMRM
|
tetramethylrhodamine methyl ester
|
|
TRITC
|
tetramethyl rhodamine
|
|
UPR
|
upregulated protein response
|
Acknowledgments
The authors thank Dr Maurizio Vurro, Istituo di
Scienze delle Produzioni Alimentari, CNR, Bari, Italy, for
supplying culture filtrates of Drechslera gigantea. Dr Alan
Diot is thanked for his assistance with the IN Cell experiments. We
also thank both Professor Alexander Kornienko and Dr Karl Morten
for the interesting discussions. R.M. is funded by the RCUK Digital
Economy Programme grant number EP/G036861/1 (Oxford Centre for
Doctoral Training in Healthcare Innovation). H.T. thanks the
Williams fund for their generous research support.
References
|
1
|
Lefranc F, Sadeghi N, Camby I, Metens T,
Dewitte O and Kiss R: Present and potential future issues in
glioblastoma treatment. Expert Rev Anticancer Ther. 6:719–732.
2006. View Article : Google Scholar : PubMed/NCBI
|
|
2
|
Mathieu V, de Lassalle EM, Toelen J, Mohr
T, Bellahcène A, Van Goietsenoven G, Verschuere T, Bouzin C,
Debyser Z, De Vleeschouwer S, et al: Galectin-1 in melanoma biology
and related neo-angiogenesis processes. J Invest Dermatol.
132:2245–2254. 2012. View Article : Google Scholar : PubMed/NCBI
|
|
3
|
Newman DJ and Giddings LA: Natural
products as leads to antitumor drugs. Phytochem Rev. 13:123–137.
2014. View Article : Google Scholar
|
|
4
|
Shen L, Kondo Y, Ahmed S, Boumber Y,
Konishi K, Guo Y, Chen X, Vilaythong JN and Issa JP: Drug
sensitivity prediction by CpG island methylation profile in the
NCI-60 cancer cell line panel. Cancer Res. 67:11335–11343. 2007.
View Article : Google Scholar : PubMed/NCBI
|
|
5
|
Dittmann LM, Danner A, Gronych J, Wolter
M, Stühler K, Grzendowski M, Becker N, Bageritz J, Goidts V, Toedt
G, et al: Downregulation of RDX1 by promoter hypermethylation is
frequent in 1p/19q-deleted oligodendroglial tumours and increases
radio- and chemosensitivity of Hs683 glioma cells in vitro.
Oncogene. 31:3409–3418. 2012. View Article : Google Scholar
|
|
6
|
Bury M, Novo-Uzal E, Andolfi A, Cimini S,
Wauthoz N, Heffeter P, Lallemand B, Avolio F, Delporte C, Cimmino
A, et al: Ophiobolin A, a sesterterpenoid fungal phytotoxin,
displays higher in vitro growth-inhibitory effects in mammalian
than in plant cells and displays in vivo antitumor activity. Int J
Oncol. 43:575–585. 2013.PubMed/NCBI
|
|
7
|
Bury M, Girault A, Mégalizzi V,
Spiegl-Kreinecker S, Mathieu V, Berger W, Evidente A, Kornienko A,
Gailly P, Vandier C, et al: Ophiobolin A induces paraptosis-like
cell death in human glioblastoma cells by decreasing BKCa channel
activity. Cell Death Dis. 4:e5612013. View Article : Google Scholar : PubMed/NCBI
|
|
8
|
Morrison R, Gardiner C, Evidente A, Kiss R
and Townley H: Incorporation of ophiobolin a into novel
chemoembolization particles for cancer cell treatment. Pharm Res.
31:2904–2917. 2014. View Article : Google Scholar : PubMed/NCBI
|
|
9
|
de Vries-van Leeuwen IJ,
Kortekaas-Thijssen C, Nzigou Mandouckou JA, Kas S, Evidente A and
de Boer AH: Fusicoccin-A selectively induces apoptosis in tumor
cells after interferon-alpha priming. Cancer Lett. 293:198–206.
2010. View Article : Google Scholar : PubMed/NCBI
|
|
10
|
Dasari R, Masi M, Lisy R, Ferdérin M,
English LR, Cimmino A, Mathieu V, Brenner AJ, Kuhn JG, Whitten ST,
et al: Fungal metabolite ophiobolin A as a promising anti-glioma
agent: In vivo evaluation, structure-activity relationship and
unique pyrrolylation of primary amines. Bioorg Med Chem Lett.
25:4544–4548. 2015. View Article : Google Scholar : PubMed/NCBI
|
|
11
|
Evidente A, Andolfi A, Cimmino A, Vurro M,
Fracchiolla M and Charudattan R: Herbicidal potential of
ophiobolins produced by Drechslera gigantea. J Agric Food Chem.
54:1779–1783. 2006. View Article : Google Scholar : PubMed/NCBI
|
|
12
|
Evidente A, Kornienko A, Lefranc F,
Cimmino A, Dasari R, Evidente M, Mathieu V and Kiss R:
Sesterterpenoids with anticancer activity. Curr Med Chem.
22:3502–3522. 2015. View Article : Google Scholar : PubMed/NCBI
|
|
13
|
Kong Au T and Chow Leung P: Identification
of the binding and inhibition sites in the calmodulin molecule for
ophiobolin A by site-directed mutagenesis. Plant Physiol.
118:965–973. 1998. View Article : Google Scholar : PubMed/NCBI
|
|
14
|
Leung PC, Taylor WA, Wang JH and Tipton
CL: Ophiobolin A -A natural product inhibitor of calmodulin. J Biol
Chem. 259:2742–2747. 1984.PubMed/NCBI
|
|
15
|
Leung PC, Taylor WA, Wang JH and Tipton
CL: Role of calmodulin inhibition in the mode of action of
ophiobolin a. Plant Physiol. 77:303–308. 1985. View Article : Google Scholar : PubMed/NCBI
|
|
16
|
Fujiwara H, Matsunaga K, Kumagai H,
Ishizuka M and Ohizumi Y: Ophiobolin A, a novel apoptosis-inducing
agent from fungus strain f-7438. Pharm Pharmacol Commun. 6:427–431.
2000. View Article : Google Scholar
|
|
17
|
Heizmann CW, Berchtold MW and Sommer EW:
Regulation of calcium in tumor cells. Prog Clin Biol Res.
252:391–394. 1988.PubMed/NCBI
|
|
18
|
Klug M, Blum JK, Ye Q and Berchtold MW:
Intracellular Ca2+ and Ca2+-binding proteins
in chemically transformed rat fibroblasts. Exp Cell Res.
213:313–318. 1994. View Article : Google Scholar : PubMed/NCBI
|
|
19
|
Török K, Wilding M, Groigno L, Patel R and
Whitaker M: Imaging the spatial dynamics of calmodulin activation
during mitosis. Curr Biol. 8:692–699. 1998. View Article : Google Scholar : PubMed/NCBI
|
|
20
|
Persechini A and Cronk B: The relationship
between the free concentrations of Ca2+ and
Ca2+-calmodulin in intact cells. J Biol Chem.
274:6827–6830. 1999. View Article : Google Scholar : PubMed/NCBI
|
|
21
|
Berchtold MW and Villalobo A: The many
faces of calmodulin in cell proliferation, programmed cell death,
autophagy, and cancer. Biochim Biophys Acta. 1843:398–435. 2014.
View Article : Google Scholar
|
|
22
|
Galluzzi L, Vitale I, Abrams JM, Alnemri
ES, Baehrecke EH, Blagosklonny MV, Dawson TM, Dawson VL, El-Deiry
WS, Fulda S, et al: Molecular definitions of cell death
subroutines: Recommendations of the Nomenclature Committee on Cell
Death 2012. Cell Death Differ. 19:107–120. 2012. View Article : Google Scholar :
|
|
23
|
Nagaraja GM, Othman M, Fox BP, Alsaber R,
Pellegrino CM, Zeng Y, Khanna R, Tamburini P, Swaroop A and Kandpal
RP: Gene expression signatures and biomarkers of noninvasive and
invasive breast cancer cells: Comprehensive profiles by
representational difference analysis, microarrays and proteomics.
Oncogene. 25:2328–2338. 2006. View Article : Google Scholar
|
|
24
|
Rapa E, Hill SK, Morten KJ, Potter M and
Mitchell C: The over-expression of cell migratory genes in alveolar
rhabdomyosarcoma could contribute to metastatic spread. Clin Exp
Metastasis. 29:419–429. 2012. View Article : Google Scholar : PubMed/NCBI
|
|
25
|
Canal F, Vicent MJ, Pasut G and Schiavon
O: Relevance of folic acid/polymer ratio in targeted PEG-epirubicin
conjugates. J Control Release. 146:388–399. 2010. View Article : Google Scholar : PubMed/NCBI
|
|
26
|
Galluzzi L, Kepp O, Krautwald S, Kroeme
and Linkermann A: Molecular mechanisms of regulated necrosis. Semin
Cell Dev Biol. 35:24–32. 2014. View Article : Google Scholar : PubMed/NCBI
|
|
27
|
ATTC: 2014, ATCC cell lines by gene
mutation [Online]. Available: http://www.atcc.org.
|
|
28
|
Hinson A, Jones R, Crose L, Belyea B, Barr
F and Linardic C: Human rhabdomyosarcoma cell lines for
rhabdomyosarcoma research:Utility and pitfalls. Front Oncol.
3:1832013. View Article : Google Scholar
|
|
29
|
Morse D, Gray H, Payne C and Gillies R:
Docetaxel induces cell death through mitotic catastrophe in human
breast cancer cells. Mol Cancer Ther. 4:1495–1504. 2005. View Article : Google Scholar : PubMed/NCBI
|
|
30
|
Landry J, Pyl P, Rausch T, Zichner T,
Tekkedil M, Stutz A, Jauch A, Aiyar R, Pau G, Delhomme N, et al:
The genomic and transcriptomic landscape of a HeLa cell line G3. G3
(Bethesda). 1213–1224. 2013. View Article : Google Scholar
|
|
31
|
Majno G and Joris I: Apoptosis, oncosis,
and necrosis. An overview of cell death. Am J Pathol. 146:3–15.
1995.PubMed/NCBI
|
|
32
|
Beckman KB and Ames BN: The free radical
theory of aging matures. Physiol Rev. 78:547–581. 1998.PubMed/NCBI
|
|
33
|
Rizzuto R, Pinton P, Carrington W, Fay FS,
Fogarty KE, Lifshitz LM, Tuft RA and Pozzan T: Close contacts with
the endoplasmic reticulum as determinants of mitochondrial
Ca2+ responses. Science. 280:1763–1766. 1998. View Article : Google Scholar : PubMed/NCBI
|
|
34
|
Bravo R, Parra V, Gatica D, Rodriguez AE,
Torrealba N, Paredes F, Wang ZV, Zorzano A, Hill JA, Jaimovich E,
et al: Endoplasmic reticulum and the unfolded protein response:
Dynamics and metabolic integration. Int Rev Cell Mol Biol.
301:215–290. 2013. View Article : Google Scholar : PubMed/NCBI
|
|
35
|
Le Mercier M, Mathieu V, Haibe-Kains B,
Bontempi G, Mijatovic T, Decaestecker C, Kiss R and Lefranc F:
Knocking down galectin 1 in human hs683 glioblastoma cells impairs
both angiogenesis and endoplasmic reticulum stress responses. J
Neuropathol Exp Neurol. 67:456–469. 2008. View Article : Google Scholar : PubMed/NCBI
|
|
36
|
Mathieu V, Chantôme A, Lefranc F, Cimmino
A, Miklos W, Paulitschke V, Mohr T, Maddau L, Kornienko A, Berger
W, et al: Sphaeropsidin A shows promising activity against
drug-resistant cancer cells by targeting regulatory volume
increase. Cell Mol Life Sci. 72:3731–3746. 2015. View Article : Google Scholar : PubMed/NCBI
|
|
37
|
Okada Y, Maeno E, Shimizu T, Dezaki K,
Wang J and Morishima S: Receptor-mediated control of regulatory
volume decrease (RVD) and apoptotic volume decrease (AVD). J
Physiol. 532:3–16. 2001. View Article : Google Scholar : PubMed/NCBI
|
|
38
|
Florea AM and Büsselberg D: Cisplatin as
an anti-tumor drug: Cellular mechanisms of activity, drug
resistance and induced side effects. Cancers (Basel). 3:1351–1371.
2011. View Article : Google Scholar
|
|
39
|
Gronski MA, Kinchen JM, Juncadella IJ,
Franc NC and Ravichandran KS: An essential role for calcium flux in
phagocytes for apoptotic cell engulfment and the anti-inflammatory
response. Cell Death Differ. 16:1323–1331. 2009. View Article : Google Scholar : PubMed/NCBI
|
|
40
|
Kasim NR, Kuželová K, Holoubek A and Model
MA: Live fluorescence and transmission-through-dye microscopic
study of actinomycin D-induced apoptosis and apoptotic volume
decrease. Apoptosis. 18:521–532. 2013. View Article : Google Scholar : PubMed/NCBI
|
|
41
|
LC50 mean graph for compound 114340. Sept.
2014, Available: https://dtp.cancer.gov/dtpstandard/subsets/comp.jsp.
|
|
42
|
Reinhold WC, Sunshine M, Liu H, Varma S,
Kohn KW, Morris J, Doroshow J and Pommier Y: CellMiner: A web-based
suite of genomic and pharmacologic tools to explore transcript and
drug patterns in the NCI-60 cell line set. Cancer Res.
72:3499–3511. 2012. View Article : Google Scholar : PubMed/NCBI
|
|
43
|
Locato V, Uzal E, Cimini S, Zonno M,
Evidente A, Micera A, Foyer C and De Gara L: Low concentrations of
the toxin ophiobolin A lead to an arrest of the cell cycle and
alter the intracellular partitioning of glutathione between the
nuclei and cytoplasm. J Exp Bot. 66:2991–3000. 2015. View Article : Google Scholar : PubMed/NCBI
|
|
44
|
Atlante A, Calissano P, Bobba A, Azzariti
A, Marra E and Passarella S: Cytochrome c is released from
mitochondria in a reactive oxygen species (ROS)-dependent fashion
and can operate as a ROS scavenger and as a respiratory substrate
in cerebellar neurons undergoing excitotoxic death. J Biol Chem.
275:37159–37166. 2000. View Article : Google Scholar : PubMed/NCBI
|
|
45
|
Green DR and Kroemer G: The
pathophysiology of mitochondrial cell death. Science. 305:626–629.
2004. View Article : Google Scholar : PubMed/NCBI
|
|
46
|
Behar SM, Martin CJ, Booty MG, Nishimura
T, Zhao X, Gan HX, Divangahi M and Remold HG: Apoptosis is an
innate defense function of macrophages against Mycobacterium
tuberculosis. Mucosal Immunol. 4:279–287. 2011. View Article : Google Scholar : PubMed/NCBI
|
|
47
|
Bencsik O, Papp T, Berta M, Zana A, Forgó
P, Dombi G, Andersson MA, Salkinoja-Salonen M, Vágvölgyi C and
Szekeres A: Ophiobolin A from Bipolaris oryzae perturbs motility
and membrane integrities of porcine sperm and induces cell death on
mammalian somatic cell lines. Toxins (Basel). 6:2857–2871. 2014.
View Article : Google Scholar
|
|
48
|
Liu H, Zhao S, Zhang Y, Wu J, Peng H, Fan
J and Liao J: Reactive oxygen species-mediated endoplasmic
reticulum stress and mitochondrial dysfunction contribute to
polydatin-induced apoptosis in human nasopharyngeal carcinoma CNE
cells. J Cell Biochem. 112:3695–3703. 2011. View Article : Google Scholar : PubMed/NCBI
|
|
49
|
Schonthal AH: Targeting endoplasmic
reticulum stress for cancer therapy. Front Biosci (Schol Ed).
4:412–431. 2012. View
Article : Google Scholar
|