Introduction
Polarity is defined as the persistent asymmetrical
and ordered distribution of structures along an axis, and
represents a basic property of organisms, organs, tissues and cells
(1). Different types of polarity
exist, like the planar cell polarity (PCP), the apical-basal
polarity (ABP) and the front-rear polarity (FRP). The ABP is the
most studied and best described type of cell polarity, and is a
peculiar characteristic of epithelial and endothelial cells
(2). It determines the formation
of two cellular regions: the apical one faces the lumen and the
basal one is in contact with the basement membrane. The
establishment and maintenance of ABP is due to the interaction and
subcellular localization of three evolutionary conserved protein
complexes, CRUMBS, PAR and SCRIBBLE, that determine the domains of
polarized cells, i.e. the apical, the apical-lateral and the
basallateral districts, respectively. The three polarity complexes
participate also in the formation and stabilization of the tight
junctions (TJs) and adherent junctions (AJs), which in turn have a
role in preserving the ABP and tissue homeostasis (3–6).
Over the last decades, various research has
clarified the role of the polarity complexes starting from the
study of the model organisms Caenorhabditis elegans and
Drosophila melanogaster (7–9). The
comprehension of the molecular functions of these complexes led to
consider cell polarity the prerequisite for the organogenesis, and
essential to ensure tissue homeostasis by controlling
proliferation, asymmetric division, migration and specialized cell
functions (5). Not surprisingly,
both neoplastic transformation and cancer progression have been
associated to loss of cell polarity/cohesiveness (LOP/C),
considered a cancer hallmark (10). Moreover, LOP/C is implicated in the
epithelial-mesenchymal transition (EMT), strictly connected with
the metastasis development (10).
Deregulated expression of ABP complex members has been described in
several cancer types, in which they have been identified as either
oncosuppressors or oncogenes (4).
In the present study, we focused attention on the
one having the widest range of functions, i.e. the PAR
(PARtitioning defective) complex (11). It is composed by a core of three
proteins: PAR3, PAR6 and the atypical protein kinase C, aPKC. In
mammals, paralogous genes have been described: PARD3α/β,
PARD6α/β/γ, aPKCζ, and aPKCι, expressed at different
levels during the embryonal development and in adult tissues
(12–15). PARD3α localizes at TJs
formation areas and acts as scaffold for aPKC and PARD6 to induce
TJs assembly, but participates also in the regulation of other
cellular processes, including migration, cell cycle and
asymmetrical division by interacting with other molecules (5). PARD3β does not interact with
the aPKC, although sharing the cellular localization with
PARD3α, thus, it does not seem to participate in formation
of TJs (3,16). Regarding the three PARD6 forms,
PARD6α is present both at TJs and in the cytosol,
PARD6β is localized in the cytosol and PARD6γ focuses
at TJs. Some studies have described other cellular locations of
PARD6α and PARD6γ, that is nucleus and centriole,
respectively (17,18). Like PARD3, PARD6 acts as scaffold
protein, and its principal role is to connect aPKC to PARD3α
and to its downstream targets, but the different subcellular
localizations of the three forms indicate further functions
(17,18). Proteins aPKCζ and
aPKCι are both localized in the cytoplasm and at the TJs,
and phosphorylate numerous substrates, among which PARD3 (3).
Alterations in the expression levels of the PAR
complex members have been reported in many types of human cancer,
like the esophageal squamous cell carcinoma, the non-small cell
lung carcinoma, the ovarian cancer and the breast carcinoma
(19). Moreover, an
oncogenic/oncosuppressor context-dependent role of PAR members
emerged from functional studies (19). However, there is a lack of
information on PAR gene expression and role in epithelial thyroid
cancer (TC) progression.
TC represents the most common endocrine malignancy
accounting for roughly 1% of all human cancers, and its incidence
has been increasing over the last decades, mainly due to the
improved ability to diagnose malignant transformation in small
non-palpable thyroid nodules (20,21).
More than 90% of thyroid carcinomas are represented by the
differentiated papillary (PTC) and follicular (FTC) histotypes,
whereas the invariably fatal undifferentiated (anaplastic) thyroid
carcinoma (ATC) accounts for aproximately 1% of TC (22,23).
Although derived from the same cell type, the epithelial thyroid
tumors show specific histological features, biological behavior and
degree of differentiation as a consequence of different genetic
alterations (24,25). One of the most common in PTC is the
BRAFV600E mutation (26,27),
that associates with clinicopathological features, as advanced
stage, extrathyroidal extension, lymph node and distant metastases
(28). Some authors evidenced
polarity alterations in TC, and it has been shown that PTC patients
with tumors retaining cellular polarity had a better course than
those exhibiting LOP/C features (29–31).
In the present study, we analyzed the expression of
the PAR complex members in 95 PTC compared against normal tissues
and 12 ATC tissues. Data from PTC patients were then correlated
with clinicopathological parameters and patients' disease-free
interval.
Materials and methods
Tissue samples, histology and staging of
patients
Normal and matched PTC tissues were obtained from
surgical specimens of 95 patients (19 males and 76 females, age
range 11–83 years, median 44 years) who underwent total
thyroidectomy at the Department of Surgical Sciences, 'Sapienza'
University of Rome (38 patients) or at the Department of Medicine,
University of Padua (57 patients); while ATC tissues were collected
from surgical specimens of 12 patients (4 males and 8 females, age
range 57–79 years, median 69 years) who had surgery at the
Department of Medicine, University of Padua (7 patients) or at
Department of Clinical and Experimental Medicine of Pisa (5
patients). All the patients gave their informed consent, and the
study was approved by the local ethics committee (protocol no.
2615). Tissue samples were collected, frozen in liquid nitrogen and
stored at −80°C. Of the 95 patients, 72 exhibited classical, 18
follicular, 2 tall cell and 2 oncocytic variants. The histological
diagnoses were made independently by two different
histopathologists according to the World Health Organization
classification (32). At the time
of surgery lymph node metastases were found in 39 patients.
Following TNM staging, 59 patients were at stage I, 1 at stage II,
29 at stage III and 6 at stage IV. Approximately 40–50 days later
all the patients underwent radioiodine therapy followed by thyroid
hormone replacement therapy. To ascertain their disease-free
condition, 4–5 months after intervention all the patients underwent
neck ultrasound and serum Tg measurement. Recurrences were
diagnosed by measurement of serum Tg levels either in basal
conditions or following recombinant human TSH stimulation; FNA
cytology and/or Tg determination in the FNA wash-out from lymph
nodes; 131I whole body scan; histological analysis
following surgical resection of the lesion. The follow-up included
79 patients (mean 57.1+36.7 months, range 5–141 months), 52 of whom
were at TNM stage I. During the follow-up 16 recurrences were
recorded. Regarding ATC patients, they all died from the disease
(survival time range 1–25 months, median 6 months).
Determination of BRAFV600E
mutation
Genomic DNA was extracted from the frozen tissues
using the DNeasy Blood and Tissues kit (Qiagen, Milan, Italy)
according to the manufacturer's protocol. The BRAF status of exon
15 was assessed by both direct sequencing and mutant
allele-specific PCR amplification for the T to A substitution at
nucleotide 1799 (V600E), using the procedure previously described
(33).
Extraction and analysis of mRNA
Frozen normal and tumor thyroid tissues were
homogenized with the ultra-turrax, and total RNA extracted applying
the acid guanidinium thiocyanate-phenol-chloroform method (34). The first cDNA strand was
synthesized from 5 μg of RNA with M-MLV reverse
transcriptase and anchored oligo(dT)23 primers (Sigma Chemicals).
Parallel controls for DNA contamination were carried out omitting
the reverse transcriptase. The templates obtained were used for
quantitative PCR amplifications of the different members of the PAR
complex and three different housekeeping genes (GAPDH,
RPL13A and SDHA), previously shown to be the most stable
among 7 candidate reference genes (35,36),
employing the LightCycler instrument (Roche Diagnostics, Mannheim,
Germany), the SYBR Premix Ex Taq II (Tli RNase H Plus) (Takara,
Shiga, Japan) and specific primers listed in Table I. Amplicon specificities were
checked by automated DNA sequencing (Bio-Fab Research, Rome,
Italy), evaluation of melting temperatures, and electrophoresis on
2% agarose gel containing ethidium bromide. Standard curves for all
genes were created with 5-fold dilutions of mixed human thyroid
tissue cDNA. Calculation of data for PTC was performed by the
Relative Expression Software Tool (REST 2009) using a normalization
factor computed as the geometric media of the 3 reference genes, as
previously described (35,36). The fold change in the mRNA levels
of the different PAR complex components was referred for each PTC
sample to its normal counterpart. Regarding ATC samples, for which
the normal matched tissues were not available, they were compared
to PTC tissues through the AACt method. In the latter, the ACt of
each gene was calculated using the geometric mean of the above
mentioned housekeeping genes, whose expression was proven to be
stable also between PTC and ATC in preliminary experiments (data
not shown). The AACt were computed by subtracting the ACt of each
sample the ACt of the sample showing the lowest gene expression
(37).
 | Table ISequences, genomic positions and
amplicon sizes of the primers used in qRT-PCR for the target and
reference genes. |
Table I
Sequences, genomic positions and
amplicon sizes of the primers used in qRT-PCR for the target and
reference genes.
| Gene | Primer
sequence | Exons | Amplicon lenght
(bp) |
|---|
| GAPDH | Forward:
5′-ATCATCAGCAATGCCTCCTG-3′ | 6–7 | 136 |
| Reverse:
5′-GGCCATCCACAGTCTTCTG-3′ | 8 | |
| RPL13a | Forward:
5′-ACCGTGCGAGGTATGCTG-3′ | 4–5 | 148 |
| Reverse:
5′-TAGGCTTCAGACGCACGAC-3′ | 6 | |
| SDHA | Forward:
5′-GCATAAGAACATCGGAACTGC-3′ | 12 | 147 |
| Reverse:
5′-GGTCGAACGTCTTCAGGTG-3′ | 13 | |
| aPKCι | Forward:
5′-CTAAGGAACGATTGGGTTGTC-3′ | 16 | 126 |
| Reverse:
5′-TGAGAATCAAAGTTGTCCAAACC-3′ | 17 | |
| PARD3α | Forward:
5′-GATAATCAGAGGCAGGGGATG-3′ | 19 | 115 |
| Reverse:
5′-TGTGTCTTCTTCCAAGGTCTCC-3′ | 20 | |
| PARD3β | Forward:
5′-AACCACCTCTAGGCGAAATG-3′ | 12 | 139 |
| Reverse:
5′-AGAATGTGGTGTTGGAGAAGG-3′ | 13 | |
| PARD6α | Forward:
5′-CCTCACCAACGACGACAG-3′ | 2 | 107 |
| Reverse:
5′-AGAGAGTTGGAGGCAAAAGC-3′ | 3 | |
| PARD6β | Forward:
5′-TTTCAACGGCCAATCCAC-3′ | 1 | 147 |
| Reverse:
5′-TGTCAGGACGCAATACGTTG-3′ | 2 | |
| PARD6γ | Forward:
5′-TCAGACCTTGCGATTCTACG-3′ | 1 | 147 |
| Reverse:
5′-TTGGAGATATGGTGGGTGTG-3′ | 2 | |
Western blot analysis
Normal and PTC tissue samples from 12 patients were
homogenized in RIPA buffer (50 mM Tris-HCl pH 7.4, 1% NP-40, 0.5%
sodium deoxycholate, 150 mM sodium chloride, 1 mM EDTA, 1 mM sodium
fluoride, 1 mM AEBSF, 10 μg/ml aprotinin, 10 μg/ml
leupeptin, 1 mM sodium orthovanadate, 10 mM sodium pyrophosphate in
ddH2O) by Turrax, centrifuged at 10,000 rpm for 10 min
and frozen to −80°C. Protein concentrations in the cell extracts
were determined by the Bradford assay (38). Aliquot of 50 μg of tissue
extracts were supplemented with 5X Laemmli buffer (120 mM Tris-HCl,
pH 6.8, 2% SDS, 10% glycerol, 0.01% bromophenol blue) containing 5%
of mercaptoethanol, heated at 95°C for 5 min, electrophoresed on
polyacrylamide gels and transferred onto nitrocellulose membranes
using the Bio-Rad Mini TransBlot Cell system. The membranes were
then washed with TBST (50 mM Tris-HCl, pH 7.5, 150 mM NaCl and
0.05% Tween-20) and saturated with 5% low fat milk in TBST for 2 h
at room temperature. Incubations with primary antibodies were
performed for the identification of the different components of the
PAR complex in 2.5% low fat milk in TBST at 4°C overnight. The
polyclonal antibodies raised against PARD3α (1:1,000,
NBP1-88861; Novus Biologicals), PARD3β (1:1,000, Ab122264;
Abcam), aPKCι (1:1,000, sc-11399; Santa Cruz Biotechnology),
PARD6α (1:1,000, sc-25525; Santa Cruz Biotechnology),
PARD6β (1:1,000, sc-67392; Santa Cruz Biotechnology) and
PARD6γ (1:2,000, orb35046; Biorbyt, Cambridge, UK) were
detected with anti-rabbit horseradish peroxidase conjugated
secondary antibody (1:20,000; Jackson ImmunoResearch Laboratories,
West Grove, PA, USA). Sample loadings in the different western
blots were controlled with the monoclonal anti-GAPDH (1:20,000,
ab8245; Abcam). The western blots were revealed by
Chemiluminescence SuperSignal kit from Pierce (Rockford, IL,
USA).
Statistical analysis
First, the Shapiro-Wilk test was used to check
whether the mRNA data were normally distributed, and if they were
not, the non-parametric Mann-Whitney U-test was used to calculate
the statistical significance of differences in the expression
levels of the different PAR complex components in female vs. male
patients; in classical PTC variant vs. other variants; in
BRAFV600E mutated vs. wild-type PTC; in
metastatic (N1) vs. non-metastatic (N0) PTC; in T1-2 vs. T3-4 tumor
sizes; in TNM I-II vs. ni-IV stages; in presence or absence of
recurrence; in PTC patients group vs. ATC patients group. The
correlation of PAR mRNAs with each other, and with patient's age
was evaluated by the Spearman's Rho test. The Cox regression
stepwise with backward elimination analysis was used to assess the
independent association of patient's age, tumor size, histological
variants, lymph node metastasis and PAR complex components mRNAs
with recurrences. The impact of each PAR gene expression on
disease-free interval was assessed by the Kaplan-Meier analysis
combined with Mantel-Cox log-rank. For the latter, and for the Cox
regression, values were classified based on the following criteria:
fold change >1.2 as 'increased' ; fold change <0.8 as
'decreased'; >0.8-fold change <1.2 as 'unvaried'. All
statistical analyses were carried out with the SPSS software (IBM,
Armonk, NY, USA) and the results were considered significantly
different at P-value of <0.05.
Results
Expression of PAR complex components in
papillary (PTC) and anaplastic (ATC) thyroid cancer tissues
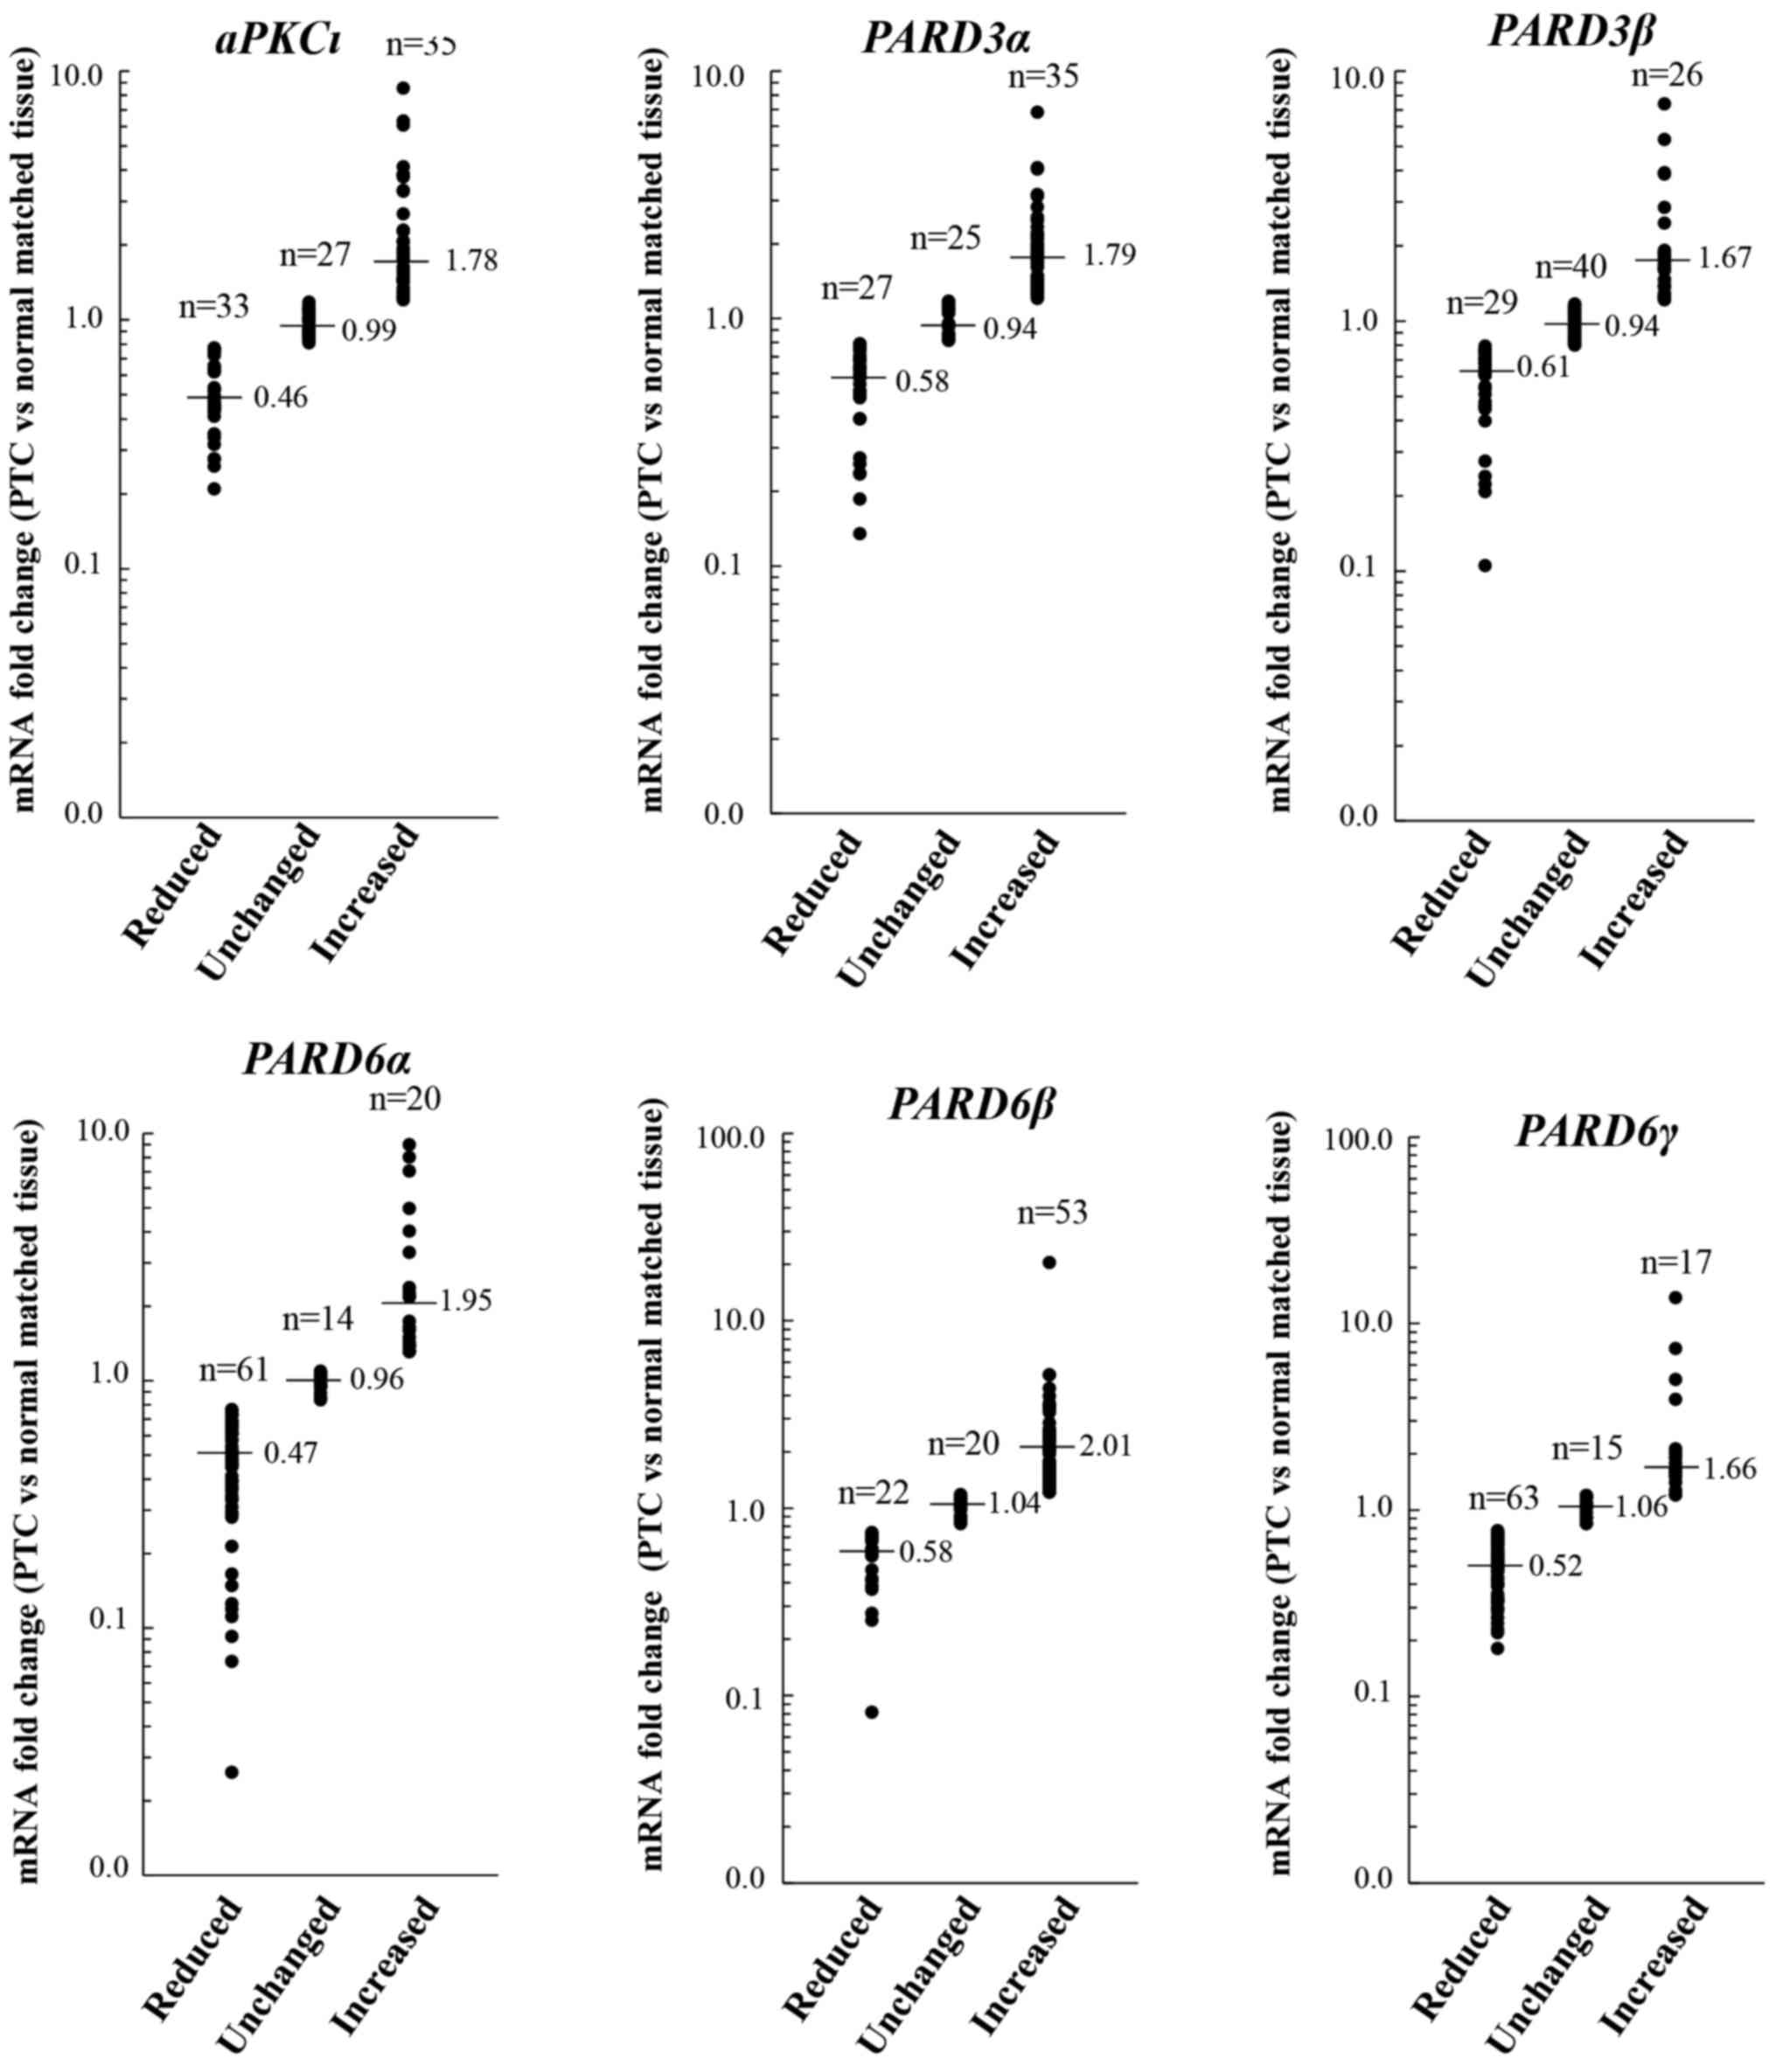
The analyses of mRNA levels of PAR complex
components in PTC samples, compared to normal matched tissues,
revealed that the expression of all transcripts was deregulated
(i.e. reduced or increased) in the majority of cases (Fig. 1). In particular, aPKCι was
reduced in 33/95 (34.7%) cases, unchanged in 27/95 (28.4%) cases
and increased in 35/95 (36.8%) cases; PARD3α was reduced in
27/95 (28.4%) cases, unchanged in 25/95 (26.3%) cases and increased
in 35/95 (36.8%) cases; PARD3p was reduced in 29/95 (30.5%)
cases, unchanged in 40/95 (42.1%) cases and increased in 26/95
(27.4%) cases; PARD6α was reduced in 61/95 (64.2%) cases,
unchanged in 14/95 (14.7%) cases and increased in 20/95 (21.1%)
cases; PARD6β was reduced in 22/95 (23.2%) cases, unchanged
in 20/95 (21.1%) cases and increased in 53/95 (55.8%) cases; and
PARD6γ was reduced in 63/95 (66.3%) cases, unchanged in
15/95 (15.8%) cases and increased in 17/95 (17.9%) cases.
We next evaluated whether the expression of the PAR
genes correlated with each other. As shown in Table II, with the exception of the
couple PARD6α/PARD6β, a significant positive correlation was
found between all the mRNAs.
| Table IICorrelation analysis among mRNA
levels of PAR complex components. |
Table II
Correlation analysis among mRNA
levels of PAR complex components.
| Correlation
coefficients and P-values
|
|---|
| aPKCι | PARD3α | PARD3β | PARD6α | PARD6β | PARD6γ |
|---|
| aPKCι | 1.000 | 0.718 | 0.439 | 0.279 | 0.489 | 0.497 |
| – | <0.0001 | <0.0001 | 0.006 | <0.0001 | <0.0001 |
| PARD3α | | 1.000 | 0.555 | 0.367 | 0.507 | 0.538 |
| | – | <0.0001 | <0.0001 | <0.0001 | <0.0001 |
| PARD3β | | | 1.000 | 0.347 | 0.570 | 0.667 |
| | | – | 0.001 | <0.0001 | <0.0001 |
| PARD6α | | | | 1.000 | 0.150 | 0.371 |
| | | | – | 0.142 | <0.0001 |
| PARD6β | | | | | 1.000 | 0.466 |
| | | | | – | <0.0001 |
| PARD6γ | | | | | | 1.000 |
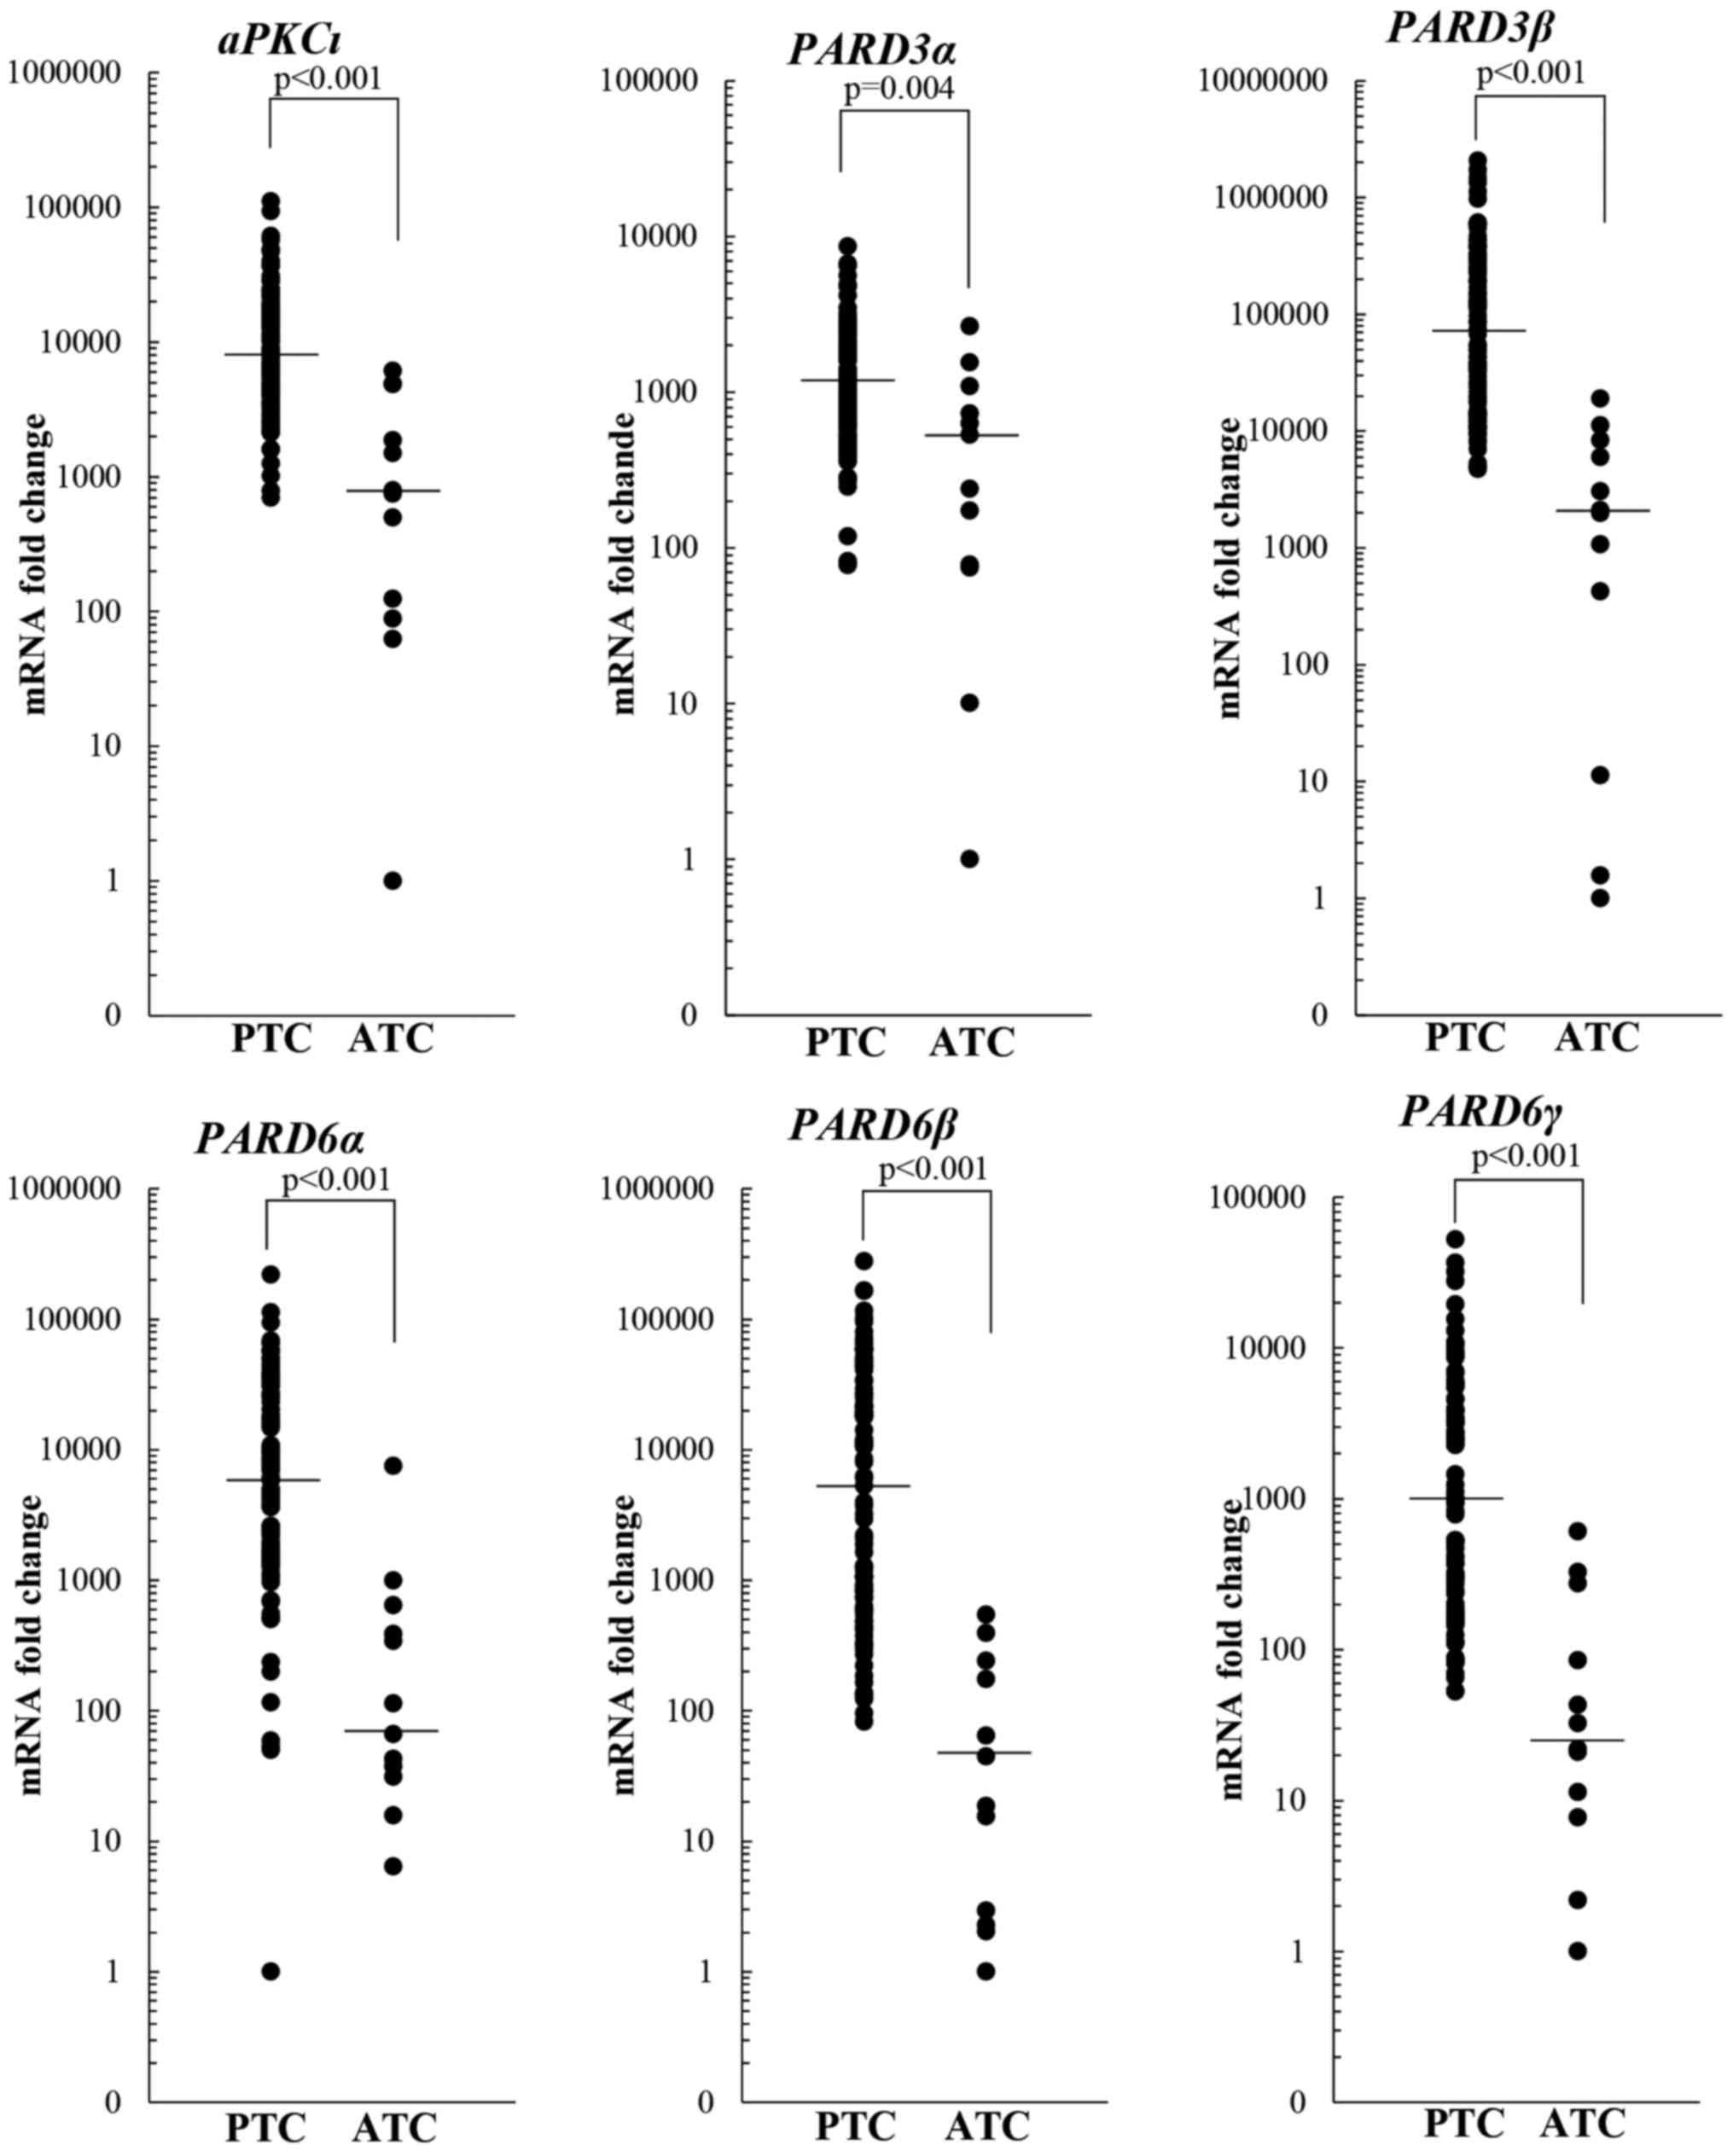
The transcripts levels were investigated also in 12
ATC tissues. The results showed that the expression of all genes
analyzed was significantly lower in ATC compared to PTC tissues
(Fig. 2).
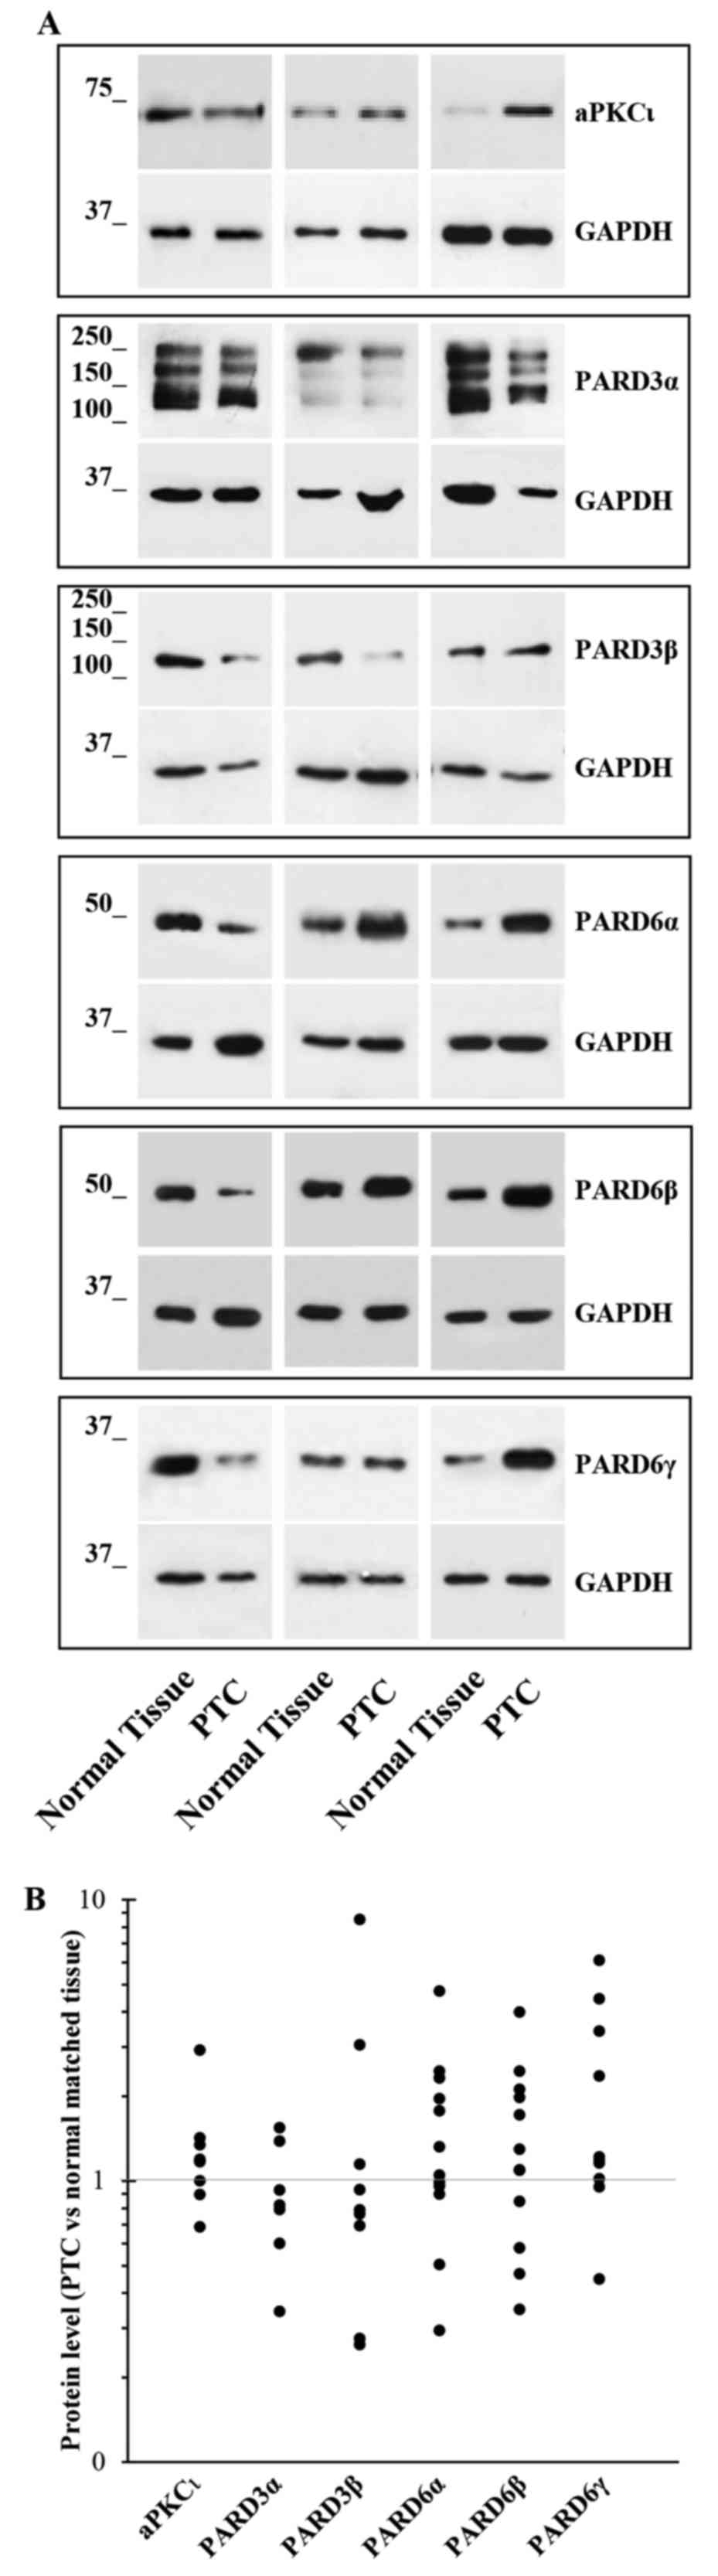
Twelve PTC tissue specimens were used to prepare
protein extracts, and western blot experiments were carried out for
the different PAR complex members. The results confirmed their
deregulation (i.e. reduction or increase) in the majority of PTC
tissues (Fig. 3). Unfortunately,
only 12 PTC specimens were large enough to permit both RNA and
proteins extraction, so their number was too small to perform any
statistical analysis, including the correlation between mRNA and
protein levels.
BRAFV600E mutation and PAR
complex components expression in PTC tissues
To assess the effect of
BRAFV600Emutation on PAR complex member
expression, we analyzed the mRNA levels of each PAR gene in 76 PTC
tissues for which it was possible to check the BRAF gene
status. Of these, 37 (48.7%) PTC harbored the
BRAFV600E mutation while 39 had the wild-type
BRAF. The result of univariate analysis, reported in
Table III, showed that the
BRAFV600E mutation associated only with
PARD6β gene transcription in PTC tissues.
| Table IIIUnivariate statistical analysis of
PAR complex members mRNA, PTC patient characteristics and high-risk
clinicopathological features. |
Table III
Univariate statistical analysis of
PAR complex members mRNA, PTC patient characteristics and high-risk
clinicopathological features.
| aPKCι | P-value | PARD3α | P-value | PARD3β | P-value | PARD6α | P-value | PARD6β | P-value | PARD6γ | P-value |
|---|
| Gender | | | | | | | | | | | | |
| Male (n=19) | 1.02 | 0.948 | 1.05 | 0.357 | 0.82 | 0.176 | 0.65 | 0.985 | 1.14 | 0.515 | 0.59 | 0.367 |
| Female (n=76) | 0.99 | | 1.15 | | 0.94 | | 0.63 | | 1.32 | | 0.66 | |
| Age (y/o) | | | | | | | | | | | | |
| Corr.Coeff. | 0.082 | 0.427 | 0.131 | 0.205 | −0.075 | 0.468 | 0.028 | 0.791 | −0.050 | 0.628 | 0.025 | 0.810 |
| Histology | | | | | | | | | | | | |
| Classical variant
(n=79) | 1.01 | 0.897 | 1.07 | 0.804 | 0.91 | 0.132 | 0.61 | 0.819 | 1.32 | 0.850 | 0.59 | 0.352 |
| Other variants
(n=16) | 0.91 | | 1.22 | | 1.09 | | 0.70 | | 1.28 | | 0.84 | |
| BRAF | | | | | | | | | | | | |
| Wild-type
(n=38) | 1.04 | 0.458 | 0.95 | 0.374 | 0.90 | 0.467 | 0.66 | 0.897 | 1.16 | 0.037 | 0.69 | 0.844 |
| V600E (n=38) | 1.01 | | 1.12 | | 0.92 | | 0.62 | | 1.52 | | 0.64 | |
| pT | | | | | | | | | | | | |
| Tl-2 (n=39) | 1.21 | 0.014 | 1.29 | 0.581 | 1.12 | 0.004 | 0.65 | 0.653 | 1.53 | 0.263 | 0.74 | 0.019 |
| T3-4 (n=56) | 0.91 | | 0.95 | | 0.86 | | 0.62 | | 1.22 | | 0.58 | |
| pN | | | | | | | | | | | | |
| NO (n=56) | 1.00 | 0.581 | 1.19 | 0.650 | 0.99 | 0.449 | 0.66 | 0.623 | 0.47 | 0.159 | 0.67 | 0.200 |
| N1 (n=39) | 0.99 | | 0.96 | | 0.86 | | 0.62 | | 0.18 | | 0.56 | |
| TNM stage | | | | | | | | | | | | |
| I–II (n=60) | 0.95 | 0.434 | 1.08 | 0.579 | 0.95 | 0.176 | 0.61 | 0.576 | 1.40 | 0.579 | 0.67 | 0.357 |
| III–IV (n=35) | 1.01 | | 1.15 | | 0.88 | | 0.68 | | 1.21 | | 0.59 | |
| Recurrence | | | | | | | | | | | | |
| No (n=63) | 1.06 | 0.076 | 1.21 | 0.230 | 1.01 | 0.017 | 0.65 | 0.591 | 1.41 | 0.161 | 0.69 | 0.102 |
| Yes (n=16) | 0.80 | | 0.84 | | 0.74 | | 0.51 | | 1.01 | | 0.51 | |
Prognostic relevance of PAR complex
member expression in PTC patients
No association between the expression, at the mRNA
level, of PAR complex members and gender, age, tumor histology,
lymph node metastasis and TNM stage was observed (Table III). However, a significant
association emerged between reduced mRNA levels of aPKCι,
PARD3β and PARD6γ and increased tumor size (Table III). The univariate statistical
analysis evidenced also an association between higher PARD6β
mRNA levels and BRAFV600E mutation. In addition,
low levels of PARD3β significantly associated with tumor
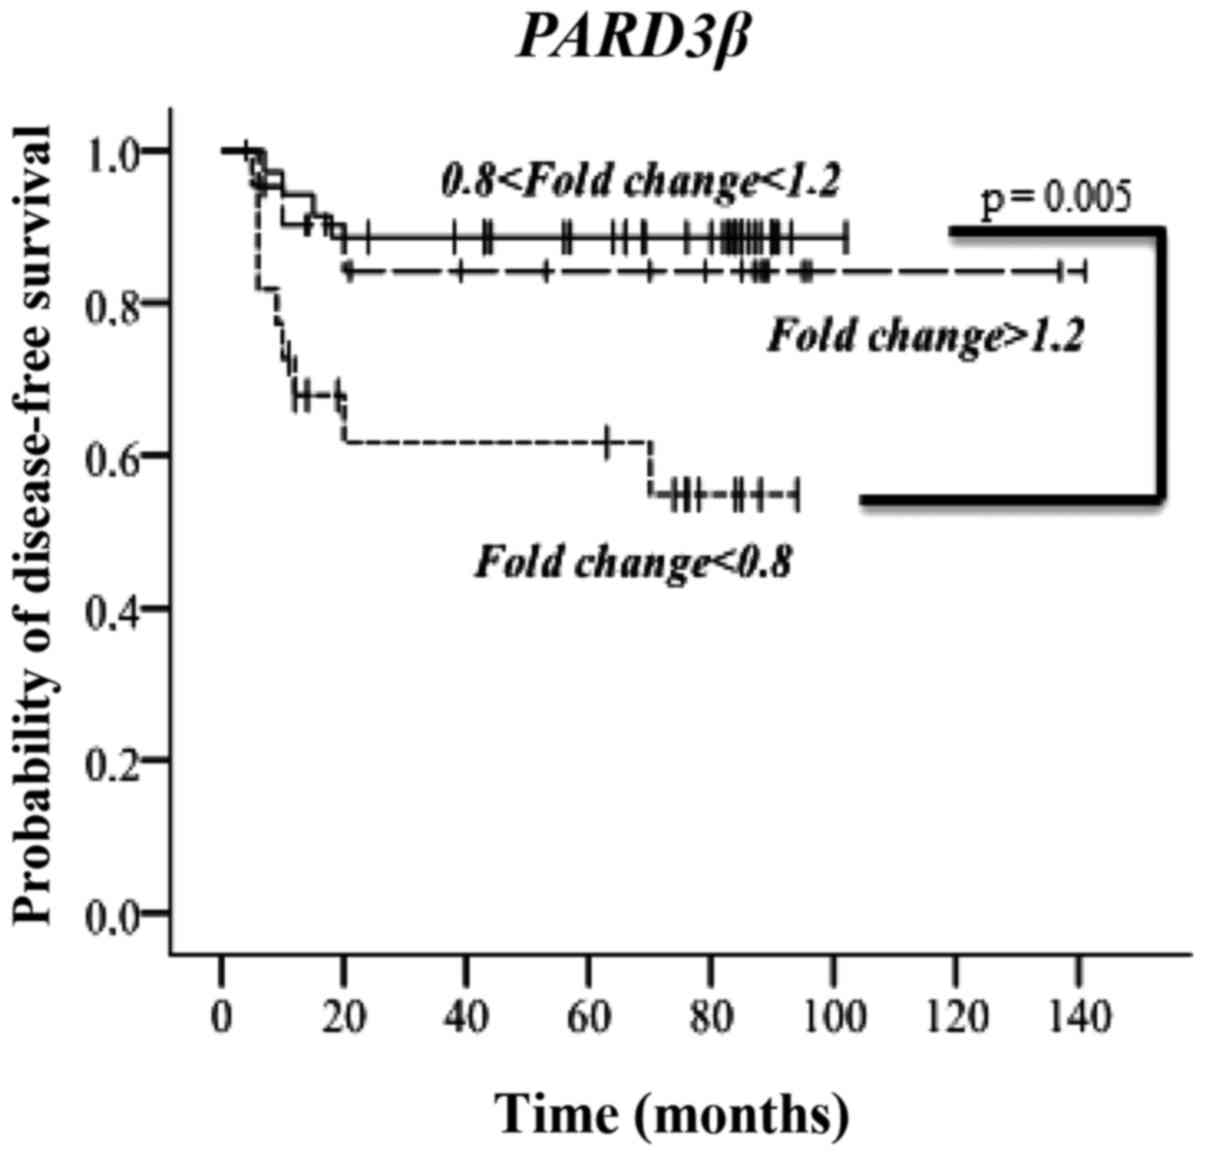
relapse (Table III). Notably,
the Kaplan-Meier analysis demonstrated a significant correlation
only for PARD3β mRNA levels with the disease-free interval
(DFI) (Fig. 4). The latter is
represented for patients grouped in three categories based on the
PARD3β mRNA fold changes: increased, unvaried and decreased.
As evident, lower PARD3β mRNA levels negatively influenced
the DFI. Besides, the multivariate statistical analysis indicated
PARD3β and lymph node metastasis at diagnosis as the only
variables independently associated to DFI, with a hazard ratio,
respectively, of 3.04 (95% CI, 1.12–8.24, P=0.029) and 8.21 (95%
CI, 1.85–35.53, P=0.006) (Table
IV).
| Table IVCox regression stepwise with backward
elimination analysis. |
Table IV
Cox regression stepwise with backward
elimination analysis.
| Variables | HR | 95% CI | P-value |
|---|
| Decreased
PARD3β mRNA | 3.04 | 1.12–8.24 | 0.029 |
| Lymph node
metastasis | 8.21 | 1.85–35.53 | 0.006 |
Discussion
Deregulated expression of PAR complex components has
been associated to cancer development and spread (19). Nevertheless, no studies have
attempted to investigate their expression and role in thyroid
cancer progression to date. To the best of our knowledge, only one
study evidenced the homozygous deletion of PARD3α in primary
ATC derived cell lines. The authors also reported that the
reinstatement of PARD3α by exogenous expression was able to
reduce cell proliferation, motility and invasiveness, and to
restore cell-cell contacts and cell adhesion (38,39).
In this case study, we analyzed the mRNA levels of
the paralogous genes encoding for PAR complex components in PTC and
ATC tissues. The results indicated that the expression of all these
genes was deregulated in PTC, and that all of them were
significantly lower in ATC compared to PTC. These observations may
suggest that the reduced expression of PAR genes may contribute to
TC progression and dedifferentiation, as hypothesized in esophageal
squamous cell carcinoma where reduced level of PARD3α
transcripts was associated with tumor dedifferentiation (40). On the other hand, other studies
reported that the overexpression of PARD3α associates with a
poor prognosis in patients affected by hepatocellular carcinoma or
clear cell renal carcinoma (41,42).
Concerning PARD6α and PARD6β, previous studies in
breast cancer tissues and cell lines demonstrated an increased
expression of both genes and their ability to activate the MEK/ERK
signaling pathway increasing the proliferation rate of breast
epithelial cells (43,44). However, Cunliffe and colleagues
(44) reported that the reduced
levels of PARD6β protein associated with poorly
differentiated breast cancer tissues. Regarding PARD6γ, our
data are in agreement with a study on breast cancer cells
suggesting for it a tumor suppressor role (45). Previous findings on ovarian and
lung cancers demonstrated an increased expression of aPKCι
(46,47). Although also in our PTC series
aPKCι was found upregulated in 37% of cases, it was reduced
in 35% of cases and further reduced in ATC samples. In interpreting
these apparently conflicting data, it may be worth to consider that
a possible oncogenic/oncosuppressive role of PAR components could
be context dependent, as recently suggested (48–52).
However, further functional studies should be performed to assess
the pathogenetic role of each PAR complex component in TC
progression.
We next evaluated whether the deregulated expression
of the different PAR genes could be of any prognostic value. In the
univariate statistical analysis, some significant associations
emerged with the clinicopathological parameters of PTC patients,
among which the association between higher PARD6β mRNA
levels and BRAFV600E mutation. A study conducted
in mice with BRAF oncogene-dependent PTC demonstrated a higher
susceptibility to undergo EMT in response to TGFfi in the
animals with BRAFV600E (53). It was previously demonstrated that
the BRAFV600E mutation induced the TGFfl
secretion by PCCl3 cell line, and that TGFR-p phosphorylates PARD6
on S345 (54,55). Once phosphorylated, PARD6 induces
degradation of the GTPase RhoA leading to dissolution of TJs, which
is one of the first steps of the EMT phenomenon (56). Hence, the significant association
here reported between higher PARD6β mRNA levels and
BRAFV600E mutation may be a sign of these
molecular events. However, the most interesting significant
association emerged by the univariate statistical analysis was
between the low PARD3β mRNA levels and tumor relapses. This
result was confirmed by the Kaplan-Meier analysis, and multivariate
statistical analysis identified the downregulation of PARD3β
mRNA as an independent prognostic factor for DFI. This could be of
some clinical relevance since, to date, the prognosis of PTC
patients still relies on clinicopathological variables such as
patient's age, tumor size, histology, lymph node or distant
metastasis, which are not accurate in predicting the long-term
outcome (57–60). Therefore, the identification of new
molecular biomarkers strictly related to the risk of PTC relapse is
sorely needed.
In conclusion, the data here reported, although
needing to be confirmed by means of larger case-studies,
demonstrate that the expression of PAR complex members is
deregulated in the majority of PTC. Besides, there is a general
trend towards their reduction in ATC tissues, which could be either
an effect or a cause of the loss of tissue architecture integrity
occurring in undifferentiated tumors. Functional studies are
required to assess the actual contribution of PAR complex
alterations in TC progression and dedifferentiation. Moreover,
PARD3β mRNA could represent a useful prognostic biomarker
for PTC patients.
Acknowledgments
The present study was supported by the Sapienza
University of Rome grants (grant nos. C26A14RNFY and C26N145E4T,
2014).
References
|
1
|
Cove DJ, Hope IA and Quatrano RS: Polarity
in biological systems. Development Genetics, Epigenetics and
Environmental Regulation. Russo VEA, Cove DJ, Edgar LG, Jaenish R
and Salamini F: Springer-Verlag; New York: pp. 507–524. 1999
|
|
2
|
Sebbagh M and Borg JP: Insight into planar
cell polarity. Exp Cell Res. 328:284–295. 2014. View Article : Google Scholar : PubMed/NCBI
|
|
3
|
Lee M and Vasioukhin V: Cell polarity and
cancer - cell and tissue polarity as a non-canonical tumor
suppressor. J Cell Sci. 121:1141–1150. 2008. View Article : Google Scholar : PubMed/NCBI
|
|
4
|
Assemat E, Bazellieres E,
Pallesi-Pocachard E, Le Bivic A and Massey-Harroche D: Polarity
complex proteins. Biochim Biophys Acta. 1778:614–630. 2008.
View Article : Google Scholar
|
|
5
|
Khursheed M and Bashyam MD: Apico-basal
polarity complex and cancer. J Biosci. 39:145–155. 2014. View Article : Google Scholar : PubMed/NCBI
|
|
6
|
Lin WH, Asmann YW and Anastasiadis PZ:
Expression of polarity genes in human cancer. Cancer Inform.
14(Suppl. 3): 15–28. 2015.PubMed/NCBI
|
|
7
|
Kemphues KJ, Priess JR, Morton DG and
Cheng NS: Identification of genes required for cytoplasmic
localization in early C. elegans embryos. Cell. 52:311–320. 1988.
View Article : Google Scholar : PubMed/NCBI
|
|
8
|
Tepass U, Theres C and Knust E: crumbs
encodes an EGF-like protein expressed on apical membranes of
Drosophila epithelial cells and required for organization of
epithelia. Cell. 61:787–799. 1990. View Article : Google Scholar : PubMed/NCBI
|
|
9
|
Bilder D and Perrimon N: Localization of
apical epithelial determinants by the basolateral PDZ protein
Scribble. Nature. 403:676–680. 2000. View Article : Google Scholar : PubMed/NCBI
|
|
10
|
Royer C and Lu X: Epithelial cell
polarity: A major gatekeeper against cancer? Cell Death Differ.
18:1470–1477. 2011. View Article : Google Scholar : PubMed/NCBI
|
|
11
|
Gandalovicová A, Vomastek T, Rosel D and
Brábek J: Cell polarity signaling in the plasticity of cancer cell
invasiveness. Oncotarget. 7:25022–25049. 2016.PubMed/NCBI
|
|
12
|
Lin D, Edwards AS, Fawcett JP, Mbamalu G,
Scott JD and Pawson T: A mammalian PAR-3-PAR-6 complex implicated
in Cdc42/Rac1 and aPKC signalling and cell polarity. Nat Cell Biol.
2:540–547. 2000. View Article : Google Scholar : PubMed/NCBI
|
|
13
|
Vinot S, Le T, Maro B and Louvet-Vallée S:
Two PAR6 proteins become asymmetrically localized during
establishment of polarity in mouse oocytes. Curr Biol. 14:520–525.
2004. View Article : Google Scholar : PubMed/NCBI
|
|
14
|
Louvet-Vallée S, Vinot S and Maro B:
Mitotic spindles and cleavage planes are oriented randomly in the
two-cell mouse embryo. Curr Biol. 15:464–469. 2005. View Article : Google Scholar : PubMed/NCBI
|
|
15
|
Vinot S, Le T, Ohno S, Pawson T, Maro B
and Louvet-Vallée S: Asymmetric distribution of PAR proteins in the
mouse embryo begins at the 8-cell stage during compaction. Dev
Biol. 282:307–319. 2005. View Article : Google Scholar : PubMed/NCBI
|
|
16
|
Kohjima M, Noda Y, Takeya R, Saito N,
Takeuchi K and Sumimoto H: PAR3beta, a novel homologue of the cell
polarity protein PAR3, localizes to tight junctions. Biochem
Biophys Res Commun. 299:641–646. 2002. View Article : Google Scholar : PubMed/NCBI
|
|
17
|
Cline EG and Nelson WJ: Characterization
of mammalian Par 6 as a dual-location protein. Mol Cell Biol.
27:4431–4443. 2007. View Article : Google Scholar : PubMed/NCBI
|
|
18
|
Dormoy V, Tormanen K and Sütterlin C:
Par6y is at the mother centriole and controls centrosomal protein
composition through a Par6a-dependent pathway. J Cell Sci.
126:860–870. 2013. View Article : Google Scholar :
|
|
19
|
Ellenbroek SI, Iden S and Collard JG: Cell
polarity proteins and cancer. Semin Cancer Biol. 22:208–215. 2012.
View Article : Google Scholar : PubMed/NCBI
|
|
20
|
Davies L and Welch HG: Increasing
incidence of thyroid cancer in the United States, 1973–2002. JAMA.
295:2164–2167. 2006. View Article : Google Scholar : PubMed/NCBI
|
|
21
|
Jemal A, Siegel R, Ward E, Hao Y, Xu J and
Thun MJ: Cancer statistics, 2009. CA Cancer J Clin. 59:225–249.
2009. View Article : Google Scholar : PubMed/NCBI
|
|
22
|
Kinder BK: Well differentiated thyroid
cancer. Curr Opin Oncol. 15:71–77. 2003. View Article : Google Scholar
|
|
23
|
Pasieka JL: Anaplastic thyroid cancer.
Curr Opin Oncol. 15:78–83. 2003. View Article : Google Scholar
|
|
24
|
Nikiforov YE, Biddinger PW and Thompson
LDR: Diagnostic Pathology and Molecular Genetics of the Thyroid.
Lippincott Williams & Wilkins; Philadelphia: 2009
|
|
25
|
Cancer Genome Atlas Research Network:
Integrated genomic characterization of papillary thyroid carcinoma.
Cell. 159:676–690. 2014. View Article : Google Scholar : PubMed/NCBI
|
|
26
|
Kimura ET, Nikiforova MN, Zhu Z, Knauf JA,
Nikiforov YE and Fagin JA: High prevalence of BRAF mutations in
thyroid cancer: Genetic evidence for constitutive activation of the
RET/PTC-RAS-BRAF signaling pathway in papillary thyroid carcinoma.
Cancer Res. 63:1454–1457. 2003.PubMed/NCBI
|
|
27
|
Soares P, Trovisco V, Rocha AS, Lima J,
Castro P, Preto A, Máximo V, Botelho T, Seruca R and
Sobrinho-Simoes M: BRAF mutations and RET/PTC rearrangements are
alternative events in the etiopathogenesis of PTC. Oncogene.
22:4578–4580. 2003. View Article : Google Scholar : PubMed/NCBI
|
|
28
|
Elisei R, Ugolini C, Viola D, Lupi C,
Biagini A, Giannini R, Romei C, Miccoli P, Pinchera A and Basolo F:
BRAFV600E mutation and outcome of patients with
papillary thyroid carcinoma: A 15-year median follow-up study. J
Clin Endocrinol Metab. 93:3943–3949. 2008. View Article : Google Scholar : PubMed/NCBI
|
|
29
|
Kerjaschki D, Krisch K, Sleyter UB, Umrath
W, Jakesz R, Depisch D, Kokoschka R and Horandner H: The structure
of tight junctions in human thyroid tumors. A systematic
freeze-fracture study Am J Pathol. 96:207–226. 1979.
|
|
30
|
Fluge Ø, Haugen DR, Lillehaug JR and
Varhaug JE: Difference in patterns of Met expression in papillary
thyroid carcinomas and nonneoplastic thyroid tissue. World J Surg.
25:623–631. 2001. View Article : Google Scholar : PubMed/NCBI
|
|
31
|
Bai Y, Kakudo K, Nakamura M, Ozaki T, Li
Y, Liu Z, Mori I, Miyauchi A and Zhou G: Loss of cellular
polarity/cohesiveness in the invasive front of papillary thyroid
carcinoma and periostin expression. Cancer Lett. 281:188–195. 2009.
View Article : Google Scholar : PubMed/NCBI
|
|
32
|
Hedinger C, Williams ED and Sobin LH: The
WHO histological classification of thyroid tumors: a commentary on
the second edition. Cancer. 63:908–911. 1989. View Article : Google Scholar : PubMed/NCBI
|
|
33
|
Barollo S, Pennelli G, Vianello F,
Watutantrige Fernando S, Negro I, Merante Boschin I, Pelizzo MR,
Rugge M, Mantero F, Nacamulli D, et al: BRAF in primary and
recurrent papillary thyroid cancers: The relationship with
131I and 2-[18F]fluoro-2- deoxy-D-glucose
uptake ability. Eur J Endocrinol. 163:659–663. 2010. View Article : Google Scholar : PubMed/NCBI
|
|
34
|
Chomczynski P and Sacchi N: Single-step
method of RNA isolation by acid guanidinium
thiocyanate-phenol-chloroform extraction. Anal Biochem.
162:156–159. 1987. View Article : Google Scholar : PubMed/NCBI
|
|
35
|
Vandesompele J, De Preter K, Pattyn F,
Poppe B, Van Roy N, De Paepe A and Speleman F: Accurate
normalization of real-time quantitative RT-PCR data by geometric
averaging of multiple internal control genes. Genome Biol.
3:Research0034. 2002. View Article : Google Scholar : PubMed/NCBI
|
|
36
|
Ulisse S, Baldini E, Sorrenti S, Barollo
S, Prinzi N, Catania A, Nesca A, Gnessi L, Pelizzo MR, Mian C, et
al: In papillary thyroid carcinoma BRAFV600E is
associated with increased expression of the urokinase plasminogen
activator and its cognate receptor, but not with disease-free
interval. Clin Endocrinol (Oxf). 77:780–786. 2012. View Article : Google Scholar
|
|
37
|
Livak KJ and Schmittgen TD: Analysis of
relative gene expression data using real-time quantitative PCR and
the 2−ΔΔCT method. Methods. 25:402–408. 2001. View Article : Google Scholar
|
|
38
|
Bradford MM: A rapid and sensitive method
for the quantitation of microgram quantities of protein utilizing
the principle of protein-dye binding. Anal Biochem. 72:248–254.
1976. View Article : Google Scholar : PubMed/NCBI
|
|
39
|
Garg M, Okamoto R, Nagata Y, Kanojia D,
Venkatesan S, Anand MT, Braunstein GD, Said JW, Doan NB, Ho Q, et
al: Establishment and characterization of novel human primary and
metastatic anaplastic thyroid cancer cell lines and their genomic
evolution over a year as a primagraft. J Clin Endocrinol Metab.
100:725–735. 2015. View Article : Google Scholar :
|
|
40
|
Zen K, Yasui K, Gen Y, Dohi O, Wakabayashi
N, Mitsufuji S, Itoh Y, Zen Y, Nakanuma Y, Taniwaki M, et al:
Defective expression of polarity protein PAR-3 gene (PARD3) in
esophageal squamous cell carcinoma. Oncogene. 28:2910–2918. 2009.
View Article : Google Scholar : PubMed/NCBI
|
|
41
|
Jan YJ, Ko BS, Liu TA, Wu YM, Liang SM,
Chen SC, Wang J and Liou JY: Expression of partitioning defective 3
(Par-3) for predicting extrahepatic metastasis and survival with
hepatocellular carcinoma. Int J Mol Sci. 14:1684–1697. 2013.
View Article : Google Scholar : PubMed/NCBI
|
|
42
|
Dugay F, Le Goff X, Rioux-Leclerq N,
Chesnel F, Jouan F, Henry C, Cabillic F, Verhoest G, Vigneau C,
Arlot-Bonnemains Y, et al: Overexpression of the polarity protein
PAR-3 in clear cell renal cell carcinoma is associated with poor
prognosis. Int J Cancer. 134:2051–2060. 2014. View Article : Google Scholar
|
|
43
|
Nolan ME, Aranda V, Lee S, Lakshmi B, Basu
S, Allred DC and Muthuswamy SK: The polarity protein Par6 induces
cell proliferation and is overexpressed in breast cancer. Cancer
Res. 68:8201–8209. 2008. View Article : Google Scholar : PubMed/NCBI
|
|
44
|
Cunliffe HE, Jiang Y, Fornace KM, Yang F
and Meltzer PS: PAR6B is required for tight junction formation and
activated PKCZ localization in breast cancer. Am J Cancer Res.
2:478–491. 2012.
|
|
45
|
Marques E, Englund JI, Tervonen TA,
Virkunen E, Laakso M, Myllynen M, Mäkelä A, Ahvenainen M, Lepikhova
T, Monni O, et al: Par6G suppresses cell proliferation and is
targeted by loss-of-function mutations in multiple cancers.
Oncogene. 35:1386–1398. 2016. View Article : Google Scholar :
|
|
46
|
Eder AM, Sui X, Rosen DG, Nolden LK, Cheng
KW, Lahad JP, Kango-Singh M, Lu KH, Warneke CL, Atkinson EN, et al:
Atypical PKCiota contributes to poor prognosis through loss of
apical-basal polarity and cyclin E overexpression in ovarian
cancer. Proc Natl Acad Sci USA. 102:12519–12524. 2005. View Article : Google Scholar : PubMed/NCBI
|
|
47
|
Regala RP, Weems C, Jamieson L, Khoor A,
Edell ES, Lohse CM and Fields AP: Atypical protein kinase C iota is
an oncogene in human non-small cell lung cancer. Cancer Res.
65:8905–8911. 2005. View Article : Google Scholar : PubMed/NCBI
|
|
48
|
Iden S, van Riel WE, Schäfer R, Song JY,
Hirose T, Ohno S and Collard JG: Tumor type-dependent function of
the par3 polarity protein in skin tumorigenesis. Cancer Cell.
22:389–403. 2012. View Article : Google Scholar : PubMed/NCBI
|
|
49
|
Yao S, Bee A, Brewer D, Dodson A, Beesley
C, Ke Y, Ambroisine L, Fisher G, Mpller H, Dickinson T, et al:
PRKC-Z expression promotes the aggressive phenotype of human
prostate cancer cells and is a novel target for therapeutic
intervention. Genes Cancer. 1:444–464. 2010. View Article : Google Scholar : PubMed/NCBI
|
|
50
|
Awadelkarim KD, Callens C, Rossé C, Susini
A, Vacher S, Rouleau E, Lidereau R and Bièche I: Quantification of
PKC family genes in sporadic breast cancer by qRT-PCR: Evidence
that PKCi/7 overexpression is an independent prognostic factor. Int
J Cancer. 131:2852–2862. 2012. View Article : Google Scholar : PubMed/NCBI
|
|
51
|
Ma L, Tao Y, Duran A, Llado V, Galvez A,
Barger JF, Castilla EA, Chen J, Yajima T, Porollo A, et al: Control
of nutrient stress- induced metabolic reprogramming by PKCZ in
tumorigenesis. Cell. 152:599–611. 2013. View Article : Google Scholar : PubMed/NCBI
|
|
52
|
Namdarian B, Wong E, Galea R, Pedersen J,
Chin X, Speirs R, Humbert PO, Costello AJ, Corcoran NM and Hovens
CM: Loss of APKC expression independently predicts tumor recurrence
in superficial bladder cancers. Urol Oncol. 31:649–655. 2013.
View Article : Google Scholar
|
|
53
|
Knauf JA, Sartor MA, Medvedovic M,
Lundsmith E, Ryder M, Salzano M, Nikiforov YE, Giordano TJ,
Ghossein RA and Fagin JA: Progression of BRAF-induced thyroid
cancer is associated with epithelial-mesenchymal transition
requiring concomitant MAP kinase and TGFp signaling. Oncogene.
30:3153–3162. 2011. View Article : Google Scholar : PubMed/NCBI
|
|
54
|
Riesco-Eizaguirre G, Rodriguez I, De la
Vieja A, Costamagna E, Carrasco N, Nistal M and Santisteban P: The
BRAFV600E oncogene induces transforming growth factor
beta secretion leading to sodium iodide symporter repression and
increased malignancy in thyroid cancer. Cancer Res. 69:8317–8325.
2009. View Article : Google Scholar : PubMed/NCBI
|
|
55
|
Ozdamar B, Bose R, Barrios-Rodiles M, Wang
HR, Zhang Y and Wrana JL: Regulation of the polarity protein Par6
by TGFbeta receptors controls epithelial cell plasticity. Science.
307:1603–1609. 2005. View Article : Google Scholar : PubMed/NCBI
|
|
56
|
Gunaratne A, Thai BL and Di Guglielmo GM:
Atypical protein kinase C phosphorylates Par6 and facilitates
transforming growth factor p-induced epithelial-to-mesenchymal
transition. Mol Cell Biol. 33:874–886. 2013. View Article : Google Scholar :
|
|
57
|
Gospodarowicz MK, Henson DE, Hutter RVP,
O'Sullivan B, Sobin LH and Wittekind CL: Prognostic Factors in
Cancer. 2nd edition. Wiley-Liss; New York: 2001
|
|
58
|
Passler C, Scheuba C, Prager G, Kaczirek
K, Kaserer K, Zettinig G and Niederle B: Prognostic factors of
papillary and follicular thyroid cancer: Differences in an
iodine-replete endemic goiter region. Endocr Relat Cancer.
11:131–139. 2004. View Article : Google Scholar : PubMed/NCBI
|
|
59
|
Baldini E, Sorrenti S, Tuccilli C, Prinzi
N, Coccaro C, Catania A, Filippini A, Bononi M, De Antoni E,
D'Armiento M, et al: Emerging molecular markers for the prognosis
of differentiated thyroid cancer patients. Int J Surg. 12(Suppl 1):
S52–S56. 2014. View Article : Google Scholar : PubMed/NCBI
|
|
60
|
Ulisse S, Baldini E, Sorrenti S, Barollo
S, Gnessi L, Catania A, Pellizzo MR, Nardi F, Mian C, De Antoni E,
et al: High expression of the urokinase plasminogen activator and
its cognate receptor associates with advanced stages and reduced
disease- free interval in papillary thyroid carcinoma. J Clin
Endocrinol Metab. 96:504–508. 2011. View Article : Google Scholar
|