Introduction
Papillary thyroid carcinoma (PTC) accounts for ~85%
of all well-differentiated thyroid cancers and is thus the most
common thyroid malignancy (1,2).
Most PTCs are small tumors with limited extension, indolent growth,
and excellent prognoses, but ~18% exhibit aggressive clinical
behavior (2). PTCs include several
histological types: classical forms (PTC-CT), which are the most
common, and follicular- and tall-cell variants (PTC-FV and PTC-TC,
respectively). Each histotype is characterized by specific
clinicopathological features (3).
PTC-TC is the most aggressive of the three, while PTC-FV is the
most indolent (4).
The generally non-aggressive clinical behavior of
PTC is consistent with its genetic and biologic characteristics.
The mutation density of the PTC genome is on the whole lower than
that of other cancers, which reflects its indolent behavior
(5,6). In addition, thyroid differentiation
score (based on expression level of thyroid metabolism and function
genes) correlates with histological grade, risk of recurrence and
mortality of PTCs (5). Greater
understanding of the molecular underpinning of thyroid cancers will
necessarily improve their diagnosis and treatment, especially for
certain subtypes whose classification criteria are less rigorously
defined and objectively debatable (7,8).
In some studies, tumor miRNA profiles have proven to
be more useful for classifying cancers than sequencing analysis or
gene expression profiling (9).
Their high stability in paraffin-embedded tissues (10) and body fluids (11) makes miRNAs excellent candidates as
biomarkers for many cancers, including PTC (5,12).
Several studies have explored the expression profiles of these
non-coding RNA species in PTCs, and hundreds of miRNAs reportedly
display tumor-related dysregulation in PTCs (5,13–15).
However, the specific miRNAs identified as dysregulated vary from
study to study, and the results are often discordant (16). Less is known about the association
between miRNA expression and the clinicopathological features of
PTC, such as clinical aggressiveness and histological features
(17,18).
The aim of this study was to identify miRNAs with
dysregulated expression in PTC, with particular emphasis on
alterations associated with specific histological types and/or with
the risk of tumor recurrence, in order to clarify the role of
miRNAs as effective biomarkers for tumor classification.
Materials and methods
Study design and patient samples
The study was conducted with institutional review
board approval and the written informed consent of all patients
whose tissues were analyzed. Our primary aim was to define a
microRNA signature for sporadic PTC tissue. To this end, we
enrolled two independent cohorts of patients with sporadic PTCs who
underwent thyroidectomy between 2012 and 2014 at the Department of
Internal Medicine and Medical Specialties of 'Sapienza' University
of Rome or at the Department of Surgical Pathology of the
University of Pisa.
Immediately after surgery, samples of tumor tissue
and normal tissue from the unaffected lobe were collected
prospectively from each participant of cohort I. Tissues were
snap-frozen and stored in liquid nitrogen prior to microRNA
profiling analysis (described below). On the basis of the results
of the screening analysis and a review of the literature, we
selected a panel of miRNAs for further validation. Their expression
was evaluated in formalin-fixed, paraffin-embedded (FFPE) samples
of normal and neoplastic thyroid tissues from the patients making
up cohort II.
The secondary aims of the study were to identify
miRNAs whose dysregulated expression was associated with one or
more histological types of PTC and/or with an elevated risk of
post- treatment recurrence. These issues were explored in cohort
II, where enrolled cases had been selected specifically to ensure
roughly equal representation of low- and intermediate-risk cases,
as defined by the American Thyroid Association (ATA) (19), and the maximum number possible of
histological PTC variants (based on availability).
Fresh-frozen and FFPE tissue samples were reviewed
separately by two pathologists, who confirmed the diagnosis of PTC,
identified the tumor histotype, excluded fresh frozen tumor samples
in which tumor cells accounted for <60% of the total, and marked
tumor tissue in each slide for macrodissection.
Analysis of tissue miRNAs
Total RNA containing small RNAs was extracted from
fresh-frozen tissues (cohort I) using TRIzol reagent (Thermo Fisher
Scientific, Inc., Waltham, MA, USA) and from FFPE tissues (cohort
II) using the mirVana™ miRNA Isolation kit (Thermo Fisher
Scientific). The quality and quantity of RNA samples were verified
with a NanoDrop spectrophotometer (Thermo Fisher Scientific).
The screening analysis consisted of miRNA profiling
performed on fresh-frozen thyroid tissues from cohort I PTC
patients. TaqMan Array Human MicroRNA A+B Cards v3.0 (Thermo Fisher
Scientific), a set of two 384-well microfluidic cards, were used to
quantify the relative expression of 754 miRNAs as previously
reported (20). In the validation
analysis, we evaluated the expression of a selected panel of miRNAs
in FFPE samples of thyroid tissue from cohort II PTC patients using
Custom TaqMan Array MicroRNA Cards (Thermo Fisher Scientific). Each
array was configured with specific TaqMan miRNA expression assays
(Thermo Fisher Scientific). In both analyses, TaqMan arrays were
processed as previously reported (21). Expression Suite software v1.0.3
(Thermo Fisher Scientific) was used to calculate Ct values and
relative miRNA expression (using the comparative 2−ΔΔCt
method). The Ct cut-off was set at 35, and U6 was used as an
endogenous control.
Statistical analysis
Differences between two groups were assessed with
the Mann-Whitney U test followed by either Benjamini-Hochberg
correction (false discovery rate, FDR) (in the screening analysis)
or Bonferroni correction (in the validation analysis). When three
or more groups were compared, differences were assessed with the
Kruskal-Wallis test followed by the post hoc Dunn's multiple
comparison test. The Mann-Whitney and Kruskall-Wallis tests were
carried out using SPSS software version 22.0 (IBM Corp., Armonk,
NY, USA). The 'p.adjust' function of the basic R stats package (R
software version 3.1.1) (22,23)
was used for Benjamini-Hochberg and Bonferroni corrections. Heat
maps and hierarchical clustering based on ΔCt values were done with
GENE-E software version 3.0.230 (http://www.broadinstitute.org/cancer/software/GENE-E),
using Spearman correlation and complete linkage.
Results
Dysregulated miRNA expression in PTC
tissues Screening analysis
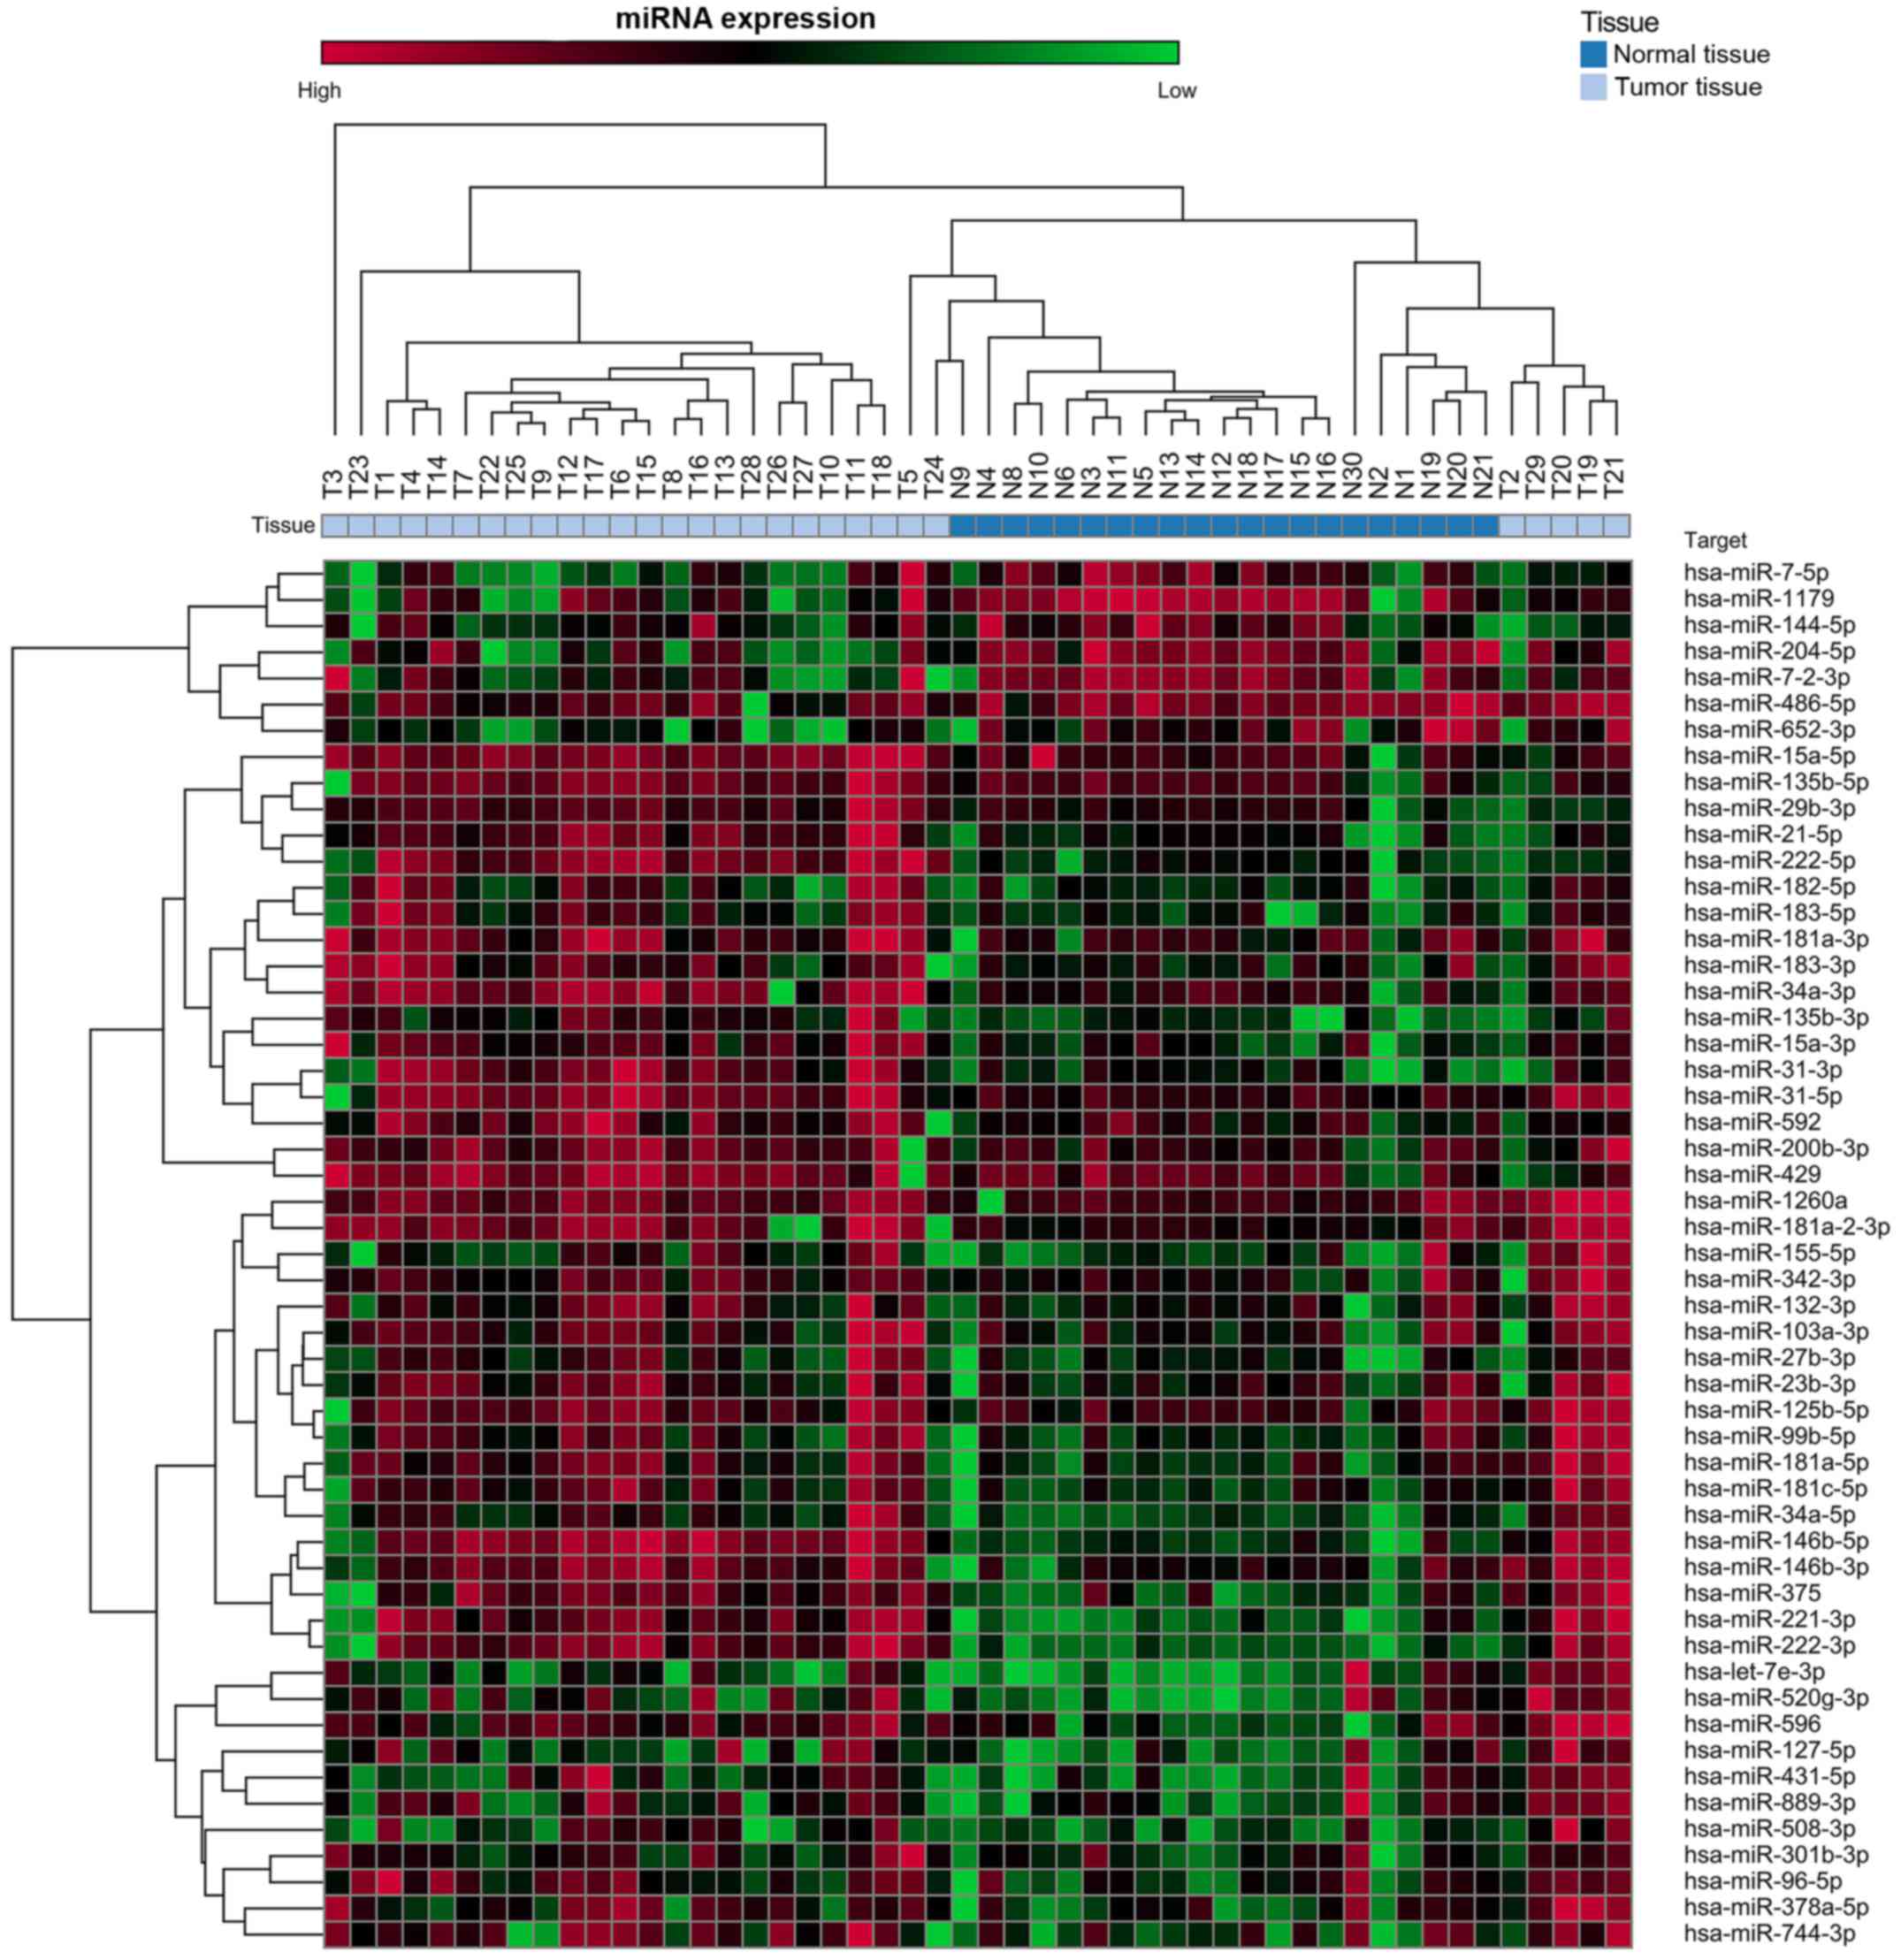
Table I shows the
characteristics of the 29 PTC patients enrolled in cohort I. Of the
754 miRNAs analyzed in this cohort, 53 exhibited mean levels in the
tumor tissues that were significantly higher (n=46) or lower (n=7)
than the means for the normal thyroid tissues (Fig. 1 and Table II).
 | Table IBaseline characteristics of PTC
patients in the study cohorts. |
Table I
Baseline characteristics of PTC
patients in the study cohorts.
| Clinicopathological
features - n (%) | Cohort I
(n=29) | Cohort II
(n=76) |
|---|
| Age at diagnosis
(years)a | | |
| <45 | 6 (20.7) | 39 (51.3) |
| ≥45 | 23 (79.3) | 36 (47.4) |
| Gender | | |
| Male | 8 (27.6) | 19 (25.0) |
| Female | 21 (72.4) | 57 (75.0) |
| Tumor size
(cm) | | |
| ≥1 | 20 (69.0) | 48 (63.2) |
| <1 | 9 (31.0) | 28 (36.8) |
| Multifocality | | |
| Yes | 9 (31.0) | 28 (36.8) |
| No | 20 (69.0) | 48 (63.2) |
| Extrathyroidal
extension | | |
| Yes | 11 (37.9) | 29 (38.2) |
| No | 18 (62.1) | 47 (61.8) |
| Lymph node
metastases | | |
| Yes | 8 (27.6) | 26 (34.2) |
| No | 21 (72.4) | 50 (65.8) |
| ATA risk 2015 | | |
| Low | 10 (34.5) | 33 (43.4) |
| Intermediate | 19 (65.5) | 43 (56.6) |
| Histological
variant | | |
| PTC-CT | 23 (79.3) | 47 (61.8) |
| PTC-FV | 5 (17.2) | 20 (26.3) |
| PTC-EFV | 3 (10.3) | 14 (18.4) |
| PTC-IFV | 2 (6.9) | 6 (7.9) |
| PTC-TCV | 0 | 7 (9.2) |
| Other | 1 (3.4) | 2 (2.6) |
| Table IIMicroRNAs displaying dysregulated
expression in tumor tissues of PTC patients from the cohort I. |
Table II
MicroRNAs displaying dysregulated
expression in tumor tissues of PTC patients from the cohort I.
| miRBase ID v21 | Normal tissues
(n=21) | Tumor tissues
(n=29) | P-valuea | P-value adjb |
|---|
|
hsa-miR-146b-5p | 1
(0.018–7.340) | 58.758
(0.094–230.834) | <0.0001 | 0.0036 |
| hsa-miR-221-3p | 1
(0.095–4.860) | 24.204
(0.233–97.736) | <0.0001 | 0.0036 |
| hsa-miR-222-3p | 1
(0.260–2.785) | 17.707
(0.201–61.485) | <0.0001 | 0.0036 |
| hsa-miR-222-5p | 1
(0.039–2.351) | 15.973
(0.157–66.455) | <0.0001 | 0.0036 |
|
hsa-miR-146b-3p | 1
(0.005–6.837) | 10.861
(0.017–55.237) | <0.0001 | 0.0036 |
| hsa-miR-34a-5p | 1
(0.083–4.066) | 9.275
(0.257–88.148) | <0.0001 | 0.0036 |
| hsa-miR-31-3p | 1
(0.047–2.772) | 8.736
(0.066–38.979) | <0.0001 | 0.0036 |
| hsa-miR-21-5p | 1
(0.028–2.803) | 8.706
(0.119–55.252) | <0.0001 | 0.0036 |
| hsa-miR-375 | 1
(0.066–6.745) | 7.764
(0.034–44.529) | <0.0001 | 0.0036 |
| hsa-miR-31-5p | 1
(0.323–2.424) | 7.264
(0.004–29.557) | <0.0001 | 0.0036 |
|
hsa-miR-135b-3p | 1
(0.121–2.507) | 6.102
(0.224–51.519) | <0.0001 | 0.0036 |
| hsa-miR-182-5p | 1
(0.063–3.459) | 5.780
(0.099–38.691) | 0.0163 | NS |
| hsa-miR-508-3p | 1
(0.137–6.107) | 5.249
(0.094–52.703) | 0.0252 | NS |
|
hsa-miR-181a-2-3p | 1
(0.267–4.857) | 4.886
(0.009–16.393) | <0.0001 | 0.0036 |
| hsa-miR-34a-3p | 1
(0.031–2.483) | 4.836
(0.022–14.827) | <0.0001 | 0.0036 |
| hsa-miR-183-5p | 1
(0.074–2.680) | 4.518
(0.157–28.343) | 0.0021 | NS |
| hsa-miR-1260a | 1
(0.000–6.705) | 4.292
(0.366–23.045) | 0.0005 | 0.0164 |
| hsa-miR-183-3p | 1
(0.055–7.218) | 4.027
(0.027–19.837) | 0.0013 | 0.0392 |
|
hsa-miR-181a-3p | 1
(0.014–4.661) | 3.916
(0.154–12.278) | 0.0052 | NS |
| hsa-miR-15a-3p | 1
(0.078–3.530) | 3.638
(0.313–16.829) | <0.0001 | 0.0036 |
| hsa-miR-29b-3p | 1
(0.013–2.231) | 3.631
(0.052–31.111) | 0.0055 | NS |
|
hsa-miR-181a-5p | 1
(0.115–2.623) | 3.301
(0.321–11.416) | <0.0001 | 0.0036 |
|
hsa-miR-181c-5p | 1
(0.146–2.233) | 3.192
(0.217–12.265) | <0.0001 | 0.0036 |
|
hsa-miR-378a-5p | 1
(0.052–6.176) | 3.011
(0.114–14.683) | 0.0040 | NS |
| hsa-miR-596 | 1
(0.060–5.028) | 2.965
(0.289–11.180) | <0.0001 | 0.0036 |
| hsa-miR-27b-3p | 1
(0.156–2.139) | 2.565
(0.302–13.316) | 0.0067 | NS |
| hsa-miR-592 | 1
(0.133–3.765) | 2.548
(0.032–11.515) | 0.0343 | NS |
| hsa-miR-744-3p | 1
(0.080–3.584) | 2.438
(0.069–10.357) | 0.0122 | NS |
| hsa-miR-127-5p | 1
(0.072–6.326) | 2.430
(0.098–16.629) | 0.0280 | NS |
|
hsa-miR-135b-5p | 1
(0.023–2.518) | 2.357
(0.009–12.712) | 0.0115 | NS |
| hsa-miR-155-5p | 1
(0.083–10.923) | 2.320
(0.059–15.242) | 0.0343 | NS |
| hsa-miR-96-5p | 1
(0.054–5.897) | 2.294
(0.283–12.549) | 0.0063 | NS |
| hsa-miR-15a-5p | 1
(0.002–10.510) | 2.179
(0.043–8.537) | 0.0001 | 0.0036 |
| hsa-miR-99b-5p | 1
(0.162–2.991) | 2.173
(0.340–6.729) | 0.0115 | NS |
| hsa-miR-23b-3p | 1
(0.083–3.789) | 2.165
(0.092–7.254) | 0.0239 | NS |
|
hsa-miR-520g-3p | 1
(0.126–7.794) | 2.100
(0.149–9.733) | 0.0052 | NS |
| hsa-miR-429 | 1
(0.036–3.551) | 2.088
(0.008–6.988) | 0.0215 | NS |
|
hsa-miR-125b-5p | 1
(0.070–3.085) | 2.069
(0.021–7.428) | 0.0122 | NS |
|
hsa-miR-200b-3p | 1
(0.135–2.647) | 2.052
(0.052–6.990) | 0.0042 | NS |
| hsa-miR-132-3p | 1
(0.115–3.208) | 2.045
(0.268–6.510) | 0.0145 | NS |
| hsa-miR-431-5p | 1
(0.099–8.621) | 1.839
(0.165–10.632) | 0.0085 | NS |
|
hsa-miR-103a-3p | 1
(0.206–2.820) | 1.755
(0.138–4.958) | 0.0154 | NS |
|
hsa-miR-301b-3p | 1
(0.100–4.459) | 1.752
(0.340–9.937) | 0.0115 | NS |
| hsa-miR-342-3p | 1
(0.197–4.199) | 1.617
(0.097–5.774) | 0.0109 | NS |
| hsa-miR-889-3p | 1
(0.092–7.992) | 1.573
(0.123–5.696) | 0.0265 | NS |
| hsa-let-7e-3p | 1
(0.145–9.472) | 1.383
(0.153–5.515) | 0.0145 | NS |
| hsa-miR-7-2-3p | 1
(0.008–2.544) | 0.446
(0.003–4.165) | 0.0005 | 0.0164 |
| hsa-miR-652-3p | 1
(0.081–3.271) | 0.441
(0.072–2.357) | 0.0043 | NS |
| hsa-miR-486-5p | 1
(0.010–4.845) | 0.406
(0.000–2.334) | 0.0043 | NS |
| hsa-miR-7-5p | 1
(0.022–4.102) | 0.378
(0.010–5.822) | 0.0006 | 0.0189 |
| hsa-miR-204-5p | 1
(0.061–2.609) | 0.346
(0.019–1.560) | <0.0001 | 0.0036 |
| hsa-miR-144-5p | 1
(0.014–5.825) | 0.339
(0.005–2.837) | 0.0173 | NS |
| hsa-miR-1179 | 1
(0.010–2.048) | 0.255
(0.010–2.025) | <0.0001 | 0.0036 |
Validation analysis
From this set of 53 miRNAs, we selected a panel of
30 miRNAs for validation in the 76 patients making up cohort II
(Table I). It included 27 miRNAs
with markedly dysregulated expression documented in the tumor
tissues of cohort I PTCs as well as in PTC tissues studied by other
groups (5,13–15)
and three other miRNAs PTC- or cancer-related (5,24–28),
which were either not analyzed in the screening analysis or not
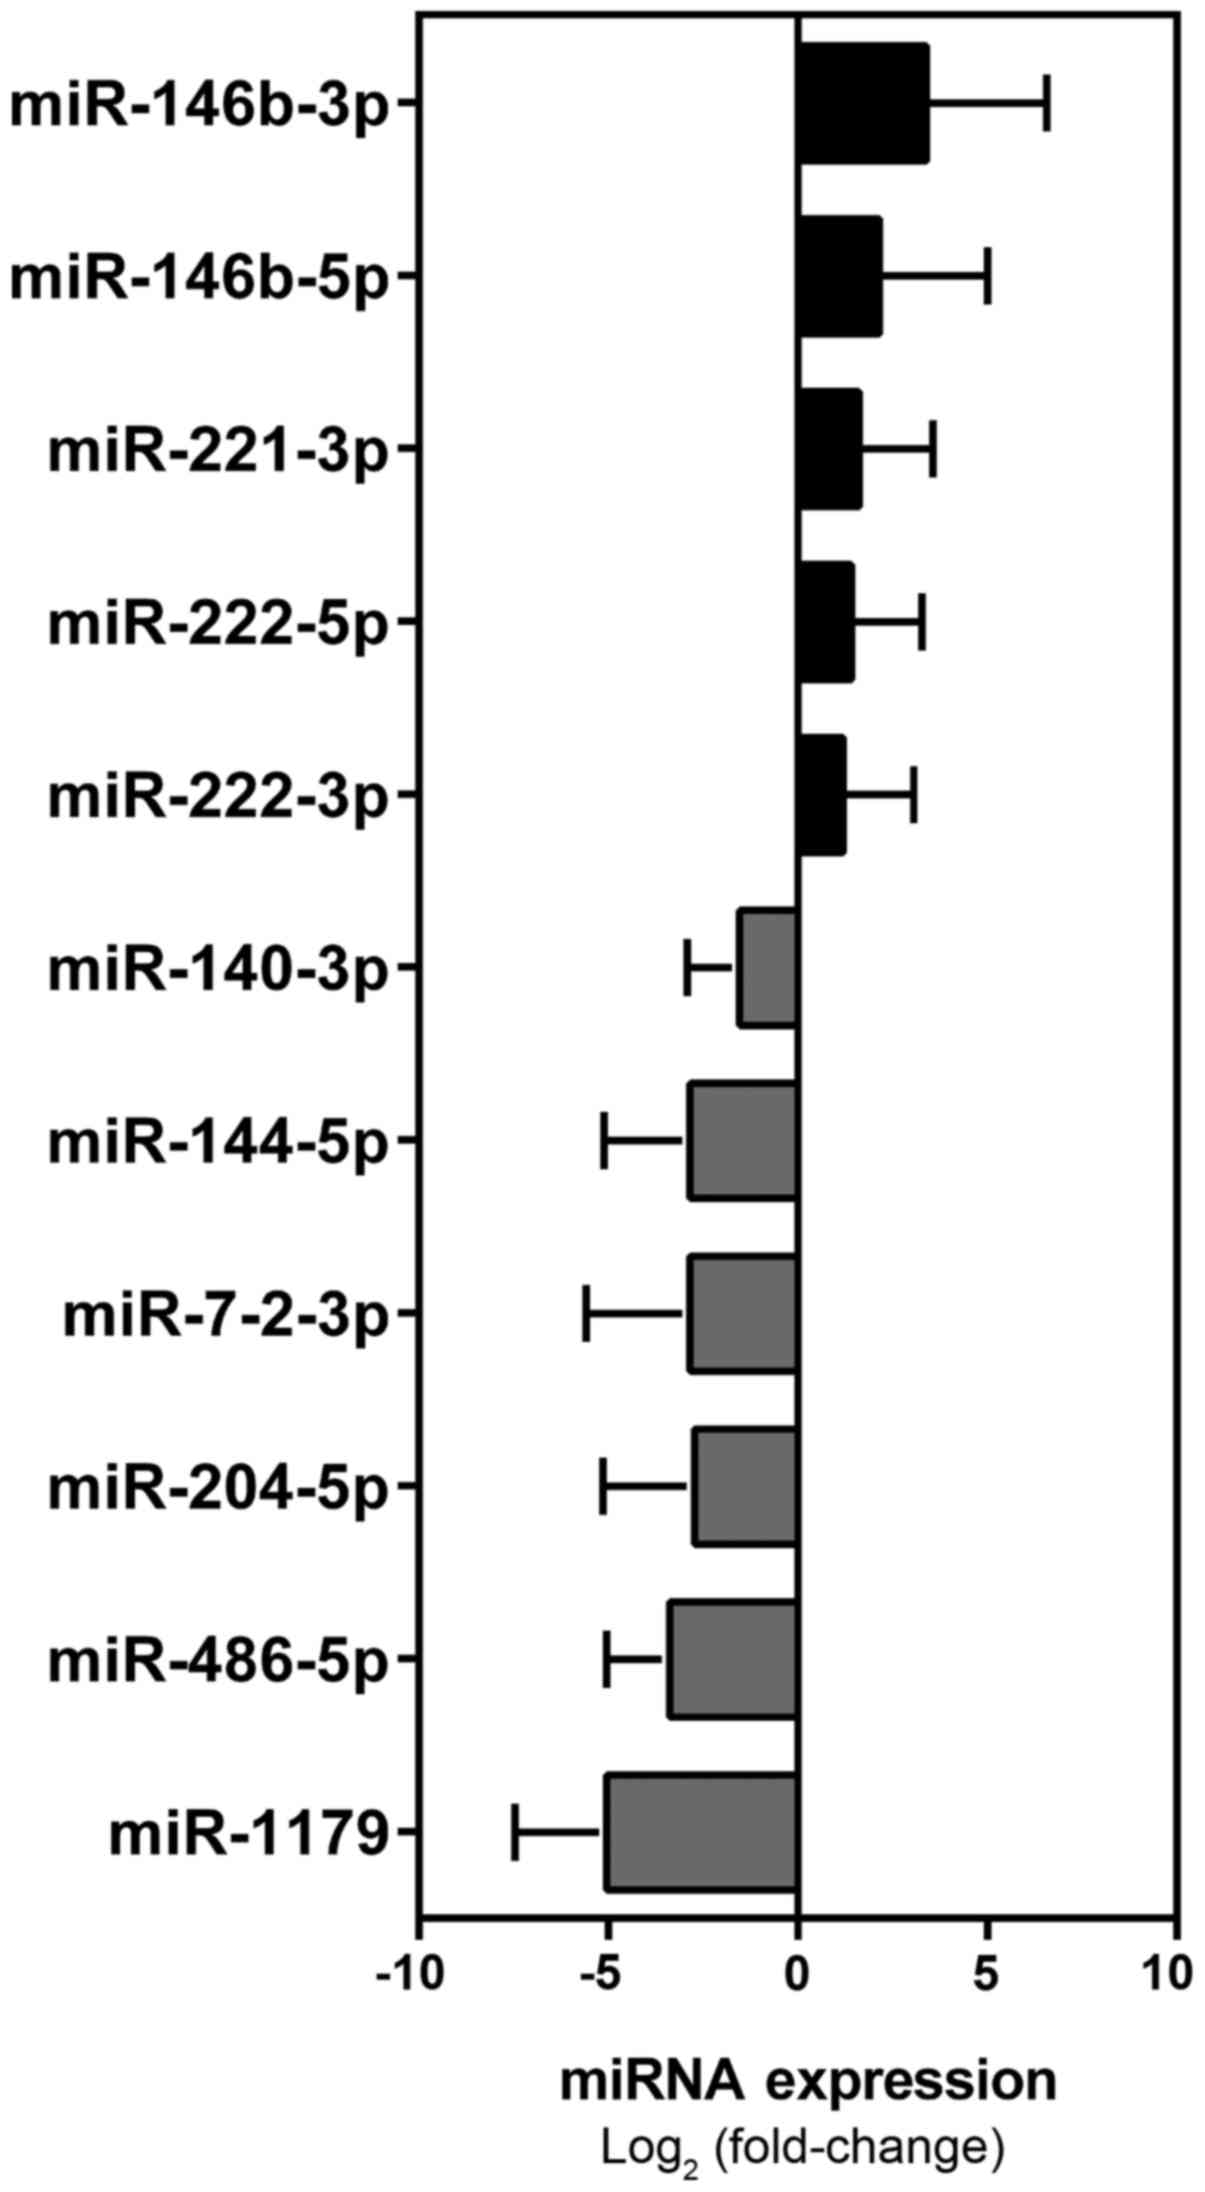
significantly dysregulated in cohort I (Table III). The results of this analysis
identified a signature of 11 miRNAs (miR-146b-5p, miR-146b-3p,
miR-221-3p, miR-222-5p, miR-222-3p, miR-1179, miR-486-5p,
miR-204-5p, miR-7-2-3p, miR-144-5p, miR-140-3p) that were
significantly dysregulated in PTC tumor tissues, as compared with
normal tissues from the unaffected lobe (Mann-Whitney followed by
Bonferroni correction) (Table IV
and Fig. 2).
| Table IIIThe 30 miRNAs selected for the
validation analysis. |
Table III
The 30 miRNAs selected for the
validation analysis.
| miRBase ID v21 | miR assay ID |
|---|
| hsa-miR-1179 |
hsa-miR-1179-002776 |
|
hsa-miR-146b-5p |
hsa-miR-146b-001097 |
|
hsa-miR-146b-3p |
hsa-miR-146b-3p-002361 |
| hsa-miR-15a-3p |
hsa-miR-15a*-002419 |
|
hsa-miR-181a-5p |
hsa-miR-181a-000480 |
|
hsa-miR-181a-2-3p |
hsa-miR-181a-2*-002317 |
| hsa-miR-183-5p |
hsa-miR-183-002269 |
| hsa-miR-204-5p |
hsa-miR-204-000508 |
| hsa-miR-21-5p |
hsa-miR-21-000397 |
|
hsa-miR-181a-3p |
hsa-miR-213-000516 |
| hsa-miR-221-3p |
hsa-miR-221-000524 |
| hsa-miR-222-5p |
hsa-miR-222*-002097 |
| hsa-miR-222-3p |
hsa-miR-222-002276 |
| hsa-miR-31-5p |
hsa-miR-31-002279 |
| hsa-miR-34a-3p |
hsa-miR-34a*-002316 |
| hsa-miR-34a-5p |
hsa-miR-34a-000426 |
| hsa-miR-375 |
hsa-miR-375-000564 |
| hsa-miR-486-5p |
hsa-miR-486-001278 |
| hsa-miR-652-3p |
hsa-miR-652-002352 |
| hsa-miR-7-2-3p |
hsa-miR-7-2*-002314 |
| hsa-miR-144-5p |
hsa-miR-144*-002148 |
| hsa-miR-182-5p |
hsa-miR-182-002334 |
|
hsa-miR-103a-3p |
hsa-miR-103-000439 |
|
hsa-miR-125b-5p |
hsa-miR-125b-000449 |
|
hsa-miR-135b-5p |
hsa-miR-135b-002261 |
|
hsa-miR-200b-3p |
hsa-miR-200b-002251 |
| hsa-miR-155-5p |
hsa-miR-155-002623 |
|
hsa-miR-1908-5pa |
hsa-miR-1908-121109_mat |
|
hsa-miR-140-3pb |
hsa-miR-140-3p-002234 |
|
hsa-miR-199b-3p/hsa-miR-199a-3pb |
hsa-miR-199a-3p-002304 |
| Table IVDysregulated miRNAs in tumor tissues
of PTC patients from cohort II. |
Table IV
Dysregulated miRNAs in tumor tissues
of PTC patients from cohort II.
| miRBase ID v21 | Normal tissues
(n=24) | Tumor tissues
(n=76) | P-valuea | P-value adjb |
|---|
|
hsa-miR-146b-5p | 1
(0.074–6.969) | 13.58
(0.024–76.340) | <0.0001 | 0.003 |
|
hsa-miR-146b-3p | 1
(0.130–4.807) | 45.890
(0.048–422.9) | <0.0001 | 0.003 |
| hsa-miR-221-3p | 1
(0.035–5.892) | 6.453
(0.099–63.050) | <0.0001 | 0.003 |
| hsa-miR-222-5p | 1
(0.082–3.004) | 5.324
(0.119–29.530) | <0.0001 | 0.003 |
| hsa-miR-222-3p | 1
(0.088–2.426) | 4.421
(0.049–35.360) | <0.0001 | 0.003 |
| hsa-miR-375 | 1
(0.043–2.866) | 3.338
(0.035–31.580) | 0.0439 | NS |
| hsa-miR-21-5p | 1
(0.052–4.248) | 2.788
(0.015–29.040) | 0.0497 | NS |
| hsa-miR-31-5p | 1
(0.132–4.033) | 2.318
(0.025–8.377) | 0.007 | NS |
| hsa-miR-34a-5p | 1
(0.028–3.767) | 2.22
(0.092–15.820) | 0.0339 | NS |
| hsa-miR-34a-3p | 1
(0.163–2.072) | 2.215
(0.143–18.630) | 0.0376 | NS |
|
hsa-miR-652-002352 | 1
(0.115–3.188) | 0.6674
(0.039–4.294) | 0.0262 | NS |
|
hsa-miR-199a-3p/hsa-miR-199b-3p | 1
(0.067–4.098) | 0.5618
(0.029–2.346) | 0.0125 | NS |
|
hsa-miR-135b-5p | 1
(0.095–3.703) | 0.5442
(0.013–3.432) | 0.0171 | NS |
| hsa-miR-140-3p | 1
(0.232–2.993) | 0.5089
(0.017–1.752) | 0.0007 | 0.021 |
| hsa-miR-144-5p | 1
(0.092–5.406) | 0.4559
(0.008–3.894) | 0.0001 | 0.003 |
| hsa-miR-7-2-3p | 1
(0.082–3.844) | 0.4441
(0.002–3.565) | 0.001 | 0.03 |
| hsa-miR-204-5p | 1
(0.079–3.468) | 0.4394
(0.004–2.359) | 0.0009 | 0.027 |
| hsa-miR-486-5p | 1
(0.036–3.322) | 0.1874
(0.009–1.298) | <0.0001 | 0.003 |
| hsa-miR-1179 | 1
(0.091–6.515) | 0.094
(0.001–0.513) | <0.0001 | 0.003 |
Dysregulated miRNA expression in PTC
histotypes
Next, we re-analyzed the expression of the 30 miRNAs
listed in Table III as a
function of PTC histotype. This analysis was restricted to the 74
cohort II PTCs representing the three main histotypes (PTC-CT,
PTC-FV, PTC-TCV). The remaining two cases in cohort II were
excluded, because they were rare PTC variants (trabecular in one
case, sclerosing in the other). The results of this analysis are
summarized in Table V. Overall,
expression levels of 13 miRNAs were significantly different among
PTC-CT, PTC-FV, PTC-TCV and normal thyroid tissues
(Kruskall-Wallis). Pair-wise comparisons (post hoc Dunn's test)
revealed 11 miRNAs with significantly dysregulated expression
(compared with that in normal thyroid tissue levels) in PTC-CT
(miR-1179, miR-140-3p, miR-144-5p, miR-146b-5p, miR-146b-3p,
miR-200b-3p, miR-204-5p, miR-221-3p, miR-222-5p, miR-486-5p,
miR-7-2-3p). Far fewer miRNAs (miR-200b-3p, miR-221-3p, miR-486-5p)
displayed altered expression in PTC-FV, which are more indolent
than other PTCs. Surprisingly, the aggressive PTC-TCV was also
characterized by fewer significantly dysregulated miRNAs than
PTC-CT (miR-146b-5p, miR-146b-3p, miR-204-5p, miR-21-5p,
miR-221-3p, miR-222-5p) (Table V).
This finding might be due to the low number of samples in the
PTC-TCV subgroup (n=7 vs. n=47 in the PTC-CT group), which limited
the statistical significance of several additional dysregulations
observed in these tumors.
| Table VmiRNAs differentially expressed in
histological subtypes of PTC. |
Table V
miRNAs differentially expressed in
histological subtypes of PTC.
| Post-hoc Dunn's
test
|
|---|
| Target name | NT | PTC-CT | PTC-FV | PTC-TCV | Kruskal-Wallis | NT vs PTC-CT | NT vs PTC-FV | NT vs PTC-TCV | PTC-CT vs.
PTC-FV | PTC-CT vs.
PTC-TCV | PTC-FV vs.
PTC-TCV |
|---|
| hsa-miR-1179 | 1
(0.091–6.515) | 0.054
(0.001–0.306) | 0.197
(0.022–0.513) | 0.124
(0.009–0.350) | <0.0001 | <0.0001 | NS | NS | NS | NS | NS |
hsa-miR-140-3p
| 1
(0.232–2.993) | 0.408
(0.050–1.675) | 0.543
(0.049–1.596) | 0.973
(0.017–1.752) | 0.0011 | 0.0006 | NS | NS | NS | NS | NS |
hsa-miR-144-5p
| 1
(0.092–5.406) | 0.333
(0.008–3.894) | 0.776
(0.067–3.358) | 0.222
(0.137–0.308) | 0.0001 | <0.0001 | NS | NS | NS | NS | NS |
hsa-miR-146b-5p
| 1
(0.074–6.969) | 16.161
(0.141–76.337) | 2.788
(0.024–13.285) | 28.346
(0.247–73.982) | <0.0001 | <0.0001 | NS | 0.0024 | 0.0003 | NS | 0.0362 |
hsa-miR-146b-3p
| 1
(0.130–4.807) | 55.150
(0.675–422.900) | 8.201
(0.048–92.300) | 83.600
(1.198–293.600) | <0.0001 | <0.0001 | NS | 0.0002 | <0.0001 | NS | 0.0038 |
hsa-miR-182-5p
| 1
(0.041–3.129) | 0.581
(0.010–2.068) | 1.323
(0.044–5.097) | 1.275
(0.069–2.311) | 0.0438 | NS | NS | NS | NS | NS | NS |
hsa-miR-200b-3p
| 1
(0.188–3.030) | 0.408
(0.037–2.068) | 0.704
(0.023–3.395 | 0.825
(0.015–1.958) | 0.0035 | 0.0026 | 0.0421 | NS | NS | NS | NS |
hsa-miR-204-5p
| 1
(0.075–3.291) | 0.279
(0.004–1.907) | 0.883
(0.041–2.359) | 0.091
(0.002–0.352) | <0.0001 | 0.0003 | NS | 0.0022 | 0.0126 | NS | 0.0115 |
hsa-miR-21-5p
| 1
(0.052–4.248) | 2.169
(0.015–8.923) | 1.523
(0.151–5.965) | 13.090
(1.866–29.040) | 0.0229 | NS | NS | 0.0215 | NS | NS | NS |
hsa-miR-221-3p
| 1
(0.035–5.892) | 5.423
(0.099–14.577) | 5.290
(0.348–24.555) | 16.312
(0.686–63.051) | 0.0002 | 0.0002 | 0.0399 | 0.0138 | NS | NS | NS |
hsa-miR-222-5p
| 1
(0.082–3.004) | 4.725
(0.576–22.099) | 4.857
(0.119–22.064) | 10.862
(0.131–29.530) | 0.0007 | 0.001 | NS | 0.018 | NS | NS | NS |
hsa-miR-486-5p
| 1
(0.036–3.322) | 0.142
(0.009–0.827) | 0.315
(0.013–1.298) | 0.115
(0.011–0.230) | <0.0001 | <0.0001 | 0.0077 | NS | NS | NS | NS |
hsa-miR-7-2-3p
| 1
(0.082–3.844) | 0.270
(0.002–1.163) | 0.822
(0.145–3.565) | 0.518
(0.308–0.728) | 0.0005 | 0.0003 | NS | NS | NS | NS | NS |
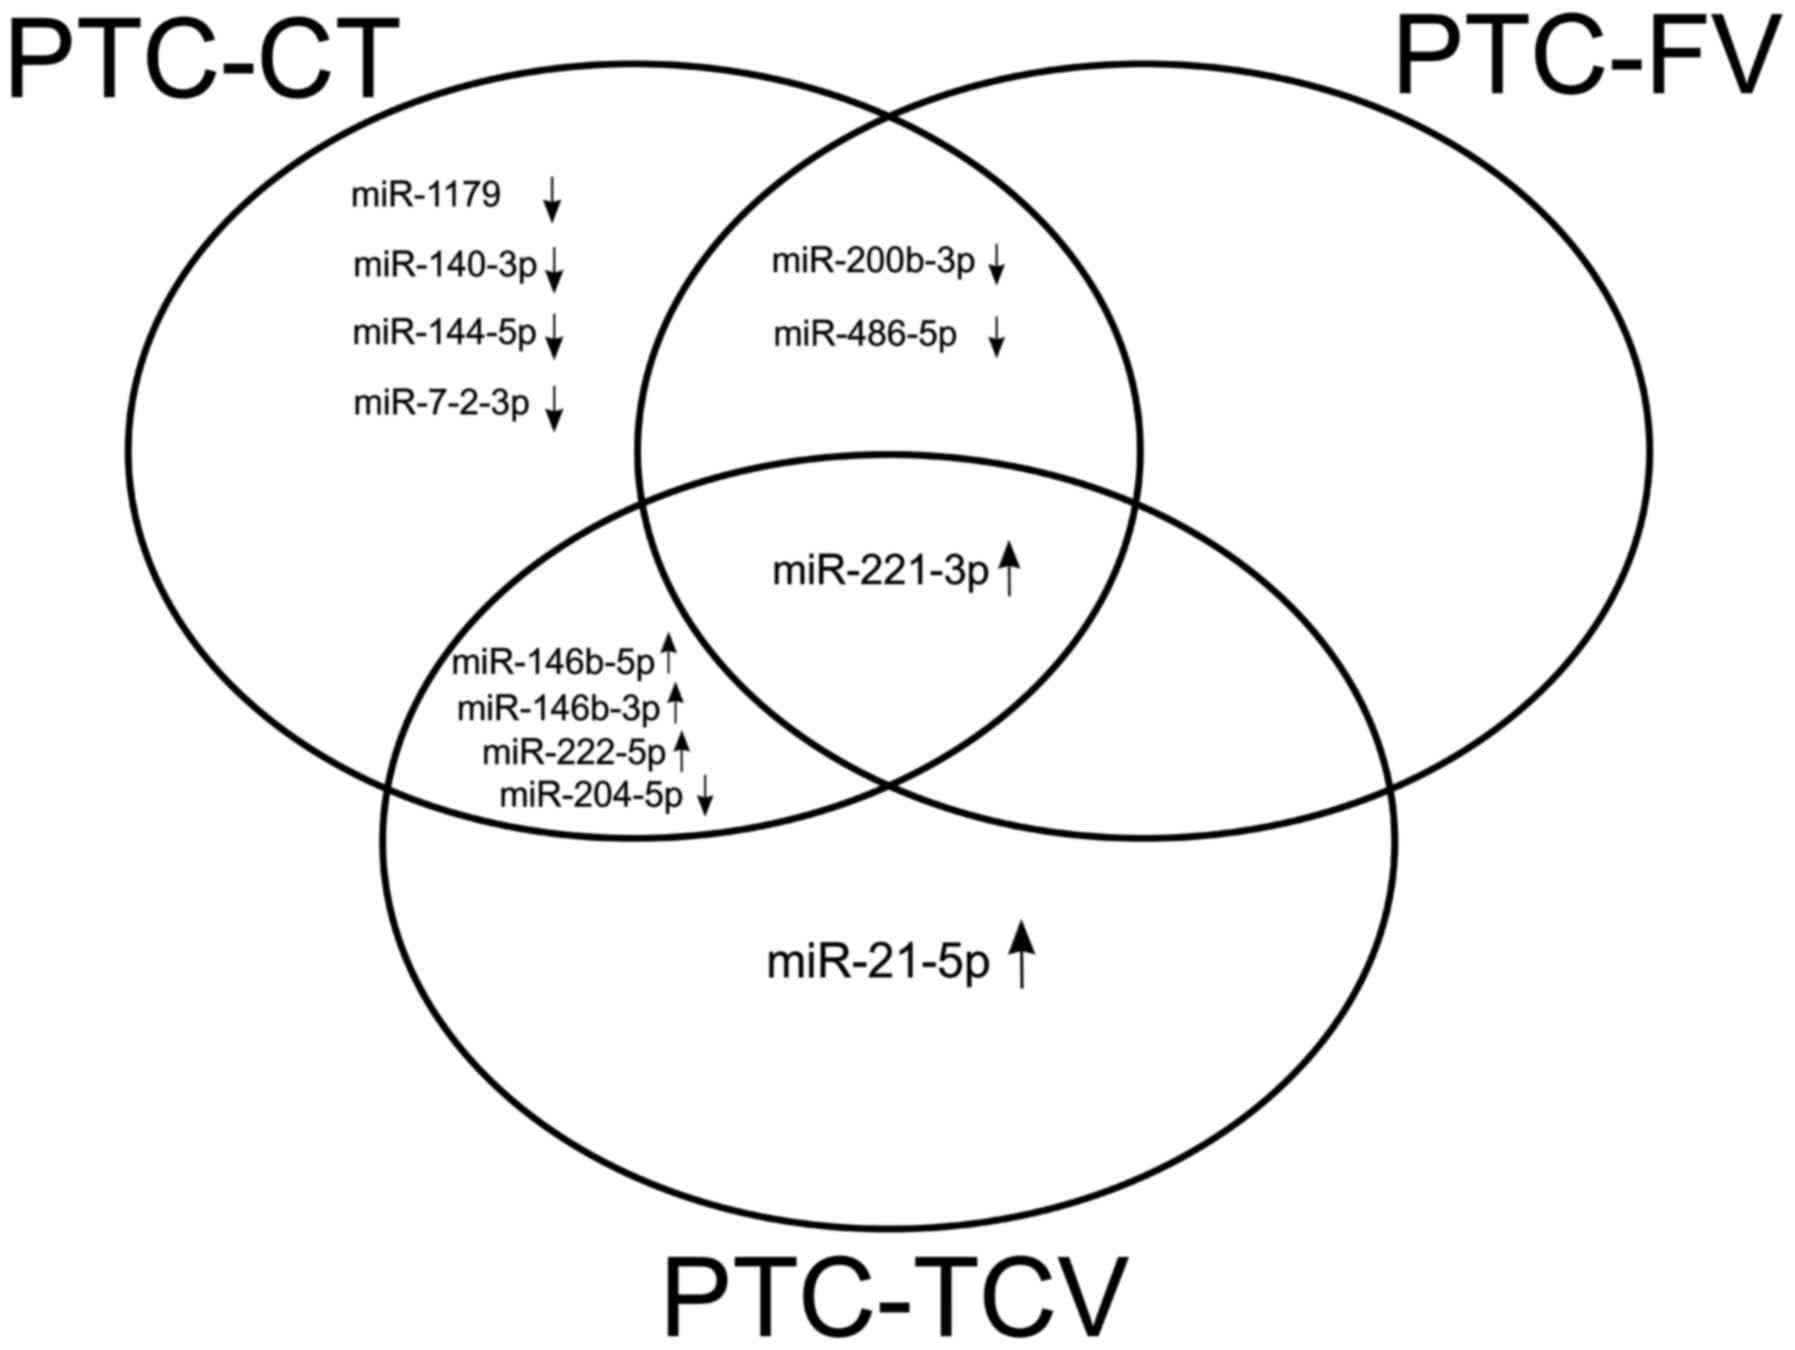
As shown in Fig. 3,
certain dysregulation appeared to be histotype-specific, such as
the significantly upregulated expression of miR-21-5p, which was
found exclusively in PTC-TCV, and the significant downregulation of
miR-1179, miR-140-3p, miR-144-5p and miR-7-2-3p, which appeared to
be specific to PTC-CT. miR-221-3p was the only miRNA that was
significantly dysregulated in all three histotypes.
Quantitatively speaking, there were no significant
differences between PTC-CT and PTC-TCV in the expression of any of
the miRNAs (Table V). Conversely,
three miRNAs (miR-146b-5p, miR-146b-3p and miR-204-5p) displayed
expression levels in PTCs-FV that were significantly different from
those observed in both PTC-CT and PTC-TCV (Fig. 4A). Of note, all three of these
miRNAs were expressed in PTC-FV at levels similar to those found in
normal thyroid tissue (Fig.
4A).
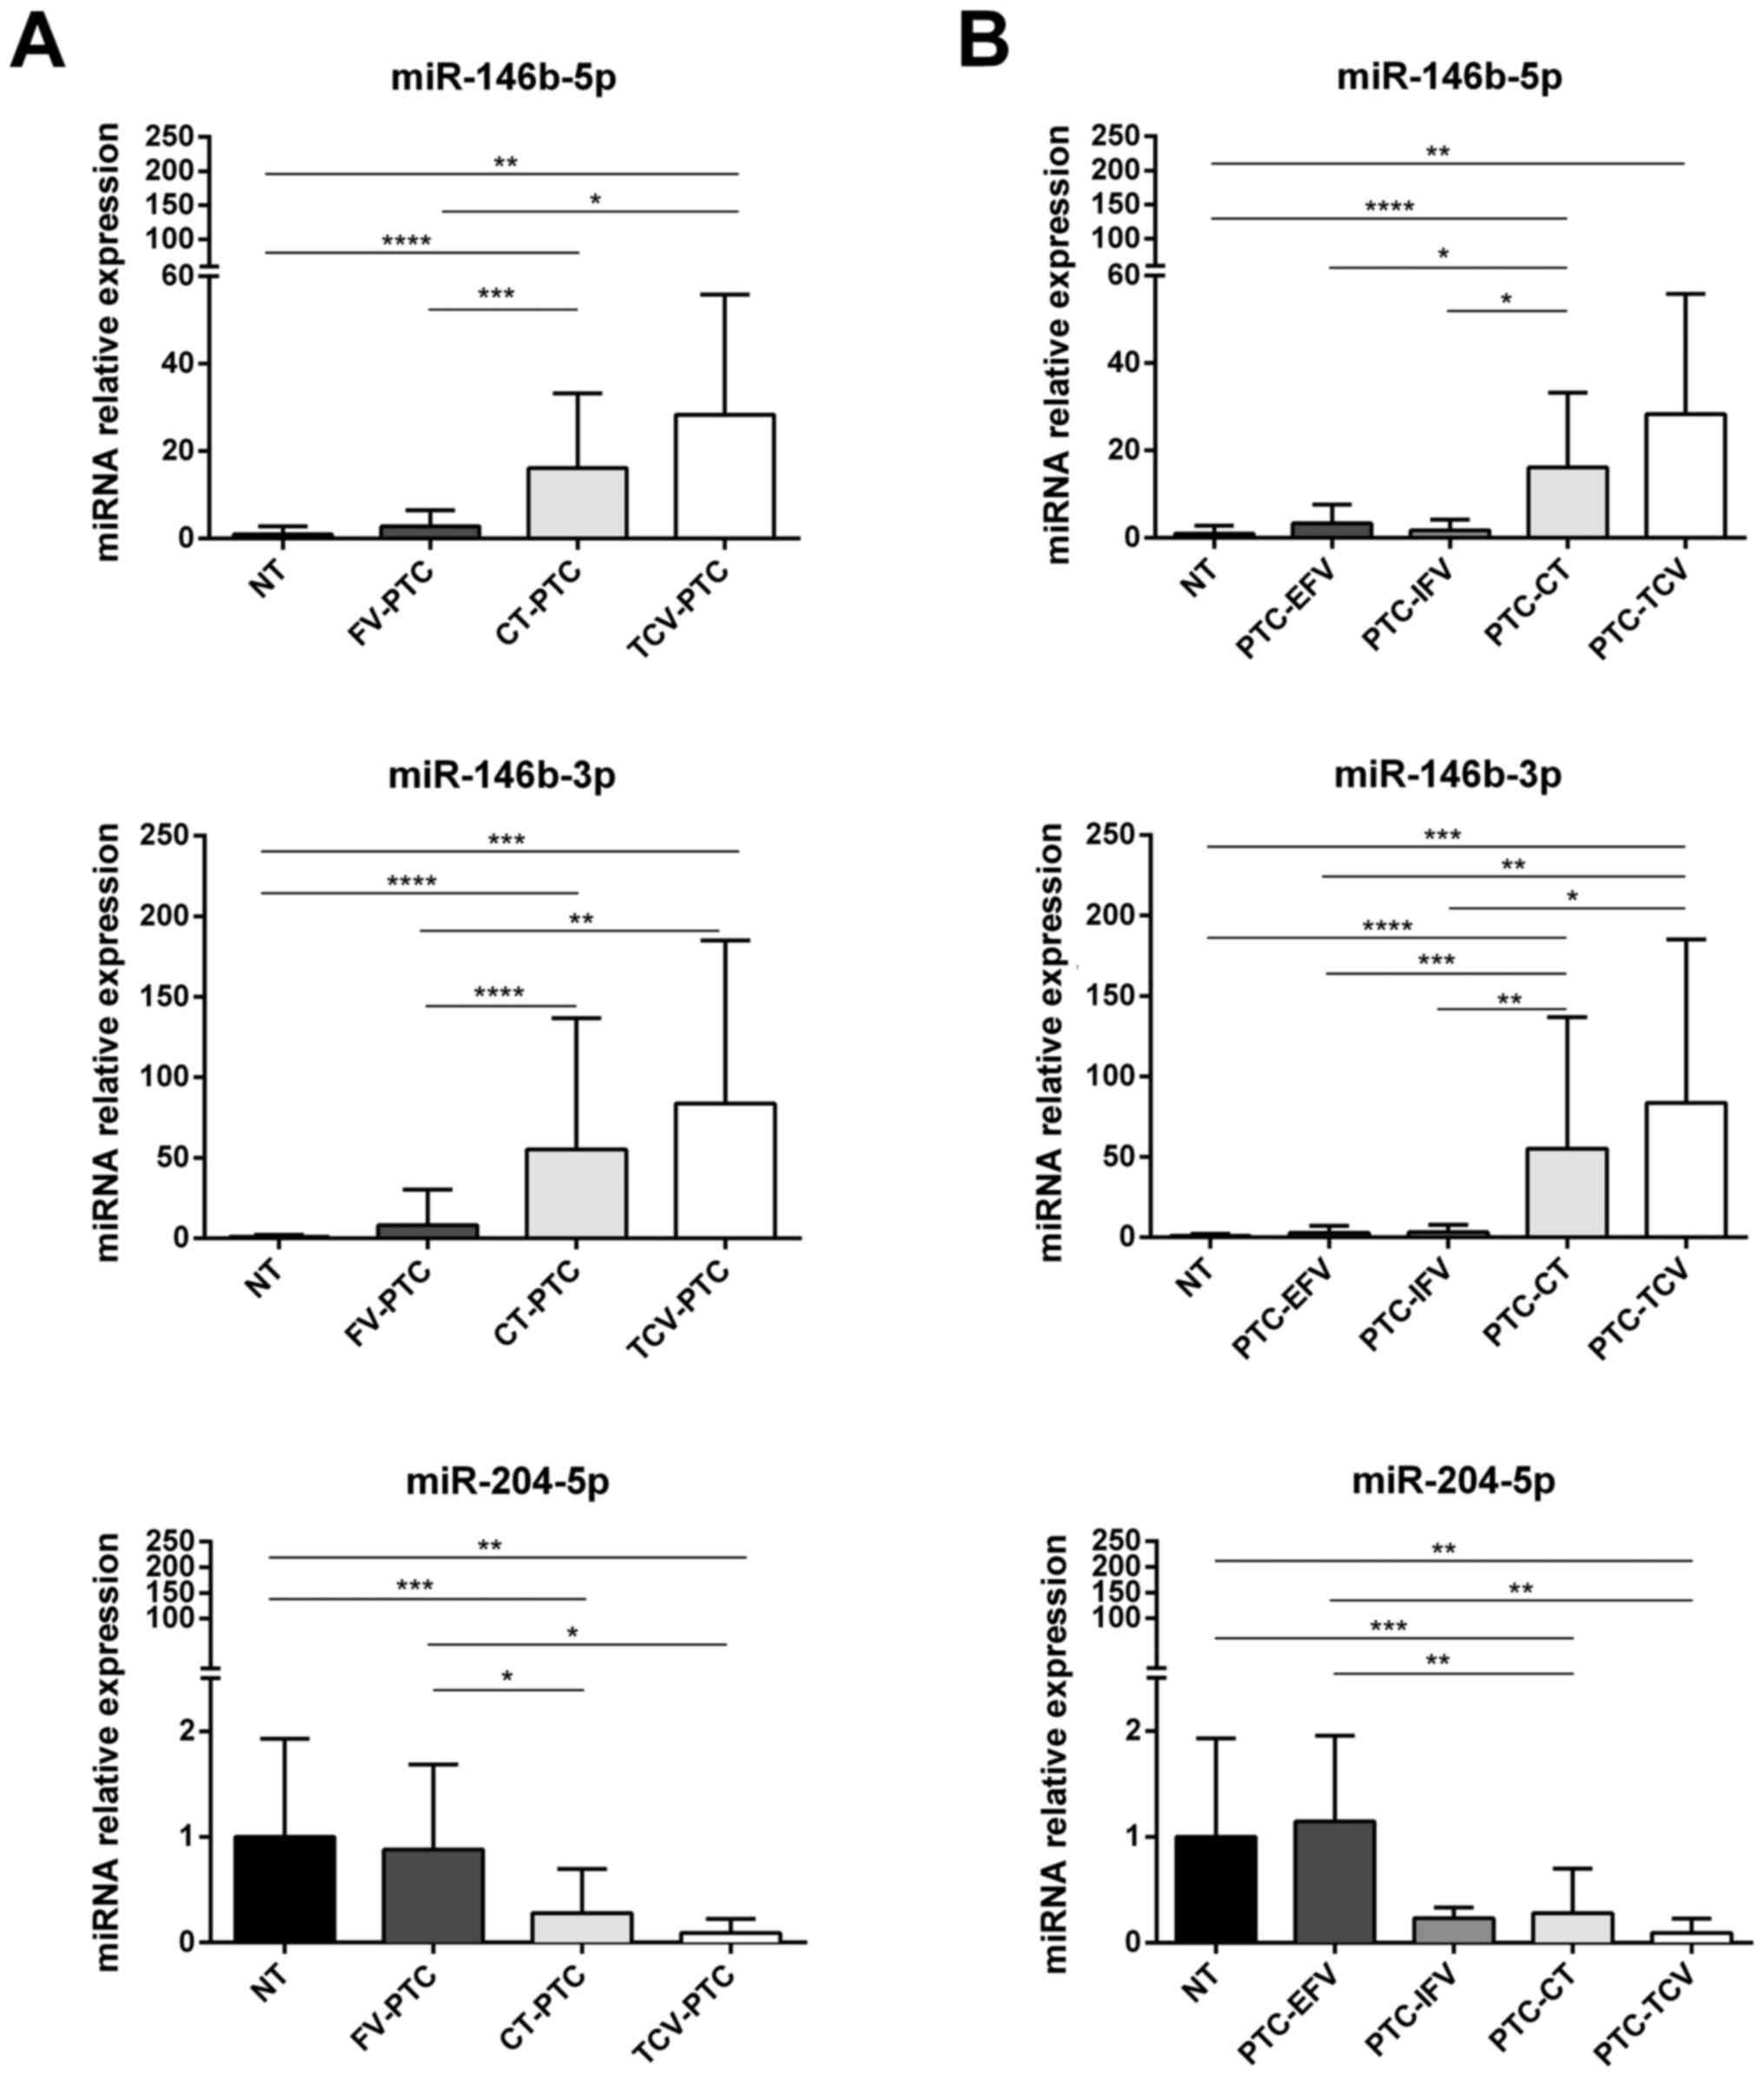 | Figure 4miRNAs differentially expressed in
histological subtypes of PTC from the validation cohort. Expression
of miR-146b-5p, miR-146b-3p and miR-204-5p in samples of normal
thyroid tissue (NT, n=24) vs. different histotypes of PTC (n=74).
(A) Comparison of NT levels with those found in follicular variant
(PTC-FV, n=20), classical type (PTC-CT, n=47), and tall-cell
variant (PTC-TCV, n=7); (B) Expression levels of each miRNA shown
in (A) for NT, PTC-CT, and PTC-TCV are compared with those found in
encapsulated and infiltrative subtypes of follicular variant PTCs
[PTC-EFV (n=14) and PTC-IFV (n=6), respectively]. miRNA expression
levels are reported as mean expression value of each PTC variant
normalized to mean expression of NT (equal to 1). Error bars
represent standard deviation. P-values were obtained by using
Kruskal-Wallis test followed by Dunn's multiple comparisons test:
*P<0.05, **P<0.01, ***P<0.001. NS,
not significant. |
Subclassification of PTC-FV into encapsulated
(PTC-EFV) and infiltrative (PTC-IFV) forms showed that the
expression of miR-204-5p in PTC-EFV was similar to that of normal
tissue, whereas lower levels were found in all PTC variants,
including PTC-IFV (Fig. 4B).
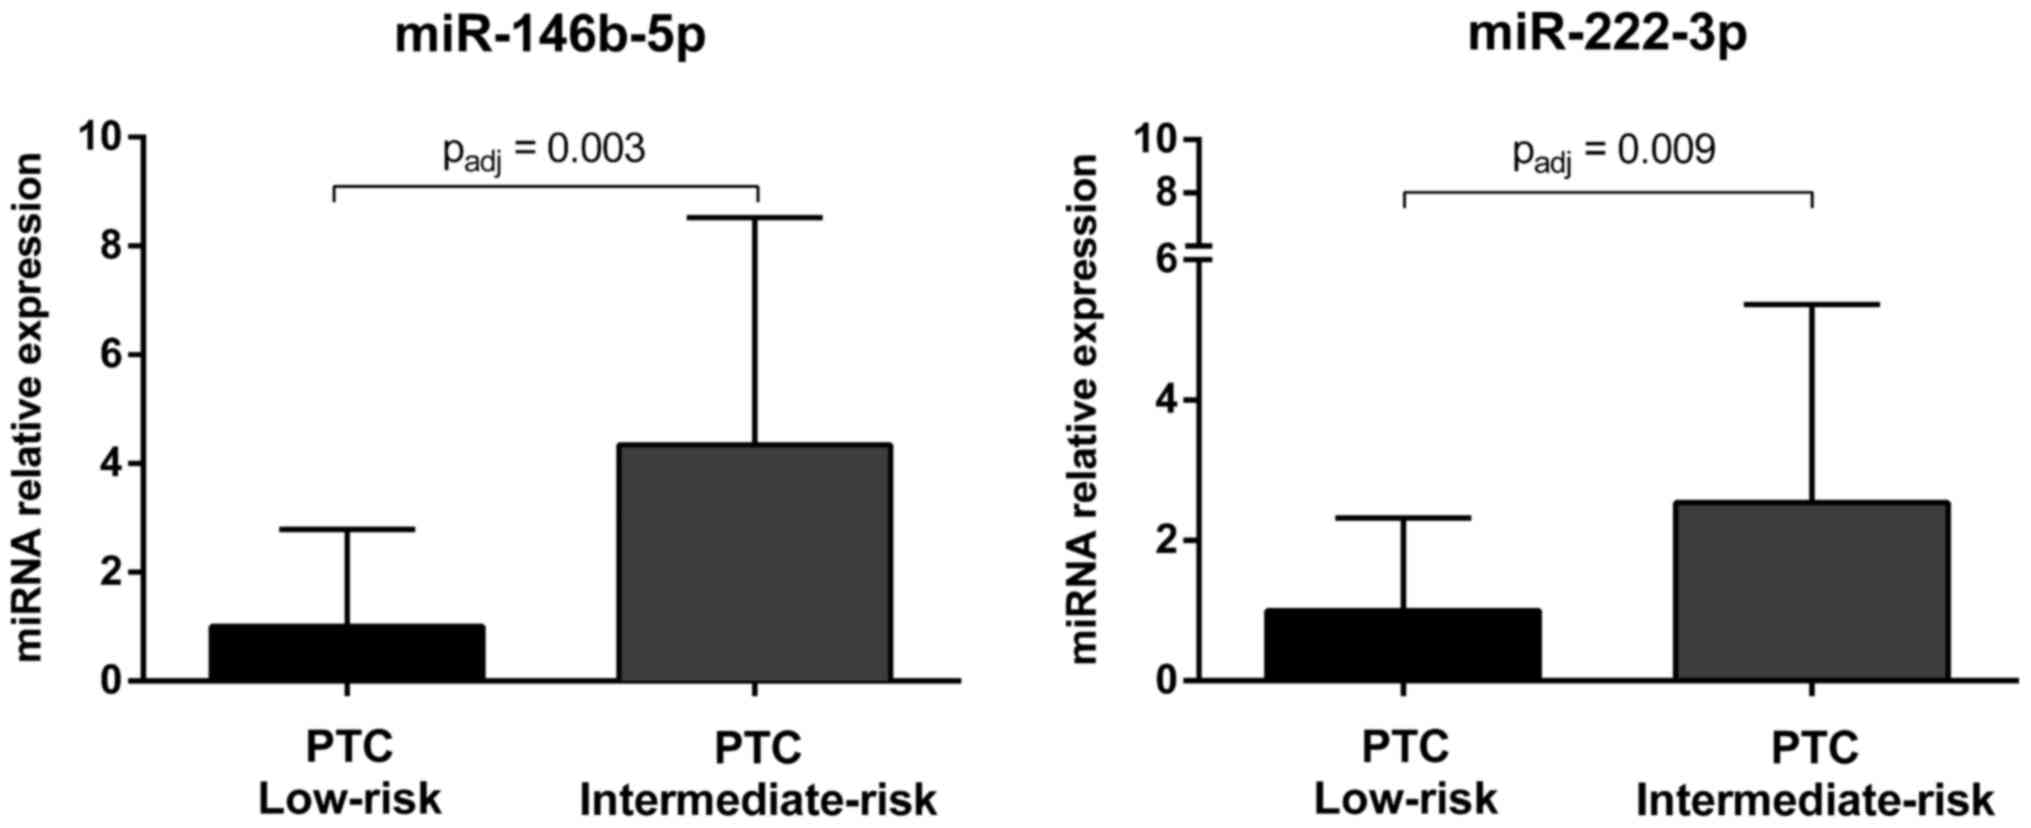
miRNAs associated with risk of tumor
recurrence
The 30 miRNAs selected for the validation analysis
were further analyzed in low-risk PTCs and intermediate-risk PTCs
and a signature of nine miRNAs (i.e., miR-146b-5p, miR-21-5p,
miR-222-3p, miR-31-5p, miR-199a-3p/miR-199b-3p, miR-146b-3p,
miR-1179, miR-7-2-3p and miR-204-5p) was identified to be
associated with a higher risk of tumor recurrence (Table VI). After Bonferroni correction,
the expression of miR-146b-5p and miR-222-3p was still
significantly upregulated in intermediate-risk PTCs as compared to
low-risk tumors (Fig. 5).
| Table VImiRNAs that were differentially
expressed in intermediate and low-risk PTCs from cohort II. |
Table VI
miRNAs that were differentially
expressed in intermediate and low-risk PTCs from cohort II.
| Low risk
(n=33) | Intermediate risk
(n=43) | P-valuea | P-value adjb |
|---|
|
hsa-miR-146b-5p | 1
(0.005–8.793) | 4.346
(0.054–16.620) | <0.0001 | 0.0030 |
| hsa-miR-21-5p | 1
(0.012–4.775) | 3.053
(0.019–23.240) | 0.0152 | NS |
| hsa-miR-222-3p | 1
(0.021–6.368) | 2.541
(0.069–15.210) | 0.0003 | 0.0090 |
| hsa-miR-31-5p | 1
(0.184–4.029) | 2.192
(0.019–6.297) | 0.0034 | NS |
|
hsa-miR-199a-3p/hsa-miR-199b-3p | 1
(0.084–4.248) | 1.577
(0.069–5.569) | 0.0131 | NS |
|
hsa-miR-146b-3p | 1
(0.001–7.784) | 1.421
(0.018–11.210) | 0.0077 | NS |
| hsa-miR-1179 | 1
(0.006–3.802) | 0.427
(0.017–2.592) | 0.0388 | NS |
| hsa-miR-7-2-3p | 1
(0.003–5.557) | 0.384
(0.009–1.543) | 0.0254 | NS |
| hsa-miR-204-5p | 1
(0.006–3.160) | 0.297
(0.006–1.599) | 0.0128 | NS |
Discussion
The majority of PTCs display indolent behavior and
have an excellent prognosis (2),
although certain histological subtypes of PTC are associated with
aggressive clinicopathological features and poor outcomes (3,4).
Risk stratification is essential to avoid overtreatment of the
indolent forms and to provide adequate management for the rare
aggressive variants. However, reliable biomarkers for this purpose
are currently lacking. MicroRNA expression is frequently
dysregulated in cancer cells (9).
The high stability of microRNAs in paraffin- embedded tissues
(10) and body fluids (11) makes them excellent candidates as
biomarkers for many cancers, including PTC (5,12).
In the present study, we identified an 11-miRNA signature for PTC
(miR-146b-5p, miR-146b-3p, miR-221-3p, miR-222-5p, miR-222-3p,
miR-1179, miR-486-5p, miR-204-5p, miR-7-2-3p, miR-144-5p and
miR-140-3p) (Fig. 2), and two of
the 11 (miR-146b-5p and miR-222-3p) were also significantly
associated with an increased risk of recurrence (Fig. 5). Overall, these findings confirm
the results obtained in earlier studies (5,29–31),
as the downregulation of miR-1179 and miR-7-2-3p which were only
marginally reported in literature (32,33).
The 11 miRNAs mentioned above could be further investigated as
diagnostic and prognostic tools for improving the accuracy of
preoperative diagnosis of PTC, which currently results
indeterminate in ≤20% of cases (19), and for informing decisions on the
extent of surgery.
Differential diagnosis of PTC histological variants
is also an important challenge since they differ considerably in
terms of genetic background, prognosis, and response to surgical
and medical treatment (5). To
identify miRNAs capable of discriminating between the main
histological variants of PTC, we analyzed the expression of 30
selected miRNAs in 74 PTCs from the validation cohort, which
included 47 PTC-CT, 20 PTC-FV, and 7 PTC-TCV. In addition, since
the prognosis of PTC-FV varies considerably depending on whether
the tumor is completely encapsulated or infiltrative (34), we also explored miRNA expression in
these two PTC-FV subgroups (PTC-EFV, n=14, PTC-IFV, n=6). We found
that the expression of miR-146b-5p and miR-146b-3p was upregulated
in both PTC-CT and PTC-TCV, whereas their levels in PTC-FV (both
encapsulated and infiltrative subtypes) were similar to those found
in normal thyroid tissues (Fig.
4A). As for miR-204-5p, it was downregulated with respect to
normal tissue in all PTC histotypes except PTC-EFV (Fig. 4B). In pairwise comparisons,
miR-204-5p expression displayed no significant differences between
PTC-IFV and normal tissue or between PTC-IFV and PTC-EFV. However,
the possibility that miR-204-5p expression is selectively
downregulated in the infiltrative subtype of PTC-FV warrants
further investigation because this miRNA could be a promising and
independent predictor of capsular invasion in PTC-FV. The fact that
miR-21-5p was significantly upregulated only in the tall-cell
variant PTC is also of interest since this miR might be used as a
potential tool for improving the differential diagnosis of this
aggressive but under-diagnosed PTC variant (8). The differential expression of
miR-146b-5p, miR-146b-3p, and miR-21-5p has been reported in the
main PTC histotypes (i.e., PTC-CT, PTC-FV and PTC-TCV) (35). As for the FV subtypes, the PTC-FV
studied by Sheu and coworkers were all encapsulated tumors.
Recently, however, Borrelli et al (36) have identified a miRNA signature
that distinguishes encapsulated and infiltrative forms of PTC-FV,
although downregulation of miR-204-5p expression in PTC-IFV was not
one of the discriminating components of this signature.
In conclusion, this study provides new insights into
the molecular underpinning of PTC, highlighting dysregulated
expression of several miRNAs that distinguish these cancers from
normal thyroid tissue and in some cases display intriguing
associations with clinicopathological features of PTCs. The
subcohorts of PTCs defined by histotype were admittedly small,
especially those of PTC-TCV, PTC-EFV, and PTC-IFV. These
preliminary findings need to be confirmed by studies on larger
cohorts, which might also reveal additional miRNAs that are
differentially expressed in PTC variants. It is also important to
recall that all of our experiments were conducted on thyroid
tissues from patients who underwent total thyroidectomy. Therefore,
to assess their actual value in the context of preoperative
diagnosis, our findings will need to be validated in fine needle
aspirates from patients with PTCs.
Abbreviations:
|
miRNA
|
microRNA
|
|
PTC
|
papillary thyroid carcinoma
|
|
PTC-CT
|
classical type
|
|
PTC-FV
|
follicular variant
|
|
PTC-TCV
|
tall cell variant
|
|
PTC-EFV
|
encapsulated follicular variant
|
|
PTC-IFV
|
infiltrative follicular variant
|
Acknowledgments
This study was supported by the Umberto Di Mario
Foundation, the 'Sapienza' University of Rome (grants C26A13C8C7
and C26A15Z4JM to C.D.). G.G., L.L. and V.P. contributed to this
report as recipient of the PhD program of Biotechnologies and
Clinical Medicine of the University of Rome, Sapienza. Writing
support was provided by Marian Everett Kent, BSN (European Medical
Writers Association) and funded by the Umberto Di Mario
Foundation.
References
|
1
|
Davies L and Welch HG: Current thyroid
cancer trends in the United States. JAMA Otolaryngol Head Neck
Surg. 140:317–322. 2014. View Article : Google Scholar : PubMed/NCBI
|
|
2
|
Hay ID, Thompson GB, Grant CS, Bergstralh
EJ, Dvorak CE, Gorman CA, Maurer MS, McIver B, Mullan BP, Oberg AL,
et al: Papillary thyroid carcinoma managed at the Mayo Clinic
during six decades (1940–1999): Temporal trends in initial therapy
and long-term outcome in 2444 consecutively treated patients. World
J Surg. 26:879–885. 2002. View Article : Google Scholar : PubMed/NCBI
|
|
3
|
Lam AK-Y, Lo C-Y and Lam KS-L: Papillary
carcinoma of thyroid: A 30-yr clinicopathological review of the
histological variants. Endocr Pathol. 16:323–330. 2005. View Article : Google Scholar
|
|
4
|
Shi X, Liu R, Basolo F, Giannini R, Shen
X, Teng D, Guan H, Shan Z, Teng W, Musholt TJ, et al: Differential
clinicopathological risk and prognosis of major papillary thyroid
cancer variants. J Clin Endocrinol Metab. 101:264–274. 2016.
View Article : Google Scholar :
|
|
5
|
Agrawal N, Akbani R, Aksoy BA, Ally A,
Arachchi H, Asa SL, Auman JT, Balasundaram M, Balu S, Baylin SB, et
al Cancer Genome Atlas Research Network: Integrated genomic
characterization of papillary thyroid carcinoma. Cell. 159:676–690.
2014. View Article : Google Scholar :
|
|
6
|
Lawrence MS, Stojanov P, Polak P, Kryukov
GV, Cibulskis K, Sivachenko A, Carter SL, Stewart C, Mermel CH,
Roberts SA, et al: Mutational heterogeneity in cancer and the
search for new cancer-associated genes. Nature. 499:214–218. 2013.
View Article : Google Scholar : PubMed/NCBI
|
|
7
|
Elsheikh TM, Asa SL, Chan JKC, DeLellis
RA, Heffess CS, LiVolsi VA and Wenig BM: Interobserver and
intraobserver variation among experts in the diagnosis of thyroid
follicular lesions with borderline nuclear features of papillary
carcinoma. Am J Clin Pathol. 130:736–744. 2008. View Article : Google Scholar : PubMed/NCBI
|
|
8
|
Ghossein R and Livolsi VA: Papillary
thyroid carcinoma tall cell variant. Thyroid. 18:1179–1181. 2008.
View Article : Google Scholar : PubMed/NCBI
|
|
9
|
Lu J, Getz G, Miska EA, Alvarez-Saavedra
E, Lamb J, Peck D, Sweet-Cordero A, Ebert BL, Mak RH, Ferrando AA,
et al: MicroRNA expression profiles classify human cancers. Nature.
435:834–838. 2005. View Article : Google Scholar : PubMed/NCBI
|
|
10
|
Hall JS, Taylor J, Valentine HR, Irlam JJ,
Eustace A, Hoskin PJ, Miller CJ and West CM: Enhanced stability of
microRNA expression facilitates classification of FFPE tumour
samples exhibiting near total mRNA degradation. Br J Cancer.
107:684–694. 2012. View Article : Google Scholar : PubMed/NCBI
|
|
11
|
Mitchell PS, Parkin RK, Kroh EM, Fritz BR,
Wyman SK, Pogosova-Agadjanyan EL, Peterson A, Noteboom J, O'Briant
KC, Allen A, et al: Circulating microRNAs as stable blood-based
markers for cancer detection. Proc Natl Acad Sci USA.
105:10513–10518. 2008. View Article : Google Scholar : PubMed/NCBI
|
|
12
|
Rosignolo F, Sponziello M, Giacomelli L,
Russo D, Pecce V, Biffoni M, Bellantone R, Lombardi CP, Lamartina
L, Grani G, et al: Identification of thyroid-associated serum
microRNA profiles and their potential use in thyroid cancer
follow-up. J Endocr Soc. 1:3–13. 2017.
|
|
13
|
Saiselet M, Pita JM, Augenlicht A, Dom G,
Tarabichi M, Fimereli D, Dumont JE, Detours V and Maenhaut C: miRNA
expression and function in thyroid carcinomas: A comparative and
critical analysis and a model for other cancers. Oncotarget.
7:52475–52492. 2016.PubMed/NCBI
|
|
14
|
Swierniak M, Wojcicka A, Czetwertynska M,
Stachlewska E, Maciag M, Wiechno W, Gornicka B, Bogdanska M,
Koperski L, de la Chapelle A, et al: In-depth characterization of
the microRNA transcriptome in normal thyroid and papillary thyroid
carcinoma. J Clin Endocrinol Metab. 98:E1401–E1409. 2013.
View Article : Google Scholar : PubMed/NCBI
|
|
15
|
Huang Y, Liao D, Pan L, Ye R, Li X, Wang
S, Ye C and Chen L: Expressions of miRNAs in papillary thyroid
carcinoma and their associations with the BRAFV600E mutation. Eur J
Endocrinol. 168:675–681. 2013. View Article : Google Scholar : PubMed/NCBI
|
|
16
|
Hu Y, Wang H, Chen E, Xu Z, Chen B and Lu
G: Candidate microRNAs as biomarkers of thyroid carcinoma: A
systematic review, meta-analysis, and experimental validation.
Cancer Med. 5:2602–2614. 2016. View
Article : Google Scholar : PubMed/NCBI
|
|
17
|
Aragon Han P, Weng C-H, Khawaja HT,
Nagarajan N, Schneider EB, Umbricht CB, Witwer KW and Zeiger MA:
MicroRNA expression and association with clinicopathologic features
in papillary thyroid cancer: A systematic review. Thyroid.
25:1322–1329. 2015. View Article : Google Scholar : PubMed/NCBI
|
|
18
|
Dettmer M, Perren A, Moch H, Komminoth P,
Nikiforov YE and Nikiforova MN: Comprehensive MicroRNA expression
profiling identifies novel markers in follicular variant of
papillary thyroid carcinoma. Thyroid. 23:1383–1389. 2013.
View Article : Google Scholar : PubMed/NCBI
|
|
19
|
Haugen BR, Alexander EK, Bible KC, Doherty
GM, Mandel SJ, Nikiforov YE, Pacini F, Randolph GW, Sawka AM,
Schlumberger M, et al: 2015 American Thyroid Association management
guidelines for adult patients with thyroid nodules and
differentiated thyroid cancer: The American Thyroid Association
guidelines task force on thyroid nodules and differentiated thyroid
cancer. Thyroid. 26:1–133. 2016. View Article : Google Scholar :
|
|
20
|
Rosignolo F, Maggisano V, Sponziello M,
Celano M, Di Gioia CR, D'Agostino M, Giacomelli L, Verrienti A,
Dima M, Pecce V, et al: Reduced expression of THRβ in papillary
thyroid carcinomas: Relationship with BRAF mutation, aggressiveness
and miR expression. J Endocrinol Invest. 38:1283–1289. 2015.
View Article : Google Scholar : PubMed/NCBI
|
|
21
|
Sponziello M, Lavarone E, Pegolo E, Di
Loreto C, Puppin C, Russo MA, Bruno R, Filetti S, Durante C, Russo
D, et al: Molecular differences between human thyroid follicular
adenoma and carcinoma revealed by analysis of a murine model of
thyroid cancer. Endocrinology. 154:3043–3053. 2013. View Article : Google Scholar : PubMed/NCBI
|
|
22
|
R Development Core Team: R: A language and
environment for statistical computing. R Foundation for Statistical
Computing; Vienna: URL http://www.R-project.org/.
|
|
23
|
Wright SP: Adjusted P-values for
simultaneous inference. Biometrics. 48:1005–1013. 1992. View Article : Google Scholar
|
|
24
|
Pencheva N, Tran H, Buss C, Huh D,
Drobnjak M, Busam K and Tavazoie SF: Convergent multi-miRNA
targeting of ApoE drives LRP1/LRP8-dependent melanoma metastasis
and angiogenesis. Cell. 151:1068–1082. 2012. View Article : Google Scholar : PubMed/NCBI
|
|
25
|
Dong W, Yao C, Teng X, Chai J, Yang X and
Li B: MiR-140–3p suppressed cell growth and invasion by
downregulating the expression of ATP8A1 in non-small cell lung
cancer. Tumour Biol. 37:2973–2985. 2016. View Article : Google Scholar
|
|
26
|
Liu R, Liu C, Zhang D, Liu B, Chen X,
Rycaj K, Jeter C, Calhoun-Davis T, Li Y, Yang T, et al: miR-199a-3p
targets stemness-related and mitogenic signaling pathways to
suppress the expansion and tumorigenic capabilities of prostate
cancer stem cells. Oncotarget. 7:56628–56642. 2016.PubMed/NCBI
|
|
27
|
Kinose Y, Sawada K, Nakamura K, Sawada I,
Toda A, Nakatsuka E, Hashimoto K, Mabuchi S, Takahashi K, Kurachi
H, et al: The hypoxia-related microRNA miR-199a-3p displays tumor
suppressor functions in ovarian carcinoma. Oncotarget.
6:11342–11356. 2015. View Article : Google Scholar : PubMed/NCBI
|
|
28
|
Minna E, Romeo P, De Cecco L, Dugo M,
Cassinelli G, Pilotti S, Degl'Innocenti D, Lanzi C, Casalini P,
Pierotti MA, et al: miR-199a-3p displays tumor suppressor functions
in papillary thyroid carcinoma. Oncotarget. 5:2513–2528. 2014.
View Article : Google Scholar : PubMed/NCBI
|
|
29
|
Chou C-K, Chen R-F, Chou F-F, Chang HW,
Chen YJ, Lee YF, Yang KD, Cheng JT, Huang CC and Liu RT: miR-146b
is highly expressed in adult papillary thyroid carcinomas with high
risk features including extrathyroidal invasion and the BRAF
(V600E) mutation. Thyroid. 20:489–494. 2010. View Article : Google Scholar : PubMed/NCBI
|
|
30
|
Mardente S, Mari E, Consorti F, Di Gioia
C, Negri R, Etna M, Zicari A and Antonaci A: HMGB1 induces the
overexpression of miR-222 and miR-221 and increases growth and
motility in papillary thyroid cancer cells. Oncol Rep.
28:2285–2289. 2012.PubMed/NCBI
|
|
31
|
Qiu YH, Wei YP, Shen NJ, Wang ZC, Kan T,
Yu WL, Yi B and Zhang YJ: miR-204 inhibits epithelial to
mesenchymal transition by targeting slug in intrahepatic
cholangiocarcinoma cells. Cell Physiol Biochem. 32:1331–1341. 2013.
View Article : Google Scholar : PubMed/NCBI
|
|
32
|
Mancikova V, Castelblanco E, Pineiro-Yanez
E, Perales-Paton J, de Cubas AA, Inglada-Perez L, Matias-Guiu X,
Capel I, Bella M, Lerma E, et al: MicroRNA deep-sequencing reveals
master regulators of follicular and papillary thyroid tumors. Mod
Pathol. 28:748–757. 2015. View Article : Google Scholar : PubMed/NCBI
|
|
33
|
Saiselet M, Gacquer D, Spinette A, Craciun
L, Decaussin-Petrucci M, Andry G, Detours V and Maenhaut C: New
global analysis of the microRNA transcriptome of primary tumors and
lymph node metastases of papillary thyroid cancer. BMC Genomics.
16:8282015. View Article : Google Scholar : PubMed/NCBI
|
|
34
|
Nikiforov YE, Seethala RR, Tallini G,
Baloch ZW, Basolo F, Thompson LD, Barletta JA, Wenig BM, Al Ghuzlan
A, Kakudo K, et al: Nomenclature revision for encapsulated
follicular variant of papillary thyroid carcinoma: A paradigm shift
to reduce overtreatment of indolent tumors. JAMA Oncol.
2:1023–1029. 2016. View Article : Google Scholar : PubMed/NCBI
|
|
35
|
Sheu S-Y, Grabellus F, Schwertheim S, Worm
K, Broecker-Preuss M and Schmid KW: Differential miRNA expression
profiles in variants of papillary thyroid carcinoma and
encapsulated follicular thyroid tumours. Br J Cancer. 102:376–382.
2010. View Article : Google Scholar :
|
|
36
|
Borrelli N, Denaro M, Ugolini C, Poma AM,
Miccoli M, Vitti P, Miccoli P and Basolo F: miRNA expression
profiling of 'noninvasive follicular thyroid neoplasms with
papillary-like nuclear features' compared with adenomas and
infiltrative follicular variants of papillary thyroid carcinomas.
Mod Pathol. 30:39–51. 2017. View Article : Google Scholar
|