Introduction
Small bowel adenocarcinoma (SBAC) accounts for 3% of
all gastrointestinal tract tumors and approximately 0.5% of all
cancers. There are approximately 10,090 new cases and 1,330 deaths
from SBAC annually in the USA (1).
A diagnosis of SBAC is often difficult because of its rarity and
the non-specificity of the presenting signs and symptoms.
Therefore, the disease tends to remain undiagnosed until it reaches
an advanced stage, which is associated with a poor prognosis. The
majority of patients with SBAC are in stage III or IV at diagnosis
(26 and 32% of patients, respectively), and the 5-year
disease-specific survival of stage III and IV patients is 35 and
4%, respectively (2).
Unfortunately, there is no standard chemotherapy for advanced-stage
SBAC because of the absence of randomized trials comparing
different chemotherapy regimens. Therefore, novel therapeutic
approaches are needed for advanced SBAC to overcome and improve the
prognosis of SBAC patients.
Metformin is an oral biguanide drug; it is one of
the most commonly prescribed antidiabetic drugs and was introduced
into clinical practice in the 1950s for the treatment of type 2
diabetes (3). Metformin reduces
blood glucose levels by inhibiting hepatic gluconeogenesis.
Previously, retrospective epidemiologic studies reported that the
use of metformin decreases cancer incidence (4,5).
Additionally, it reduces the risk of all cancers and contributes to
lower cancer mortality (6–9) among patients with concurrent diabetes
and cancer. Moreover, basic studies in vitro and in
vivo have suggested the antitumor effects of metformin in
various cancerous cells, such as those of prostate, breast, colon,
stomach, esophagus, pancreas and liver (10–17).
The antitumor effect of metformin is due to several mechanisms,
including activation of the LKB1/AMPK pathway (12,18),
induction of cell cycle arrest (10–14)
and apoptosis (16), inhibition of
the unfolded protein response, inhibition of protein synthesis,
reduction in circulating insulin levels, activation of the immune
system and eradication of cancer stem cells (18). In particular, the activation of the
LKB1/AMPK pathway leads to the inhibition of mammalian target of
rapamycin (mTOR), which decreases protein synthesis in cancer cells
(18). Furthermore, metformin has
been shown to affect microRNA (miRNA) expression in certain
cancers; these miRNAs can function as either oncogenes or tumor
suppressors (19). However, the
therapeutic potential of metformin in cancer cell proliferation and
tumor growth of SBAC is not well known.
In the present study, we demonstrated the antitumor
effects of metformin in a human SBAC cell line and found that these
effects were associated with cell cycle arrest by reducing cell
cycle-related molecules. Moreover, we evaluated the expression of
miRNAs related to the antitumor effect of metformin. These results
suggest that metformin may provide a novel therapeutic approach for
SBAC.
Materials and methods
Cell lines, reagents and antibodies
The human SBAC cell line HuTu80 was purchased from
the American Type Culture Collection (ATCC; Manassas, VA, USA). The
cells were cultured in Dulbecco's modified Eagle's medium (DMEM;
Gibco-Invitrogen, Carlsbad, CA, USA) supplemented with 10% fetal
bovine serum (FBS) (533-69545; Wako, Osaka, Japan), and
penicillin/streptomycin (100 mg/l; Invitrogen, Tokyo, Japan) in a
5% CO2 atmosphere at 37°C.
Metformin (1,1-dimethylbiguanide monohydrochloride)
was purchased from Astellas Pharma, Inc. (Tokyo, Japan). Cell
Counting kit (CCK)-8 was purchased from Dojindo Laboratories
(Kumamoto, Japan).
The following antibodies were used: β-actin
(Sigma-Aldrich, St. Louis, MO, USA; A5441); cyclin D1 (RB-9041),
cyclin E (MS-870-p1) (Thermo Fisher Scientific, Waltham, MA, USA);
Cdk2 (sc-163), Cdk4 (sc-749), Cdk6 (sc-177), retinoblastoma protein
(Rb) (sc-50) (Santa Cruz Biotechnology, Santa Cruz, CA, USA);
phosphorylated retinoblastoma protein (pRb) (BD Biosciences, San
Jose, CA, USA; 558385); AMPKα (#5832), phosphorylated AMPKα Thr172
(#2535), mTOR (#2983), phosphorylated mTOR Ser2448 (#5536), p70s6k
(#2708), phosphorylated p70s6k Thr389 (#9205) (Cell Signaling
Technology, Danvers, MA, USA); and secondary horseradish
peroxidase-linked anti-mouse and anti-rabbit IgG antibodies (Cell
Signaling Technology; used at 1:2,000). Chemiluminescence reagents
for western blot imaging were purchased from Perkin-Elmer Inc.
(Waltham, MA, USA).
Cell proliferation assay
Cell proliferation assays were performed using CCK-8
according to the manufacturer's instructions. Cells (5,000/well)
were seeded into each well of a 96-well plate with 100 µl of
DMEM supplemented with 10% FBS. After 24 h, the cells were treated
with 0, 1, 5 or 10 mM metformin and then cultured for 24–72 h.
CCK-8 reagent (10 µl) was added to each well, and the cells
were incubated for 3 h. The absorbance was measured for each well
at a wavelength of 450 nm using an automicroplate reader.
Flow cytometric analysis
To evaluate the mechanism of growth inhibition by
metformin, cell cycle profiles were analyzed after treatment with
metformin. HuTu80 cells (1.0×10⁶ cells in a 100-mm dish)
were treated with or without 10 mM metformin for 24–72 h. The cell
cycle distribution was analyzed by measuring the amount of
propidium iodide (PI)-labeled DNA in ethanol-fixed cells.
The fixed cells were washed with phosphate-buffered
saline (PBS) and stored at −20°C until flow cytometric analysis was
performed. On the day of analysis, cells were washed and
centrifuged using cold PBS, suspended in 100 µl of PBS and
10 µl of RNase A solution (250 µg/ml) and incubated
for 30 min at 37°C. Then, 110 µl of PI stain (100
µg/ml) was added to each tube, and the tubes were incubated
at 4°C for at least 30 min prior to analysis. Flow cytometry was
performed by a Cytomics FC 500 flow cytometer (Beckman Coulter,
Brea, CA, USA) with an argon laser (488 nm). The percentages of
cells in different phases of the cell cycle were analyzed by FlowJo
software (Tree Star, Inc., Ashland, OR, USA). All experiments were
performed in triplicate to assess the consistency of the
response.
Gel electrophoresis and western blot
analysis
HuTu80 cells treated (or not) with 10 mM metformin
were cultured for 24–72 h. The cells were lysed in lysis buffer
(PRO-PREP; Intron Biotechnology, Inc., Seongnam, Korea). The cell
lysate was centrifuged at 13,000 × g at 4°C for 5 min, and the
remnant was removed. The protein concentrations were analyzed by a
NanoDrop 2000 fluorospectrometer (Thermo Fisher Scientific). After
adding 2X SDS sample buffer, the samples were heated to 95–100°C
for 5 min and then cooled on ice. The samples were electrophoresed
using 10% sodium dodecyl sulfate-polyacrylamide gels (SDS-PAGE)
(20), and the proteins were
transferred to nitrocellulose membranes. The membranes were
incubated with primary antibodies after blocking. Then, the
membranes were incubated with horseradish peroxidase-conjugated
secondary antibodies (21). The
immunoreactive proteins were visualized with an enhanced
chemiluminescence detection system (Perkin-Elmer Co., Waltham, MA,
USA) on X-ray film. All experiments were repeated three times.
Xenograft model analysis
Animal experiments were performed according to the
guidelines of the Committee on Experimental Animals of Kagawa
University (Kagawa, Japan). Male athymic mice (BALB/c-nu/nu; 6
weeks old; 20–25 g) were purchased from Japan SLC (Shizuoka,
Japan). The mice were maintained under specific pathogen-free
conditions using a laminar airflow rack. The animals had continuous
free access to sterilized food (gamma-ray-irradiated food, CL-2;
Clea Japan, Inc., Tokyo, Japan) and autoclaved water. A total of 16
mice were subcutaneously inoculated with HuTu80 cells
(5×10⁶ cells/animal) in the flank. Five days later, the
xenografts were identifiable as a 3-mm (maximum) diameter mass; the
mice were randomly subdivided into two groups of 8 mice. Then, 1
mg/body per day metformin was injected 5 times a week
intraperitoneally (i.p.) for 2 weeks in the metformin-treated
group. The control group was administered PBS alone for 2 weeks.
After the initiation of the metformin administration, tumor growth
was monitored daily by the same investigators (T. Chiyo and T.
Masaki). Tumor size was measured twice per week by measuring the
two largest perpendicular dimensions. The tumor volume was
calculated as follows: Tumor volume (mm3) = [tumor
length (mm) × tumor width (mm)2]/2 (22). All mice were sacrificed on day 15
after treatment. All animals were alive until this time.
Antibody arrays of phosphorylated
receptor tyrosine kinases (p-RTKs)
Human p-RTKs were assayed using Human Phospho-RTK
array kit (R&D Systems, Minneapolis, MN, USA) according to the
manufacturer's protocol. HuTu80 cells (1.0×10⁶ cells in
a 100-mm dish) were treated with or without 5 mM metformin for 48
h. P-RTK array membranes were blocked with 5% BSA/TBS (0.01 M
Tris-HCl, pH 7.6) for 1 h. The membranes were then incubated with 2
ml of lysate prepared from cell lines after normalization with
equal amounts of protein. After extensive washing with TBS
including 0.1% v/v Tween-20 (3 washings of 10 min each) and TBS
alone (2 washings of 10 min each) to remove unbound materials, the
membranes were incubated with anti-phospho-tyrosine-HRP antibody
for 2 h at room temperature. The unbound HRP antibody was washed
out with TBS including 0.1% Tween-20. Finally, the membranes were
exposed to X-ray film using a chemiluminescence detection system
(Perkin-Elmer).
Antibody array for angiogenesis
The RayBio Human Angiogenesis Antibody Array C1
(RayBiotech Inc., Norcross, GA, USA) was used according to the
manufacturer's protocol. HuTu80 cells (1.0×10⁶ cells in
a 100-mm dish) were treated with or without 5 mM metformin for 48
h. Each array membrane was exposed to X-ray film using a
chemiluminescence detection system (Perkin-Elmer).
Analysis of miRNA microarray
Total RNA was extracted from HuTu80 cells
(1.0×10⁶ cells in a 100-mm dish) treated with or without
10 mM metformin for 48 h using the miRNeasy Mini kit (Qiagen,
Hilden, Germany) according to the manufacturer's instructions. RNA
samples typically showed A260/280 ratios between 1.9 and
2.1, using an Agilent 2100 Bioanalyzer (Agilent Technologies, Santa
Clara, CA, USA). After RNA measurement with an RNA 6000 Nano kit
(Agilent Technologies), the samples were labeled using a miRCURY
Hy3/Hy5 Power labeling kit and were hybridized to a human miRNA
Oligo chip (v.21.0; Toray Industries, Inc., Tokyo, Japan). The
chips were scanned with the 3D-Gene Scanner 3000 (Toray
Industries). 3D-Gene extraction version 1.2 software (Toray
Industries) was used to read the raw intensity of the image. The
changes in miRNA expression between metformin-treated and control
samples were analyzed with GeneSpringGX v 10.0 (Agilent
Technologies). Quantile normalization was performed on the raw data
that were above the background level. Differentially expressed
miRNAs were determined by the Mann-Whitney U test. The false
discovery rate was computed with the Benjamini-Hochberg procedure
for multiple testing (23).
Hierarchical clustering was performed using the furthest neighbor
method with the absolute uncentered Pearson's correlation
coefficient as a metric. We produced a heat map with the relative
expression intensity for each miRNA, in which the base-2 logarithm
of the intensity was median-centered for each row.
Statistical analyses
All statistical analyses were performed by GraphPad
Prism 7.0 (GraphPad Software, Inc., La Jolla, CA, USA). Comparisons
between the treatment and control groups were performed by
two-tailed paired or unpaired Student's t-tests. Two-way ANOVA was
also used to compare tumor size in mice after different treatments.
In all analyses, a P<0.05 was considered significant.
Results
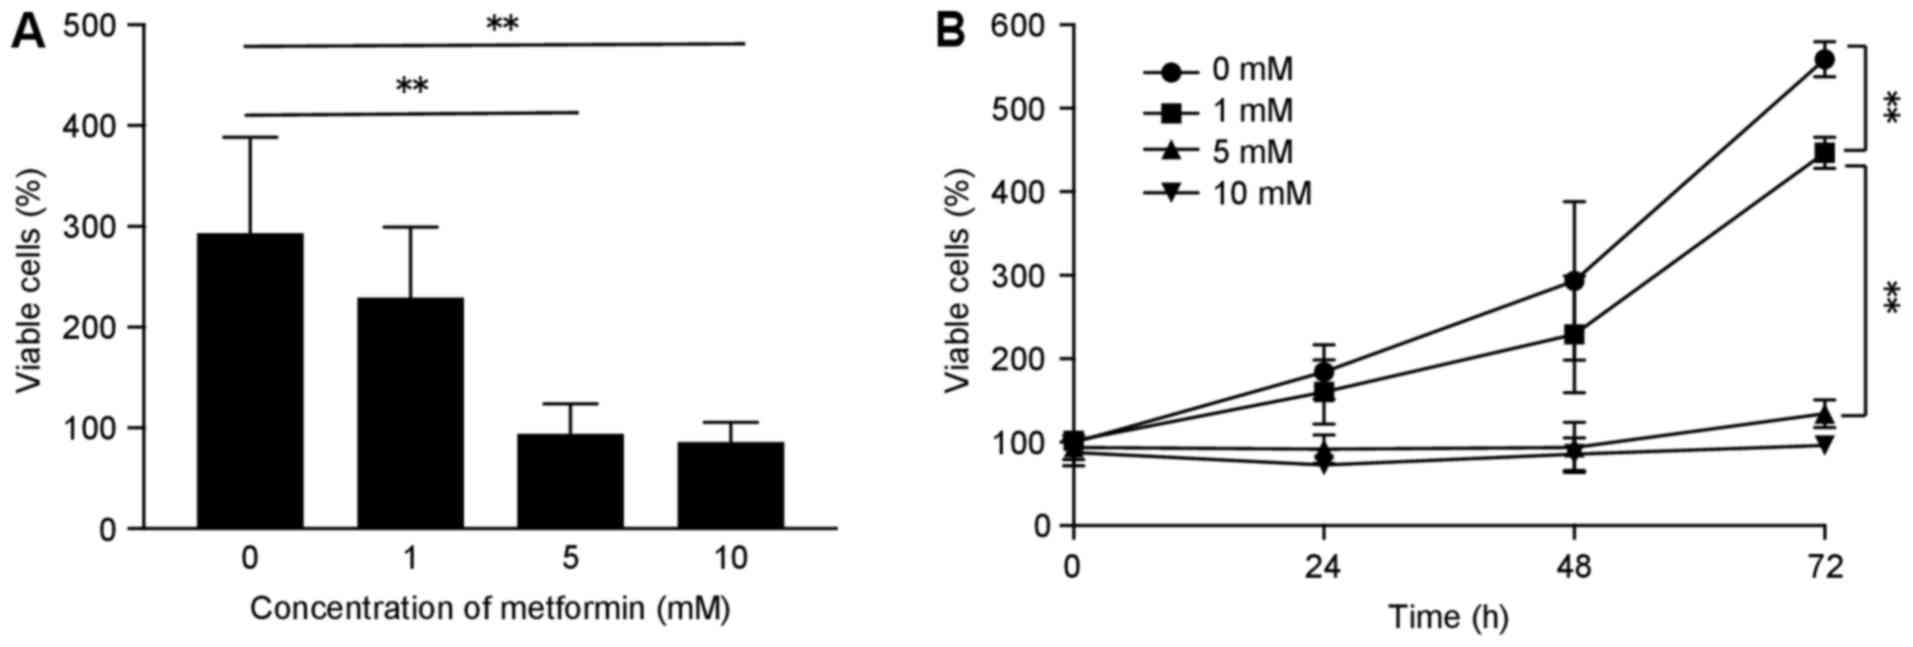
Metformin inhibits the proliferation of
human SBAC cells in vitro
To evaluate the effect of metformin on the
proliferation of human SBAC cells, HuTu80 cells were grown in 10%
FBS and treated with 0, 1, 5 or 10 mM metformin for 72 h. Metformin
treatment led to inhibition of cell proliferation in a time- and
dose-dependent manner (Fig.
1).
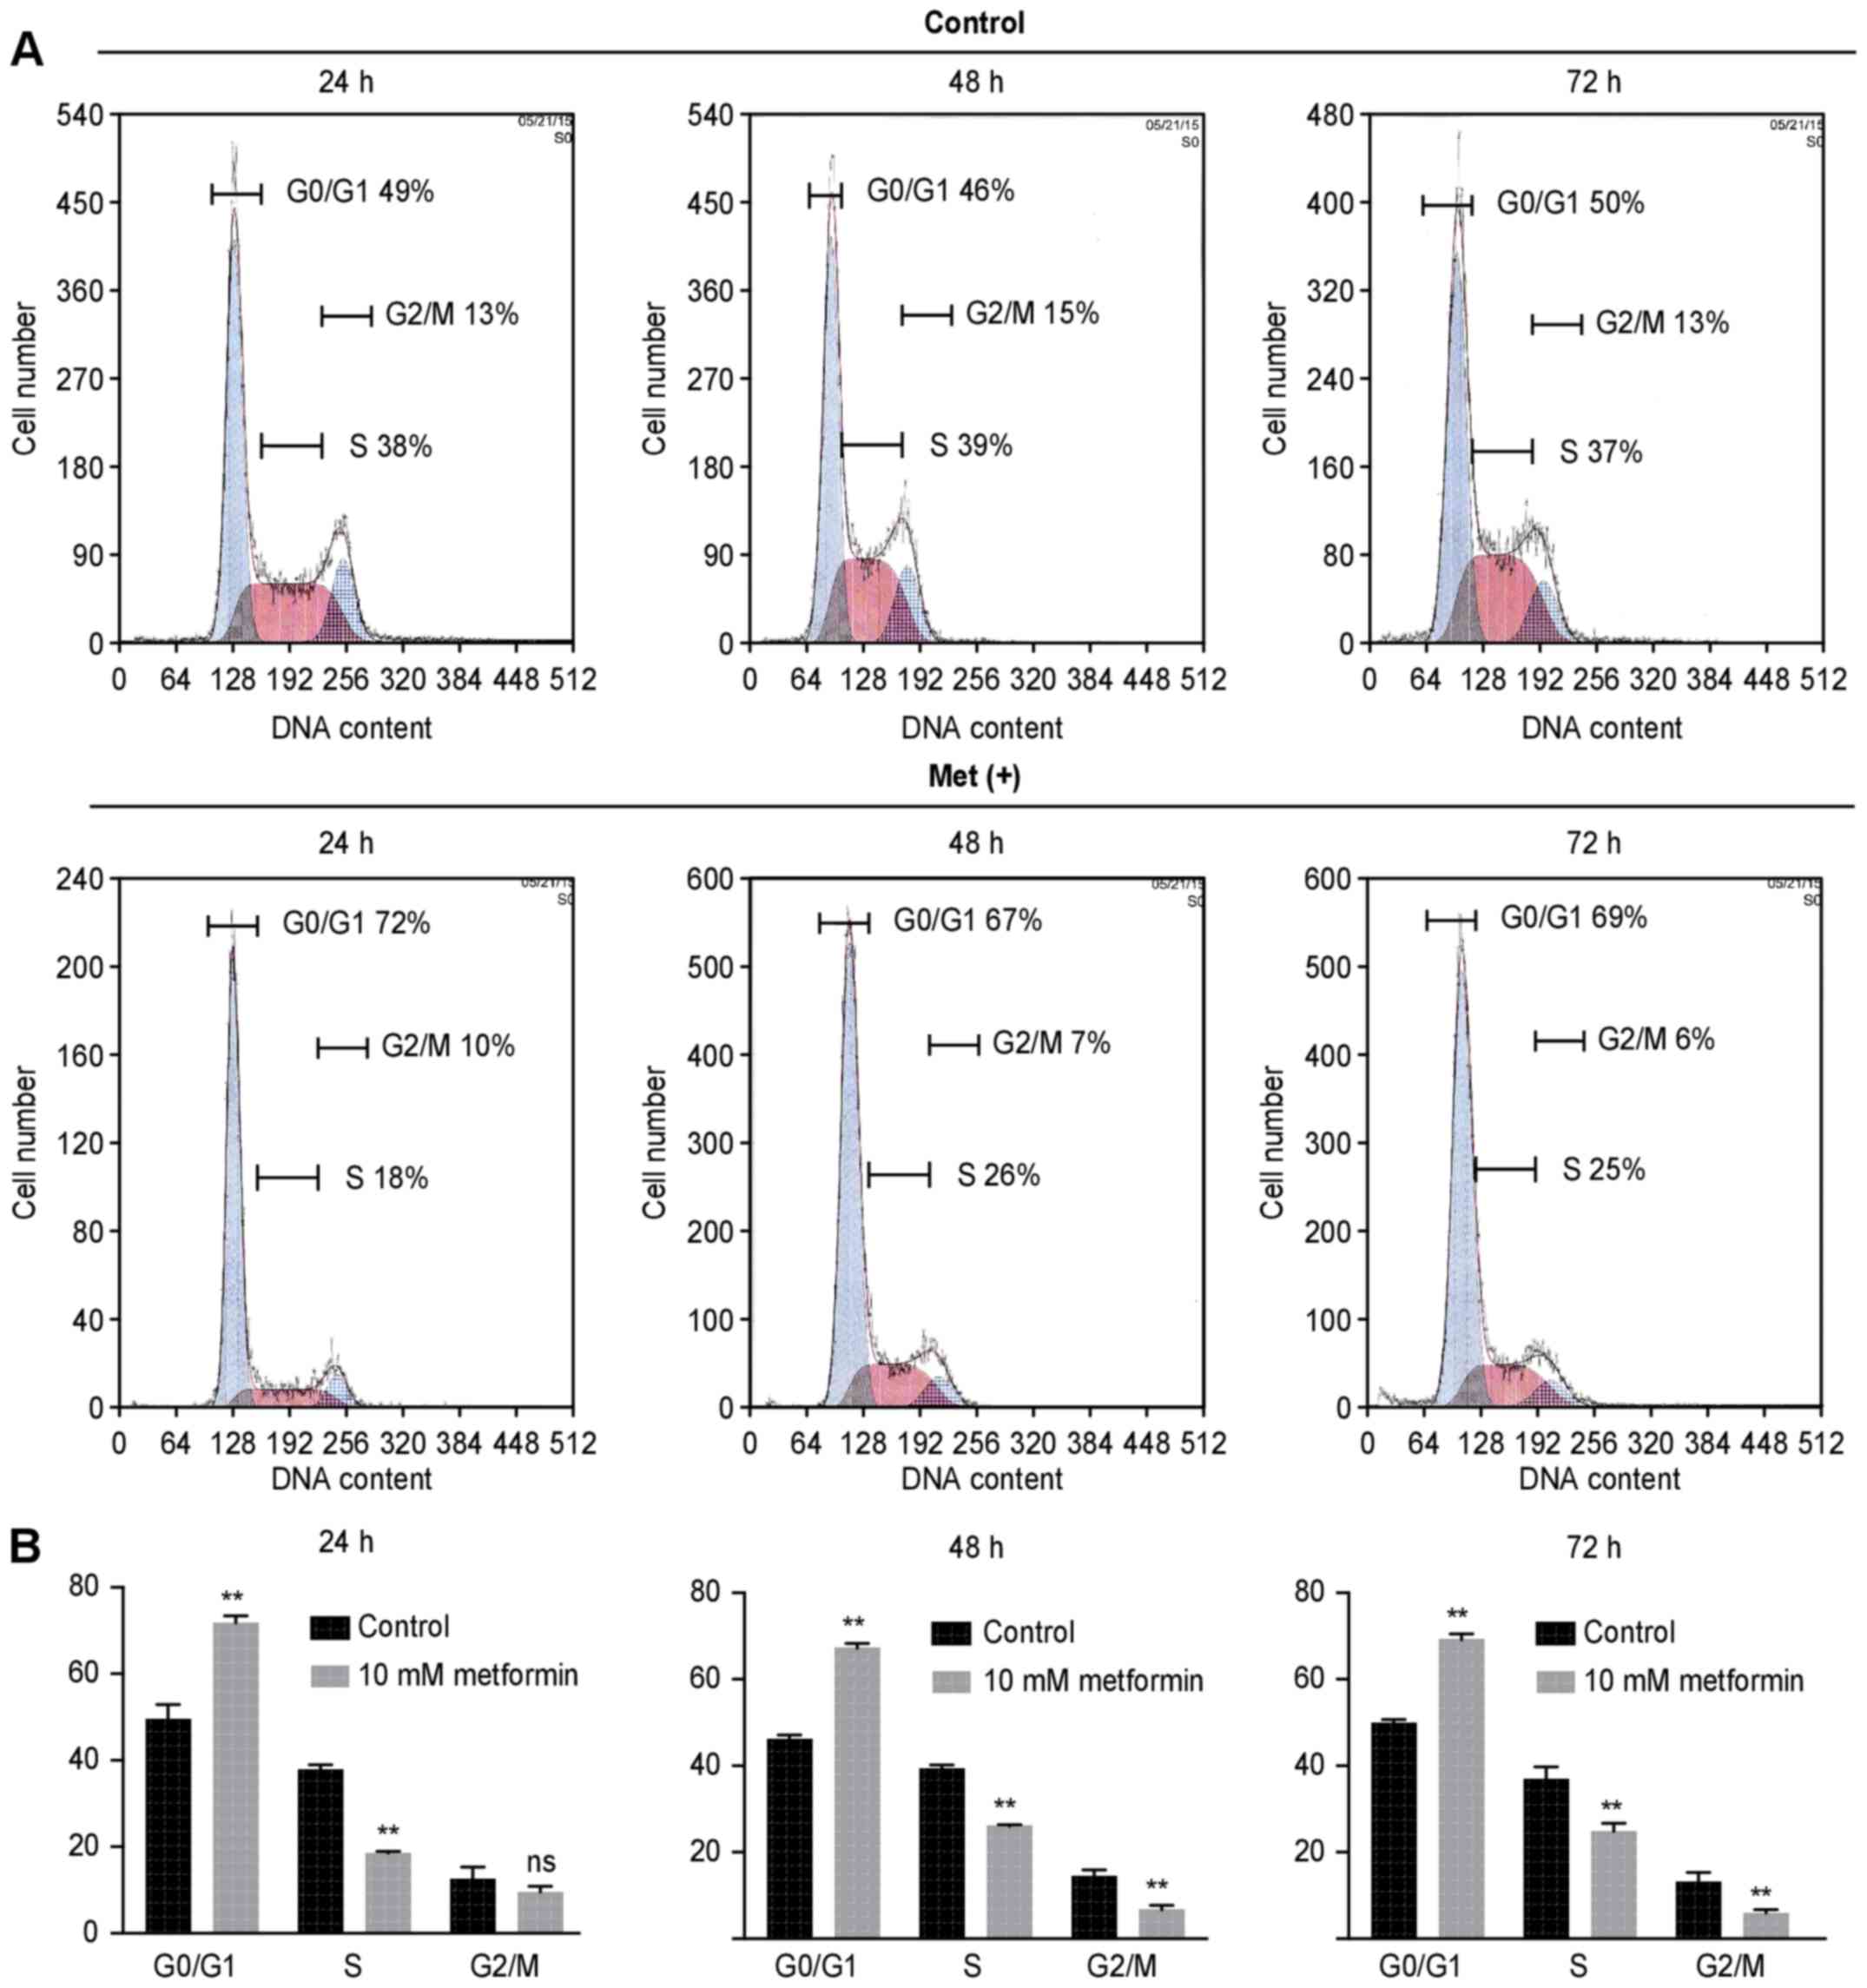
Metformin induced cell cycle arrest in
the G0/G1 phase and regulates cell cycle-related proteins in SBAC
cells
To examine whether the growth inhibition was due to
cell cycle change, we analyzed the cell cycle profiles of HuTu80
cells 24–72 h after treatment with or without 10 mM metformin by
flow cytometry. Metformin treatment increased the proportion of
cells in the G0/G1 phase in treated cells compared with the control
cells (71.8 vs. 49.4% after 24 h, 67.3 vs. 46.1% after 48 h, 69.1
vs. 49.9% after 72 h) (Fig. 2).
The proportion of cells in S phase and G2/M phase decreased
accordingly.
The effects of metformin on the expression of cell
cycle regulatory proteins were evaluated by western blotting.
HuTu80 cells were treated with or without 10 mM metformin for 24–72
h. We found notably lower levels of cyclin D1, cyclin E, Cdk4 and
pRb in cells treated with metformin (Fig. 3), which suggested that metformin
suspended the transition from G0/G1 phase to S phase by modulating
cyclin D1, cyclin E, Cdk4 and pRb.
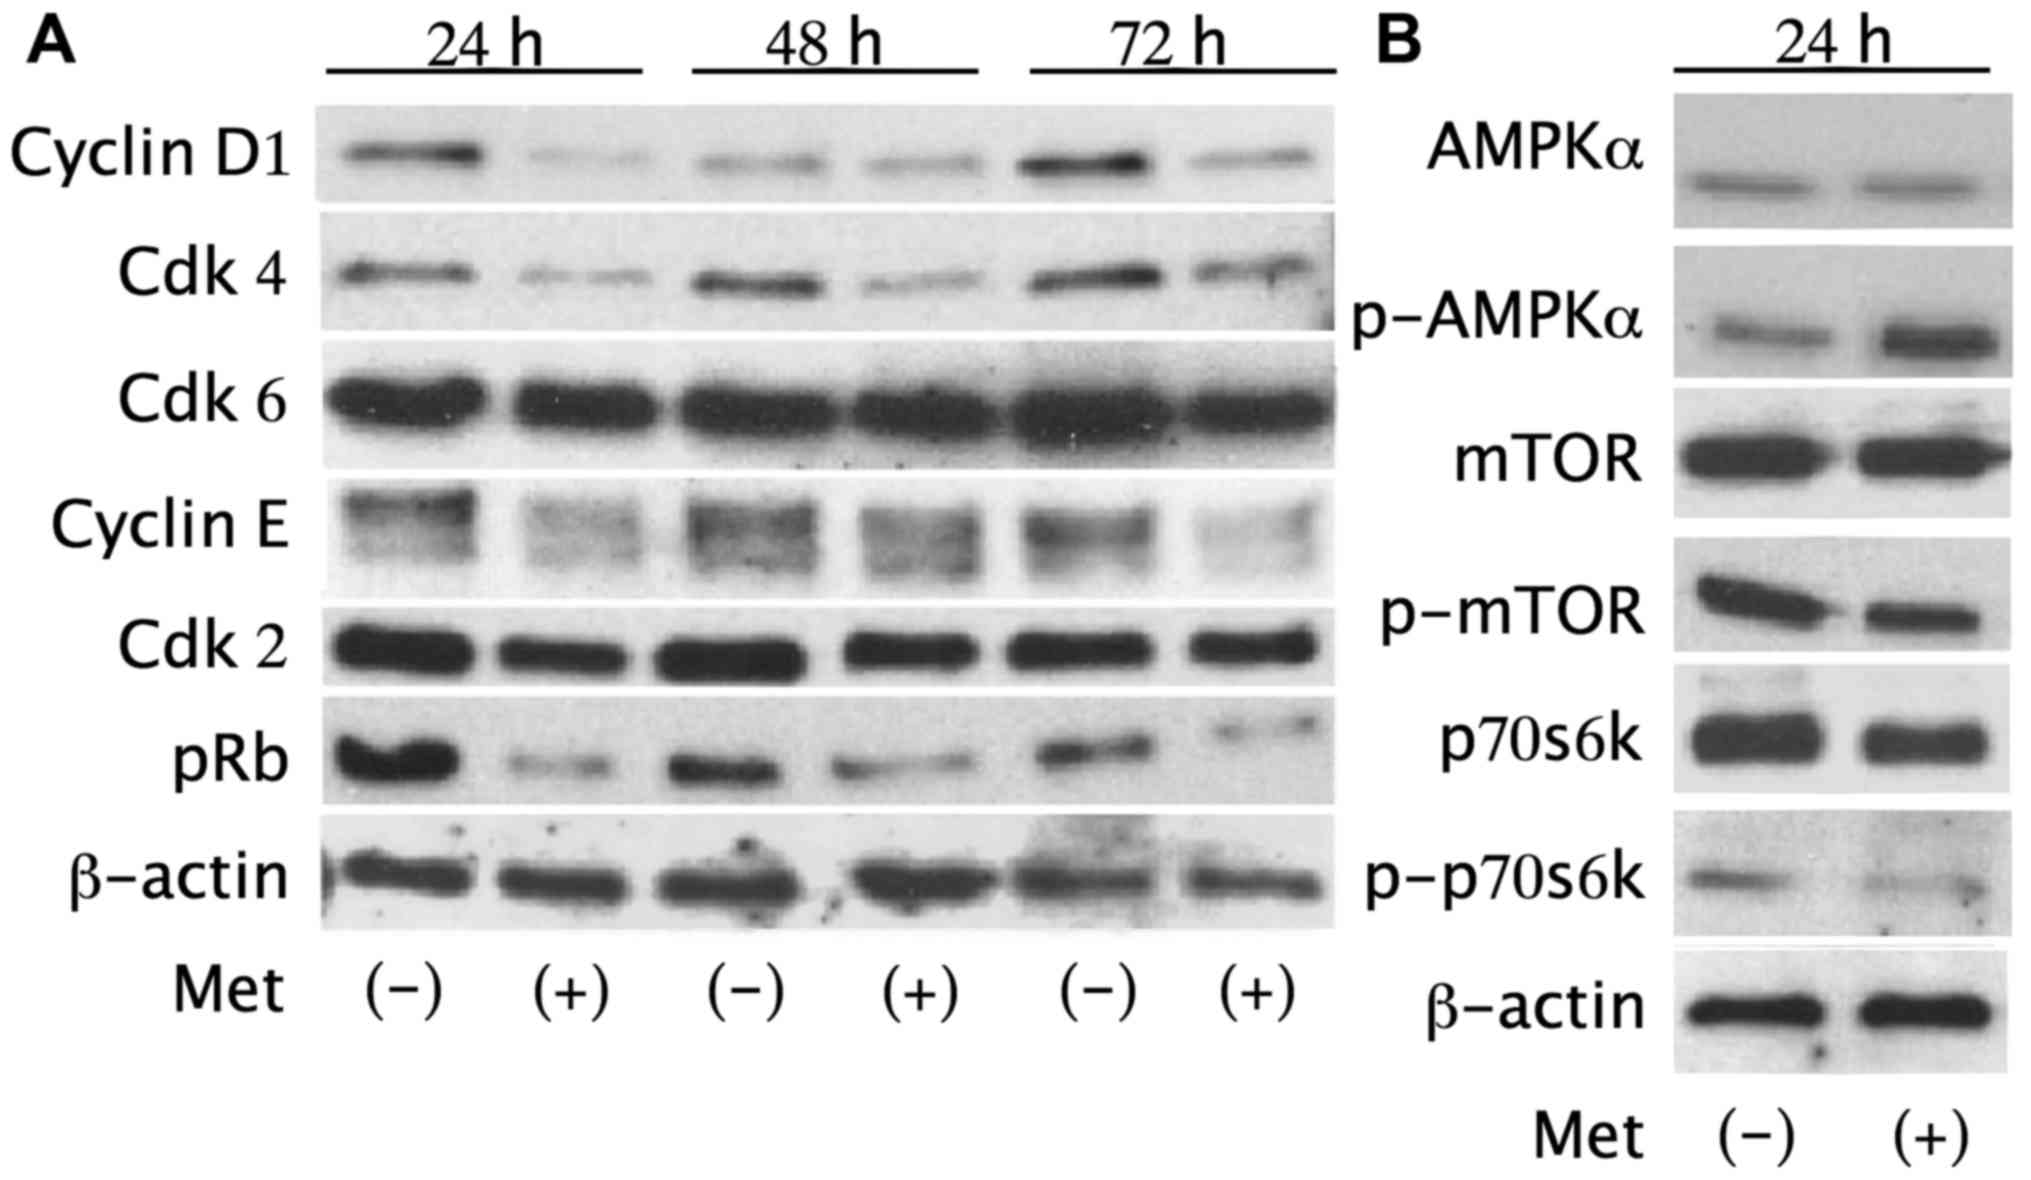 | Figure 3Metformin reduces cell cycle
regulatory proteins and activates the AMPKα pathway. (A) Western
blot analysis of cyclin D1, cyclin E, Cdk2, Cdk4, Cdk6, Rb, pRb in
HuTu80 cells treated with 10 mM metformin for 24–72 h. The
expression level of cyclin D1, cyclin E, Cdk4 and pRb decreased in
treated cells. (B) Metformin increased p-AMPKα after a 24-h
treatment with 10 mM metformin. p-mTOR and p-p70s6k, downstream of
AMPKα, decreased accordingly in treated cells. There were no
substantial differences in total AMPK, mTOR or p70s6k expression
between metformin-treated cells and the control cells. |
Additionally, p-AMPKα increased after a 24-h
treatment with 10 mM metformin compared with the control, revealing
the activation of the AMPK pathway. p-mTOR and p-p70s6k, which are
downstream of AMPKα, were also decreased in metformin-treated cells
without substantial differences in the total protein levels of
AMPKα, mTOR or p70s6k (Fig. 3).
These results suggest that metformin decreases the expression level
of cell cycle-related proteins and the phosphorylation of key cell
cycle regulatory proteins via the AMPKα/mTOR pathway leading to
G0/G1 arrest in human SBAC cells.
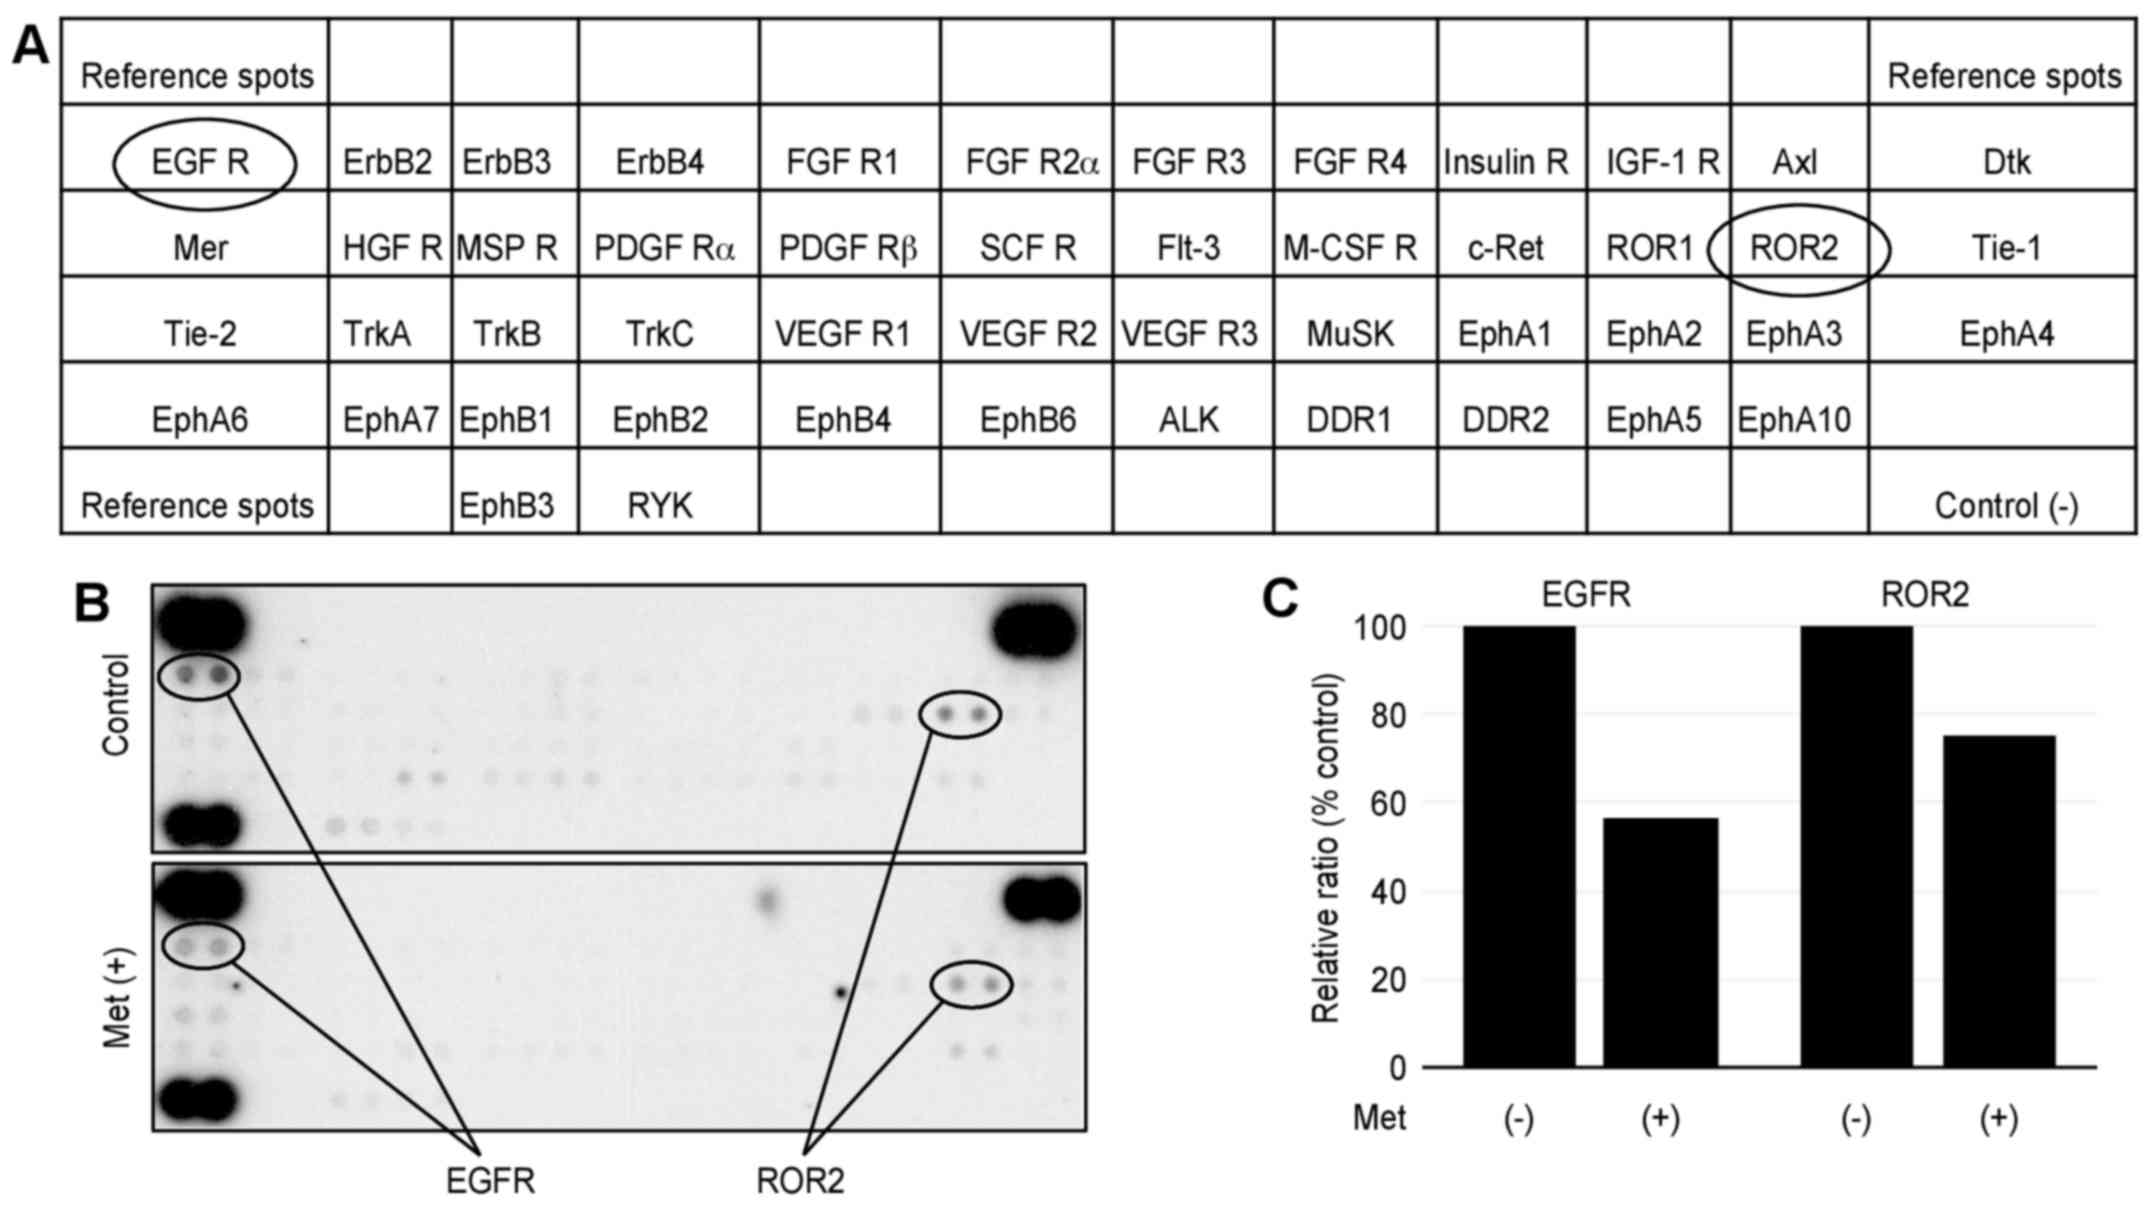
Metformin affected p-RTKs in vitro
We performed a p-RTK array to identify key RTKs
associated with the antitumor effect of metformin. The antibody
array (Fig. 4A) enabled 49 of the
expressed and activated RTKs to be screened in HuTu80 cells. We
also performed the array using 10 mM metformin for 48 h; however,
most of the phospho-RTKs were strongly inhibited, and we could not
conduct an evaluation. Therefore, we performed the array in the
presence and absence of 5 mM metformin for 48 h. Metformin reduced
the expression of phosphorylated epidermal growth factor receptor
(EGFR), ROR2 (Fig. 4B).
Densitometry showed that the ratios of the EGFR and ROR2 of
metformin-treated to untreated cells were 57 and 75%, respectively
(Fig. 4C).
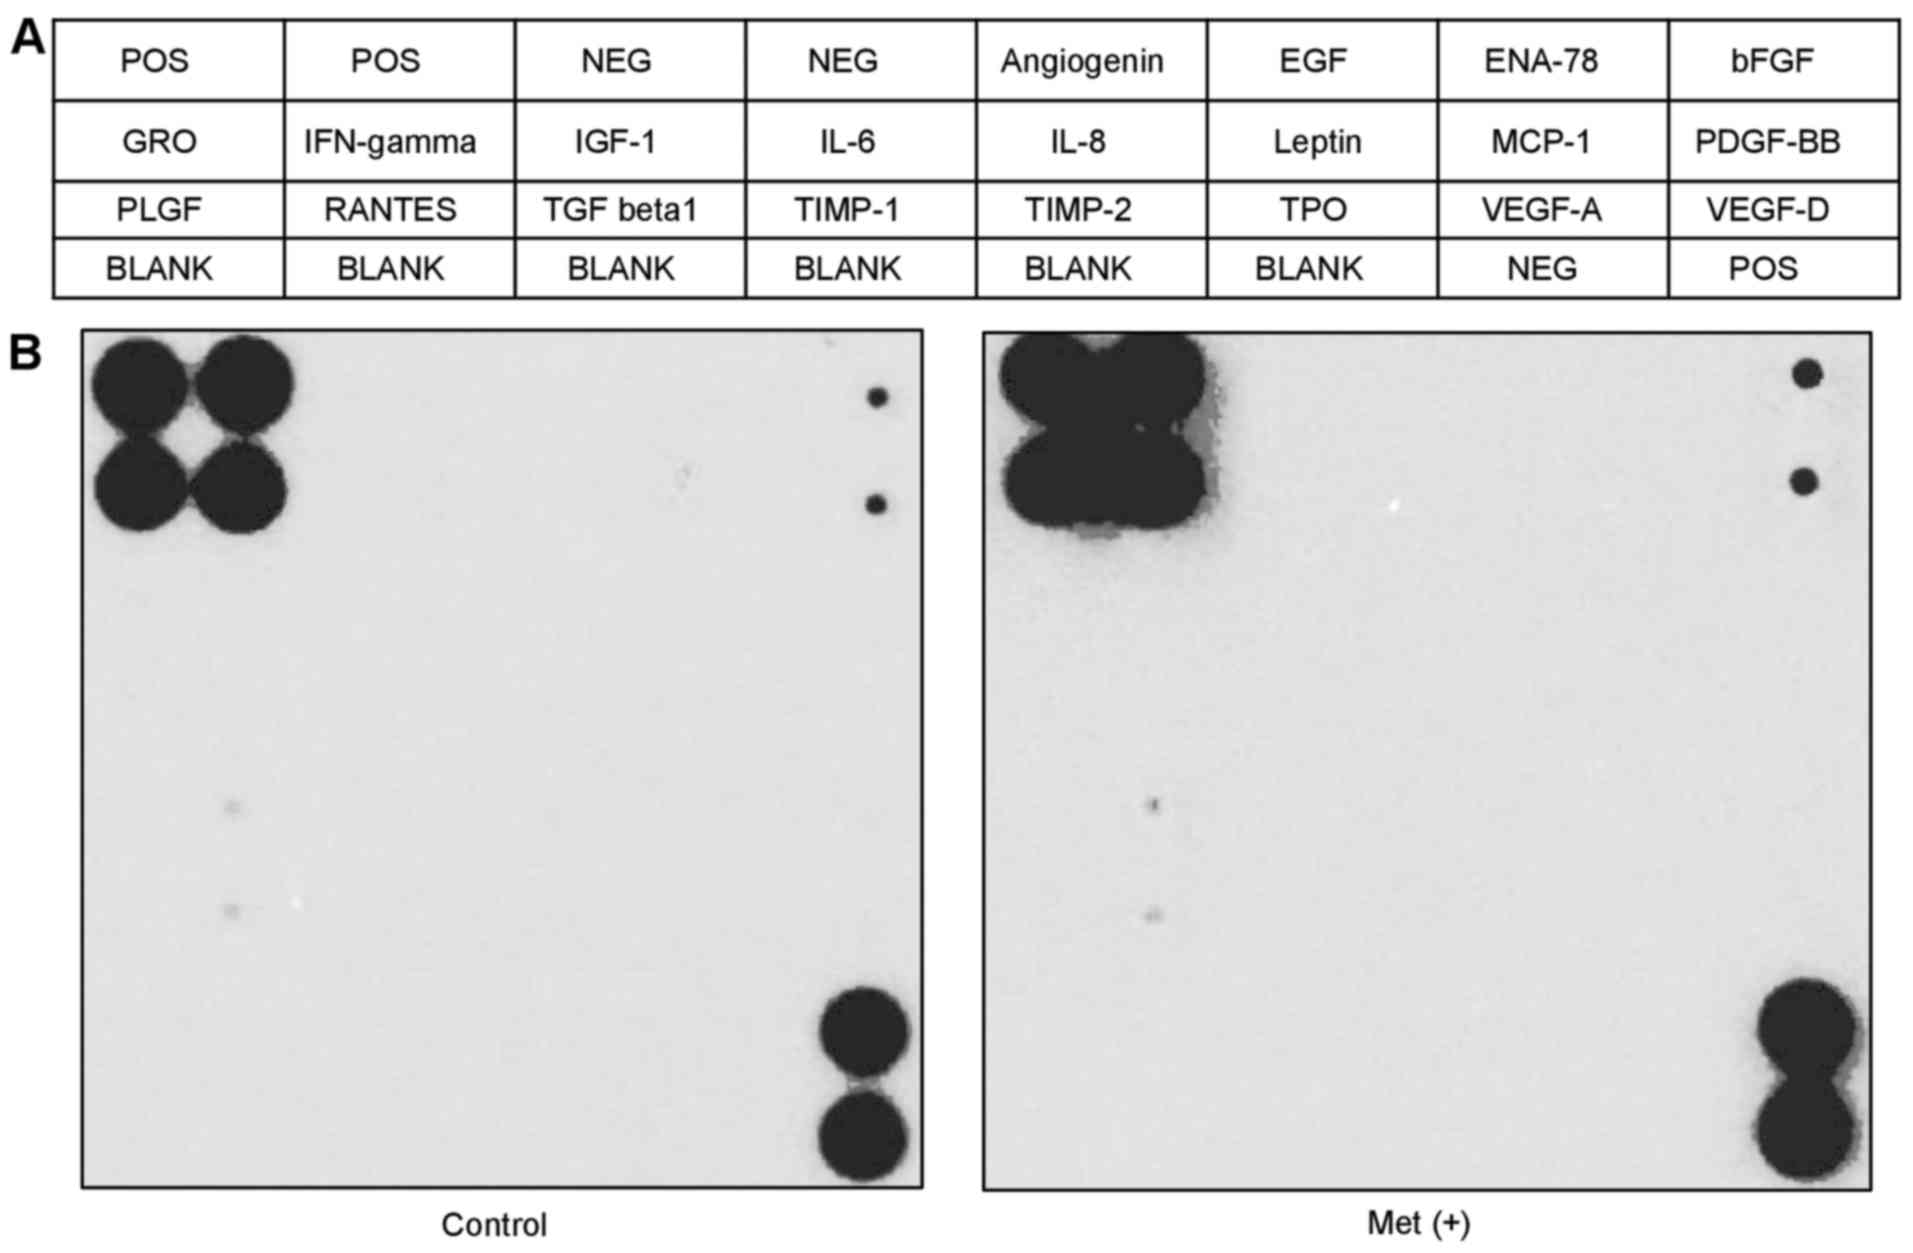
Metformin did not affect
angiogenesis-related molecules in vitro
We performed an angiogenesis array (Fig. 5A) to identify the key
angiogenesis-related molecules associated with the antitumor
effects of metformin on HuTu80. The 20 screened angiogenesis
molecules showed no change after 5-mM metformin treatment for 48 h
compared with the control (Fig.
5B).
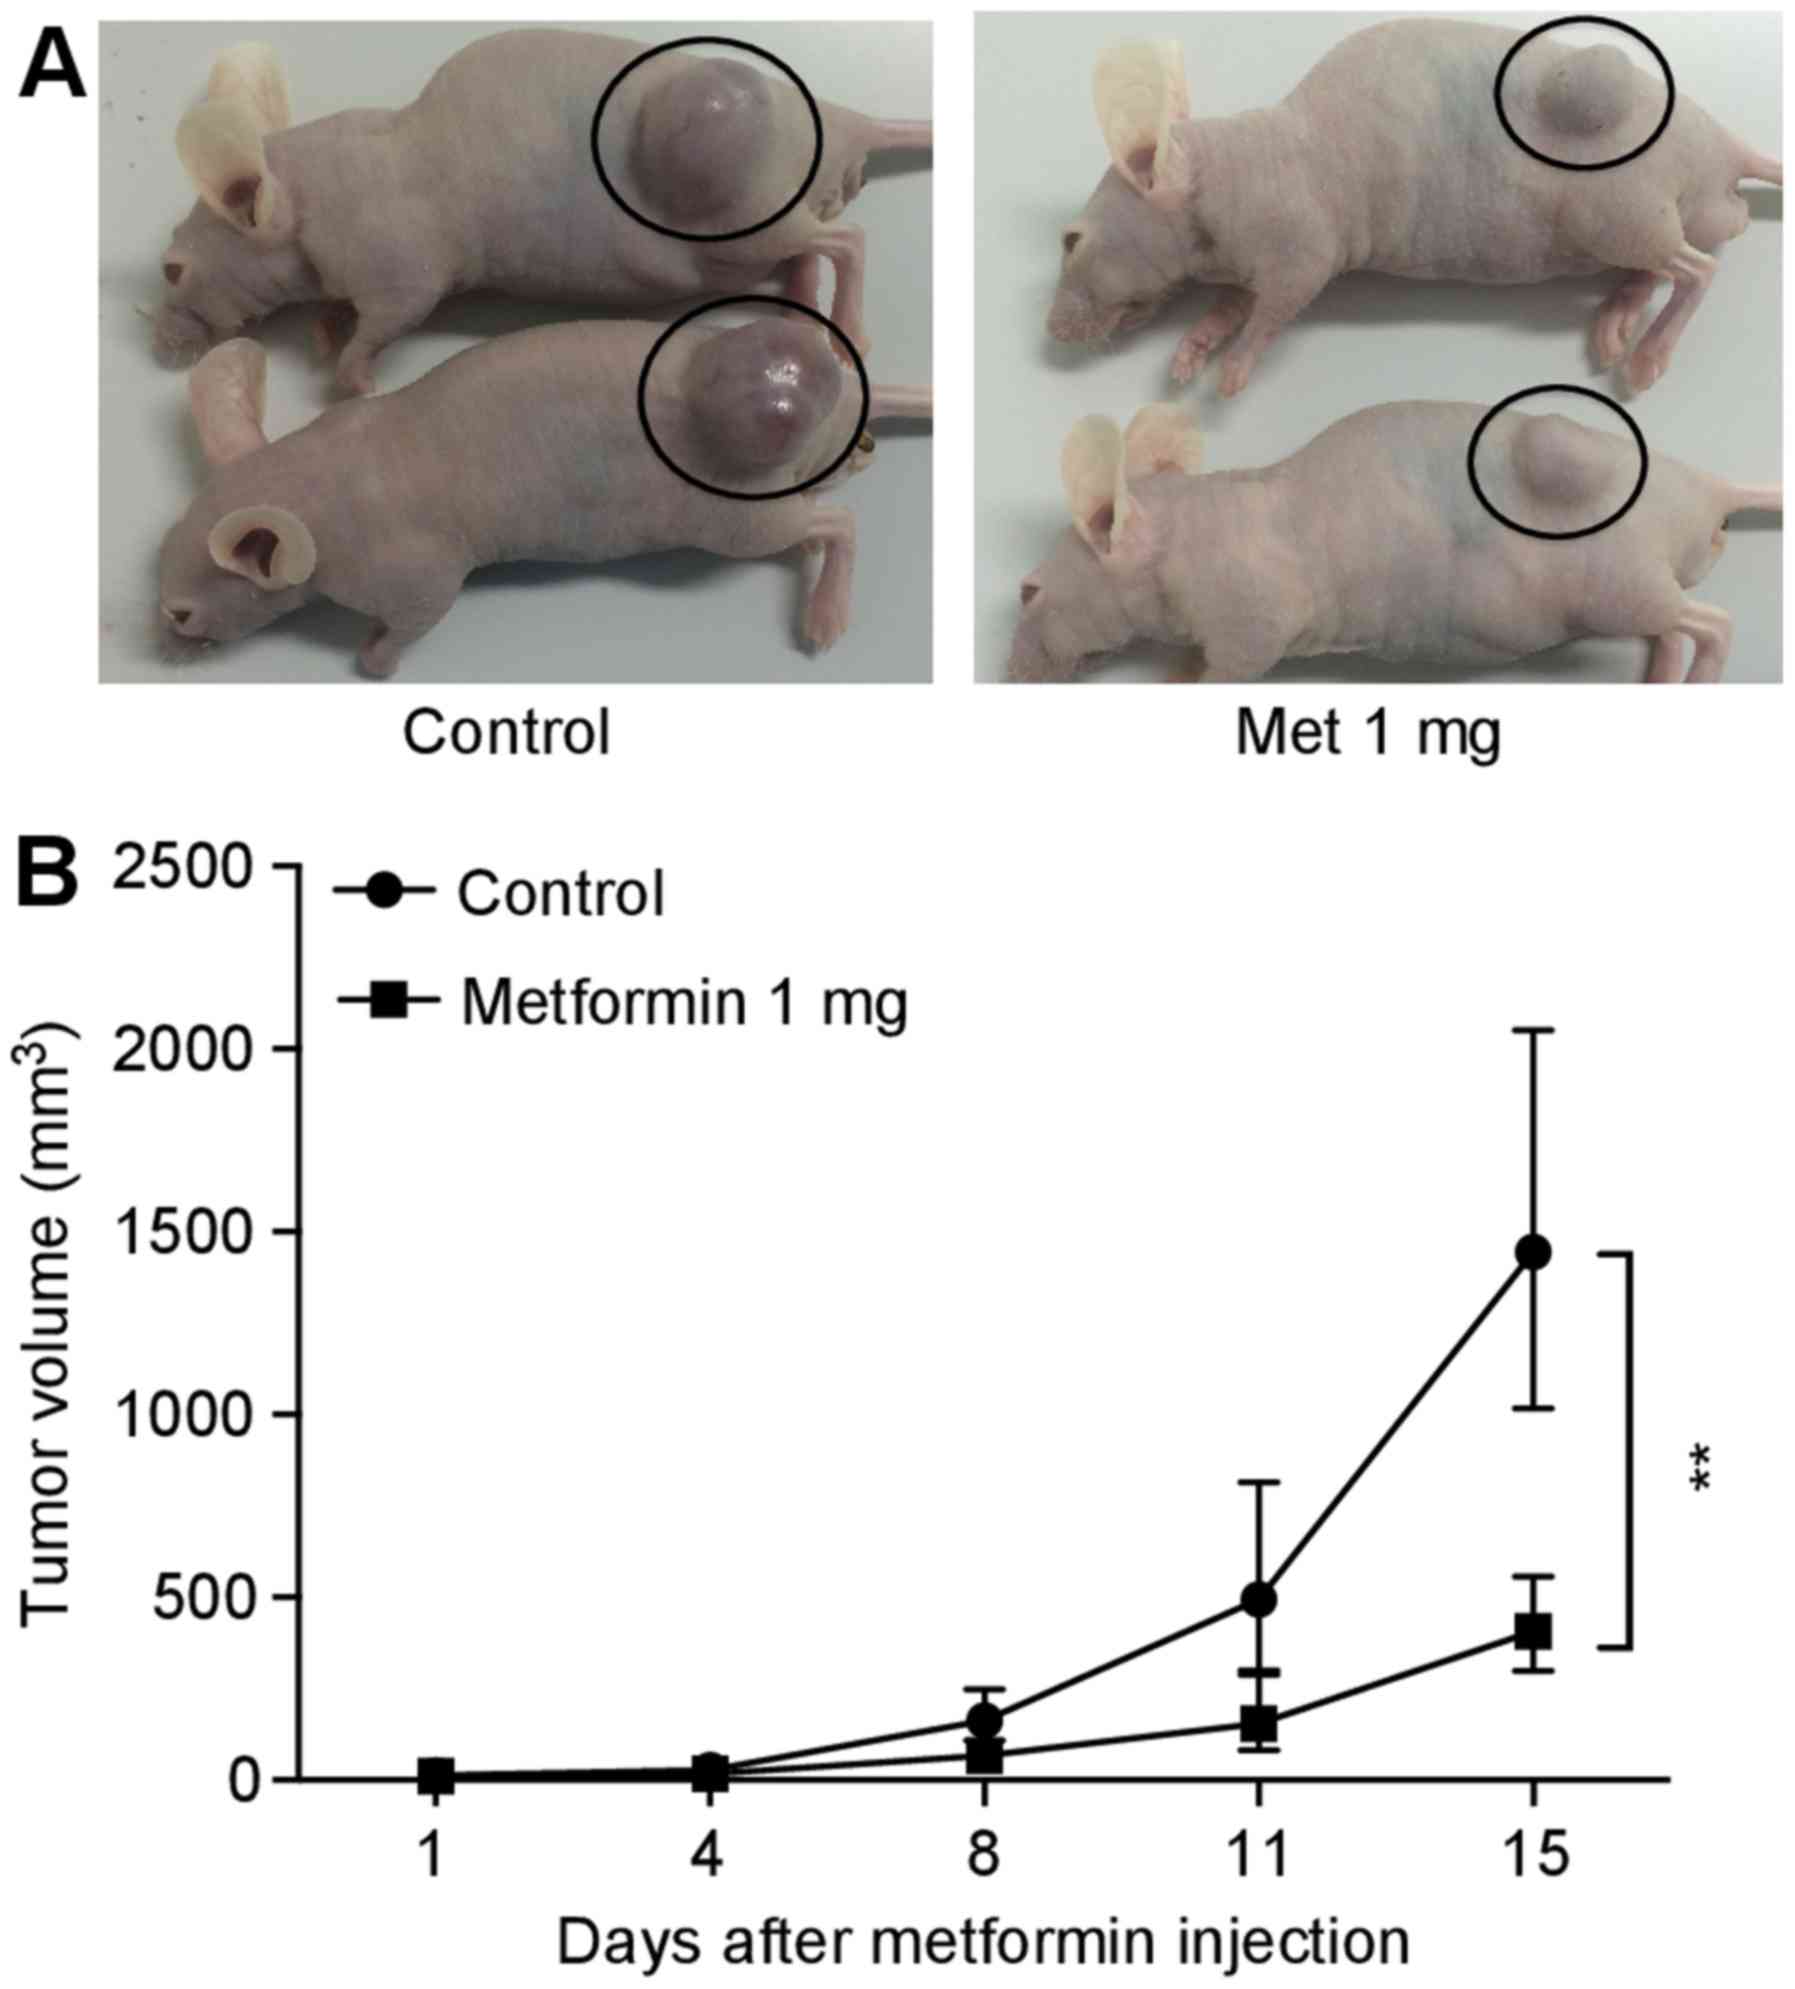
Metformin inhibits SBAC proliferation in
vivo
To evaluate the antitumor effect in vivo,
each nude mouse was subcutaneously inoculated with HuTu80 cells
(5×10⁶ cells/animal) in the flank region, followed by an
i.p. injection. All animals survived the experimental period.
Additionally, metformin did not affect body weight (data not
shown), and the mice did not exhibit signs of behavioral
alterations or suffering. Metformin (1 mg/body/day) significantly
reduced tumor growth by 72% relative to the PBS-injected control
(Fig. 6).
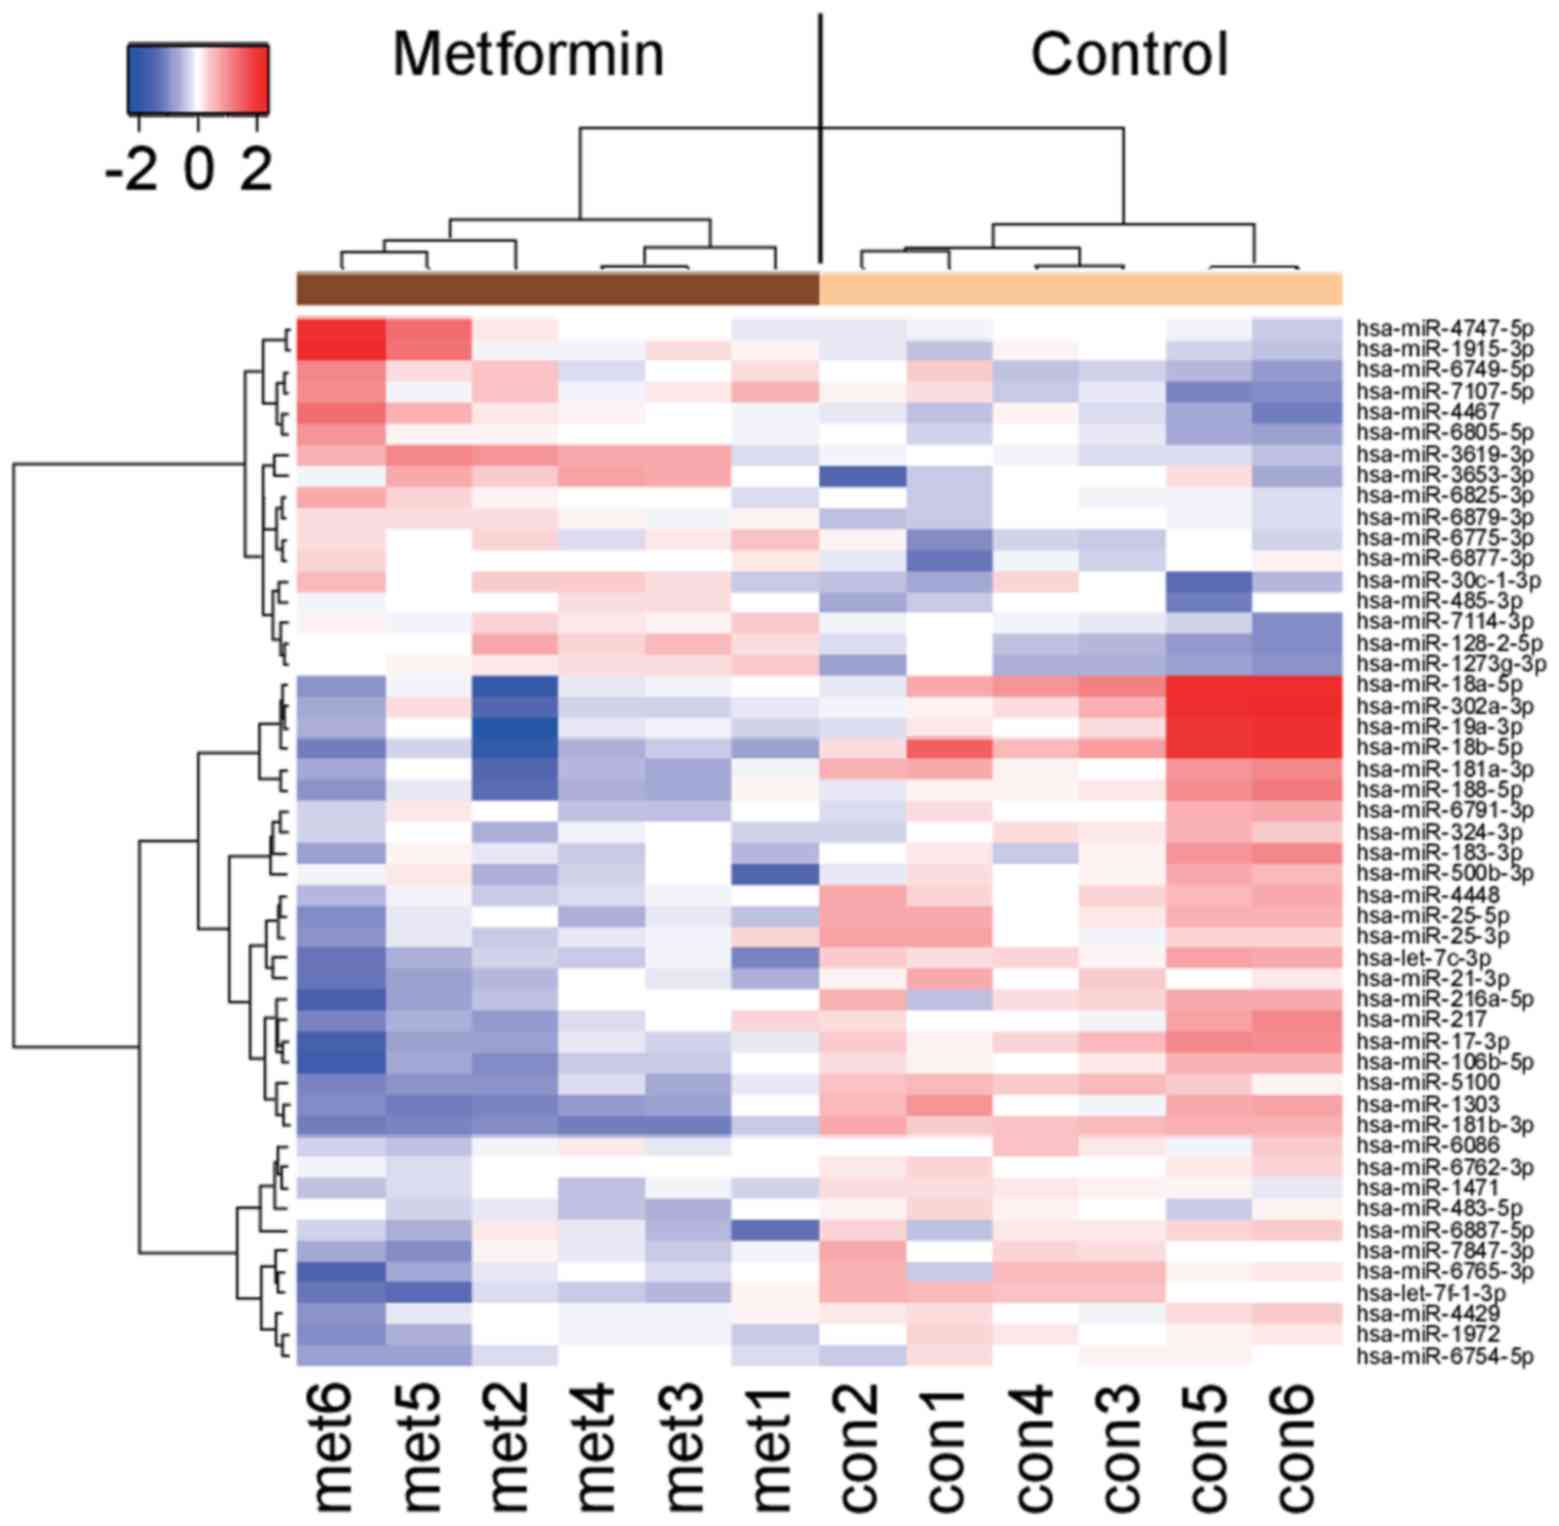
Effects of metformin on miRNA
expression
We analyzed the levels of expression of 2555 miRNA
probes in HuTu80 cells with or without metformin treatment with a
custom microarray platform. Unsupervised hierarchical clustering
analysis showed that the treated cells clustered separately from
the control cells (Fig. 7). We
identified 17 miRNAs that were significantly upregulated and 33
downregulated miRNAs in treated cells, compared with the control
(Table I).
 | Table IStatistical results and chromosomal
location of miRNAs in HuTu80 cells treated with or without
metformin. |
Table I
Statistical results and chromosomal
location of miRNAs in HuTu80 cells treated with or without
metformin.
| miRNA | Fold change
(treated/non-treated) | P-value | Chromosomal
localization |
|---|
| Upregulated | | | |
|
hsa-miR-1915-3p | 2.12 | 0.0411 | 10 |
|
hsa-miR-4745-5p | 1.98 | 0.0411 | 19 |
|
hsa-miR-3619-3p | 1.77 | 0.0411 | 22 |
|
hsa-miR-128-2-5p | 1.77 | 0.0022 | 3 |
| hsa-miR-4467 | 1.76 | 0.0087 | 7 |
| hsa-miR-12733g
g-3p | 1.73 | 0.0061 | 1 |
|
hsa-miR-3653-3p | 1.67 | 0.0260 | 22 |
|
hsa-miR-7107-5p | 1.58 | 0.0450 | 12 |
|
hsa-miR-30c-1-3p | 1.51 | 0.0260 | 1 |
|
hsa-miR-6749-5p | 1.49 | 0.0411 | 11 |
|
hsa-miR-6805-5p | 1.41 | 0.0303 | 19 |
|
hsa-miR-6775-3p | 1.37 | 0.0260 | 16 |
| hsa-miR-485-3p | 1.34 | 0.0260 | 14 |
|
hsa-miR-7114-3p | 1.32 | 0.0152 | 9 |
|
hsa-miR-6879-3p | 1.27 | 0.0152 | 11 |
|
hsa-miR-6877-3p | 1.25 | 0.0367 | 9 |
|
hsa-miR-6825-3p | 1.24 | 0.0411 | 3 |
| Downregulated | | | |
| hsa-miR-18b-5p | 0.23 | 0.0022 | X |
| hsa-miR-18a-5p | 0.30 | 0.0200 | 13 |
|
hsa-miR-302a-3p | 0.34 | 0.0152 | 4 |
|
hsa-miR-181b-3p | 0.36 | 0.0048 | 1 |
| hsa-miR-19a-3p | 0.37 | 0.0152 | 13 |
| hsa-miR-1303 | 0.43 | 0.0043 | 5 |
| hsa-miR-17-3p | 0.45 | 0.0050 | 13 |
|
hsa-miR-181a-3p | 0.47 | 0.0043 | 1 |
| hsa-miR-5100 | 0.49 | 0.0049 | 10 |
| hsa-miR-188-5p | 0.49 | 0.0087 | X |
| hsa-let-7c-3p | 0.50 | 0.0022 | 21 |
|
hsa-miR-106b-5p | 0.53 | 0.0063 | 7 |
|
hsa-let-7f-1-3p | 0.55 | 0.0087 | 9 |
| hsa-miR-25-5p | 0.55 | 0.0022 | 7 |
|
hsa-miR-216a-5p | 0.59 | 0.0152 | 2 |
| hsa-miR-21-3p | 0.59 | 0.0022 | 17 |
| hsa-miR-217 | 0.61 | 0.0411 | 2 |
| hsa-miR-183-3p | 0.62 | 0.0411 | 7 |
|
hsa-miR-6765-3p | 0.63 | 0.0303 | 14 |
| hsa-miR-4448 | 0.64 | 0.0043 | 3 |
| hsa-miR-25-3p | 0.66 | 0.0129 | 7 |
|
hsa-miR-6887-5p | 0.67 | 0.0152 | 19 |
|
hsa-miR-500b-3p | 0.67 | 0.0411 | X |
|
hsa-miR-7847-3p | 0.68 | 0.0152 | 11 |
| hsa-miR-324-3p | 0.73 | 0.0411 | 17 |
|
hsa-miR-6791-3p | 0.74 | 0.0446 | 19 |
| hsa-miR-1972 | 0.74 | 0.0129 | 16 |
| hsa-miR-1471 | 0.76 | 0.0087 | 2 |
|
hsa-miR-6754-5p | 0.78 | 0.0303 | 11 |
| hsa-miR-4429 | 0.80 | 0.0303 | 2 |
| hsa-miR-483-5p | 0.80 | 0.0260 | 11 |
| hsa-miR-6086 | 0.81 | 0.0411 | X |
|
hsa-miR-6762-3p | 0.83 | 0.0087 | 12 |
Discussion
The present study revealed that metformin inhibited
cell proliferation and tumor growth of human SBAC in vitro
and in vivo. Previous studies have shown that metformin
induces cell cycle arrest via modulating cell cycle regulatory
proteins in various cancer cell lines (10–14,17).
Cell cycle dysregulation is a feature of tumor cells, and cell
cycle arrest is a major indicator of antitumor activity (24). Specific cyclin/Cdk complexes are
activated at different intervals during the cell cycle. Complexes
of Cdk4/6 and cyclin D1 are required for G1 phase progression.
Complexes of Cdk2 and cyclin E are required for G1 to S phase
transition (25). In the present
study, flow cytometry showed that metformin induced cell cycle
arrest at the G0/G1 phase in SBAC. Additionally, cyclin D1, Cdk4,
cyclin E and pRb, which are major cell cycle regulatory proteins,
are markedly attenuated in treated cells. Therefore, this finding
suggests that these proteins could be intracellular targets of the
metformin-mediated anti-proliferative effect by inducing G0/G1
cycle arrest in SBAC cells.
AMPK is a well-known downstream target of metformin,
and metformin inhibits cancer cell proliferation by activating AMPK
(26). The antitumor effect of
metformin is related to the activation of AMPK (12,26–30),
apoptosis (16,31) and angiogenesis (32) in various cancer cells. Previous
studies demonstrated that metformin displays AMPK-dependent or
-independent effects, at least partially, on cancer cell
proliferation (27–30,33).
More recently, metformin was shown to induce cyclin D1 degradation
via an AMPK/GSK3β signaling axis that involved the
ubiquitin/proteasome pathway in ovarian cancer cells (29). Our results showed that treatment
with metformin increased the expression of p-AMPK (Thr172) and
reduced the expression of p-p70s6k (Thr389), which confirms the
ability of metformin to activate AMPK and inactivate mTOR. These
results indicate that metformin may reduce the expression of cell
cycle-related proteins and induce cell cycle arrest via an
AMPKα/mTOR/p70s6k axis.
In addition to its effect on the cell cycle,
metformin can interfere with some receptors because metformin
decreases the levels of EGFR oncoprotein in various cancer cells
(10,11,13,31).
EGFR plays a key role in cancer cell proliferation and cell cycle
progression (34–36). In the present study, we found that
metformin reduced phosphorylated EGFR and ROR2 in SBAC cells. This
is the first report to show that metformin inhibited ROR2
activation. ROR2 correlates with a poor prognosis in various cancer
types (37–39), cell migration/invasion and
metastasis (40–42); therefore, it has potential as a
novel drug target in cancer therapy.
Using an angiogenesis antibody array, metformin was
previously shown to inhibit angiogenesis by reducing
angiogenesis-related molecules (11,12).
On the other hand, the 20 screened angiogenesis molecules did not
exhibit differences in metformin-treated or non-treated SBAC cells.
These data suggest that metformin may not affect tumor angiogenesis
by reducing various angiogenesis-related molecules in SBAC.
miRNAs are small, endogenous, non-coding siRNAs that
are 21–30 nucleotides in length and that modulate the expression of
various target genes at the post-transcriptional and translational
levels (43). We assessed the
miRNAs associated with the antitumor effects of metformin in SBAC
cells using miRNA expression arrays. The cluster analysis indicated
that the metformin treatment affected the expression of numerous
miRNAs. We identified 50 miRNAs differentially expressed (17
upregulated and 33 downregulated) in the cluster. These changes in
miRNA expression may provide clues to the molecular basis of the
antitumor effect of metformin.
Our data revealed that miR-1915 exhibited the
highest upregulation in HuTu80 cells treated with metformin.
miR-1915 targets the anti-apoptotic protein Bcl-2 and modulates
multidrug resistance in colorectal cancer cells (44). miR-1915 is a p53-responsive miRNA,
and it negatively regulates Bcl-2 expression at the
post-translational level (45).
Additionally, miR-1915 was shown to inhibit Bcl-2 expression and
sensitize cancerous cells to anticancer drugs (44) we investigated the possible role of
microRNAs in the development of multidrug resistance (MDR).
Metformin has also been shown to significantly downregulate miR-21
in HuTu80 cells, and downregulation of miR-21 has been shown to
restore the PTEN/Akt axis in colon cancer cells and inhibit their
growth (46). Therefore, these
changes in miRNA expression may contribute to suppressed cancer
proliferation.
There are several limitations in the present study.
First, we conducted the in vitro study with higher doses of
metformin than those that are used in human treatment (6–30
µmol/l); however, these doses are similar to those used in
previous studies on prostate (14), colon cancer (17) and melanoma (16). The cell culture was conducted in
hyperglycemic conditions with 10% FBS. The high concentration of
nutrition may lead to strong growth stimulation and high-dose
requirements for metformin. However, we confirmed the antitumor
effect in the in vivo study, in which the use of metformin,
1 mg (40–50 mg/kg) was almost equivalent to the dose used in human
treatments. Second, we used only a single cell line in this study
because no other human SBAC cell lines were available. Instead, we
obtained the human ileocecal adenocarcinoma cell line HCT-8 and
performed the cell proliferation assay with this cell line. The
cells were treated with the same concentrations of metformin (0, 1,
5 or 10 mM) as the HuTu80 cells and were cultured for 48 h. The
proliferation of HCT-8 cells was also inhibited with metformin in a
time- and dose-dependent manner (data not shown).
In conclusion, our results indicate that metformin
inhibits SBAC cell proliferation by suppressing cell cycle-related
molecules, activating AMPK and inhibiting mTOR and p70s6k
signaling, and altering the production of miRNAs. Therefore,
metformin may become a novel therapeutic agent for SBAC treatment,
providing synergistic effects based on different mechanisms of
action.
References
|
1
|
Siegel RL, Miller KD and Jemal A: Cancer
statistics, 2016. CA Cancer J Clin. 66:7–30. 2016. View Article : Google Scholar : PubMed/NCBI
|
|
2
|
Howe JR, Karnell LH, Menck HR and
Scott-Conner C: The American College of Surgeons Commission on
Cancer and the American Cancer Society. Adenocarcinoma of the small
bowel: Review of the National Cancer Data Base, 1985–1995. Cancer.
86:2693–2706. 1999. View Article : Google Scholar : PubMed/NCBI
|
|
3
|
Witters LA: The blooming of the French
lilac. J Clin Invest. 108:1105–1107. 2001. View Article : Google Scholar : PubMed/NCBI
|
|
4
|
Libby G, Donnelly LA, Donnan PT, Alessi
DR, Morris AD and Evans JM: New users of metformin are at low risk
of incident cancer: A cohort study among people with type 2
diabetes. Diabetes Care. 32:1620–1625. 2009. View Article : Google Scholar : PubMed/NCBI
|
|
5
|
Landman GW, Kleefstra N, van Hateren KJ,
Groenier KH, Gans RO and Bilo HJ: Metformin associated with lower
cancer mortality in type 2 diabetes: ZODIAC-16. Diabetes Care.
33:322–326. 2010. View Article : Google Scholar :
|
|
6
|
Franciosi M, Lucisano G, Lapice E,
Strippoli GF, Pellegrini F and Nicolucci A: Metformin therapy and
risk of cancer in patients with type 2 diabetes: Systematic review.
PLoS One. 8:e715832013. View Article : Google Scholar : PubMed/NCBI
|
|
7
|
Noto H, Goto A, Tsujimoto T and Noda M:
Cancer risk in diabetic patients treated with metformin: A
systematic review and meta-analysis. PLoS One. 7:e334112012.
View Article : Google Scholar : PubMed/NCBI
|
|
8
|
Soranna D, Scotti L, Zambon A, Bosetti C,
Grassi G, Catapano A, La Vecchia C, Mancia G and Corrao G: Cancer
risk associated with use of metformin and sulfonylurea in type 2
diabetes: A meta-analysis. Oncologist. 17:813–822. 2012. View Article : Google Scholar : PubMed/NCBI
|
|
9
|
Fujita K, Iwama H, Miyoshi H, Tani J, Oura
K, Tadokoro T, Sakamoto T, Nomura T, Morishita A, Yoneyama H, et
al: Diabetes mellitus and metformin in hepatocellular carcinoma.
World J Gastroenterol. 22:6100–6113. 2016. View Article : Google Scholar : PubMed/NCBI
|
|
10
|
Miyoshi H, Kato K, Iwama H, Maeda E,
Sakamoto T, Fujita K, Toyota Y, Tani J, Nomura T, Mimura S, et al:
Effect of the antidiabetic drug metformin in hepatocellular
carcinoma in vitro and in vivo. Int J Oncol. 45:322–332.
2014.PubMed/NCBI
|
|
11
|
Kato K, Gong J, Iwama H, Kitanaka A, Tani
J, Miyoshi H, Nomura K, Mimura S, Kobayashi M, Aritomo Y, et al:
The antidiabetic drug metformin inhibits gastric cancer cell
proliferation in vitro and in vivo. Mol Cancer Ther. 11:549–560.
2012. View Article : Google Scholar : PubMed/NCBI
|
|
12
|
Cai X, Hu X, Tan X, Cheng W, Wang Q, Chen
X, Guan Y, Chen C and Jing X: Metformin induced AMPK activation,
G0/G1 phase cell cycle arrest and the inhibition of growth of
esophageal squamous cell carcinomas in vitro and in vivo. PLoS One.
10:e01333492015. View Article : Google Scholar : PubMed/NCBI
|
|
13
|
Fujihara S, Kato K, Morishita A, Iwama H,
Nishioka T, Chiyo T, Nishiyama N, Miyoshi H, Kobayashi M, Kobara H,
et al: Antidiabetic drug metformin inhibits esophageal
adenocarcinoma cell proliferation in vitro and in vivo. Int J
Oncol. 46:2172–2180. 2015.PubMed/NCBI
|
|
14
|
Ben Sahra I, Laurent K, Loubat A,
Giorgetti-Peraldi S, Colosetti P, Auberger P, Tanti JF, Le
Marchand-Brustel Y and Bost F: The antidiabetic drug metformin
exerts an antitumoral effect in vitro and in vivo through a
decrease of cyclin D1 level. Oncogene. 27:3576–3586. 2008.
View Article : Google Scholar : PubMed/NCBI
|
|
15
|
Nair V, Sreevalsan S, Basha R, Abdelrahim
M, Abudayyeh A, Rodrigues Hoffman A and Safe S: Mechanism of
metformin-dependent inhibition of mammalian target of rapamycin
(mTOR) and Ras activity in pancreatic cancer: Role of specificity
protein (Sp) transcription factors. J Biol Chem. 289:27692–27701.
2014. View Article : Google Scholar : PubMed/NCBI
|
|
16
|
Janjetovic K, Harhaji-Trajkovic L,
Misirkic-Marjanovic M, Vucicevic L, Stevanovic D, Zogovic N,
Sumarac-Dumanovic M, Micic D and Trajkovic V: In vitro and in vivo
anti-melanoma action of metformin. Eur J Pharmacol. 668:373–382.
2011. View Article : Google Scholar : PubMed/NCBI
|
|
17
|
Zhou XZ, Xue YM, Zhu B and Sha JP: Effects
of metformin on proliferation of human colon carcinoma cell line
SW-480. Nan Fang Yi Ke Da Xue Xue Bao. 30:1935–1938. 19422010.In
Chinese.
|
|
18
|
Kourelis TV and Siegel RD: Metformin and
cancer: New applications for an old drug. Med Oncol. 29:1314–1327.
2012. View Article : Google Scholar
|
|
19
|
Zhou JY, Xu B and Li L: A new role for an
old drug: Metformin targets microRNAs in treating diabetes and
cancer. Drug Dev Res. 76:263–269. 2015. View Article : Google Scholar
|
|
20
|
Laemmli UK: Cleavage of structural
proteins during the assembly of the head of bacteriophage T4.
Nature. 227:680–685. 1970. View
Article : Google Scholar : PubMed/NCBI
|
|
21
|
Towbin H, Staehelin T and Gordon J:
Electrophoretic transfer of proteins from polyacrylamide gels to
nitrocellulose sheets: Procedure and some applications. Proc Natl
Acad Sci USA. 76:4350–4354. 1979. View Article : Google Scholar : PubMed/NCBI
|
|
22
|
D'Incalci M, Colombo T, Ubezio P,
Nicoletti I, Giavazzi R, Erba E, Ferrarese L, Meco D, Riccardi R,
Sessa C, et al: The combination of yondelis and cisplatin is
synergistic against human tumor xenografts. Eur J Cancer.
39:1920–1926. 2003. View Article : Google Scholar : PubMed/NCBI
|
|
23
|
Benjamini Y and Hochberg Y: Controlling
the false discovery rate: A practical and powerful approach to
multiple testing. J R Stat Soc B. 57:289–300. 1995.
|
|
24
|
Abbas T and Dutta A: p21 in cancer:
Intricate networks and multiple activities. Nat Rev Cancer.
9:400–414. 2009. View
Article : Google Scholar : PubMed/NCBI
|
|
25
|
Masaki T, Shiratori Y, Rengifo W, Igarashi
K, Yamagata M, Kurokohchi K, Uchida N, Miyauchi Y, Yoshiji H,
Watanabe S, et al: Cyclins and cyclin-dependent kinases:
Comparative study of hepatocellular carcinoma versus cirrhosis.
Hepatology. 37:534–543. 2003. View Article : Google Scholar : PubMed/NCBI
|
|
26
|
Zhou G, Myers R, Li Y, Chen Y, Shen X,
Fenyk-Melody J, Wu M, Ventre J, Doebber T, Fujii N, et al: Role of
AMP-activated protein kinase in mechanism of metformin action. J
Clin Invest. 108:1167–1174. 2001. View
Article : Google Scholar : PubMed/NCBI
|
|
27
|
Zakikhani M, Dowling RJ, Sonenberg N and
Pollak MN: The effects of adiponectin and metformin on prostate and
colon neoplasia involve activation of AMP-activated protein kinase.
Cancer Prev Res (Phila). 1:369–375. 2008. View Article : Google Scholar
|
|
28
|
Zakikhani M, Dowling R, Fantus IG,
Sonenberg N and Pollak M: Metformin is an AMP kinase-dependent
growth inhibitor for breast cancer cells. Cancer Res.
66:10269–10273. 2006. View Article : Google Scholar : PubMed/NCBI
|
|
29
|
Gwak H, Kim Y, An H, Dhanasekaran DN and
Song YS: Metformin induces degradation of cyclin D1 via AMPK/GSK3β
axis in ovarian cancer. Mol Carcinog. 56:349–358. 2017. View Article : Google Scholar
|
|
30
|
Sesen J, Dahan P, Scotland SJ, Saland E,
Dang VT, Lemarié A, Tyler BM, Brem H, Toulas C, Cohen-Jonathan
Moyal E, et al: Metformin inhibits growth of human glioblastoma
cells and enhances therapeutic response. PLoS One. 10:e01237212015.
View Article : Google Scholar : PubMed/NCBI
|
|
31
|
Wang LW, Li ZS, Zou DW, Jin ZD, Gao J and
Xu GM: Metformin induces apoptosis of pancreatic cancer cells.
World J Gastroenterol. 14:7192–7198. 2008. View Article : Google Scholar : PubMed/NCBI
|
|
32
|
Rattan R, Graham RP, Maguire JL, Giri S
and Shridhar V: Metformin suppresses ovarian cancer growth and
metastasis with enhancement of cisplatin cytotoxicity in vivo.
Neoplasia. 13:483–491. 2011. View Article : Google Scholar : PubMed/NCBI
|
|
33
|
Ben Sahra I, Regazzetti C, Robert G,
Laurent K, Le Marchand-Brustel Y, Auberger P, Tanti JF,
Giorgetti-Peraldi S and Bost F: Metformin, independent of AMPK,
induces mTOR inhibition and cell-cycle arrest through REDD1. Cancer
Res. 71:4366–4372. 2011. View Article : Google Scholar : PubMed/NCBI
|
|
34
|
Wang L, Xiao J, Gu W and Chen H: Sex
difference of Egfr expression and molecular pathway in the liver:
Impact on drug design and cancer treatments? J Cancer. 7:671–680.
2016. View Article : Google Scholar : PubMed/NCBI
|
|
35
|
Engel BJ, Bowser JL, Broaddus RR and
Carson DD: MUC1 stimulates EGFR expression and function in
endometrial cancer. Oncotarget. 7:32796–32809. 2016.PubMed/NCBI
|
|
36
|
Perry JE, Grossmann ME and Tindall DJ:
Epidermal growth factor induces cyclin D1 in a human prostate
cancer cell line. Prostate. 35:117–124. 1998. View Article : Google Scholar : PubMed/NCBI
|
|
37
|
Huang J, Fan X, Wang X, Lu Y, Zhu H, Wang
W, Zhang S and Wang Z: High ROR2 expression in tumor cells and
stroma is correlated with poor prognosis in pancreatic ductal
adenocarcinoma. Sci Rep. 5:129912015. View Article : Google Scholar : PubMed/NCBI
|
|
38
|
Lu C, Wang X, Zhu H, Feng J, Ni S and
Huang J: Over-expression of ROR2 and Wnt5a cooperatively correlates
with unfavorable prognosis in patients with non-small cell lung
cancer. Oncotarget. 6:24912–24921. 2015. View Article : Google Scholar : PubMed/NCBI
|
|
39
|
Sun B, Ye X, Lin L, Shen M and Jiang T:
Up-regulation of ROR2 is associated with unfavorable prognosis and
tumor progression in cervical cancer. Int J Clin Exp Pathol.
8:856–861. 2015.PubMed/NCBI
|
|
40
|
O'Connell MP, Fiori JL, Xu M, Carter AD,
Frank BP, Camilli TC, French AD, Dissanayake SK, Indig FE, Bernier
M, et al: The orphan tyrosine kinase receptor, ROR2, mediates Wnt5A
signaling in metastatic melanoma. Oncogene. 29:34–44. 2010.
View Article : Google Scholar :
|
|
41
|
Henry CE, Llamosas E, Djordjevic A, Hacker
NF and Ford CE: Migration and invasion is inhibited by silencing
ROR1 and ROR2 in chemoresistant ovarian cancer. Oncogenesis.
5:e2262016. View Article : Google Scholar : PubMed/NCBI
|
|
42
|
Lyros O, Nie L, Moore T, Medda R, Otterson
M, Behmaram B, Mackinnon A, Gockel I, Shaker R and Rafiee P:
Dysregulation of WNT5A/ROR2 signaling characterizes the progression
of Barrett's-associated esophageal adenocarcinoma. Mol Cancer Res.
14:647–659. 2016. View Article : Google Scholar : PubMed/NCBI
|
|
43
|
Morishita A and Masaki T: miRNA in
hepatocellular carcinoma. Hepatol Res. 45:128–141. 2015. View Article : Google Scholar
|
|
44
|
Xu K, Liang X, Cui D, Wu Y, Shi W and Liu
J: miR-1915 inhibits Bcl-2 to modulate multidrug resistance by
increasing drug-sensitivity in human colorectal carcinoma cells.
Mol Carcinog. 52:70–78. 2013. View Article : Google Scholar
|
|
45
|
Nakazawa K, Dashzeveg N and Yoshida K:
Tumor suppressor p53 induces miR-1915 processing to inhibit Bcl-2
in the apoptotic response to DNA damage. FEBS J. 281:2937–2944.
2014. View Article : Google Scholar : PubMed/NCBI
|
|
46
|
Roy S, Yu Y, Padhye SB, Sarkar FH and
Majumdar APN: Difluorinated-curcumin (CDF) restores PTEN expression
in colon cancer cells by down-regulating miR-21. PLoS One.
8:e68542013. View Article : Google Scholar
|