Introduction
Hepatocellular carcinoma (HCC), accounting for 90%
of liver cancers, is an often fatal malignancy with a high
recurrence and chemoresistance in the world (1). To date, there are few therapeutic
approaches for advance cases except for surgical resection. In the
past few decades, cancer stem cells (CSCs) in liver cancer has been
identified and proposed to be responsible for major malignant
phenotypes including tumor growth, metastasis, recurrence and
chemoresistance. Therefore, liver cancer stem cells (LCSCs) are
considered an important targeting subset to improve the curative
effect of treatments (2,3). LCSCs could be identified by several
markers, including CD133, CD90, CD44, EpCAM and CD13 (4,5).
Among these LCSCs biomarkers, epithelial cell adhesion molecule
(EpCAM) is frequently and highly expressed on carcinomas,
tumor-initiating cells, selected tissue progenitors and embryonic
and adult stem cells (6).
EpCAM+ HCC displayed a distinct molecular signature with
features of hepatic progenitor cells and showed hepatic cancer stem
cell-like traits, including self-renewal and differentiation and
were highly invasive and tumorigenic (7).
Cancer/testis antigens (CTAs) are a family of genes
with common expression characteristics: they are normally expressed
only in human germ line, but are also expressed in a variety of
tumors types (8). Recently, it was
reported that some CTAs such as CTAG1B, MAGE-1 and SSX are
expressed in human mesenchymal stem cells (MSCs), suggesting that
CTAs may be a stem cell marker (9,10).
Multiple CTAs, such as LUZP4 and ODF1, have unique expression
profiles in multiple myeloma (MM) stem cells (11). MAGE-A3 has much higher expression
in a cancer stem cell-like side population in bladder cancer
(12). Additionally, considerable
numbers of CT genes had preferential expression in the stem
cell-like side population of multiple cancer cell lines (13). More importantly, the function of
CTAs has been involved in stem cell biology. For instance, SSX is
involved in self-renewal and differentiation of stem cells, as
supported by several investigations (9,14).
The melanoma antigen gene (MAGE) family represents
one of the largest groups of human tumor-associated antigens and
are well-characterized members of the cancer/testis antigen. MAGE
family has gained increasing interest as biomarkers in cancer and
targets of immunotherapies because a subset of these >40 human
proteins are classified as CTAs (15). Members of human MAGE family can be
divided into two categories based on tissue expression pattern:
type I MAGEs, including MAGE-A, -B and -C subfamily members which
are clustered on the X chromosome, are considered CTAs; type Π
MAGEs (MAGE-D, -E, -F, -G, -H, -L subfamilies and Necdin) are
expressed throughout many tissues in the body and are not
restricted to the X chromosome (15). MAGEs have been found to be broadly
expressed in many tumor types, and their re-expression are
associated with hallmarks of aggressive cancers. Importantly,
functional studies have demonstrated that some MAGE CTAs can have
non-overlapping oncogenic driver activity.
We focused our attention on MAGE CTAs (type I) and
globally analyzed their expression profile in a set of public
microarray data from EpCAM+ and EpCAM− HCC
patients (16). Notably, we found
that MAGE-A9, a MAGEA family member, was the only one with
significant enrichment expression in EpCAM+ HCC samples,
strongly suggesting MAGE-A9 could be a potential LCSCs biomarker.
MAGE-A9, a member of MAGE-A gene family, is frequently expressed in
a variety of human tumors, such as bladder (17,18),
breast (19,20), non-small cell lung cancer (21), laryngeal squamous cell carcinoma
(22) and renal cell carcinoma
(23) and hepatocellular carcinoma
(24). Furthermore, clinical and
functional studies showed that MAGE-A9 expression could provide
prognostic information and be a potential therapeutic target
(21–23,25).
However, the role of MAGE-A9 is still largely unknown in HCC,
especially liver cancer stem cells. In the present study, we found
that MAGE-A9 had higher expression in a subtype of HCC with
stem/progenitor cell-like features. The following functional
experiments showed that MAGE-A9 indeed contributed to malignant
biological phenotypes of HCC cells, including cell proliferation,
migration and chemoresistance in the context of EpCAM+
HCC cells. Collectively, MAGE-A9 can modulate liver cancer stem
cell-like characteristics and may be a potential target for LCSCs
therapy.
Materials and methods
Cell lines and tissue specimens
The liver tumor-derived cell lines included
PLC/PRF/5, Sk-hep-1, MHCC97, Hep3B and Huh-7 were obtained from the
Cell Bank of Chinese Academy of Sciences in Shanghai. These cell
lines were grown in Dulbecco's modified Eagle's medium (DMEM)
supplemented with 10% fetal bovine serum (FBS; Life Technologies,
Carlsbad, CA, USA) and penicillin (100 U/ml)/streptomycin sulfate
(100 µg/ml) (Invitrogen, Carlsbad, CA, USA). Cells were
cultured at 37°C in 5% CO2 humidified incubator. Cell
line authentication was performed by short tandem repeats (STRs)
profiling before this study. Liver cancer samples were obtained
with informed consent from each HCC patients who underwent curative
resection.
Immunohistochemical analysis
A commercial tissue micro-array (TMA) from Shanghai
Outdo Biotech Co., Ltd. (SOBC; Shanghai, China) is comprised of 90
paired formalin-fixed paraffin-embedded (FFPE) tissues from HCC
patients. The original clinical data of the TMA include patient
sex, age, tumor size, the 7th edition AJCC TNM stage, tumor grade,
histological type, lymph node metastasis status, OS time and
survival status. IHC staining was performed as previously described
(19,26). Briefly, the TMA sections (4
µm thickness) were deparaffinized and rehydrated by passage
through xylene and a graded alcohol series. Antigen retrieval was
performed using heat-mediated microwave methods and antigen
unmasking solution (Vector Laboratories, Burlingame, CA, USA).
Then, these tissue samples were naturally cooled to room
temperature (RT) and incubated with 0.3% H2O2
for 10 min to inactivate endogenous peroxidase activity. TMA
sections were incubated with a primary monoclonal mouse
anti-MAGE-A9 antibody (1:200; Abcam) and then by
peroxidase-conjugated secondary antibody. Negative controls were
included by replacement of the primary antibody with
phosphate-buffered saline (PBS). The reaction product was detected
by ABC and DAB kit (Vector Laboratories) and counterstained with
hematoxylin. Two experienced pathologists without any knowledge of
the clinicopathological information independently evaluated the
result of MAGE-A9 immunoreactivity. A semi-quantitative scoring
system (0–3) was used to evaluate the expression level of MAGE-A9
as previously described (24). The
intensity of the staining was classified as negative, weak,
moderate or strong. Staining intensity was scored as follows: 0
(negative), 1 (weakly positive), 2 (moderately positive) and 3
(strongly positive). The percentage of MAGE-A9-positive cells was
also scored according to 4 categories, where 1 was for 0–10%, 2 for
11–50%, 3 for 51-80% and 4 for 81–100%. The product of the
intensity and percentage scores was used as the final MAGE-A9
staining score. The degree of MAGE-A9 staining was quantified using
a two-level grading system as follows: <3 indicates low or no
expression while 3–9 indicates high expression.
Cell viability assay and colony formation
assay
For cell growth analysis, cells were plated on
96-well plates at a density of 2×10³ cells/well, and
cell viability was measured using the Cell Counting kit-8 (CCK-8;
Dojindo Laboratories, Kumamoto, Japan) according to the
manufacturer's instructions. Briefly, 10 µl of CCK-8
solution was added to each well, incubated with cells at 37°C for 1
h. Absorbance value was measured at 450 nm for 5 days. For
chemoresistance tests, cells were plated on 96-well plates at a
density of 1×10⁴ cells/well. When cells were 90%
confluent, they were treated with doxorubicin (Sigma-Aldrich, St.
Louis, MO, USA) and cisplatin (Alexis Biochemicals, Lausen
Switzerland) for 72 h, and cell viability was measured using the
CCK-8 method. For anchorage-dependent colony formation assay, HCC
cells were plated at a density of 2×10³ to
5×10³ cells/plate in 100-mm plates. Three weeks later,
forming colony were washed with PBS twice and then stained with
crystal violet. Anchorage-independent colony formation was
performed in 6-well plates, where cells were grown on 1% base agar
and 0.3% top agar medium for 3 weeks. Colonies were stained with
crystal violet and counted. All experiments were independently
repeated 3 times.
RNA isolation and quantitative reverse
transcription PCR (qRT-PCR)
Total RNA was prepared using TRIzol reagent (Life
Technologies), as described by the manufacturer's protocol. One
microgram of total RNA was reverse transcribed with iScript™ gDNA
Clear cDNA Synthesis kit (Bio-Rad Laboratories, Hercules, CA, USA).
Quantitative real-time reverse transcription PCR was performed
using iTaq™ Universal SYBR® Green Supermix (Bio-Rad
Laboratories). GAPDH was used as an internal control. All the
primer sequences were listed in Table
I.
 | Table IPrimers sequences used in the present
study. |
Table I
Primers sequences used in the present
study.
| Gene | mRNA Ref | Primer
sequence |
|---|
| MAGE-A9 | NM_005365 | Forward:
5′-CTGGGGGTCAGAGAGAAGG-3′ |
| Reverse:
5′-CTCTGCGACCTGAGGACACT-3′ |
| AFP | NM_001134 | Forward:
5′-AGAGGAGATGTGCTGGATTG-3′ |
| Reverse:
5′-GTGGTCAGTTTGCAGCATTC-3′ |
| EPCAM | NM_002354 | Forward:
5′-CTGAATTCTCAATGCAGGGTC-3′ |
| Reverse:
5′-CCCATCTCCTTTATCTCAGCC-3′ |
| KRT18 | NM_199187 | Forward:
5′-GGGAGCACTTGGAGAAGAAG-3′ |
| Reverse:
5′-CGGGCATTGTCCACAGTATT-3′ |
| ALB | NM_000477 | Forward:
5′-TGCTGATGAGTCAGCTGAAAA-3′ |
| Reverse:
5′-TCAGCCATTTCACCATAGGTT-3′ |
| GAPDH | NM_002046 | Forward:
5′-GAAGGTGAAGGTCGGAGTCA-3′ |
| Reverse:
5′-TTGAGGTCAATGAAGGGGTC-3′ |
Flow cytometric analysis
FITC-conjugated EpCAM monoclonal antibody (EBA-1;
Santa Cruz Biotechnology, Santa Cruz, CA, USA) was used to sort
EpCAM+ cells from Hep3B and HuH-7 cells. Cultured HCC
cells were dissociated with 0.25% trypsin-EDTA (1 mM) for 3 min,
and washed with fluorescence-activated cell sorting buffer [PBS
containing 1% fetal calf serum (FCS)] and then incubated for 1 h at
4°C in fluorescence-activated cell sorting buffer with anti-EpCAM
antibody. Flow cytometric analysis was performed using a
FACSCalibur or FACSAriaII (BD Biosciences, San Jose, CA, USA).
Transwell migration assay
Twenty-four-well, 8.0 µm was used to perform
Transwell assay. HCC cells were starved in serum-free medium for 8
h. These cells were seeded in the upper chamber with low-serum (1%
FBS) medium, while high-serum (10% FBS) medium was placed in the
lower chamber. Following an incubation period, the permeable cells
were stained and photographed. Stained cells were counted using
ImageJ software.
Spheroid colony formation assay
Cells were seeded at a density of 1,000 cells/ml in
the ultra-low attachment plate (Corning Costar, Corning, NY, USA)
in DMEM/Nutrient Mixture F-12 Ham (Sigma-Aldrich) supplemented with
recombinant human basic fibroblast growth factor (20 ng/ml), B-27,
recombinant human epidermal growth factor (20 ng/ml), L-glutamine
(200 mmol/l). Spheroids were observed and counted using inverted
microscope operated with a Nikon Ds-Fi1 camera and NIS Elements
software (Nikon, Tokyo, Japan).
Plasmid construction, lentivirus
production and transfection
Human MAGE-A9 coding sequence was cloned into
lentivirus vector pLenti vector. For MAGE-A9 knockdown, two shRNA
oligos against MAGE-A9 gene were designed and these target
sequences against MAGE-A9 is as follows: A9-sh1, 5′-CAT GCA GGT GAT
CTT TGG CAC TGA T-3′; A9-sh2, 5′-AAT TGA AGG TGG CTG AGT TGG TT-3′.
A scrambled shRNA control with sequence (5′-AAC AGT CGC GTT TGC GAC
TGG-3′) that does not match any known mammalian GenBank sequence
was used as a negative control. The shRNA oligos were reannealed,
and then cloned into lentivirus vector pLKO.1-TRC cloning vector.
Lentivirus were generated by transfecting lentivirus vectors with
MAGE-A9 overexpression or knockdown together with packaging vector
psPAX2 and pMD2.G into 293T cells. Polybrene (Sigma-Aldrich) at the
concentration of 8 µg/ml was added to enhance the infection.
Blasticidin (0.5 µg/ml) and puromycin (1 µg/ml) were
used to screen the stable infected cells.
Western blotting assay
HCC cells were harvested after washing twice with
ice-cold PBS. Protein was extracted by RIPA Lysis and Extraction
Buffer (Thermo Fisher Scientific, Waltham, MA, USA). The protein
concentration was measured using a BCA protein assay kit (Thermo
Fisher Scientific/Pierce). The same amounts of protein lysates were
boiled at 95°C after adding Laemmli protein sample buffer (Bio-Rad
Laboratories). Samples were separated on 4–12% SDS-polyacrylamide
gels and transferred to a nitrocellulose membrane (Life
Technologies). The membranes were blocked with 5% BSA for 1 h at
room temperature and incubated with primary at 4°C overnight.
Primary antibodies used in the present study were MAGE-A9, GAPDH
and ALB antibody from Santa Cruz Biotechnology, OCT4, SOX2 and
NANOG from Cell Signaling Technology (Danvers, MA, USA).
Peroxidase-conjugated secondary antibodies were used, membranes
were developed using the enhanced chemiluminescent immunoassay for
the detection of antigen.
Tumorigenicity in mice
HCC cells were mixed with an equal volume of
Matrigel, and then subcutaneously injected into the flank of male
NOD/SCID mice, 4–5 weeks old. Tumor dimensions were measured twice
a week using a digital caliper and the tumor volume was calculated
by the formula: V = 0.5 × width2 × length. The mice were
sacrificed by CO2 euthanasia. Kaplan-Meier method was
used to analyze tumor-free survival rate, and the statistical
significance was determined using the log-rank test. P-values that
were <0.05 were considered statistical significant. All mice
were housed in pathogen-free animal facilities and handled in
accordance with the guidelines of the Institutional Animal Care and
Use Committee at the Affiliated Hospital of Integrated Traditional
Chinese and Western Medicine, Jiangxi University of Traditional
Chinese Medicine. All animal procedures were conducted in
compliance with institutional guidelines and protocols.
Statistical analysis
Gene expression data were obtained from the National
Center for Biotechnology Information Gene Expression Omnibus
database (GEO accession number GSE5975), as previously published
(16). The differences between the
two groups in gene expression, cell proliferation, colony number,
and permeable cells number were calculated using the Student's
t-test. The significance of MAGE-A9 protein expression on clinical
parameters of HCC was determined by Chi-square test. Kaplan-Meier
survival analysis was also employed to explore the associations
between the MAGE-A9 expression and the outcome of HCC patients. For
all tests, the significant level for statistical analysis was set
at P<0.05. All the statistical analyses were conducted by using
the GraphPad Prism software 6.0 (GraphPad Software, Inc., San
Diego, CA, USA).
Results
High expression of MAGE-A9 in
EpCAM+ HCC patients
We first analyzed the expression profiling of type I
MAGE family members based on a public microarray dataset deposited
in Gene Expression Omnibus (GEO) database. In the dataset, gene
expression profiling was established on tumor tissues from 238 HCC
patients, which were categorized into EpCAM+ (n=95) and
EpCAM− (n=143) subgroups according to EpCAM, a marker
for cancer stem cells in hepatocellular carcinoma. We compared the
expression difference of MAGE members between EpCAM+ and
EpCAM− HCCs. Of 13 MAGE genes available in the database,
6 genes exhibit significant differences between the two groups
(Fig. 1A and Table II). Notably, only MAGE-A9 had
higher expression in EpCAM+ HCCs, whereas MAGE-A1,
MAGE-A8, MAGE-A10, MAGE-A12 and MAGE-B18 had lower expression in
EpCAM+ HCCs compared with EpCAM− HCCs
(Fig. 1B). Because a previous
study proposed that EpCAM+/AFP+ HCC subtype
resembling liver stem/progenitors cells was characterized by a
highly invasive nature, chemoresistance to cytotoxic reagents, and
a worse prognosis (27). To
evaluate the MAGE-A9 expression in liver stem/progenitors, we
performed real-time qPCR to examine the expression of MAGE-A9,
EpCAM and AFP in another different cohort of 61 HCC samples stored
in liquid nitrogen. According to EpCAM and AFP expression level, we
divided these HCC samples into EpCAM+/AFP+
HCCs group (ΔctEpCAM-GAPDH <5 and
ΔctAFP-GAPDH <5, n=10) and
non-EpCAM+/AFP+ HCCs group
(ΔctEpCAM-GAPDH >5 or ΔctAFP-GAPDH >5,
n=51) (Fig. 1C). Further analysis
showed that MAGE-A9 had significant enriched expression in
EpCAM+/AFP+ HCCs in comparison with
non-EpCAM+/AFP+ HCCs (P=0.002) (Fig. 1D).
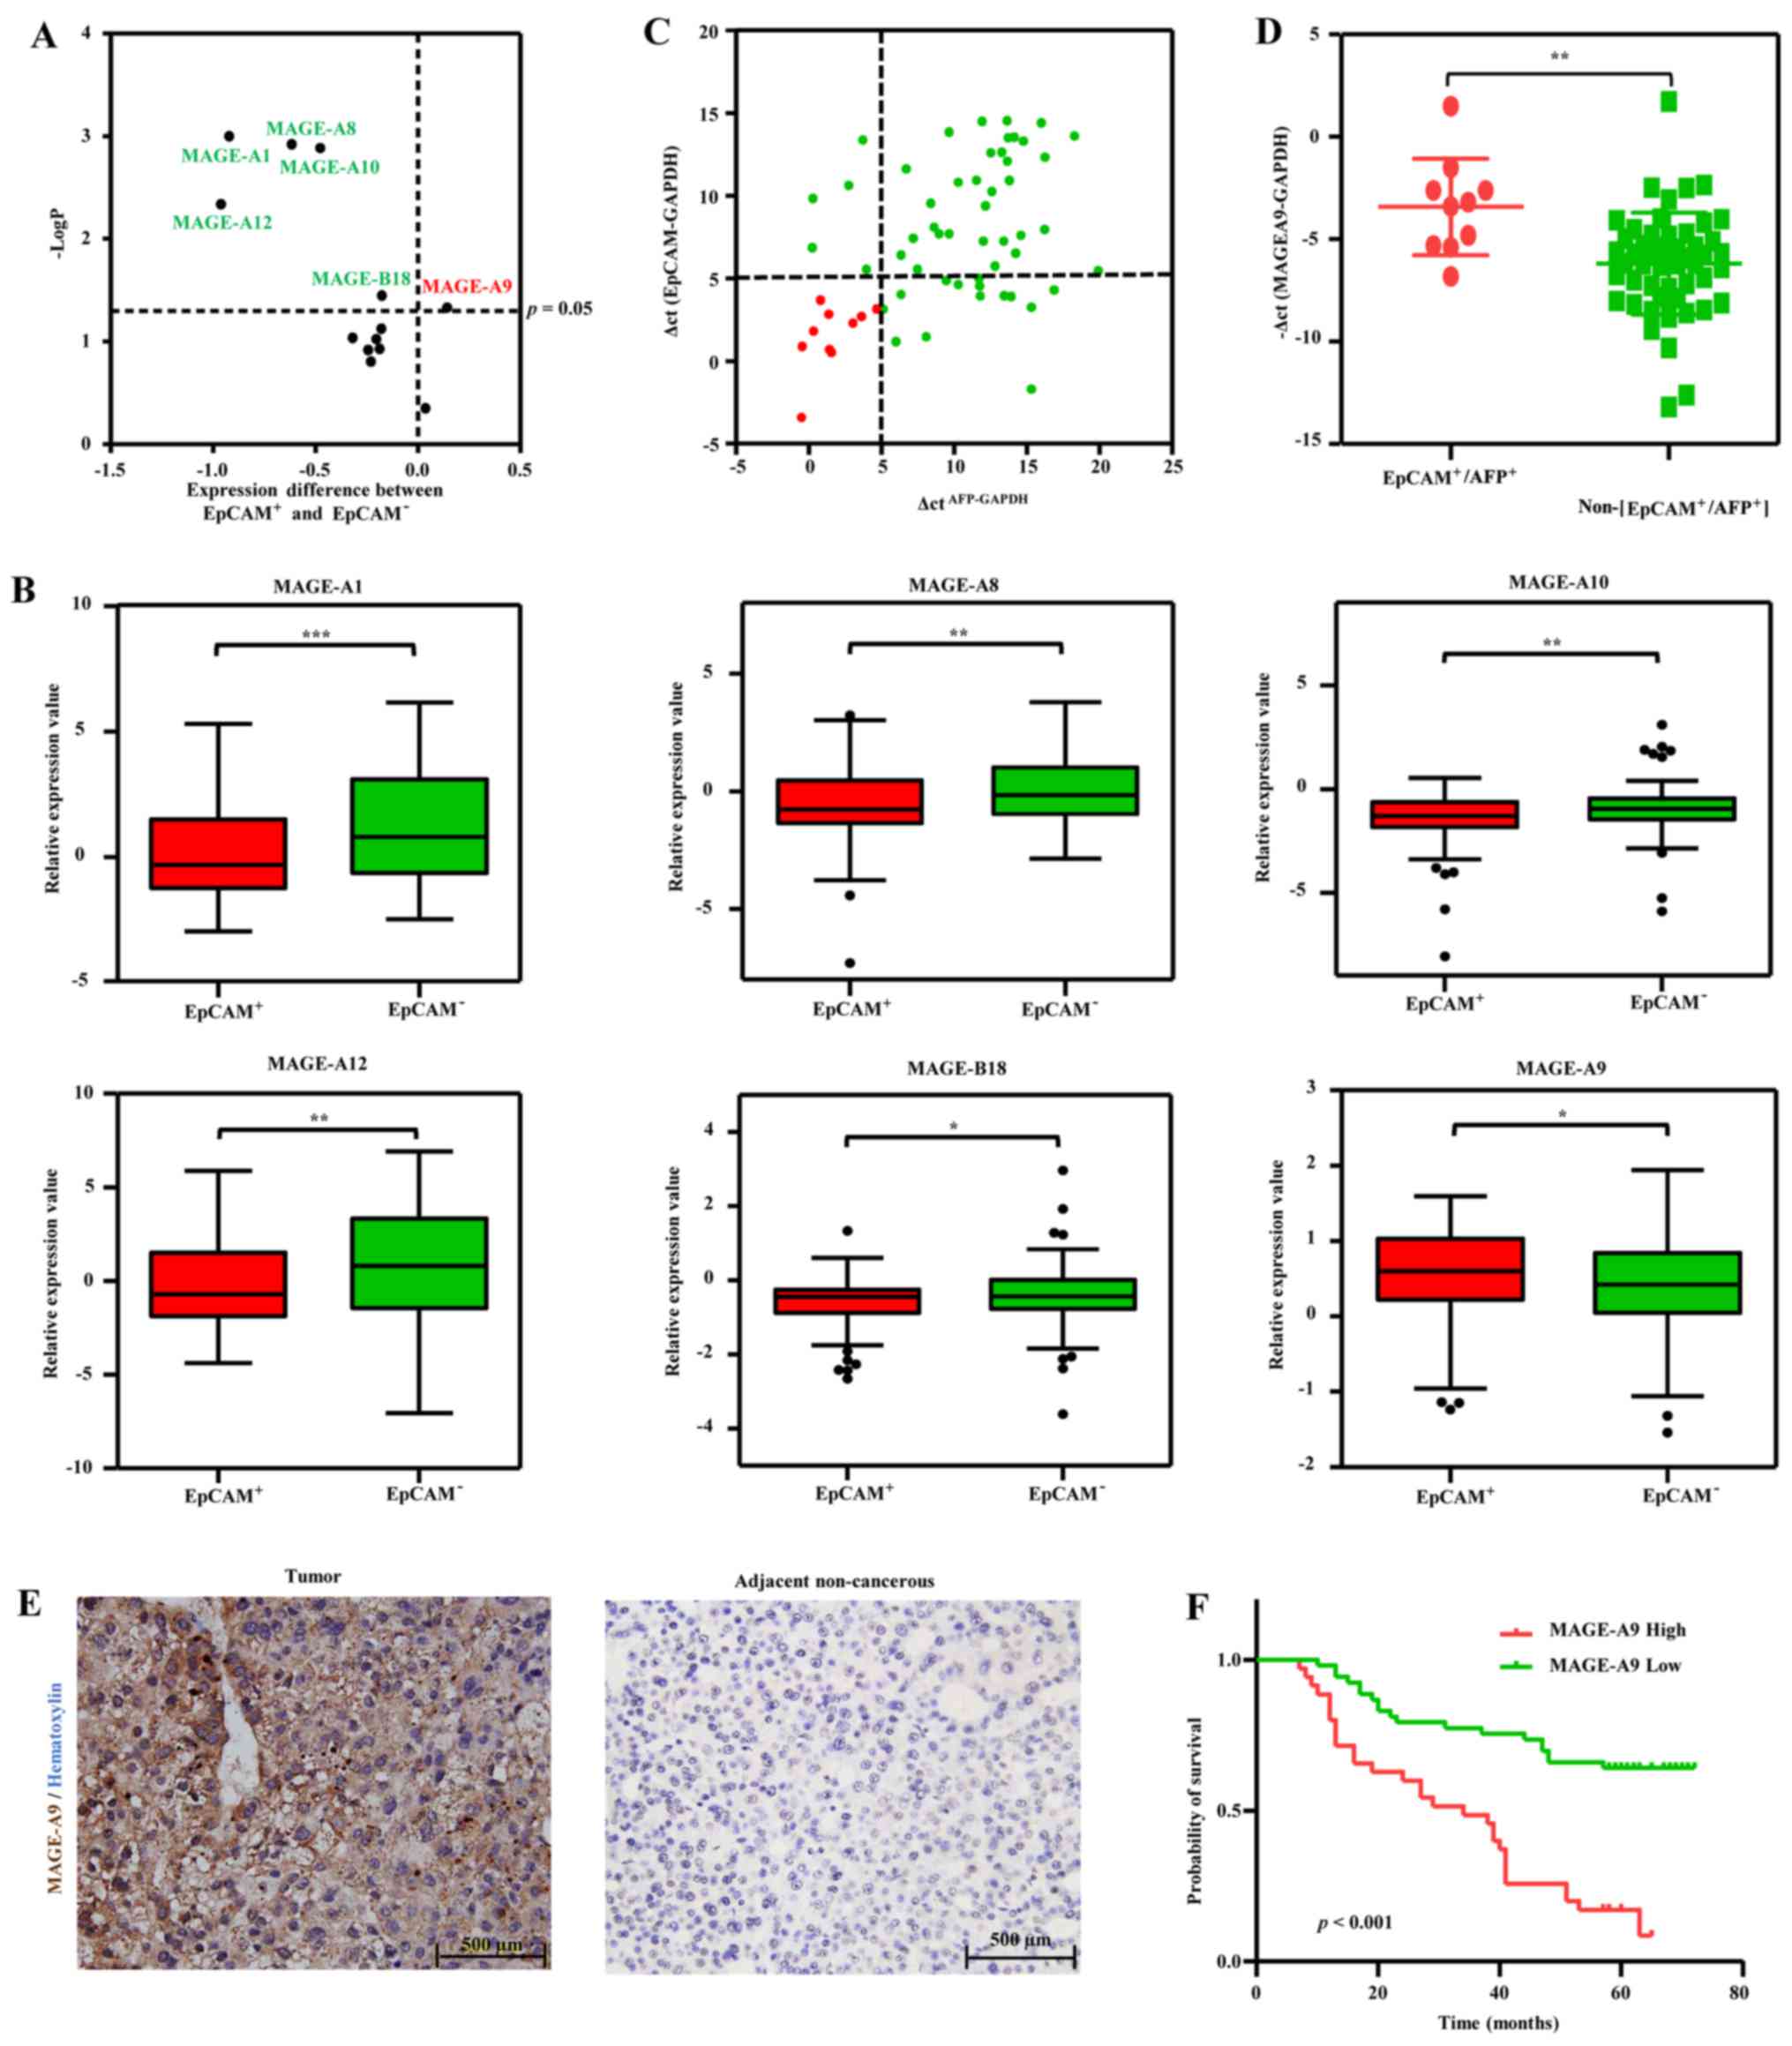 | Figure 1High expression of MAGE-A9 in
EpCAM+ HCC patients. (A) Expression difference and
statistical significance of 13 MAGE genes between EpCAM+
HCCs (n=95) and EpCAM− HCCs (n=143). P<0.05 or
−Logp >1.301 was considered to be significant. (B)
Expression profiling of MAGE-A1, MAGE-A8, MAGE-A9, MAGE-A10,
MAGE-A12 and MAGE-B18 in EpCAM+ HCCs and
EpCAM− HCCs are displayed as box and whisker (Tukey)
Plots, where the dots at the end of the boxplot represent outliers.
(C) Quantitative real-time polymerase chain reaction (qPCR) was
carried out to measure the expression level of EpCAM and AFP in 61
HCC tumors, where relative gene expression level was normalized to
the GAPDH internal control. According to the relative expression
value of EpCAM and AFP, 10 EpCAM+/AFP+ HCC
samples were demarcated at the region with EpCAM-high expression
(ΔctEpCAM-GAPDH <5) and AFP-high expression
(ΔctAFP-GAPDH <5), shown as red points. Remaining 51
HCC tumors, shown as green points, belong to
non-(EpCAM+/AFP+) HCCs. (D) Real-time qPCR
analysis of MAGE-A9 in EpCAM+/AFP+ HCCs
(n=10) and non-(EpCAM+/AFP+) HCCs (n=51) was
shown in the scatter plot, where the dots indicate
-ΔctMAGE-A9-GAPDH value, and the lines represent the
mean ± SD value, respectively. Statistical significance was
determined by two-tailed t-test. **P<0.01 (E)
Immunohistochemical analysis of MAGE-A9 in HCCs. Representative
photomicrographs of MAGE-A9 high expression (left panel) in tumor
tissue and MAGE-A9 low expression (right panel) in non-cancerous
liver are shown (scale bar, 500 µm). (F) Kaplan-Meier
survival curves for 90 HCC patients. MAGE-A9 high HCCs (n=40)
presented a poor prognosis compared with those HCCs with low
MAGE-A9 expression (n=50). |
| Table IIExpression analysis of MAEG genes in
HCC samples. |
Table II
Expression analysis of MAEG genes in
HCC samples.
| Gene symbol | mRNA RefSeq | EpCAM+
HCC (n=95) | EpCAM−
HCC (n=143) | Difference between
means | P-value |
|---|
| MAGE-A1 | NM_004988 | 0.240±0.221 | 1.162±0.190 | −0.922±0.294 | 0.001 |
| MAGE-A5 | NM_021049 | −0.391±0.097 | −0.212±0.078 | −0.179±0.124 | 0.075 |
| MAGE-A8 | NM_005364 | −0.514±0.167 | 0.102±0.121 | −0.616±0.201 | 0.001 |
| MAGE-A9 | NM_005365 | 0.546±0.064 | 0.404±0.054 | 0.142±0.084 | 0.047 |
| MAGE-A10 | NM_021048 | −1.473±0.131 | −0.996±0.093 | −0.478±0.157 | 0.001 |
| MAGE-A11 | NM_005366 | −1.127±0.117 | −0.940±0.101 | −0.187±0.157 | 0.117 |
| MAGE-A12 | NM_005367 | −0.016±0.263 | 0.945±0.242 | −0.961±0.366 | 0.005 |
| MAGE-B1 | NM_002363 | −1.992±0.144 | −1.763±0.159 | −0.230±0.227 | 0.157 |
| MAGE-B2 | NM_002364 | −0.837±0.206 | −0.518±0.139 | −0.319±0.239 | 0.092 |
| MAGE-B3 | NM_002365 | −1.382±0.113 | −1.178±0.101 | −0.203±0.154 | 0.094 |
| MAGE-B4 | NM_002367 | −0.919±0.192 | −0.956±0.176 | 0.036±0.266 | 0.446 |
| MAGE-B10 | NM_182506 | −1.434±0.138 | −1.189±0.143 | −0.244±0.208 | 0.121 |
| MAGE-B18 | NM_173699 | −0.599±0.068 | −0.422± 0.065 | −0.177±0.097 | 0.036 |
To confirm MAGE-A9 protein expression in HCC,
immunohistochemical staining using MAGE-A9 antibody was carried out
on a tissue array loaded with a different group of 90 paired FFPE
samples, including HCC tissues and their adjacent non-cancerous
tissues. Expectedly, high MAGE-A9 expression levels was observed in
40 of 90 (44%) HCC tissue samples, consistent with a previous
report (24). There was
significant difference in high expression rate of MAGE-A9 protein
between HCC tissues and non-cancerous tissues (P=0.005). As shown
in Fig. 1E, MAGE-A9 protein was
primarily localized in the cytoplasm of HCC cells. MAGE-A9 protein
high expression was significantly correlated with tumor size
(P=0.011) and recurrence (P=0.009), whereas there were no
significant associations between MAGE-A9 protein expression level
and other clinical features, including sex, age, cirrhosis, HBV,
HCV, pathological grade and AFP status. The association between
MAGE-A9 protein expression and clinicopathological parameters is
summarized in Table III.
MAGE-A9-low HCCs showed better survival than HCCs with MAGE-A9-high
expression, and significantly MAGE-A9-high HCCs exhibited a worse
prognosis than MAGE-A9 low HCCs (P<0.001; Fig. 1F). Overall, our analyses suggest
that MAGE-A9 expression has higher levels in a subtype of HCCs with
stem/progenitor characteristics and influences tumor sizes,
recurrence and survival of HCC patients.
| Table IIIRelationship of high MAGE-A9
expression with clinicopathological characteristics in HCCs. |
Table III
Relationship of high MAGE-A9
expression with clinicopathological characteristics in HCCs.
| Parameters | MAGE-A9- high
(n=40) | MAGE-A9- low
(n=50) | P-value |
|---|
| Sex | | | 1.000 |
| Male | 33 | 41 | |
| Female | 7 | 9 | |
| Age (years) | | | 0.328 |
| <60 | 28 | 40 | |
| ≥60 | 12 | 10 | |
| Cirrhosis | | | 0.145 |
| Positive (+) | 37 | 41 | |
| Negative (−) | 3 | 9 | |
| HBsAg | | | 0.180 |
| Positive (+) | 32 | 45 | |
| Negative (−) | 8 | 5 | |
| AntiHCV | | | 0.260 |
| Positive (+) | 1 | 0 | |
| Negative (−) | 38 | 49 | |
| Pathological
grade | | | 0.277 |
| I–II | 2 | 0 | |
| II–III | 27 | 36 | |
| III–IV | 11 | 14 | |
| Tumor size
(cm) | | | 0.011a |
| >5 | 24 | 16 | |
| ≤5 | 16 | 34 | |
| Serum AFP level
(µg/l) | | | 1.000 |
| High >400 | 15 | 18 | |
| Low ≤400 | 25 | 32 | |
| Recurrence | | | 0.009a |
| Yes | 30 | 23 | |
| No | 10 | 27 | |
MAGE-A9 expression is enriched in
EpCAM+ HCC cells and spheroid colonies formed by cancer
stem cells
We next evaluated the expression of MAGE-A9 in
EpCAM+ and EpCAM− cells, which were sorted
from Hep3B and Huh-7 HCC cells using EpCAM-FITC antibody. We found
that MAGE-A9 significantly exhibited elevated expression in
EpCAM+ cells compared with EpCAM− cells
(Fig. 2A and B). To further
examine MAGE-A9 expression in LCSCs, we employed a method of
serum-free suspension culture method (28,29)
to isolate stem-like cells from Hep3B and Huh-7 cells. As expected,
the enrichment of MAGE-A9 protein occurred in spheroid colonies
compared with parent cells of Hep3B and Huh-7, demonstrated by
western blotting assay, respectively (Fig. 2C and D).
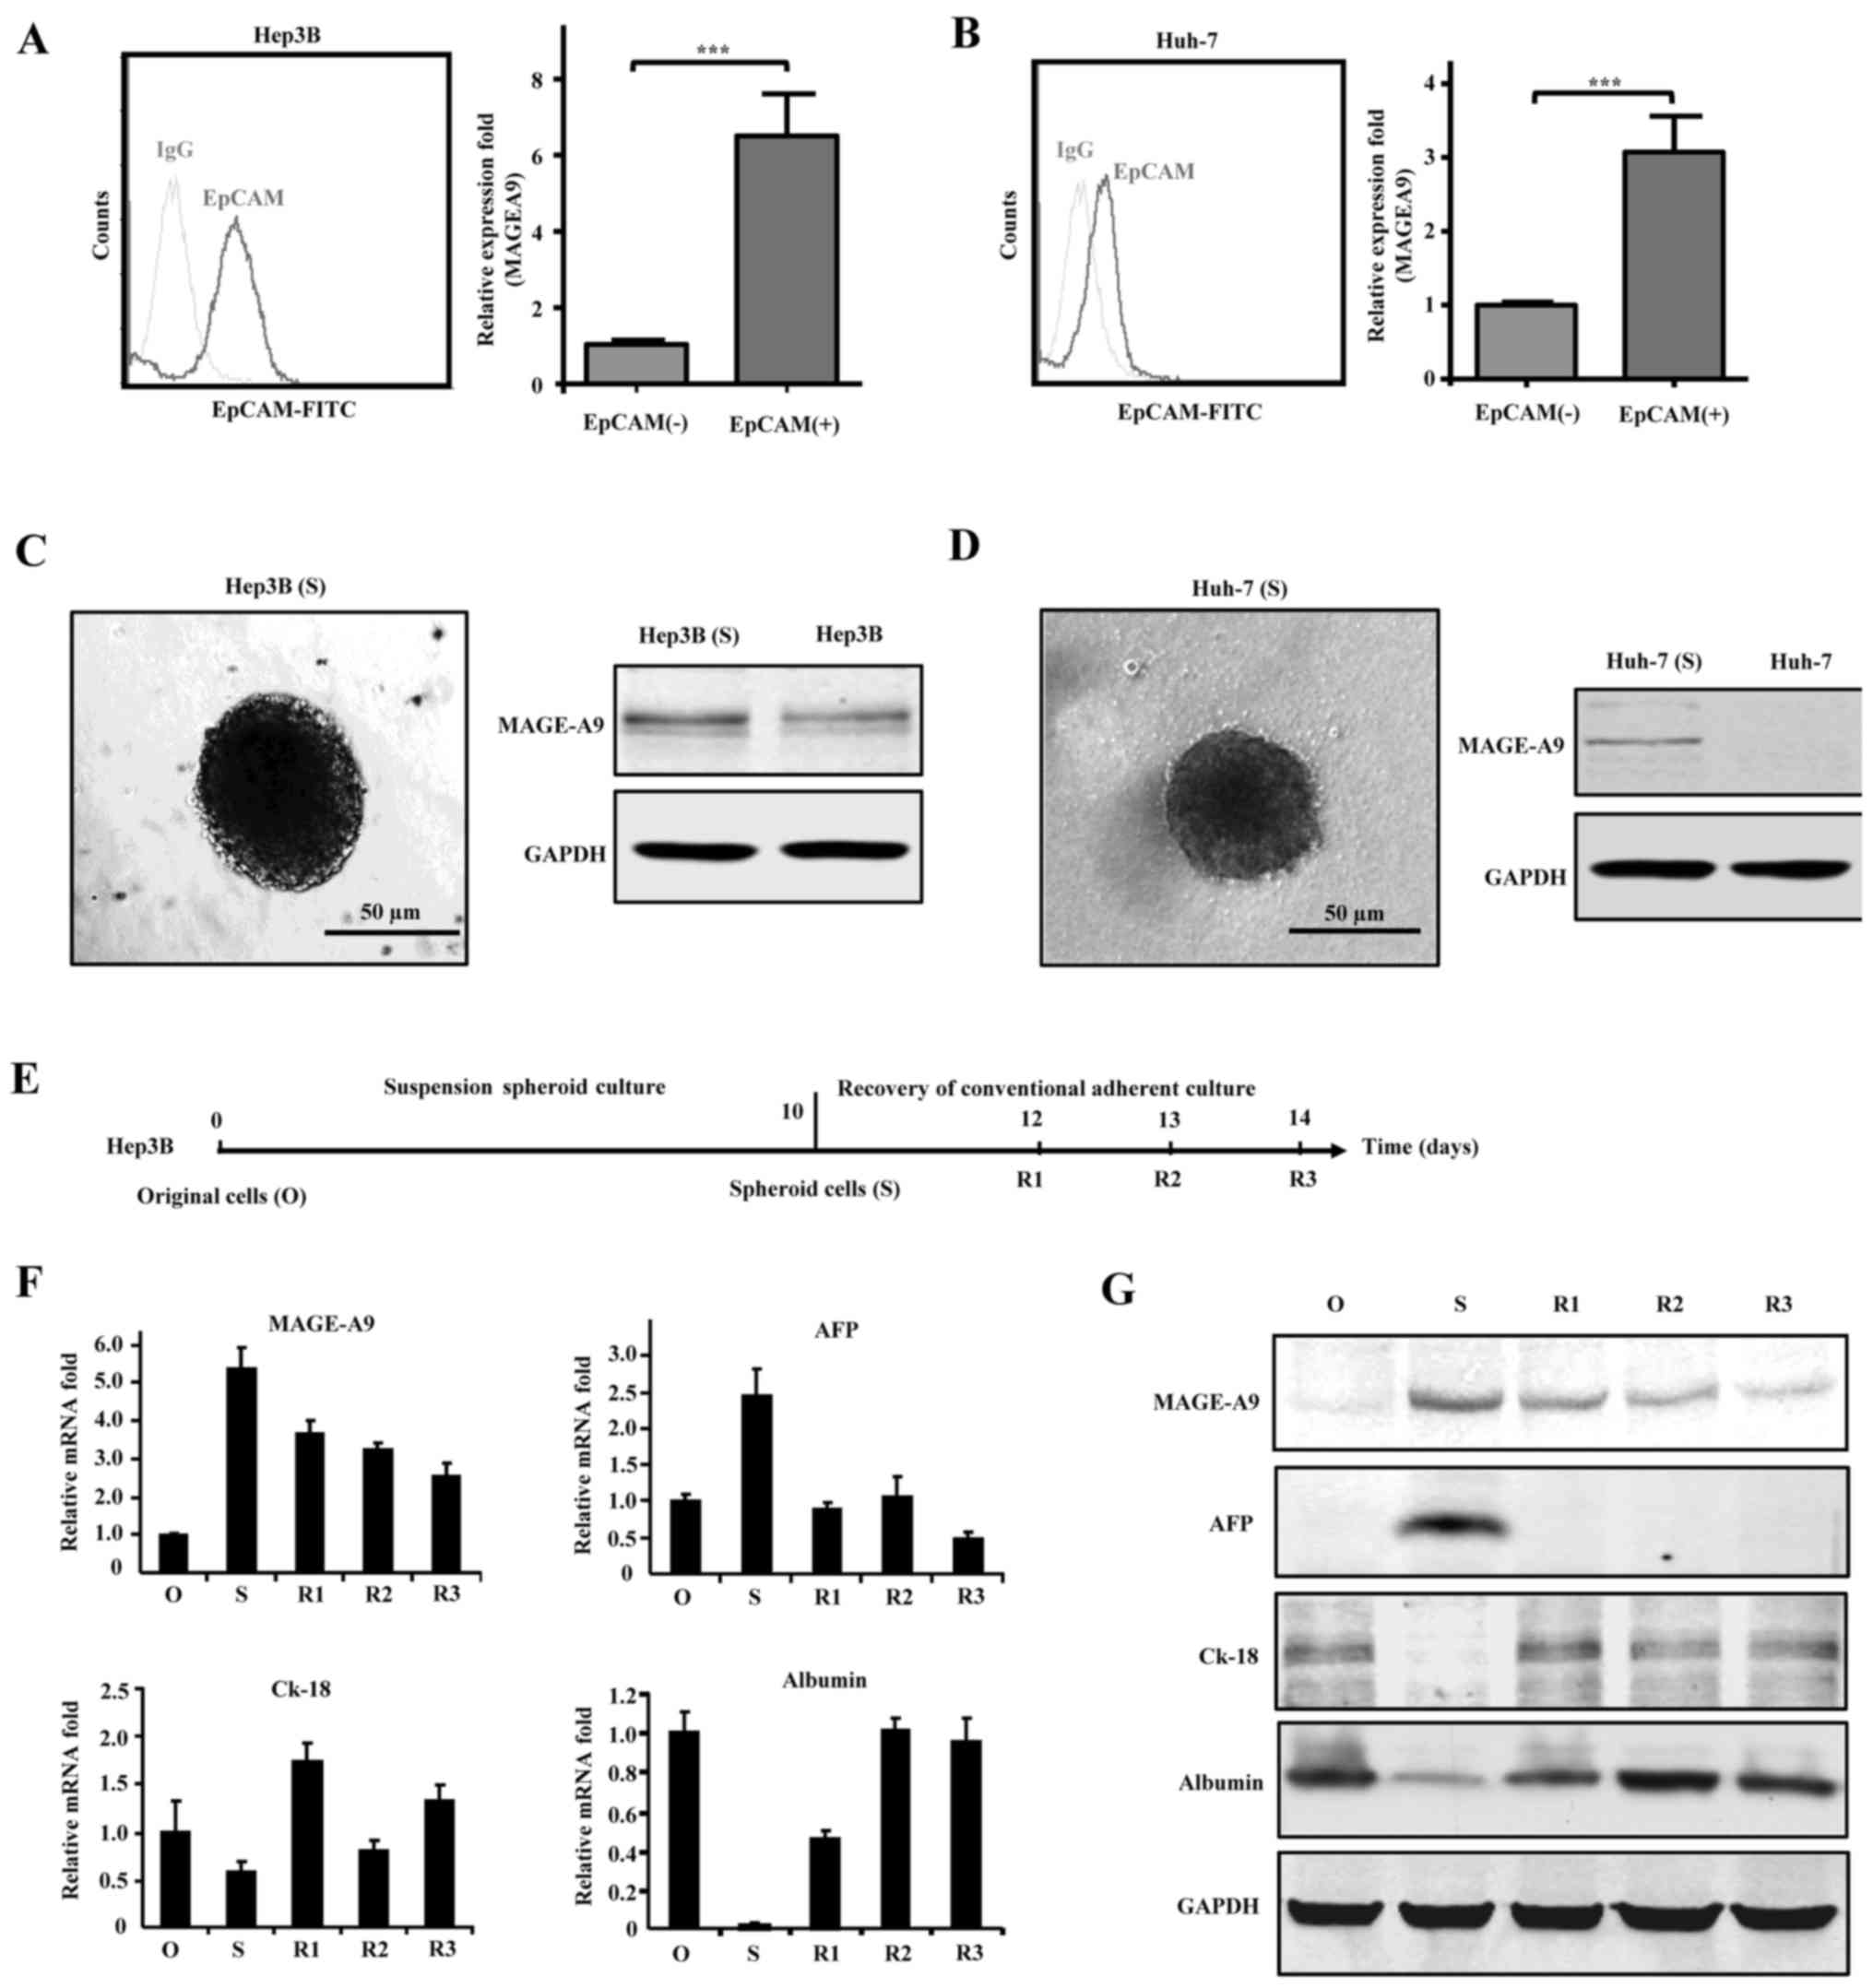 | Figure 2Enriched MAGE-A9 expression in
EpCAM+ HCC cells and spheroid colonies. (A) Quantitative
reverse transcription-polymerase chain reaction (qRT-PCR) analysis
of MAGE-A9 in EpCAM+ and EpCAM− Hep3B cells,
which were isolated by FACS sorting. (B) EpCAM+ and
EpCAM− Huh-7 cells were sorted by flow cytometry, and
qRT-PCR examined the MAGE-A9 expression. (C and D) Spheroid
colonies, shown in left panel, were derived from Hep3B (C) and
Huh-7 (D) cells cultured in serum-free medium, and MAGE-A9 protein
was detected by western blot assay (right panel) in parent and
spheroid cells. (E) Original Hep3B cells (O) were subject to
spheroid culture in ultralow attachment plates for 10 days until
these spheroid colonies (S) were produced. Then the spheroid
colonies were reverted to the previous conventional adherent
culture way for 3 days (R1, R2 and R3). (F) qRT-PCR analysis of the
relative mRNA levels of MAGE-A9, AFP, Ck-18 and ALB in different
culture times. (G) Western blotting assay was performed to evaluate
the expression of MAGE-A9, AFP, Ck-18 and ALB. GAPDH was used as an
internal reference. |
On the other hand, we restored the spheroid colony
formed by Hep3B cells to the conventional adherent culture
condition, and evaluated MAGE-A9 expression level at different
culture time-points (Fig. 2E). As
a result, MAGE-A9 enrichment gradually decreased when these
spheroid colonies were returned into the conventional culture
manner, as indicated by quantitative RT-PCR (Fig. 2F) and western blotting assay
(Fig. 2G). Moreover, we also
examined the expression of certain genes (AFP, cytokeratin 18 and
albumin), which could reflect differentiated state of hepatic
stem/progenitor and mature cells. The results showed that AFP was
upregulated in the spheroid colonies and then decreased gradually
upon conventional adherent culture, whereas cytokeratin 18 (Ck-18)
and albumin (ALB) expression was downregulated in the spheroid
colonies and subsequently restored in recovered cells (Fig. 2F and G). Collectively, the data
suggest that MAGE-A9 exhibits enriched expression in liver cancer
stem cells.
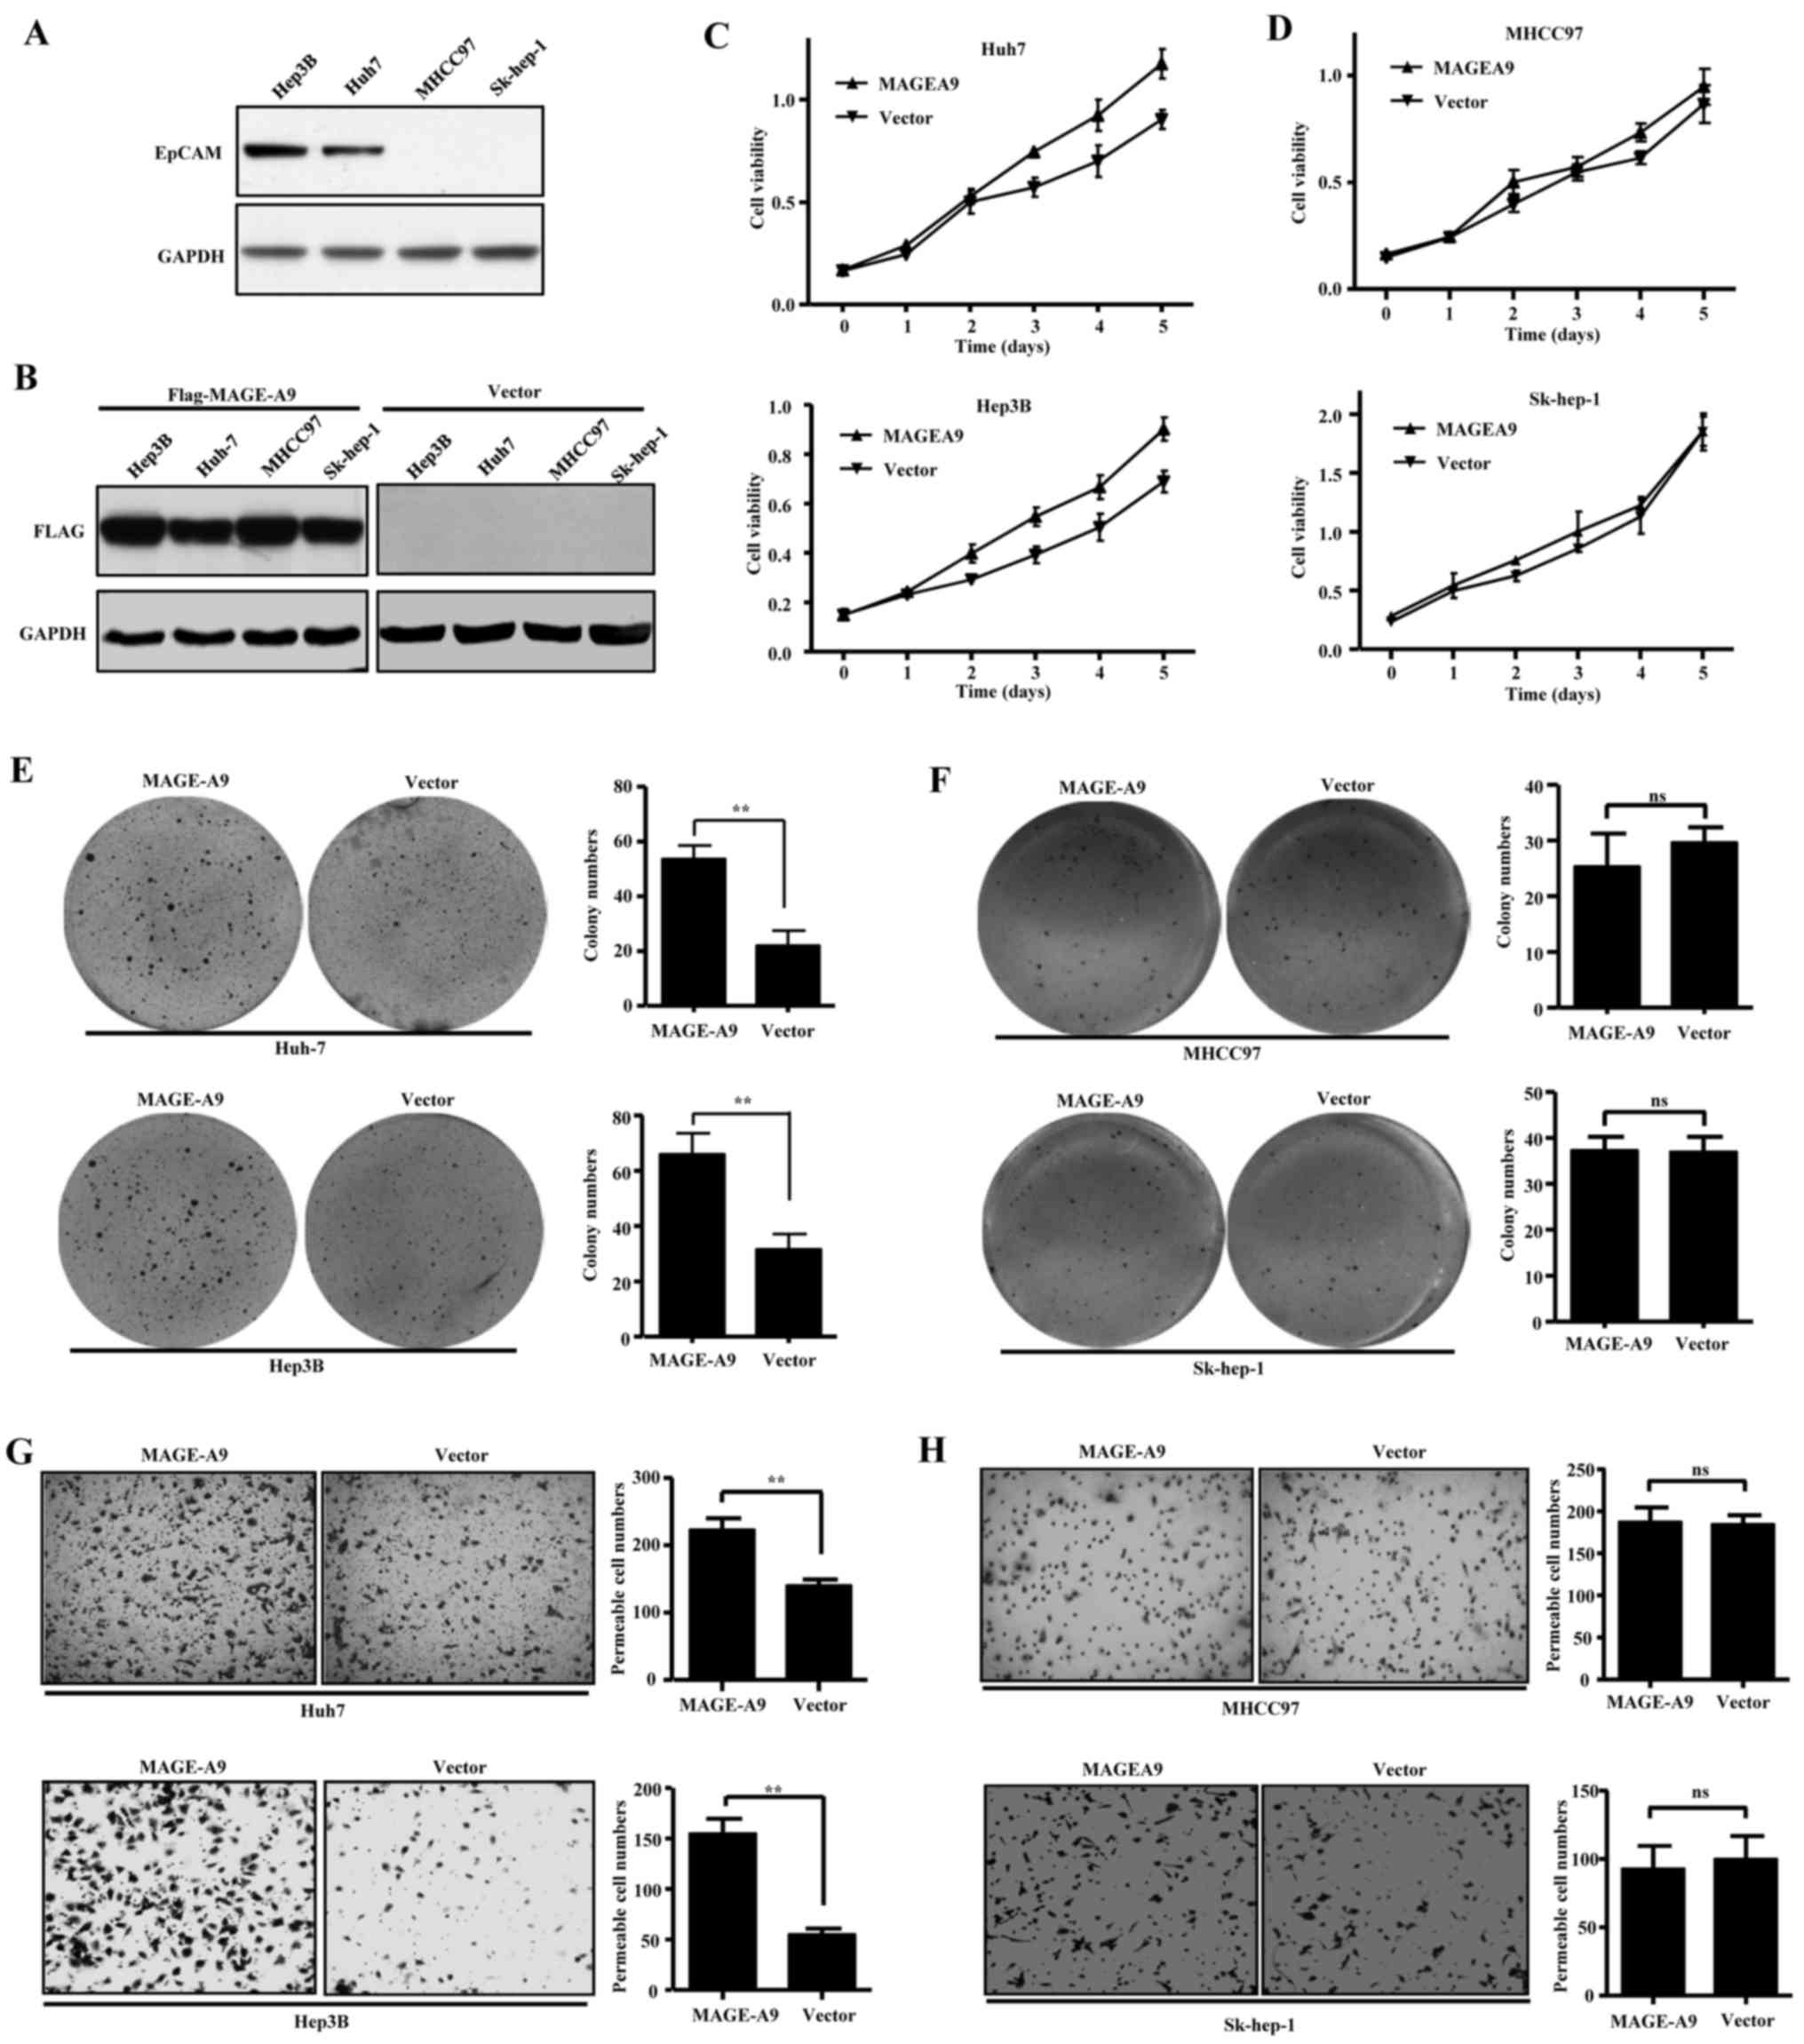
Effects of MAGE-A9 overexpression on cell
proliferation, colony formation and cell migration
To investigate whether MAGE-A9 high-expression
contributes to malignancy, we performed cell growth curve and
colony formation assay to evaluate the role of MAGE-A9 in HCC cell
lines, including Hep3B, Huh-7, MHCC97 and Sk-hep-1. As reported,
Hep3B and Huh-7 cells are EpCAM+, while MHCC97 and
Sk-hep-1 cells remain EpCAM− (7,30,31),
which was also confirmed by western blot assay (Fig. 3A). The HCC cells were transfected
with lentivirus carrying flagged MAGE-A9, and western blotting
assay showed that ectopic MAGE-A9 stably expressed in the four HCC
cell lines (Fig. 3B).
Intriguingly, MAGE-A9 overexpression led to increased growth of
Hep3B and Huh-7 cells (Fig. 3C),
but had no obvious effects on cell proliferation of MHCC97 and
Sk-hep-1 cells (Fig. 3D).
Similarly, anchorage-dependent colony formation assay showed
overexpressed MAGE-A9 significantly promoted anchorage-dependent
colony formation of Hep3B and Huh-7 cells (Fig. 3E), while the colony formation seems
to be hardly influenced by MAGE-A9 overexpression in MHCC97 and
Sk-hep-1 cells (Fig. 3F). In
addition, we evaluated the effect of MAGE-A9 on cell migration
using Transwell assay. The result showed that MAGE-A9
overexpression significantly promoted migration ability of Hep3B
and Huh-7 cells (Fig. 3G), but had
few effect on MHCC97 and Sk-hep-1 cells (Fig. 3H). Taken together, these data
demonstrate that MAGE-A9 depends on the context of EpCAM expression
to play its roles in promoting cell proliferation, colony formation
and migration.
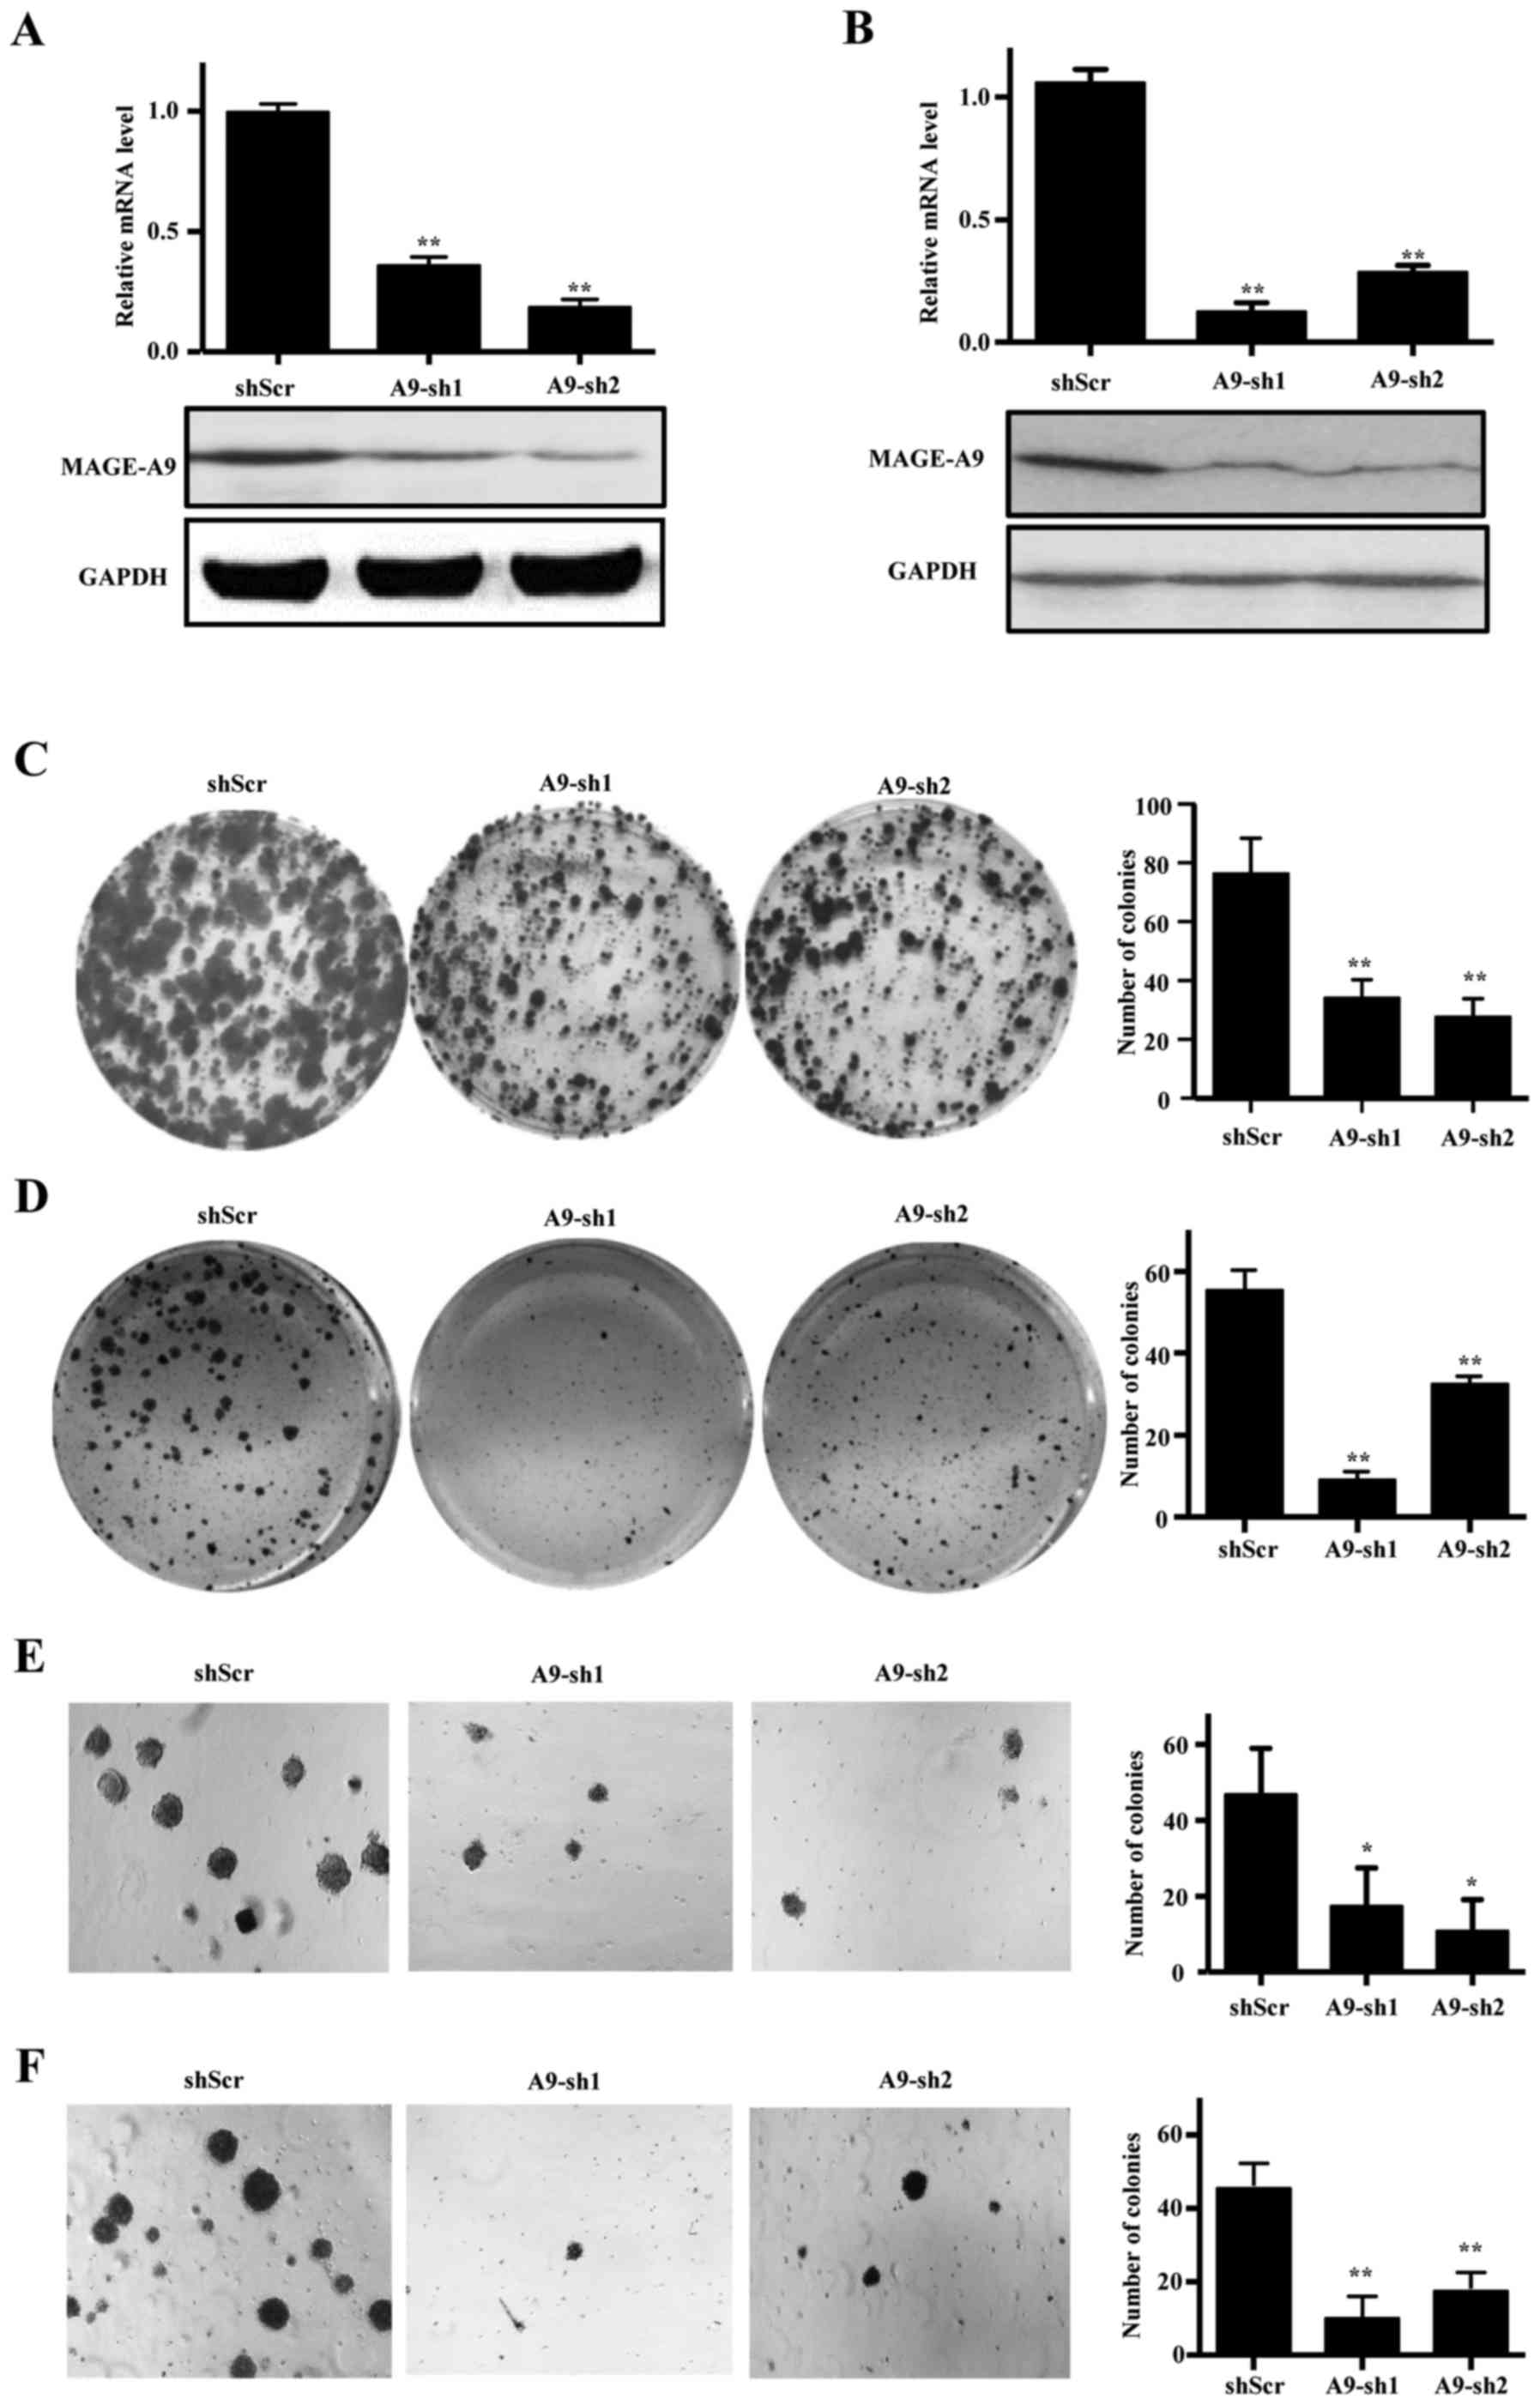
Effects of MAGE-A9 knockdown on HCC cell
proliferation and self-renewal
Above investigations suggested that HCC cells with
MAGE-A9 high expression are potential cancer stem/progenitor cells
as an initiating role in tumorigenicity. To confirm that MAGE-A9
could serve as a therapeutic target, we employed
lentivirus-mediated RNA interference to knock down endogenous
MAGE-A9 in Hep3B and Huh-7 cells, as confirmed by qPCR and western
blot analysis (Fig. 4A and B).
Then, we performed anchorage-dependent colony formation and
spheroid colony formation assays to observe the effects of MAGE-A9.
As a result, MAGE-A9 knockdown significantly inhibited
anchorage-dependent colony formation of HCC cell lines Hep3B and
Huh-7 (Fig. 4C and D).
Furthermore, the spheroid colony formation assay demonstrated that
MAGE-A9 knockdown also significantly restrained spheroid colony
formation of the two HCC cell lines (Fig. 4E and F). These data suggested that
MAGE-A9, a regulator of cell proliferation and self-renewal, could
serve as a potential therapeutic target against HCC.
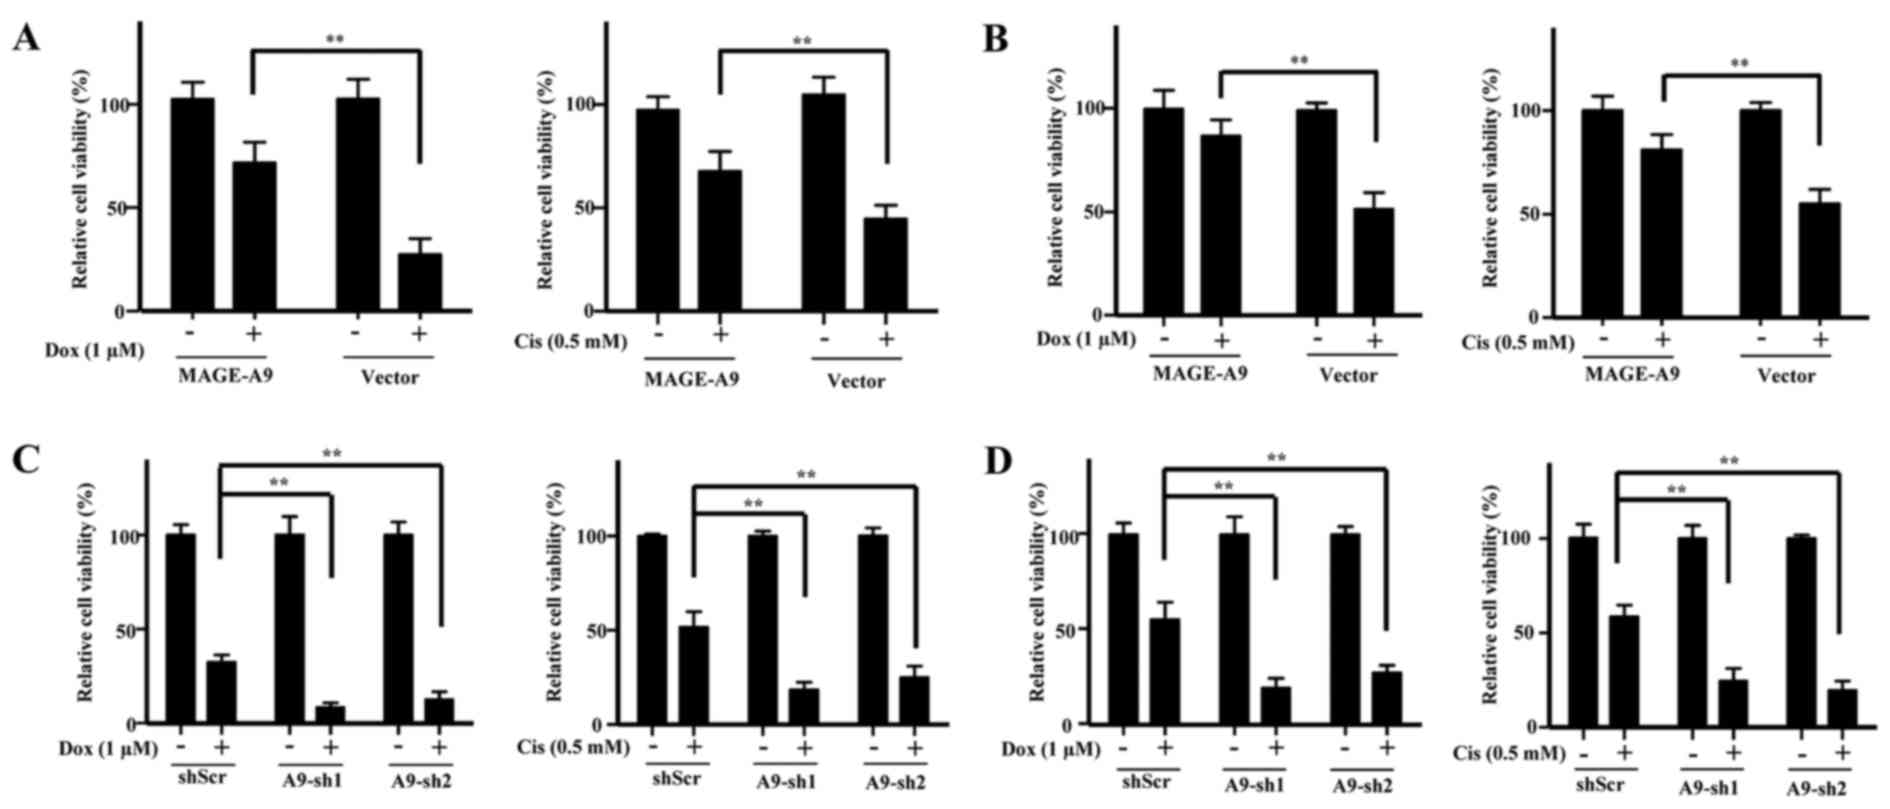
MAGE-A9 confers chemoresistance in
EpCAM+ HCC cells
As reported, cancer stem/progenitor cells are
resistant to routine chemotherapy. To investigate whether MAGE-A9
could be involved in chemoresistance, we treated Hep3B and Huh-7
cells with two kinds of common chemotherapeutic drugs: doxorubicin
and cisplatin, when MAGE-A9 was overexpressed and knocked down,
respectively. Notably, MAGE-A9 overexpression enhanced
chemoresistance to doxorubicin and cisplatin in the two
EpCAM+ HCC cell lines Hep3B and Huh-7 (Fig. 5A and B). On the contrary, MAGE-A9
knockdown promoted chemosensitivity to the two drugs in Hep3B cells
(Fig. 5C). Moreover, similar
results were observed in Huh-7 cells (Fig. 5D). Taken together, these data
suggest that MAGE-A9 plays a vital role in the chemoresistance of
EpCAM+ HCC.
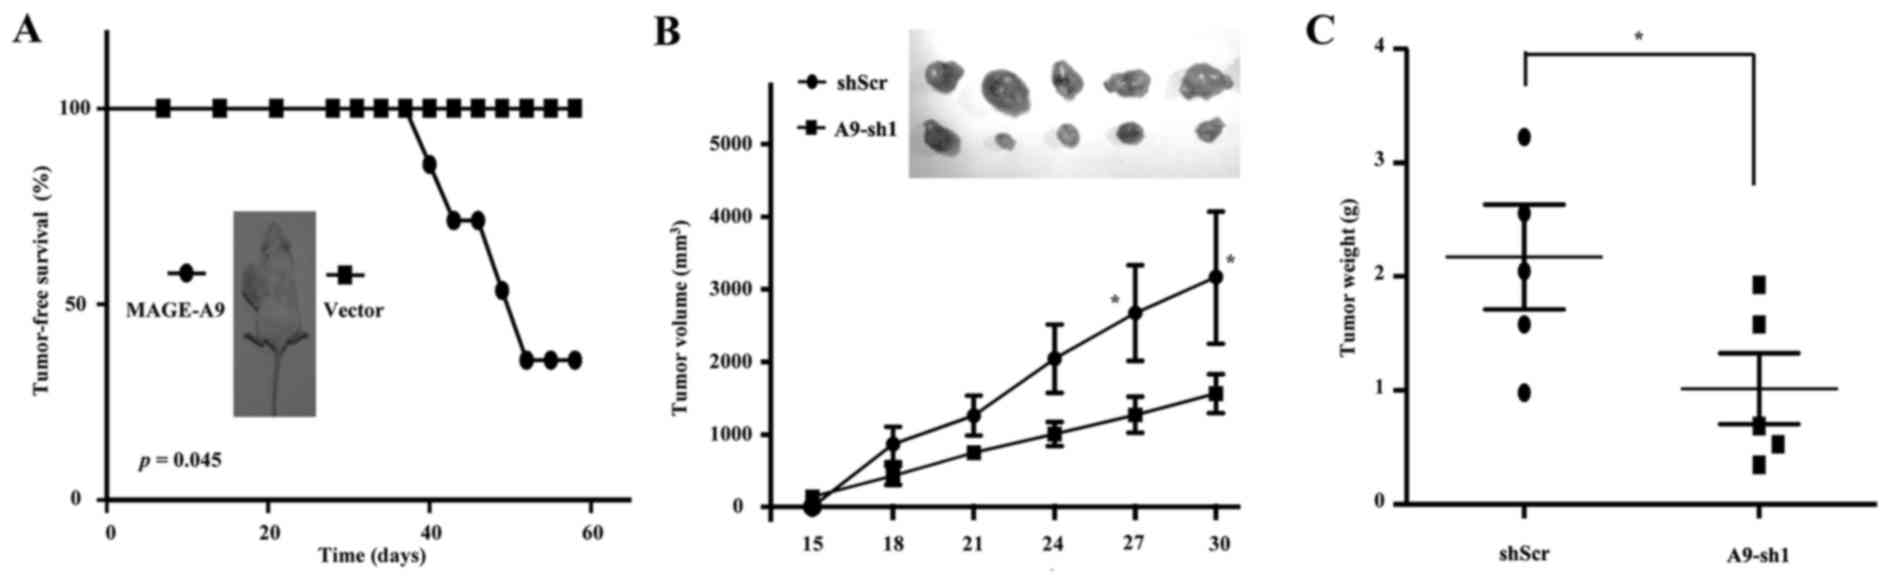
Effects of MAGE-A9 on tumorigenicity of
CSC-like HCC cells
To further evaluate the role of MAGE-A9 in LCSCs, we
dissociated these Hep3B-formed spheroid cells with trypsin
digestion into single cell suspension. Following cell counting,
1×10⁴ cells with lentivirus infection of MAGE-A9 were
subcutaneously injected into the flank of NOD/SCID mice, and an
equal volume of cells with Lenti-GFP vector as controls, were
injected into the opposite flank of the same mice. Intriguingly,
Hep3B spheroid cells with MAGE-A9 overexpression significantly
resulted in the occurrence of visible tumors from spheroid Hep3B
cells over 2 months. Kaplan-Meier tumor-free survival analysis
showed that MAGE-A9 overexpression significantly promoted
tumorigenesis (P<0.05; Fig.
6A). In addition, 2×10⁵ Hep3B-formed spheroid cells
were infected with lentivirus of A9-sh1 and then subcutaneously
inoculated into the flanks of NOD/SCID mice. Expectedly, MAGE-A9
knockdown significantly suppressed the tumorigenesis of these
spheroid cells, with the size and weight of the xenograft tumors
reduced (Fig. 6B and C). In
conclusion, the data showed that MAGE-A9 could be a key driver of
HCC initiation and serve as a potential therapeutic target,
probably through targeting LCSCs.
Discussion
In the present study, we showed that MAGE-A9 had
enriched expression in a subtype of HCC which had features of
hepatic stem/progenitor cells. Although MAGE-A9 has been reported
to have high expression and significant associations with the
development and prognosis of human cancers, including lung, liver,
ovarian, colon, breast, renal and liver cancers (18,19,21–24,26,32–34),
few studies have involved its role in cancer stem cells. In line
with a previous report (24), our
analysis of MAGE-A9 expression in a cohort of HCC patients revealed
patients with MAGE-A9-high expression had a worse overall survival
compared with patients with MAGE-A9-low or none-expressing tumors,
supporting its predictive association with poor clinical outcomes.
Hepatocellular carcinomas that harbor phenotypic features of stem
cells and progenitor cells constitute a subclass of therapeutically
challenging cancers that are associated with a particularly poor
prognosis (35). The evidence of
MAGE-A9 expression and prognostic predictor strongly suggest that
MAGE-A9 have important roles in liver cancer stem cells. Further
functional experiments support that MAGE-A9 plays a role in
regulating stemness characteristics in EpCAM+ HCC cells.
Since EpCAM is a wnt-β-catenin signaling target gene 30), MAGE-A9
may function in the context of the activation of β-catenin
signaling.
The present study also showed that MAGE-A9 could
serve as a therapeutic target against liver stem cancer cells,
which highlights the need to develop a novel therapeutic approach
for HCC stem or stem-like subtype. Although immunotherapy of MAGE
CTAs has had little success and met challenges for many years, the
development and application of CRISPR-Cas9 gene editing technique
will revolutionarily pave the way to targeted-MAGE-A9 therapy
against HCC. Most recently, an increasing number of reports have
demonstrated that CRISPR/Cas9-mediated genome editing is a powerful
technology for gene therapy (36,37).
The application of CRISPR/Cas9-mediated MAGE-A9 deficiency in
vitro and in vivo will explore the feasibility and
practicability of MAGE-A9 targeted therapy. In addition,
understanding the transcriptional regulations controlling the
aberrant MAGE-A9 re-expression in HCC may provide insight into
potential drug targets for MAGE-A9-expressing tumors. Type I MAGEs
are not normally expressed in somatic cells due to methylation of
CpG islands in their promoter regions. Demethylating agents such as
5-aza-2-deoxycytidine (5DC) and HDAC inhibitor such as trichostatin
A can induce expression of MAGE-A1 in cancer cells (38,39).
A similar result that MAGE-A9 was re-opened in several HCC cells
treated with 5DC and trichostatin A was observed in this study
(data not shown). As for detailed mechanisms proposed for the
demethylation of type I MAGE promoters, some pathways may be the
key to understand how type I MAGEs are turned on in cancer cells.
For example, the deregulation of KIT tyrosine kinase activity and
the FGFR2-IIIb that was found to be a putative upstream regulator
of MAGE-A3/6 expression (40,41).
Fibronectin knockdown also led to increased MAGE-A3 expression
(42).
To date, molecular mechanism how MAGE-A9 modulate
malignant characteristics of LCSCs is unclear in the present study.
Increasing investigations on other MAGE genes may provide primary
references for the MAGE-A9-associated mechanistic study. For
instance, the MHDs of MAGE-A2, -A3, -A6 and -C2 can bind to the
coiled-coil domain of the TRIM28/KAP1 ubiquitin ligase (43,44).
Importantly, identification of MAGE-A9-mediated signaling
transduction and molecular interaction will possibly unveil deeper
understanding of the molecular pathogenesis of HCC. A typical
example is the finding that MAGE-A3-TRIM28 and MAGE-A6-TRIM28
ligase complexes can ubiquitinate the alpha catalytic subunit
(PRKAA1) of the tumor suppressor AMPK, leading to AMPK degradation
and reduction of overall AMPK protein levels in tumors (45–47).
Because AMPK agonists (e.g. metformin) and mTOR inhibitors (e.g.
everolimus) are already in use in the clinic (48), the utilization of MAGE-A3 and -A6
may act as a biomarkers for effective use of these drugs (45). Taken together, our data suggest
that MAGE-A9 exhibits enrichment expression in liver cancer
stem/progenitor cells and could be a potential therapeutic target
against liver cancer. Although these findings provided a basic
perspective of cancer testis antigens in liver cancer stem cells,
further investigations are still needed in the future.
Acknowledgments
The present study was supported by the National
Natural Science Foundation of China (no. 81660350), the Jiangxi
Provincial Department of Science and Technology (no. 20161BBH80001)
and the Health and Family Planning Commission of Jiangxi Province
(nos. 20164013, 20177026 and 20174004).
References
|
1
|
Nio K, Yamashita T and Kaneko S: The
evolving concept of liver cancer stem cells. Mol Cancer. 16:42017.
View Article : Google Scholar : PubMed/NCBI
|
|
2
|
Zhu CP, Wang AQ, Zhang HH, Wan XS, Yang
XB, Chen SG and Zhao HT: Research progress and prospects of markers
for liver cancer stem cells. World J Gastroenterol. 21:12190–12196.
2015. View Article : Google Scholar : PubMed/NCBI
|
|
3
|
Lee TK, Cheung VC and Ng IO: Liver
tumor-initiating cells as a therapeutic target for hepatocellular
carcinoma. Cancer Lett. 338:101–109. 2013. View Article : Google Scholar
|
|
4
|
Liu LL, Fu D, Ma Y and Shen XZ: The power
and the promise of liver cancer stem cell markers. Stem Cells Dev.
20:2023–2030. 2011. View Article : Google Scholar : PubMed/NCBI
|
|
5
|
Salnikov AV, Kusumawidjaja G, Rausch V,
Bruns H, Gross W, Khamidjanov A, Ryschich E, Gebhard MM,
Moldenhauer G, Büchler MW, et al: Cancer stem cell marker
expression in hepatocellular carcinoma and liver metastases is not
sufficient as single prognostic parameter. Cancer Lett.
275:185–193. 2009. View Article : Google Scholar
|
|
6
|
Dollé L, Theise ND, Schmelzer E, Boulter
L, Gires O and van Grunsven LA: EpCAM and the biology of hepatic
stem/progenitor cells. Am J Physiol Gastrointest Liver Physiol.
308:G233–G250. 2015. View Article : Google Scholar :
|
|
7
|
Yamashita T, Ji J, Budhu A, Forgues M,
Yang W, Wang HY, Jia H, Ye Q, Qin LX, Wauthier E, et al:
EpCAM-positive hepatocellular carcinoma cells are tumor-initiating
cells with stem/progenitor cell features. Gastroenterology.
136:1012–1024. 2009. View Article : Google Scholar : PubMed/NCBI
|
|
8
|
Simpson AJ, Caballero OL, Jungbluth A,
Chen YT and Old LJ: Cancer/testis antigens, gametogenesis and
cancer. Nat Rev Cancer. 5:615–625. 2005. View Article : Google Scholar : PubMed/NCBI
|
|
9
|
Cronwright G, Le Blanc K, Götherström C,
Darcy P, Ehnman M and Brodin B: Cancer/testis antigen expression in
human mesenchymal stem cells: Down-regulation of SSX impairs cell
migration and matrix metalloproteinase 2 expression. Cancer Res.
65:2207–2215. 2005. View Article : Google Scholar : PubMed/NCBI
|
|
10
|
Saldanha-Araujo F, Haddad R, Zanette DL,
De Araujo AG, Orellana MD, Covas DT, Zago MA and Panepucci RA:
Cancer/Testis antigen expression on mesenchymal stem cells isolated
from different tissues. Anticancer Res. 30:5023–5027.
2010.PubMed/NCBI
|
|
11
|
Wen J, Li H, Tao W, Savoldo B, Foglesong
JA, King LC, Zu Y and Chang CC: High throughput quantitative
reverse transcription PCR assays revealing over-expression of
cancer testis antigen genes in multiple myeloma stem cell-like side
population cells. Br J Haematol. 166:711–719. 2014. View Article : Google Scholar : PubMed/NCBI
|
|
12
|
Yin B, Zeng Y, Liu G, Wang X, Wang P and
Song Y: MAGE-A3 is highly expressed in a cancer stem cell-like side
population of bladder cancer cells. Int J Clin Exp Pathol.
7:2934–2941. 2014.PubMed/NCBI
|
|
13
|
Yamada R, Takahashi A, Torigoe T, Morita
R, Tamura Y, Tsukahara T, Kanaseki T, Kubo T, Watarai K, Kondo T,
et al: Preferential expression of cancer/testis genes in cancer
stem-like cells: Proposal of a novel sub-category,
cancer/testis/stem gene. Tissue Antigens. 81:428–434. 2013.
View Article : Google Scholar : PubMed/NCBI
|
|
14
|
Soulez M, Saurin AJ, Freemont PS and
Knight JC: SSX and the synovial-sarcoma-specific chimaeric protein
SYT-SSX co-localize with the human Polycomb group complex.
Oncogene. 18:2739–2746. 1999. View Article : Google Scholar : PubMed/NCBI
|
|
15
|
Weon JL and Potts PR: The MAGE protein
family and cancer. Curr Opin Cell Biol. 37:1–8. 2015. View Article : Google Scholar : PubMed/NCBI
|
|
16
|
Jia HL, Ye QH, Qin LX, Budhu A, Forgues M,
Chen Y, Liu YK, Sun HC, Wang L, Lu HZ, et al: Gene expression
profiling reveals potential biomarkers of human hepatocellular
carcinoma. Clin Cancer Res: an official journal of the American
Association for Cancer Research. 13:pp. 1133–1139. 2007, https://doi.org/10.1158/1078-0432.CCR-06-1025.
View Article : Google Scholar
|
|
17
|
Picard V, Bergeron A, Larue H and Fradet
Y: MAGE-A9 mRNA and protein expression in bladder cancer. Int J
Cancer. 120:2170–2177. 2007. View Article : Google Scholar : PubMed/NCBI
|
|
18
|
Bergeron A, Picard V, LaRue H, Harel F,
Hovington H, Lacombe L and Fradet Y: High frequency of MAGE-A4 and
MAGE-A9 expression in high-risk bladder cancer. Int J Cancer.
125:1365–1371. 2009. View Article : Google Scholar : PubMed/NCBI
|
|
19
|
Xu X, Tang X, Lu M, Tang Q, Zhang H, Zhu
H, Xu N, Zhang D, Xiong L, Mao Y, et al: Overexpression of MAGE-A9
predicts unfavorable outcome in breast cancer. Exp Mol Pathol.
97:579–584. 2014. View Article : Google Scholar : PubMed/NCBI
|
|
20
|
Hou SY, Sang MX, Geng CZ, Liu WH, Lü WH,
Xu YY and Shan BE: Expressions of MAGE-A9 and MAGE-A11 in breast
cancer and their expression mechanism. Arch Med Res. 45:44–51.
2014. View Article : Google Scholar
|
|
21
|
Zhang S, Zhai X, Wang G, Feng J, Zhu H, Xu
L, Mao G and Huang J: High expression of MAGE-A9 in tumor and
stromal cells of non-small cell lung cancer was correlated with
patient poor survival. Int J Clin Exp Pathol. 8:541–550.
2015.PubMed/NCBI
|
|
22
|
Han L, Jiang B, Wu H, Zhang S and Lu X:
Expression and prognostic value of MAGE-A9 in laryngeal squamous
cell carcinoma. Int J Clin Exp Pathol. 7:6734–6742. 2014.PubMed/NCBI
|
|
23
|
Hatiboglu G, Pritsch M, Macher-Goeppinger
S, Zöller M, Huber J, Haferkamp A, Pahernik S, Wagener N and
Hohenfellner M: Prognostic value of melanoma-associated antigen A9
in renal cell carcinoma. Scand J Urol. 47:311–322. 2013. View Article : Google Scholar
|
|
24
|
Gu X, Fu M, Ge Z, Zhan F, Ding Y, Ni H,
Zhang W, Zhu Y, Tang X, Xiong L, et al: High expression of MAGE-A9
correlates with unfavorable survival in hepatocellular carcinoma.
Sci Rep. 4:66252014. View Article : Google Scholar : PubMed/NCBI
|
|
25
|
van Duin M, Broyl A, de Knegt Y,
Goldschmidt H, Richardson PG, Hop WC, van der Holt B,
Joseph-Pietras D, Mulligan G, Neuwirth R, et al: Cancer testis
antigens in newly diagnosed and relapse multiple myeloma:
Prognostic markers and potential targets for immunotherapy.
Haematologica. 96:1662–1669. 2011. View Article : Google Scholar : PubMed/NCBI
|
|
26
|
Xu Y, Wang C, Zhang Y, Jia L and Huang J:
Overexpression of MAGE-A9 is predictive of poor prognosis in
epithelial ovarian cancer. Sci Rep. 5:121042015. View Article : Google Scholar : PubMed/NCBI
|
|
27
|
Yamashita T, Forgues M, Wang W, Kim JW, Ye
Q, Jia H, Budhu A, Zanetti KA, Chen Y, Qin LX, et al: EpCAM and
alpha-fetoprotein expression defines novel prognostic subtypes of
hepatocellular carcinoma. Cancer Res. 68:1451–1461. 2008.
View Article : Google Scholar : PubMed/NCBI
|
|
28
|
Yue W, Jiao F, Liu B, You J and Zhou Q:
Enrichment and function research of large cell lung cancer stem
cell-like cells. Zhongguo Fei Ai Za Zhi. 14:484–491. 2011.In
Chinese. PubMed/NCBI
|
|
29
|
Yoshida S, Shimmura S, Shimazaki J,
Shinozaki N and Tsubota K: Serum-free spheroid culture of mouse
corneal keratocytes. Invest Ophthalmol Vis Sci. 46:1653–1658. 2005.
View Article : Google Scholar : PubMed/NCBI
|
|
30
|
Yamashita T, Budhu A, Forgues M and Wang
XW: Activation of hepatic stem cell marker EpCAM by
Wnt-beta-catenin signaling in hepatocellular carcinoma. Cancer Res.
67:10831–10839. 2007. View Article : Google Scholar : PubMed/NCBI
|
|
31
|
Kimura O, Takahashi T, Ishii N, Inoue Y,
Ueno Y, Kogure T, Fukushima K, Shiina M, Yamagiwa Y, Kondo Y, et
al: Characterization of the epithelial cell adhesion molecule
(EpCAM)+ cell population in hepatocellular carcinoma
cell lines. Cancer Sci. 101:2145–2155. 2010. View Article : Google Scholar : PubMed/NCBI
|
|
32
|
Zhan W, Zhang Z, Zhang Y, Ma J, Wu T, Gu
Y, Li Y and Yang J: Prognostic value of MAGE-A9 expression in
patients with colorectal cancer. Clin Res Hepatol Gastroenterol.
40:239–245. 2016. View Article : Google Scholar
|
|
33
|
Zhai X, Xu L, Zhang S, Zhu H, Mao G and
Huang J: High expression levels of MAGE-A9 are correlated with
unfavorable survival in lung adenocarcinoma. Oncotarget.
7:4871–4881. 2016. View Article : Google Scholar :
|
|
34
|
Liu S, Sang M, Xu Y, Gu L, Liu F and Shan
B: Expression of MAGE-A1, -A9, -A11 in laryngeal squamous cell
carcinoma and their prognostic significance: A retrospective
clinical study. Acta Otolaryngol. 136:506–513. 2016. View Article : Google Scholar : PubMed/NCBI
|
|
35
|
Thorgeirsson SS: Stemness in liver cancer.
Dig Dis. 35:387–389. 2017. View Article : Google Scholar : PubMed/NCBI
|
|
36
|
Zhang X, Wang L, Liu M and Li D:
CRISPR/Cas9 system: A powerful technology for in vivo and ex vivo
gene therapy. Sci China Life Sci. 60:468–475. 2017. View Article : Google Scholar : PubMed/NCBI
|
|
37
|
Sachdeva M, Sachdeva N, Pal M, Gupta N,
Khan IA, Majumdar M and Tiwari A: CRISPR/Cas9: Molecular tool for
gene therapy to target genome and epigenome in the treatment of
lung cancer. Cancer Gene Ther. 22:509–517. 2015. View Article : Google Scholar : PubMed/NCBI
|
|
38
|
Schwarzenbach H, Eichelser C, Steinbach B,
Tadewaldt J, Pantel K, Lobanenkov V and Loukinov D: Differential
regulation of MAGE-A1 promoter activity by BORIS and Sp1, both
interacting with the TATA binding protein. BMC Cancer. 14:7962014.
View Article : Google Scholar : PubMed/NCBI
|
|
39
|
Wischnewski F, Pantel K and Schwarzenbach
H: Promoter demethylation and histone acetylation mediate gene
expression of MAGE-A1, -A2, -A3, and -A12 in human cancer cells.
Mol Cancer Res. 4:339–349. 2006. View Article : Google Scholar : PubMed/NCBI
|
|
40
|
Yang B, Wu J, Maddodi N, Ma Y, Setaluri V
and Longley BJ: Epigenetic control of MAGE gene expression by the
KIT tyrosine kinase. J Invest Dermatol. 127:2123–2128. 2007.
View Article : Google Scholar : PubMed/NCBI
|
|
41
|
Kondo T, Zhu X, Asa SL and Ezzat S: The
cancer/testis antigen melanoma-associated antigen-A3/A6 is a novel
target of fibroblast growth factor receptor 2-IIIb through histone
H3 modifications in thyroid cancer. Clin Cancer Res. 13:4713–4720.
2007. View Article : Google Scholar : PubMed/NCBI
|
|
42
|
Liu W, Cheng S, Asa SL and Ezzat S: The
melanoma-associated antigen A3 mediates fibronectin-controlled
cancer progression and metastasis. Cancer Res. 68:8104–8112. 2008.
View Article : Google Scholar : PubMed/NCBI
|
|
43
|
Doyle JM, Gao J, Wang J, Yang M and Potts
PR: MAGE-RING protein complexes comprise a family of E3 ubiquitin
ligases. Mol Cell. 39:963–974. 2010. View Article : Google Scholar : PubMed/NCBI
|
|
44
|
Yang B, O'Herrin SM, Wu J, Reagan-Shaw S,
Ma Y, Bhat KM, Gravekamp C, Setaluri V, Peters N, Hoffmann FM, et
al: MAGE-A, mMage-B, and MAGE-C proteins form complexes with KAP1
and suppress p53-dependent apoptosis in MAGE-positive cell lines.
Cancer Res. 67:9954–9962. 2007. View Article : Google Scholar : PubMed/NCBI
|
|
45
|
Pineda CT, Ramanathan S, Fon Tacer K, Weon
JL, Potts MB, Ou YH, White MA and Potts PR: Degradation of AMPK by
a cancer-specific ubiquitin ligase. Cell. 160:715–728. 2015.
View Article : Google Scholar : PubMed/NCBI
|
|
46
|
Hardie DG: Molecular pathways: Is AMPK a
friend or a foe in cancer? Clin Cancer Res. 21:3836–3840. 2015.
View Article : Google Scholar : PubMed/NCBI
|
|
47
|
Choudhury Y, Salt IP and Leung HY:
AMPK-friend or foe for targeted therapy? Cell Cycle. 14:1761–1762.
2015. View Article : Google Scholar : PubMed/NCBI
|
|
48
|
Kasznicki J, Sliwinska A and Drzewoski J:
Metformin in cancer prevention and therapy. Ann Transl Med.
2:572014.PubMed/NCBI
|