Introduction
As the second leading cause of cancer-related deaths
in American men (1), prostate
cancer (PCa) typically undergoes slow growth and often leaves the
patient susceptible to other diseases during the development. In a
significant subset of men, the cancer develops rapidly, leading to
death (2). Depending on the
characteristics of PCas, different treatment strategies are
available to the patients. The indolent PCas in patients usually do
not require major treatment, while rapid developing PCas require
aggressive treatments to prevent further malignancy. Therefore, it
is critical to detect the aggressive PCas at their early stages.
Recent studies suggest that most of the PCas are initiated by a
small population of tumor-initiating cells, which are responsible
for growth of the tumor, metastasis and even relapse (3). Differentiation of these cells leads
to a high diversity of tumor cell populations (4,5).
Characterization of tumor-initiating cells provides important
information for the prediction of future clinical behavior of the
tumor.
The diagnosis of early PCa in patients has been
commonly studied for many years. However, many strategies have been
developed in the past few decades. Some PCa specific DNA markers
have been identified and applied to the detection of PCas in
elderly men (6,7). Although these markers can rapidly
provide a reference for the risk of PCas in humans, they cannot
predict whether the tumor will be a slow-growing or an aggressive
one that needs immediate treatment. A sufficient animal model that
allows the human prostate tumor cells to grow and develop normally,
and demonstrates the fate of tumor cells in a short time period is
highly desired.
The classic approach to assess tumorigenicity and
metastatic potential of human prostate cells is the growth of
orthotopic xenografts in immune-deficient mice (8–10).
The model has been extensively used in functional analyses of PCa
related genes as well as drug screening for PCa treatments.
However, the development of tumor xenografts from prostate cancer
cells implanted in mouse prostate tissue usually takes two months
or longer. This is not the optimal period for the diagnosis of
aggressiveness of a PCa in clinical studies. Additionally, this
model is costly and labor intensive, which is a disadvantage in
high throughput anticancer drug screenings.
Recent studies have shown that zebrafish (Danio
rerio) can serve as a useful model organism for cancer research
(11–14). Zebrafish offer several unique
advantages over mammalian models, such as small animal size, no
extensive surgical procedures, strong reproducibility and rapid
growth of xenografts (15).
Moreover, the translucent body of the fish embryos enables us to
visualize all processes associated with tumor formation, tumor
progression, metastasis and death (16). Furthermore, the zebrafish is more
xenograft-tolerant and has less immune response to tumor cell
xenograft than mice (17). Another
major advantage is that an extremely small number cells are
required for implantation (as little as 1×10³ cells).
Thus, even primary prostate cells derived from tumor biopsies can
be sufficient for this model.
In the present study, we established the human
prostate tumor cell zebra fish xenograft model using a well-defined
human prostate cancer cell line, PC3-CTR. Previously created in Dr
Shah's laboratory, the cell line was transfected with a pcDNA3.1
vector carrying the full-length CTR cDNA (18). Unlike the wild-type PC3 cell line,
the PC3-CTR can stably express calcitonin receptor, which enhances
the aggressiveness of the cells (18). The goal of this study is to examine
the process of tumor growth in zebrafish embryos, and monitor the
expression of some prostate cancer-specific markers during this
process. The conditions of zebrafish embryos implanted with PC3-CTR
cells were optimized and the migration of implanted PC3-CTR cells
in zebrafish embryos were monitored using live cell fluorescent
dyes. The proliferation and development of the PC3-CTR cells in
zebrafish embryos were also evaluated using PCa cell markers.
Materials and methods
Generation of zebrafish embryos
All experiments on zebrafish were performed in
compliance with the Louisiana State University, Agricultural
Center's (LSU AgCenter) institutional guidelines and under the
National Research Council's criteria for humane care as outlined in
the 'Guide for the Care and Use of Laboratory Animals'. The
protocol used in the present study was approved by the LSU AgCenter
Institutional Animal Care and Use Committee.
Sexually matured zebrafish individuals were
maintained in the Aquaculture Research Station at the LSU AgCenter.
Adult zebrafish were spawned in water at 28°C on a 14-h light/10-h
dark cycle. The procedures for breeding, embryo collection, staging
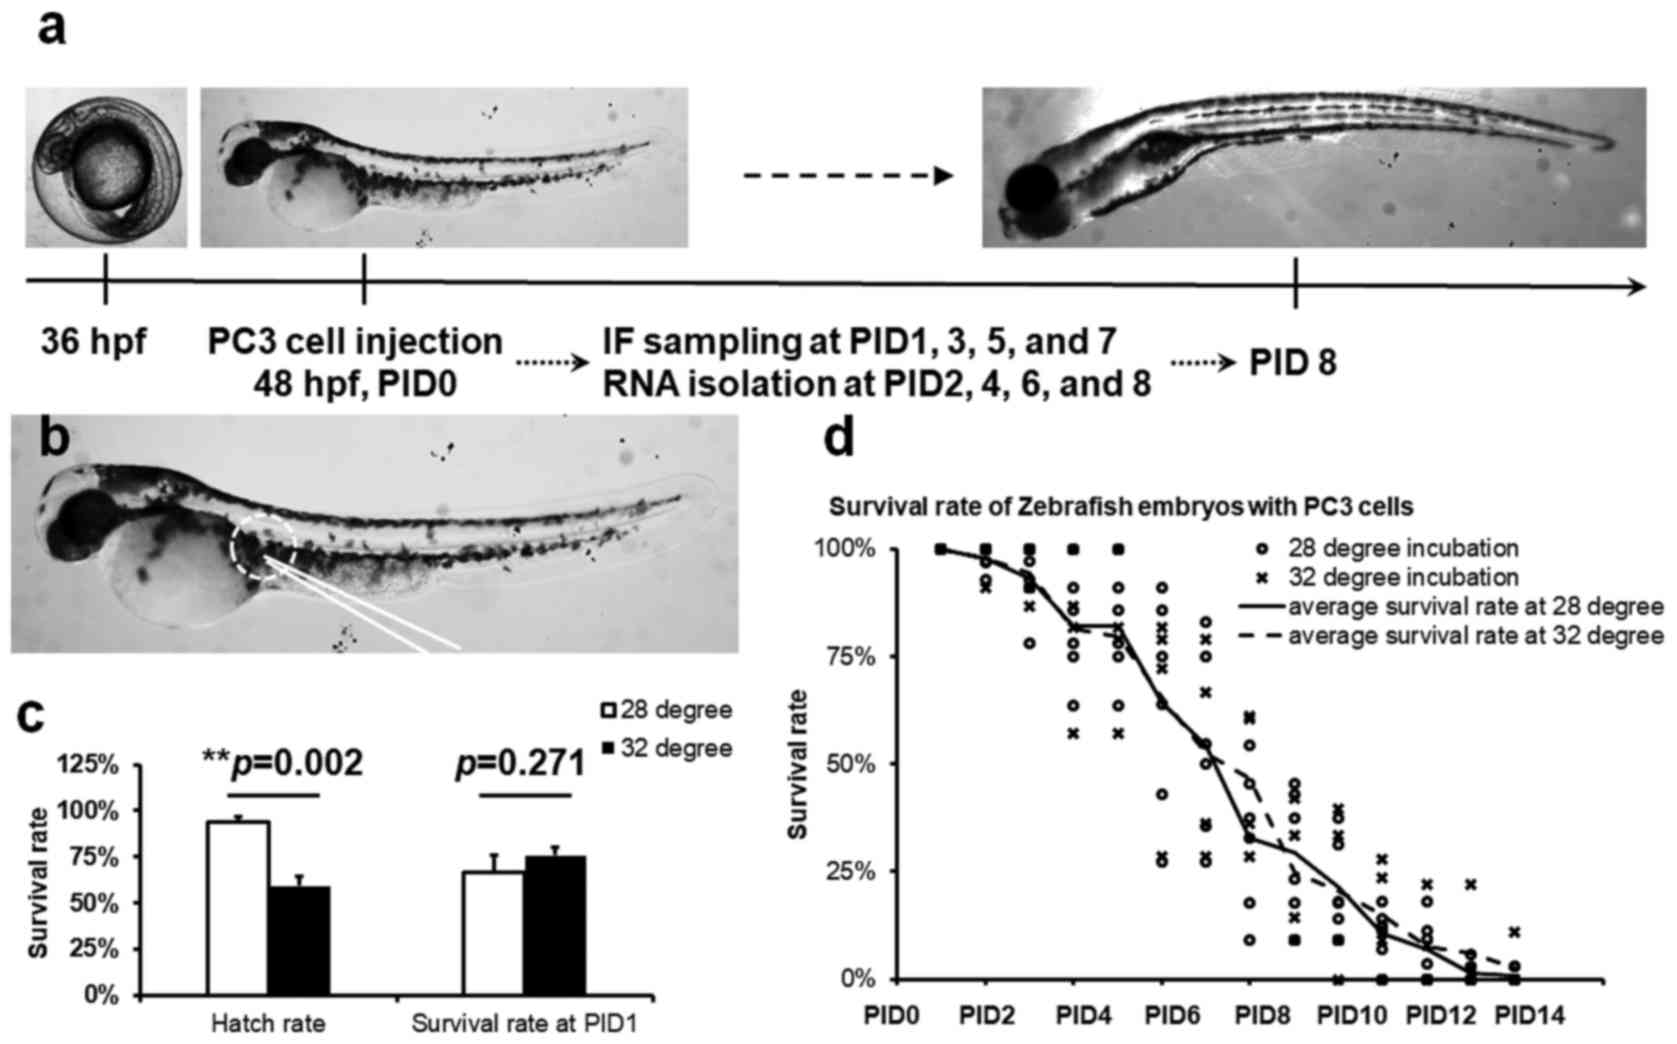
(Fig. 1a) and rearing all followed
previously published standard protocols (19).
Microinjection of prostate cancer cell
line to zebrafish embryos
A prostate cancer cell line, PC3-CTR was used for
microinjection. The cells were cultured overnight at 37°C with 5%
CO2 supply in the RPMI-1640 medium (Corning Life
Sciences, Corning, NY, USA) supplemented with 10 mM HEPES, 25 mM
NaHCO3, 10% fetal bovine serum (FBS; VWR/Life Science,
Radnor, PA, USA), 200 mg/l geneticin (VWR/Life Science), 100
µg/ml penicillin G, and 100 µg/ml streptomycin (100×
Amresco penicillin/streptomycin stocking solution from VWR/Life
Science). Thereafter, the cells were incubated with a live-cell
imaging dye Qtracker® 525 (Thermo Fisher Scientific,
Waltham, MA, USA) for 1 h at 37°C to be fluorescently labeled. The
labeled PC3-CTR cells were digested by 0.05% Trypsin (Corning Life
Sciences) and re-suspended in phosphate-buffered saline (PBS;
Corning Life Sciences). The cell density in the suspension was
calculated based on cell counting with a hemocytometer and was
adjusted to 500 cells/ml in PBS.
The zebrafish embryos at 48 h post fertilization
(hpf) were manually dechorionated, and anesthetized with 10
µg/ml tricaine methanesulfonate (MS-222; Sigma-Aldrich, St.
Louis, MO, USA) and transferred to 50 µl drops of filtered
aquarium water with 10 µg/ml MS-222 under oil in a 5-cm
diameter petri-dish, also containing a 20 µl drop of PC3-CTR
cells diluted in PBS suspension. Microinjection was performed with
an Eppendorf CellTram microinjection system, on a Nikon Eclipse
TE200 inverted microscope. Cells were back-filled into the
microinjector (22 µm ID) and five to six PC3-CTR cells were
injected subcutaneously through the sinus venosus above the yolk
(Fig. 1B). The embryos were
immediately transferred to fresh filtered aquarium water and
incubated at 37°C for 2 h. Following, the embryos were maintained
at 32 or 28°C for up to 12 days post transplantation (14 days post
fertilization).
Larval zebrafish maintenance and
sampling
Starting from post-hatching day 4, freshly hatched
Artemia (Pentair plc, Sanford, NC, USA) were produced daily
and used twice a day as diet for larval zebrafish. Growth of the
larval zebrafish was monitored daily using a stereomicroscope. The
development of PC3-CTR cells in zebrafish was visualized using a
Nikon Eclipse Ti fluorescent microscope (Nikon USA,
Melville, NY, USA) following the anesthesia of the larvae with 50
µg/ml MS-222 (Thermo Fisher Scientific). PC3-CTR cells in
zebrafish embryos were visualized under fluorescent microscope. The
PC3-CTR cells were monitored daily and mortalities of zebrafish
were recorded. Some surviving zebrafish larvae were harvested for
immunofluorescent (IF) staining or RNA isolation. Larvae for IF
were first anesthetized with MS-222 as described above and fixed
with 4% paraformaldehyde (PFA) overnight at 4°C. Then, they were
preserved in 10% methanol at 4°C. Some anesthetized larvae were
immediately transferred to Tri-Reagent® for RNA
isolation.
Immunofluorescent staining of human
specific antigen
The PFA fixed larval samples in methanol were
rehydrated with a serially diluted methanol in PBS with the
concentrations, 100, 75 and 50%. After washing with PBS, each
sample was blocked with 10% goat serum in PBS for 2 h. Thereafter,
the sample was incubated with mouse anti-human nuclei antibody (EMD
Millipore, Billerica, MA, USA) in PBS (1:1,000 dilution) at 4°C
overnight. A secondary antibody (goat x mouse) fluorescently
labeled with Alexa 594 (Thermo Fisher Scientific) was diluted with
PBS at 1:500 and incubated with the larval sample at room
temperature for 1 h in a dark environment. The sample was observed
under the Nikon Eclipse Ti fluorescent microscope (Nikon
USA).
Quantification and characterization of
PC3-CTR cells in larval zebrafish using quantitative PCR
To estimate the number of PC3-CTR cells in each
zebrafish larval individual, we developed a quantitative PCR (qPCR)
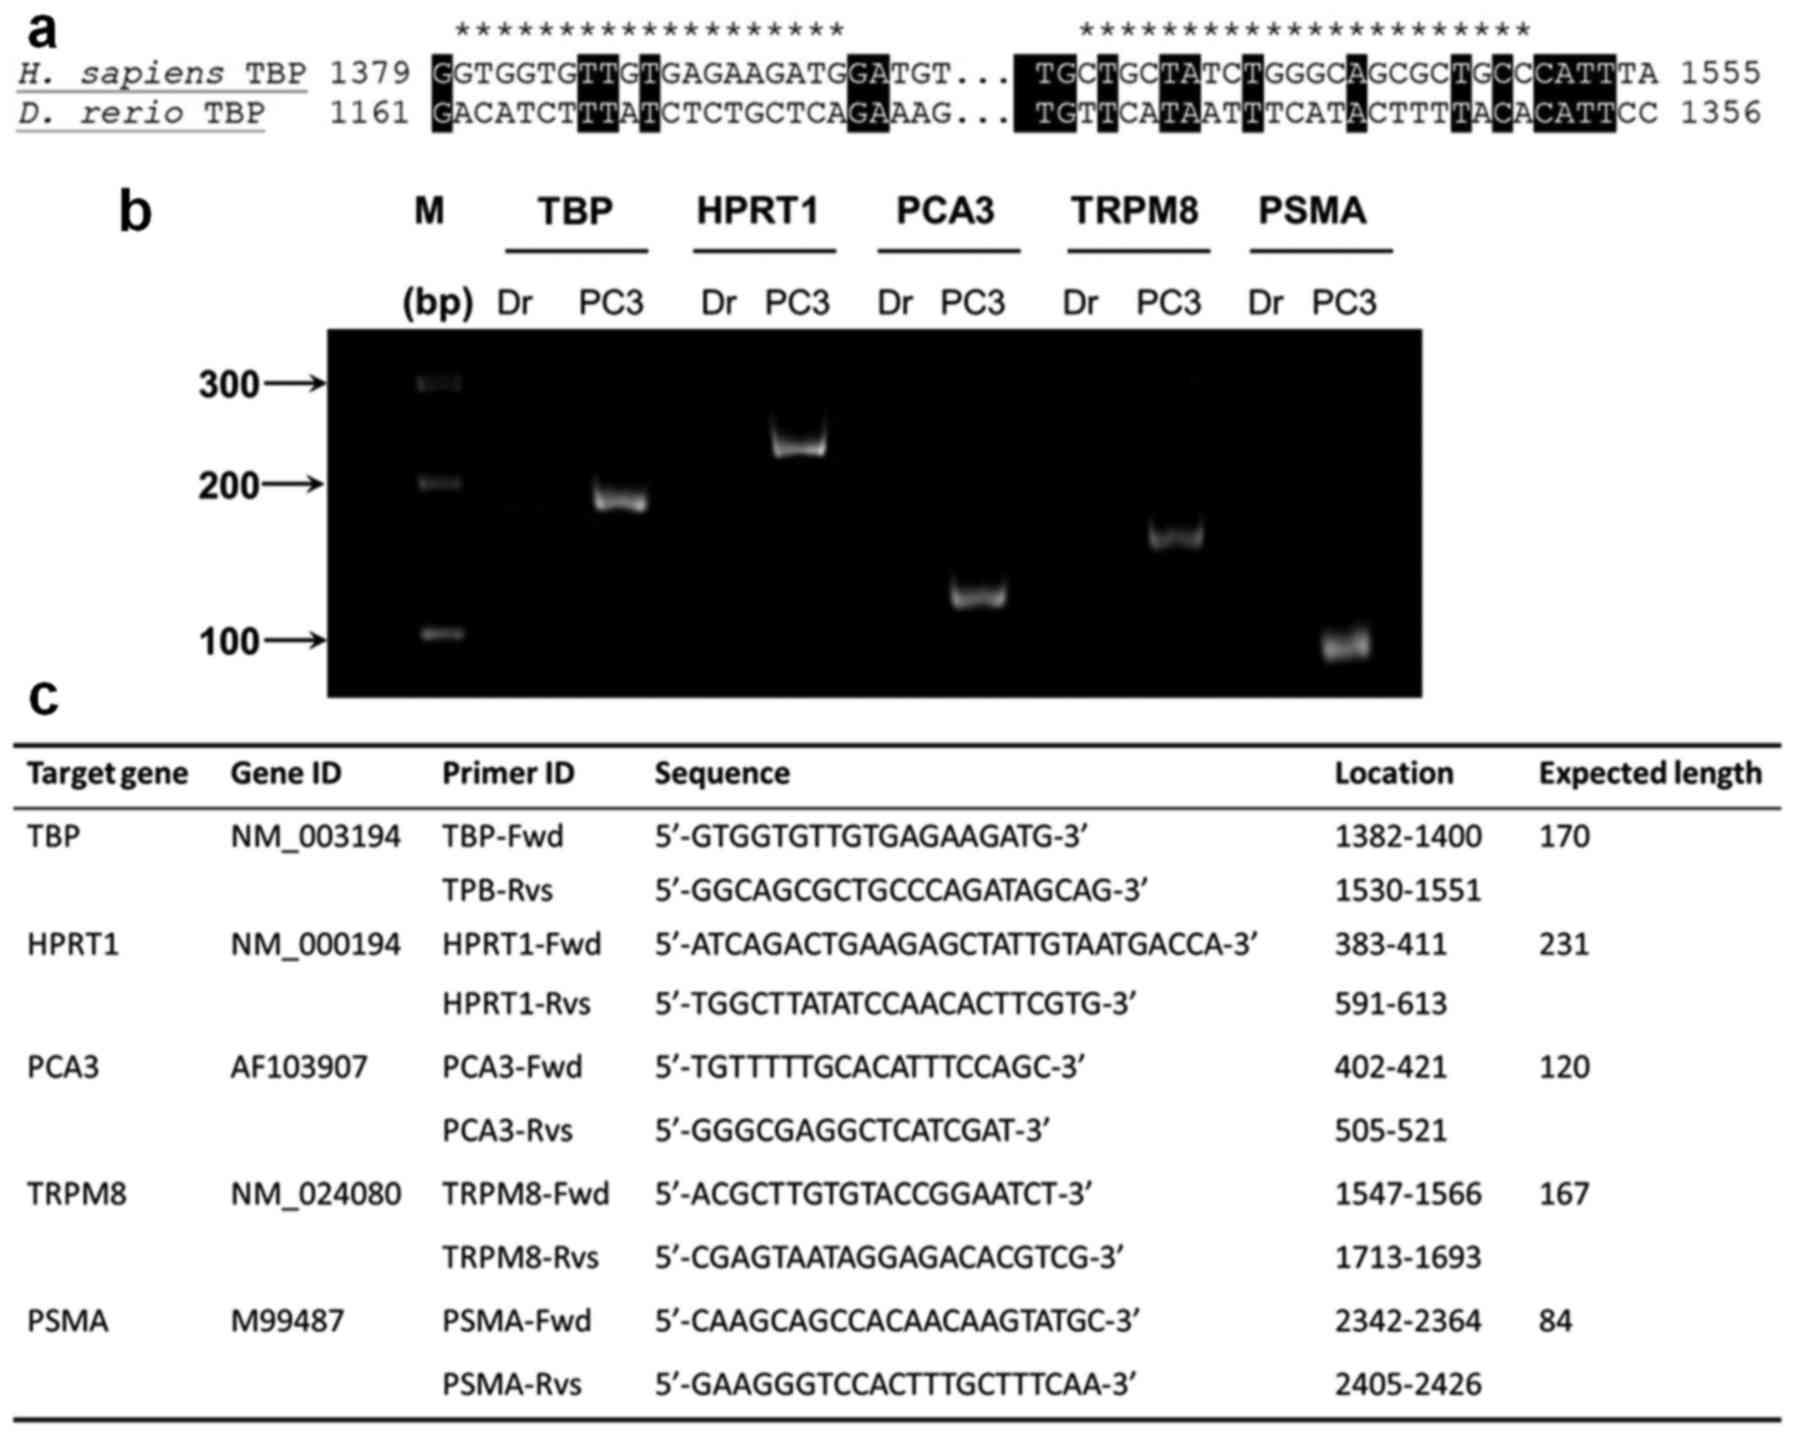
assay targeting housekeeping genes encoding TATA-binding protein
(TBP) and hypoxanthine phosphoribosyltransferase 1 (HPRT1)
(20–22) in PC3-CTR cells. The full sequences
of human tbp and hprt1 were downloaded from GenBank
database and used for homo-logues searching through zebrafish
nucleotide database using BLASTn (23). No homologues of human hprt1
was found in Danio rerio database, while a highly
conservative tbp gene was found in Danio rerio database.
Therefore, the qPCR primers specific for human hprt1 were designed
by the primer designing tool on IDT DNA (Coralville, IA, USA)
website, while the primers for human tbp were designed based
on a high variance region in the sequence compared to Danio
rerio tbp (Fig. 2a). The
specificity of the qPCR primers was tested by PCR with cDNAs from
PC3-CTR and zebrafish larvae and the PCR products were visualized
by electrophoresis with 7% acrylamide-bisacrylamide TBE gel
(Fig. 2b).
A PC3-CTR cell number against qPCR Ct value standard
curves were created based on the qPCR amplification profiles of
human tbp and hprt1. Briefly, the PC3-CTR cells were
harvested from a subconfluent cell culture plate and quantified
with a hemocytometer under a microscope following the standard
protocol. Each zebrafish larval individual at different development
stages (from day 1 to day 12 post hatching) without PC3-CTR
implantation was mixed with a certain number of PC3-CTR cells
diluted with PBS. The ratios of larva and PC3-CTR numbers are, 1:5,
1:50, 1:500, 1:5,000, 1:50,000 and 1:500,000. For example, for the
dataset generated from 500 PC3-CRT cells, we mixed 500 cells with
zebrafish larva at post hatching day 1, 4, 6, 7, 8, 10 and 12,
respectively. The total RNAs were isolated from each mixture and
used for qPCR analysis. This was expected to minimize the error
caused by the slightly different growth rate of zebrafish in our
system. The total RNA of each mixture and the cDNA were obtained
using TRIzol® reagent (Thermo Fisher Scientific) and
SuperScript IV Reverse Transcriptase (Thermo Fisher Scientific),
respectively, following the manufacturer's instructions. For each
sample, a total amount of 1 µg of RNA was used for cDNA
synthesis.
Twenty microliters of cDNA was synthesized for each
RNA sample and the cDNA was diluted 10-fold with DNase/RNase-free
molecular water. The qPCR was performed using GoTaq DNA polymerase
system (Promega, Madison, WI, USA) with SYBR-Green. Each 10
µl reaction contained 2 µl cDNA from each sample.
Primers used for qPCR are listed in Fig. 2c. The ABI 7900HT Fast Real-Time PCR
system with Fast 384-Well Block (Thermo Fisher Scientific) was used
for the qPCR with the program: 2 min at 50°C, 2 min at 94°C, and 40
cycles of 94, 55 and 72°C with 30 sec at each temperature. The raw
Ct values of tbp and hprt1 expressions (x-axis) were
used to construct standard curves against the log(10) of
PC3-CTR cell numbers mixed with each fish larva (y-axis). The
standard curve and the regression equation were used to estimate
the number of PC3-CTR cells in each of the experimental zebrafish
larval individual based on the Ct values of tbp and
hprt1.
Three PCa tumor cell development genetic markers;
prostate cancer associated 3 gene (pca3), transient receptor
potential ion channel melastatin 8 (trpm8) and
prostate-specific membrane antigen (psma). No zebrafish
homologous genes for these three marker genes were found based on
BLASTn analysis. These markers were only detected in human PC3-CTR
cells not zebrafish larvae (Fig.
2b). All primers used for qPCR in the present study are listed
in Fig. 2c.
Results
Temperature does not affect the survival
of xenografted zebrafish larvae
Two temperatures were used in this study for
zebrafish embryo hatching, and larval zebrafish nursery post
PC3-CTR cell implantation. The temperature (28°C) is close to
normal zebrafish hatching and nursery temperature while 32°C allows
better growth and development of PC3-CTR cells in the larvae based
on our observations. Incubated at 32°C, 59.2±9.0% zebrafish embryos
successfully hatched, which was significantly lower (P=0.002) than
the hatching rate of the embryos raised at 28°C (93.7±2.7%)
(Fig. 1c). However, no significant
difference in post PC3-CTR injection survival rates of zebrafish
larvae was observed between the two different rearing temperatures
(Fig. 1b and c). Large mortalities
were observed in the larvae at day 1 post PC3-CTR implantation
(PID1) incubated at 28°C (24.2±4.7%) or 32°C (33.3±5.4%), but no
significant difference was found between these mortality rates
(Fig. 1b). Therefore, we used 32°C
to raise the larval zebrafish in the rest of the study to better
grow the PC3-CTR cells in zebrafish larvae. Occasional deaths of
the larvae were observed prior to post injection day 6 (PID6). In
contrast, an increase of mortality was observed starting at PID6
and lasted until almost 100% mortality in the larvae at PID14. Very
few larvae with PC3-CTR survived after PID14 (Fig. 1c).
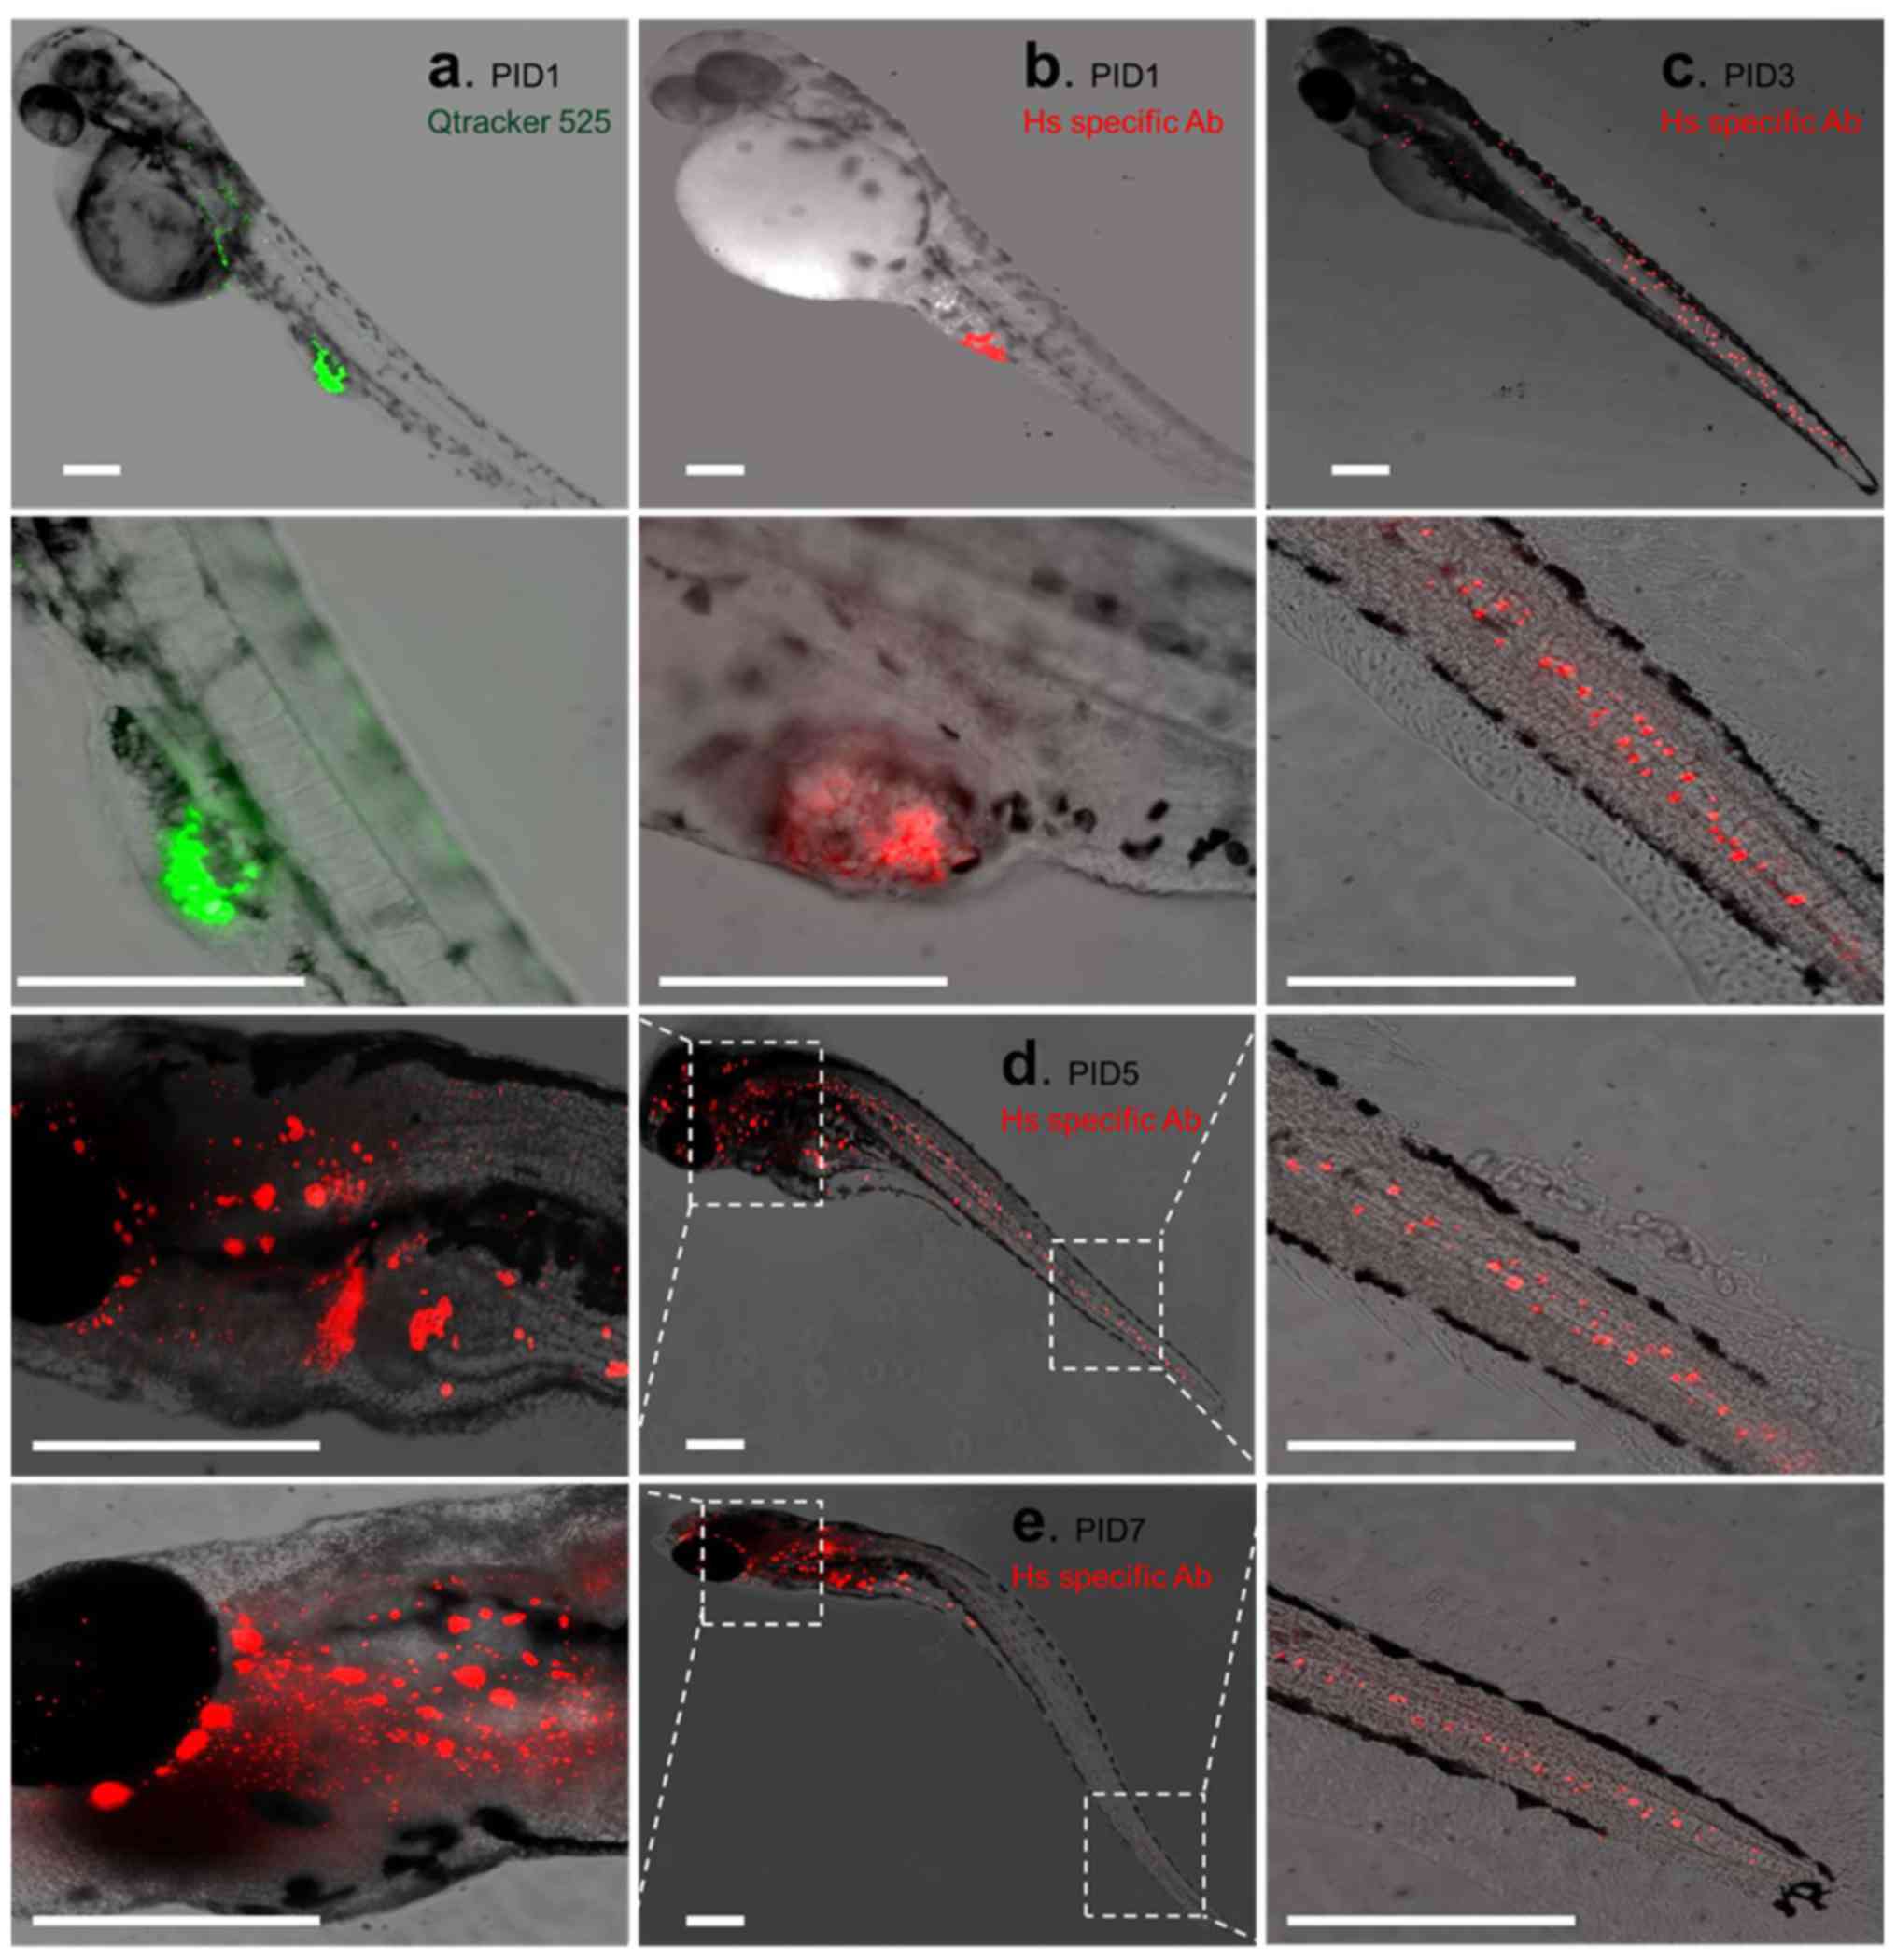
PC3-CTR cells migrated and proliferated
along with the development of zebrafish larvae
The PC3-CTR cells were labeled with
Qtracker® 525 prior to the implantation into the larval
zebrafish. Fluorescent microscopy was used to track the PC3-CTR
cells injected into the larvae. At PID1, a small number of cells
with Qtracker 525 signals (green) were located near the injection
site of the PC3-CTR cells (Fig.
3a). IF staining with human nuclei antibody (red) also
demonstrated the limited distribution of PC3-CTR cells in the
larvae (Fig. 3b). No obvious
migration of PC3-CTR cells in larval zebrafish was observed at
PID1. Signals of Qtracker 525 in live PC3-CTR cells were hard to
detect after PID3, therefore, IF staining of human nuclei was used
to detect the distributions of PC3-CTR cells in larval fish.
PC3-CTR cells were found widely distributed at the posterior
section of the fish (between original PC3-CTR injection site and
the tail of the larva; Fig. 3c).
PC3-CTR cells were also detected in the anterior section of the
fish (between head and original PC3-CTR injection site, Fig. 3c), but the number was limited. The
number of PC3-CTR cells in larval zebrafish was markedly elevated
from PID5 on. PC3-CTR cells were located from head to tail and
colonized a large area in the head of the larva (Fig. 3d). At PID7, more PC3-CTR cells were
observed in the head area while less PC3-CTR cells were seen at the
posterior section of the larva (Fig.
3e).
PC3-CTR cells in zebrafish larvae
demonstrated rapid proliferation
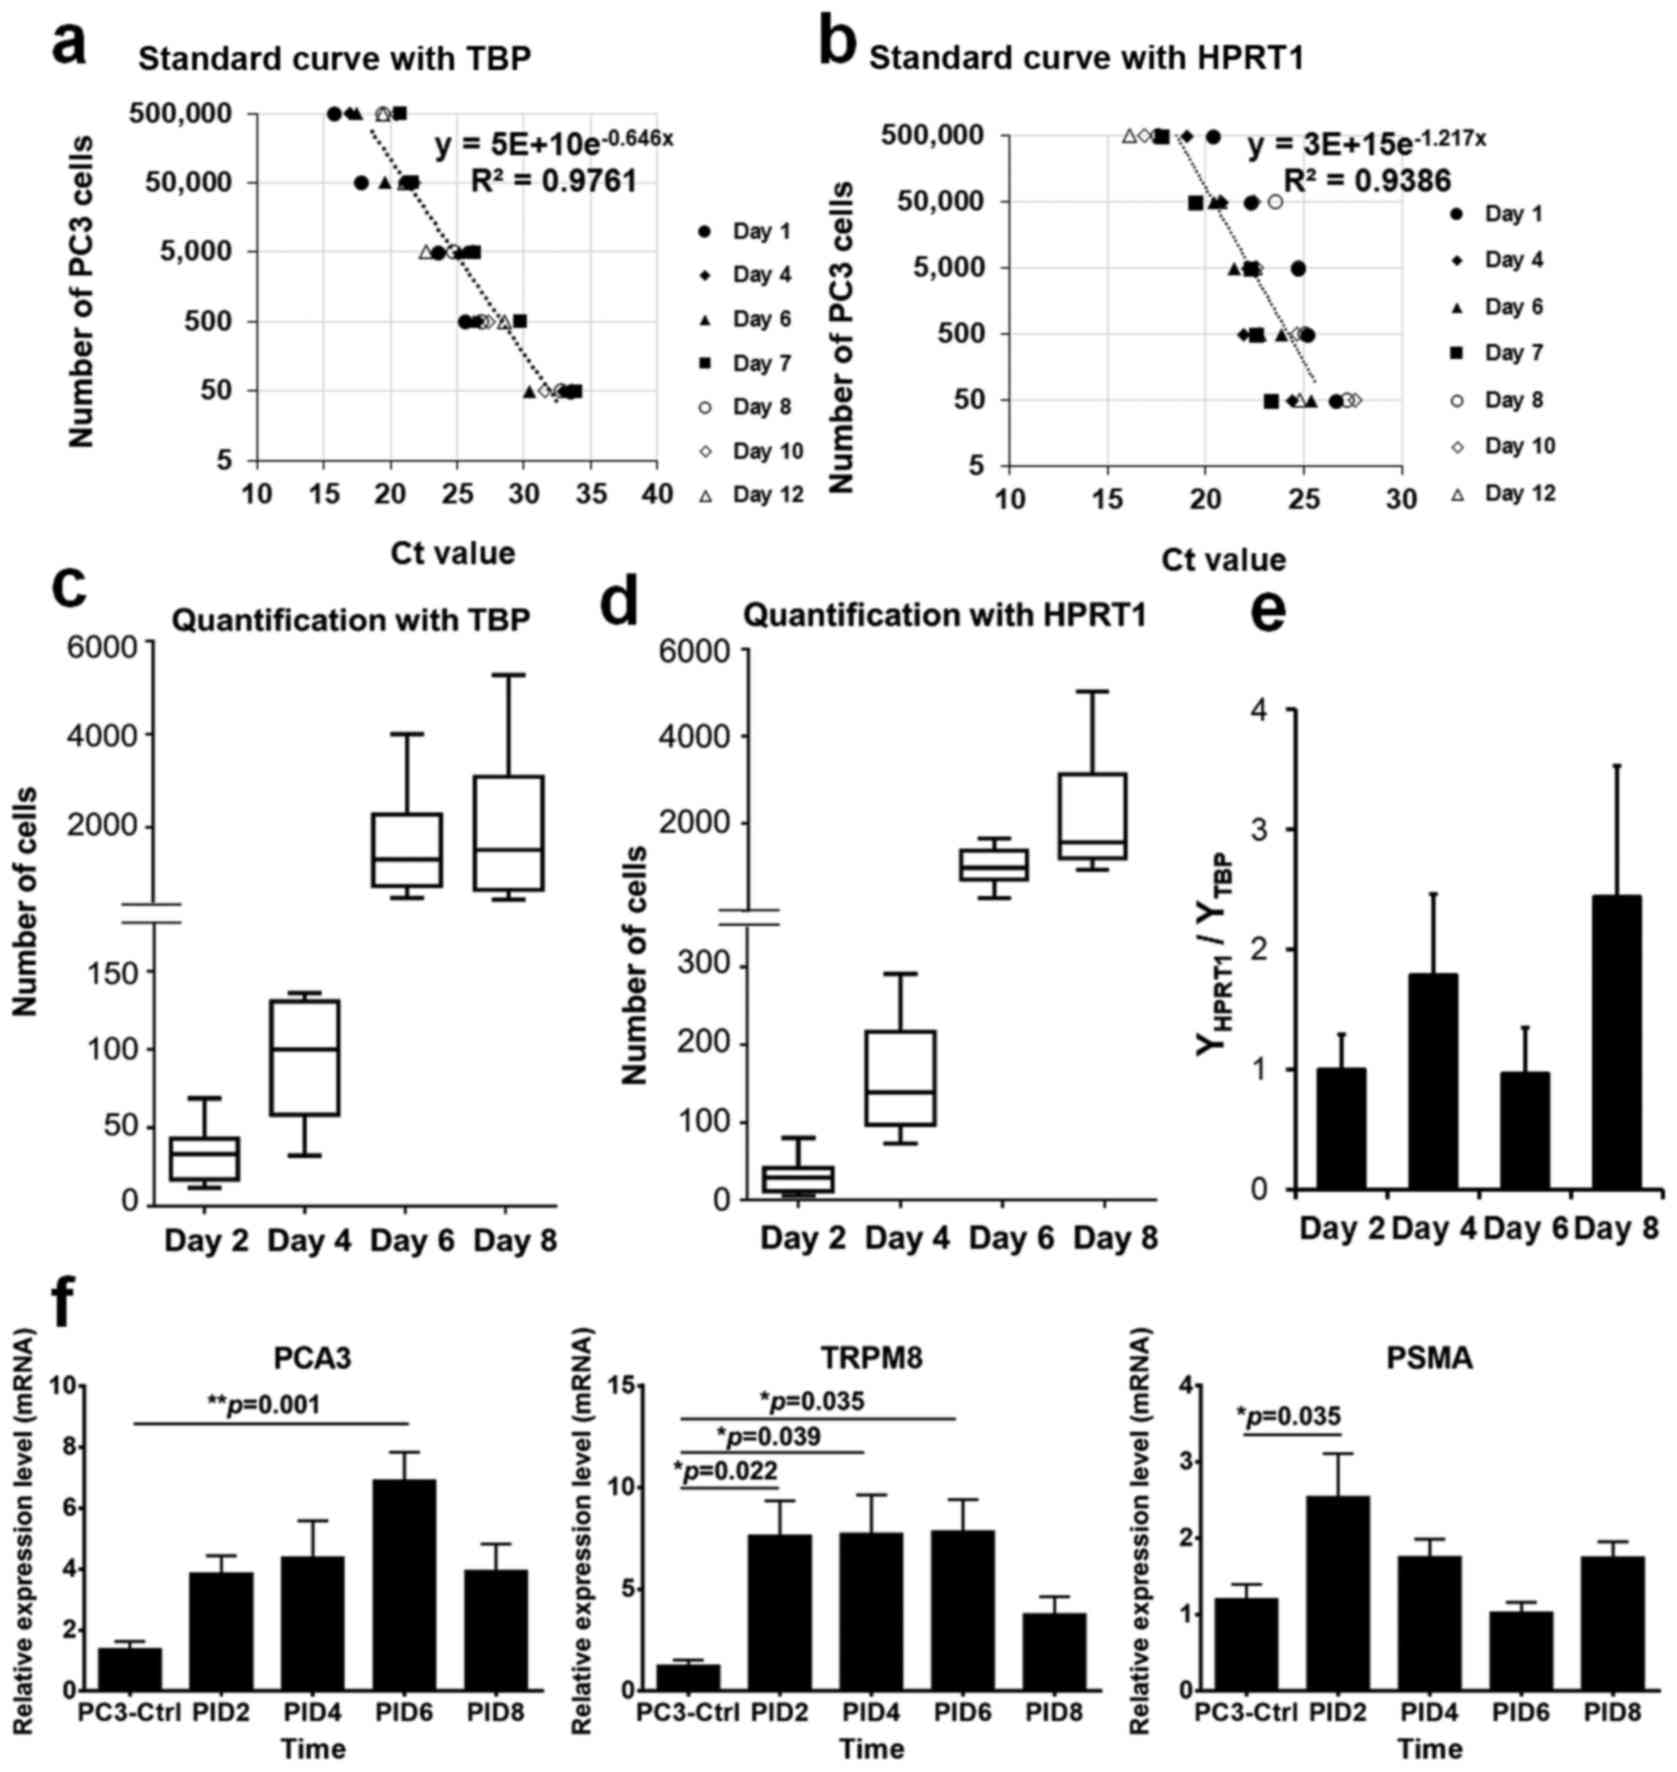
To estimate the number of PC3-CTR cells in each
zebrafish larva, qPCR targeting PC3-CTR housekeeping genes,
tbp and hprt1, was used to generate
cell-number/Ct-value curves. The number of PC3-CTR mixed with each
zebrafish larva was exponentially correlated with the Ct values of
tbp (Cttbp) and hprt1
(Cthprt1), although the regression equations for these two
curves were different. With the curve created from tbp gene
expression, an equation y = 5E +
10e-0.646x was generated to
calculate the number of PC3-CTR cells in any given zebrafish larva
with a Ct value of tbp expression (Fig. 4a). The equation generated with the
Ct values of hprt1 expression was y = 3E +
15e−1.217x (Fig. 4b). Larval zebrafish implanted with
PC3-CTR cells were harvested at PID2, 4, 6, and 8. The number of
PC3-CTR cells in each larval individual was estimated using the two
equations. For example, the Cttbp of a zebrafish
larva at PID2 was 32.85 (x=32.85). Using the equation, y =
5E + 10e−0.646x, we
calculated the total number of PC3-CTR in the larva was 30. With
the cDNA from the same larval individual, we obtained the
Cthprt1 = 26.45. Using the second equation, y =
3E + 15e−1.217x, we
concluded the number of PC3-CTR cells in this larva equals 27. The
number of PC3-CTR cells in each larval individual at each PID point
was estimated using the two equations.
Two graphs showing the changes of PC3-CTR cells in
zebrafish larvae during development were constructed (Fig. 4c and d). The estimated numbers of
PC3-CTR cells in each larva using different equations demonstrated
were similar. At PID2, the average number of PC3-CTR cells in each
larva was 33 based on the Cttbp values. Using the
Cthprt1 based quantification method, the average number of
PC3-CTR cells in each individual was 30. The two PC3-CTR number
estimation systems also demonstrated high consistencies in the
larvae at other time-points (Fig. 4c
and d). Consistent to the observations of PC3-CTR cell
populations in zebrafish larvae, rapid expansions of PC3-CTR cells
were also identified using the qPCR quantification assays. At PID4,
the numbers of PC3-CTR cells estimated by the two equations
increased to 93 and 158, respectively, in larval zebrafish. By
PID6, over 1,000 PC3-CTR cells were estimated in each larva (1,624
by equation 1 vs. 1,013 by equation 2). At the final time-point
tested in this study (PID6), the average numbers of in vivo
PC3-CTR cells in fish reached, respectively 2,004 and 2,440
according to the results from the two equations. With the PC3-CTR
numbers in each larva estimated by Ct values of hprt1
(YHPRT1) and tbp (YTBP), we also
generated a graph demonstrating the ratios of the two estimated
numbers (YHPRT1/YTBP). At day 2 and day 6
post PCa cell xenograft, the number of PC3-CTR cells estimated by
hprt1 and tbp models was very close with the ratios
at 0.999 and 0.959, respectively (Fig.
4e). At PID 4 and 8, the number of in vivo PC3-CTR cells
estimated with the hprt1 derived equation was higher than
those calculated from tbp derived formula. The values of
YHPRT1/YTBP at PID 4 and 8 were 1.78 and
2.44, respectively (Fig. 4e).
PC3-CTR demonstrated elevated
aggressiveness in vivo
Three commonly used PCa cell markers, pca3,
trpm8 and psma, were used to evaluate the development
and aggressiveness of PC3-CTR cells (24–26)
in larval zebrafish. The expressions of these three molecular
markers along the development of zebrafish larvae showed similar
patterns. Increase of pca3 expression in PC3-CTR implanted
larvae was detected from PID2 to PID6 compared to the pca3
level in PC3-CTR cells in vitro. The expression of
pca3 showed the greatest upregulation in the larvae at PID6,
which was 6.90±1.34-fold greater than that in control PC3-CTR cells
(P=0.001; Fig. 4f). Similarly,
expression of trpm8 was significantly upregulated at PID2 in
PC3-CTR cell implanted larvae by 7.63±2.07 (P=0.022) compared to
trpm8 expression in PC3-CTR in vitro. This
upregulation sustained from PID2 to PID6 with >7-fold difference
at each time-point (Fig. 4f). The
transcriptome production of psma in PC3-CTR cells in
vivo demonstrated a rapid elevation at PID2, with a
2.54±0.51-fold increase compared to in vitro PC3-CTR cells.
However, the upregulation of psma in PC3-CTR cell implanted
larvae was attenuated from PID4 with no significant difference than
that in PC3-CTR cells in vitro (Fig. 4f). In summary, the expression
profiles of these PCa cell markers suggested that the progression
and invasiveness of the PC3-CTR cells were rapidly enhanced when
implanted into larval zebrafish.
Discussion
Present results demonstrate that the human PCa cell
zebrafish xenograft model provides a rapid method for the analyses
of cancer cell migration and metastatic process in vivo.
Comparisons of human cancer xenograft models have been made between
zebrafish and nude mice (nu/nu). PCa cell line, DU145, injected to
mice through the lateral tail vein, did not demonstrate metastasis
until three months post injection. In contrast, metastasis of DU145
cells was observed in zebrafish larvae within 60 h post
implantation (27). Based on our
previous trials, the development of PC3-CTR cells varies with the
different nursing conditions. Other than the post cell injection
nursing temperature, 32°C used in this study, we also applied lower
(28°C) or higher (36°C) temperatures in some trials. The
development of PC3-CTR cells in larval zebrafish was significantly
inhibited, which was reflected by the migrating and proliferating
rates of the cells (based on observation). In contrast, no
observations were made in the larval zebrafish cultured at 36°C
because of the high mortalities, although 36°C is the best
temperature for PC3-CTR cells grown in vitro compared to the
other temperatures. We also tempted to optimize this model by using
the larval zebrafish at different development stages, such as at
post fertilization day (pfd) 4 or 6. However, our observation on
PC3-CTR cells injected into fish larvae at pfd 4 or 6 showed a
severely inhibited proliferation. This was likely caused by the
enhanced host immune system in zebrafish larvae with the
development (11,28). No larval zebrafish with implanted
PC3-CRT cells survived beyond PID10. Similar results were reported
from previous studies. Implantation of wild-type PC3 cells
(17,29) and primarily isolated prostate tumor
inducing cells (17) with less
aggressiveness compared to PC3-CRT cells (18). The adverse effects caused by the
rapid tumor cell proliferation could not be overcome by the host.
An improved zebrafish PCa cell xenograft model with a longer
survival period is desired for application in PCa diagnosis.
The external environmental conditions for PCa cells
grown in vivo are important factors for cell development.
However, the fate of implanted cells is primarily determined by the
cell type. In the present study, we used the PC3-CTR cell, which is
a modified cell line based on popular cell line PC3 established
from bone metastasis of prostate cancer in 1979 (30). Because of the high tumorigenicity
of this cell line, the PC3-CTR cells implanted in larval zebrafish
demonstrated a high aggressiveness. The proliferating rate of
PC3-CTR in vivo was high. For each larval individual, in
this study, 5–6 PC3-CTR cells were initially injected
subcutaneously. Approximately 2,000 cells were found in the
individual at PID8 and they were widely distributed in the larva,
which suggested an active migration in vivo. Compared to
PC3-CTR cells, other PCa cell lines, DU145 and LNCaP, used in
previous studies, showed slightly different behavior in zebrafish
larvae. Migrations of DU145 and LNCaP cells in vivo were
observed 30 h post injection (hpi) with the colonization
established across the whole body (27). In another earlier study,
tumor-initiating cells (TICs) were isolated from prostates of PCa
patients and implanted to zebrafish larvae. Although the TICs
demonstrated a strong ability in migration and proliferation in
vitro, no aggressive behavior of TICs inside zebrafish larvae
were observed. Cell migration was observed towards the posterior
section of body trunk with very limited expansion of the colony
in vivo (17). The
difference in cell behavior was likely caused by different
tumorigenesity of TICs and PCa cell lines.
The PCa cells used in different studies demonstrated
different proliferating levels in vivo despite all these
cells exhibiting extraordinary proliferating abilities in
vitro (17,27,31).
This was primarily caused by the different cell types but also
attributed to the methods of quantification. Since the PCa cells
were all fluorescently labeled prior to implantation, one of the
commonly used methods for quantification is direct counting with
cell imaging. Because of the high transparency of larval zebrafish
body trunk, it is possible to visualize the signals given by the
pre-labeled cells using fluorescent microscopy (27). The imaging analysis software ImageJ
(32) provided a powerful tool for
cell counting with no cost. However, the accuracy of cell counting
is primarily determined by technique of microscopy. Most cell
counting studies of xenograft cells were based on the 2-D images,
which were not able to precisely differentiate the cells
distributed in three dimensions. Therefore, the signals detected by
microscopy could not represent all positive cells in vivo.
Although more advanced microscopic techniques, such as confocal
microscopy (33,34) and 3-D imaging (35,36),
were applied in tumor cell caption and they also increased the
expenses and complexities of cell quantification methods. The cell
quantification method used in this study is based on qPCR technique
using the expression profiles of housekeeping genes in PC3 cells.
This technique took the advantage of high sensitivity of PCR assay.
Moreover, the specificity was also improved by the carefully
designed and fully characterized primers. The selection of
housekeeping genes for PCa cells was based on previous studies. The
genes, tbp and hprt1, were all previously used for
housekeeping genes in PCa studies (22,37,38),
and demonstrated great reliability in quantification of gene
expression. Other previously reported housekeeping genes, including
gapdh, actb and 18S rRNA, were also tested in this
study. Based on the sensitivity and linear regression analysis of
the Ct values of the housekeeping genes, we identified tbp
and hprt1 as the best candidate housekeeping genes for this
study. Similar techniques were also used in quantification of human
tumor cell xenografts in mice (39,40).
We also considered the potential errors during the operation for
in vivo PCa cell quantification with qPCR. The standard
curves of PCa cell quantification were generated with Ct values of
housekeeping genes from a mixture of in vitro cultured
PC3-CRT cells and larval zebrafish. We used these curves to
estimate the number of PC3-CRT cells in vivo. The
characteristics of PC3-CRT cells might be affected by the
surrounding environment, which could possibly alter the expression
patterns of housekeeping genes. However, these selected
housekeeping genes of PCa cells have been previously confirmed to
be constitutively expressed under effects of various conditions.
Therefore, we expected very minor influence on the quantification
of PC3-CRT cells in vivo. Compared to conventional cell
imaging analysis, this assay provided a rapid method for xenograft
cell quantification with minimum requirement for equipment.
The three PCa cell markers, pca3,
trpm8 and psma, were used as references for
invasiveness of PC3-CTR cells in vivo. The pca3, also
known as differential display code 3 (DD3), is a prostate-specific
non-coding mRNA, which is overexpressed in tumor cells (41). The cells with overexpression of
pca3 in prostate is often associated with a greater tumor
aggressiveness (42,43). As a member of transient receptor
potential (TRP) ion channel family, the TRPM8 is involved in a
number of prostate tumor cell activities, such as proliferation
(44,45), apoptosis (46) and cell migration (45,47).
Because of its specificity and roles in prostate tumor cell
progression, trpm8 has been considered to be a potential
target for diagnostic strategies, and pharmaceutical treatment of
PCas (48). The PSMA is a prostate
specific membrane antigen that has been correlated with a number of
prostate aggressive disease, including PCas (49). More than 10-fold expression levels
of this molecule has been detected in many states of PCas (26). The basal expression level of
psma in PC3 cells was reported to be low (26,50),
although we detected the expression of this gene in mRNA level in
PC3-CTR cells. Our finding suggested that the expression levels of
these three PCa markers were all elevated with the development of
PC3-CTR cells in vivo, which is positively correlated with
the increase of PC3-CTR cell proliferation and migration based on
the result of observation and quantification.
Our results indicated that the in vivo
experiment of larval zebrafish was ideal for PC3-CTR cell
progression. The development of PCa cells in zebrafish larvae
appeared to be significantly accelerated compared to that in
mammalian models (several days in fish vs. several months in mice).
However, the rapid development of PC3-CTR cells demonstrated lethal
effects to zebrafish larvae. Large mortalities were observed after
PID5 and very few individuals with implanted PC3-CTR cells survived
beyond PID14. The rapidly grown PC3-CTR cells appeared to heavily
impact the normal growth of the larvae. The average growth rates of
PC3-CTR implanted larvae were markedly lower than control larvae
without implanted PC3-CTR cells. The tumor burden was likely the
cause of nutritional deficiency in the host (51). Therefore, an improved nutritional
condition is necessary to maintain the growth of zebrafish larvae
during the experiment.
In summary, the present studies demonstrate the
utility of zebra fish model to assess tumorigenicity and
aggressiveness of prostate cancer cell lines; and the model can be
applied for quick assessment of aggressiveness of primary prostate
cancer cells derived from patient biopsies.
Acknowledgments
The present study is supported by the Louisiana
Campus Research Initiatives, and the NIH grant CA-096534 to
G.S.
References
|
1
|
American Cancer Society: What are the key
statistics about prostate cancer? 2015
|
|
2
|
van Leeuwen PJ, Connolly D, Gavin A,
Roobol MJ, Black A, Bangma CH and Schröder FH: Prostate cancer
mortality in screen and clinically detected prostate cancer:
Estimating the screening benefit. Eur J Cancer. 46:377–383. 2010.
View Article : Google Scholar
|
|
3
|
Rajasekhar VK, Studer L, Gerald W, Socci
ND and Scher HI: Tumour-initiating stem-like cells in human
prostate cancer exhibit increased NF-κB signalling. Nat Commun.
2:1622011. View Article : Google Scholar
|
|
4
|
Collins AT, Berry PA, Hyde C, Stower MJ
and Maitland NJ: Prospective identification of tumorigenic prostate
cancer stem cells. Cancer Res. 65:10946–10951. 2005. View Article : Google Scholar : PubMed/NCBI
|
|
5
|
Chen Y, Zhao J, Luo Y, Wang Y, Wei N and
Jiang Y: Isolation and identification of cancer stem-like cells
from side population of human prostate cancer cells. J Huazhong
Univ Sci Technolog Med Sci. 32:697–703. 2012. View Article : Google Scholar : PubMed/NCBI
|
|
6
|
Bokhorst LP, Bangma CH, van Leenders GJ,
Lous JJ, Moss SM, Schröder FH and Roobol MJ: Prostate-specific
antigen-based prostate cancer screening: reduction of prostate
cancer mortality after correction for nonattendance and
contamination in the Rotterdam section of the European Randomized
Study of Screening for Prostate Cancer. Eur Urol. 65:329–336. 2013.
View Article : Google Scholar : PubMed/NCBI
|
|
7
|
Shah G: A human cancer cell specific gene
product. USPTO; Shah Girish V: 2011
|
|
8
|
Park SI, Kim SJ, McCauley LK and Gallick
GE: Pre-clinical mouse models of human prostate cancer and their
utility in drug discovery. Curr Protoc Pharmacol Chapter 14. Unit
14.15. 2010. View Article : Google Scholar
|
|
9
|
Hafeez BB, Zhong W, Fischer JW, Mustafa A,
Shi X, Meske L, Hong H, Cai W, Havighurst T, Kim K, et al:
Plumbagin, a medicinal plant (Plumbago zeylanica)-derived
1,4-naphthoqui-none, inhibits growth and metastasis of human
prostate cancer PC-3M-luciferase cells in an orthotopic xenograft
mouse model. Mol Oncol. 7:428–439. 2013. View Article : Google Scholar : PubMed/NCBI
|
|
10
|
Hansen AG, Arnold SA, Jiang M, Palmer TD,
Ketova T, Merkel A, Pickup M, Samaras S, Shyr Y, Moses HL, et al:
ALCAM/CD166 is a TGF-β-responsive marker and functional regulator
of prostate cancer metastasis to bone. Cancer Res. 74:1404–1415.
2014. View Article : Google Scholar : PubMed/NCBI
|
|
11
|
Moshal KS, Ferri-Lagneau KF and Leung T:
Zebrafish model: Worth considering in defining tumor angiogenesis.
Trends Cardiovasc Med. 20:114–119. 2010. View Article : Google Scholar
|
|
12
|
Liu S and Leach SD: Zebrafish models for
cancer. Annu Rev Pathol. 6:71–93. 2011. View Article : Google Scholar : PubMed/NCBI
|
|
13
|
Tat J, Liu M and Wen XY: Zebrafish cancer
and metastasis models for in vivo drug discovery. Drug Discov Today
Technol. 10:e83–e89. 2013. View Article : Google Scholar : PubMed/NCBI
|
|
14
|
Yen J, White RM and Stemple DL: Zebrafish
models of cancer: Progress and future challenges. Curr Opin Genet
Dev. 24:38–45. 2014. View Article : Google Scholar : PubMed/NCBI
|
|
15
|
Patton EE and Zon LI: Taking human cancer
genes to the fish: A transgenic model of melanoma in zebrafish.
Zebrafish. 1:363–368. 2005. View Article : Google Scholar
|
|
16
|
White RM, Sessa A, Burke C, Bowman T,
LeBlanc J, Ceol C, Bourque C, Dovey M, Goessling W, Burns CE, et
al: Transparent adult zebrafish as a tool for in vivo
transplantation analysis. Cell Stem Cell. 2:183–189. 2008.
View Article : Google Scholar : PubMed/NCBI
|
|
17
|
Bansal N, Davis S, Tereshchenko I,
Budak-Alpdogan T, Zhong H, Stein MN, Kim IY, Dipaola RS, Bertino JR
and Sabaawy HE: Enrichment of human prostate cancer cells with
tumor initiating properties in mouse and zebrafish xenografts by
differential adhesion. Prostate. 74:187–200. 2014. View Article : Google Scholar :
|
|
18
|
Shah GV, Muralidharan A, Gokulgandhi M,
Soan K and Thomas S: Cadherin switching and activation of
beta-catenin signaling underlie proinvasive actions of
calcitonin-calcitonin receptor axis in prostate cancer. J Biol
Chem. 284:1018–1030. 2009. View Article : Google Scholar :
|
|
19
|
Westerfield M: The zebrafish book A guide
for the laboratory use of zebrafish (Danio rerio). 5th edition.
University of Oregon Press; Eugene, OR: 2007
|
|
20
|
Schmidt U, Fuessel S, Koch R, Baretton GB,
Lohse A, Tomasetti S, Unversucht S, Froehner M, Wirth MP and Meye
A: Quantitative multi-gene expression profiling of primary prostate
cancer. Prostate. 66:1521–1534. 2006. View Article : Google Scholar : PubMed/NCBI
|
|
21
|
Valente V, Teixeira SA, Neder L, Okamoto
OK, Oba-Shinjo SM, Marie SK, Scrideli CA, Paçó-Larson ML and
Carlotti CG Jr: Selection of suitable housekeeping genes for
expression analysis in glioblastoma using quantitative RT-PCR. BMC
Mol Biol. 10:172009. View Article : Google Scholar : PubMed/NCBI
|
|
22
|
Ohl F, Jung M, Xu C, Stephan C, Rabien A,
Burkhardt M, Nitsche A, Kristiansen G, Loening SA, Radonić A, et
al: Gene expression studies in prostate cancer tissue: Which
reference gene should be selected for normalization? J Mol Med
(Berl). 83:1014–1024. 2005. View Article : Google Scholar
|
|
23
|
Altschul SF, Gish W, Miller W, Myers EW
and Lipman DJ: Basic local alignment search tool. J Mol Biol.
215:403–410. 1990. View Article : Google Scholar : PubMed/NCBI
|
|
24
|
Ferreira LB, Palumbo A, de Mello KD,
Sternberg C, Caetano MS, de Oliveira FL, Neves AF, Nasciutti LE,
Goulart LR and Gimba ER: PCA3 noncoding RNA is involved in the
control of prostate-cancer cell survival and modulates androgen
receptor signaling. BMC Cancer. 12:5072012. View Article : Google Scholar : PubMed/NCBI
|
|
25
|
Bai VU, Murthy S, Chinnakannu K,
Muhletaler F, Tejwani S, Barrack ER, Kim SH, Menon M and Veer Reddy
GP: Androgen regulated TRPM8 expression: A potential mRNA marker
for metastatic prostate cancer detection in body fluids. Int J
Oncol. 36:443–450. 2010.PubMed/NCBI
|
|
26
|
Ghosh A, Wang X, Klein E and Heston WD:
Novel role of prostate-specific membrane antigen in suppressing
prostate cancer invasiveness. Cancer Res. 65:727–731.
2005.PubMed/NCBI
|
|
27
|
Teng Y, Xie X, Walker S, White DT, Mumm JS
and Cowell JK: Evaluating human cancer cell metastasis in
zebrafish. BMC Cancer. 13:4532013. View Article : Google Scholar : PubMed/NCBI
|
|
28
|
Taylor AM and Zon LI: Zebrafish tumor
assays: The state of transplantation. Zebrafish. 6:339–346. 2009.
View Article : Google Scholar
|
|
29
|
Spaink HP, Cui C, Wiweger MI, Jansen HJ,
Veneman WJ, Marín-Juez R, de Sonneville J, Ordas A, Torraca V, van
der Ent W, et al: Robotic injection of zebrafish embryos for
high-throughput screening in disease models. Methods. 62:246–254.
2013. View Article : Google Scholar : PubMed/NCBI
|
|
30
|
Kaighn ME, Narayan KS, Ohnuki Y, Lechner
JF and Jones LW: Establishment and characterization of a human
prostatic carcinoma cell line (PC-3). Invest Urol. 17:16–23.
1979.PubMed/NCBI
|
|
31
|
Abasolo I, Yang L, Haleem R, Xiao W, Pio
R, Cuttitta F, Montuenga LM, Kozlowski JM, Calvo A and Wang Z:
Overexpression of adrenomedullin gene markedly inhibits
proliferation of PC3 prostate cancer cells in vitro and in vivo.
Mol Cell Endocrinol. 199:179–187. 2003. View Article : Google Scholar : PubMed/NCBI
|
|
32
|
Schneider CA, Rasband WS and Eliceiri KW:
NIH Image to ImageJ: 25 years of image analysis. Nat Methods.
9:671–675. 2012. View Article : Google Scholar : PubMed/NCBI
|
|
33
|
Allocca G, Kusumbe AP, Ramasamy SK and
Wang N: Confocal/two-photon microscopy in studying colonisation of
cancer cells in bone using xenograft mouse models. Bonekey Rep.
5:8512016. View Article : Google Scholar : PubMed/NCBI
|
|
34
|
Chittajallu DR, Florian S, Kohler RH,
Iwamoto Y, Orth JD, Weissleder R, Danuser G and Mitchison TJ: In
vivo cell-cycle profiling in xenograft tumors by quantitative
intravital microscopy. Nat Methods. 12:577–585. 2015. View Article : Google Scholar : PubMed/NCBI
|
|
35
|
Bocci G, Buffa F, Canu B, Concu R,
Fioravanti A, Orlandi P and Pisanu T: A new biometric tool for
three-dimensional subcutaneous tumor scanning in mice. In Vivo.
28:75–80. 2014.PubMed/NCBI
|
|
36
|
Oldham M, Sakhalkar H, Oliver T, Wang YM,
Kirpatrick J, Cao Y, Badea C, Johnson GA and Dewhirst M:
Three-dimensional imaging of xenograft tumors using optical
computed and emission tomography. Med Phys. 33:3193–3202. 2006.
View Article : Google Scholar : PubMed/NCBI
|
|
37
|
Tsaur I, Renninger M, Hennenlotter J,
Oppermann E, Munz M, Kuehs U, Stenzl A and Schilling D: Reliable
housekeeping gene combination for quantitative PCR of lymph nodes
in patients with prostate cancer. Anticancer Res. 33:5243–5248.
2013.PubMed/NCBI
|
|
38
|
Rho HW, Lee BC, Choi ES, Choi IJ, Lee YS
and Goh SH: Identification of valid reference genes for gene
expression studies of human stomach cancer by reverse
transcription-qPCR. BMC Cancer. 10:2402010. View Article : Google Scholar : PubMed/NCBI
|
|
39
|
Alcoser SY, Kimmel DJ, Borgel SD, Carter
JP, Dougherty KM and Hollingshead MG: Real-time PCR-based assay to
quantify the relative amount of human and mouse tissue present in
tumor xenografts. BMC Biotechnol. 11:1242011. View Article : Google Scholar : PubMed/NCBI
|
|
40
|
Preston Campbell J, Mulcrone P, Masood SK,
Karolak M, Merkel A, Hebron K, Zijlstra A, Sterling J and
Elefteriou F: TRIzol and Alu qPCR-based quantification of
metastatic seeding within the skeleton. Sci Rep. 5:126352015.
View Article : Google Scholar : PubMed/NCBI
|
|
41
|
Bussemakers MJ, van Bokhoven A, Verhaegh
GW, Smit FP, Karthaus HF, Schalken JA, Debruyne FM, Ru N and Isaacs
WB: DD3: A new prostate-specific gene, highly overexpressed in
prostate cancer. Cancer Res. 59:5975–5979. 1999.PubMed/NCBI
|
|
42
|
Merola R, Tomao L, Antenucci A, Sperduti
I, Sentinelli S, Masi S, Mandoj C, Orlandi G, Papalia R,
Guaglianone S, et al: PCA3 in prostate cancer and tumor
aggressiveness detection on 407 high-risk patients: A National
Cancer Institute experience. J Exp Clin Cancer Res. 34:152015.
View Article : Google Scholar : PubMed/NCBI
|
|
43
|
Galasso F, Giannella R, Bruni P, Giulivo
R, Barbini VR, Disanto V, Leonardi R, Pansadoro V and Sepe G: PCA3:
A new tool to diagnose prostate cancer (PCa) and a guidance in
biopsy decisions. Preliminary report of the UrOP study. Arch Ital
Urol Androl. 82:5–9. 2010.PubMed/NCBI
|
|
44
|
Wang Y, Wang X, Yang Z, Zhu G, Chen D and
Meng Z: Menthol inhibits the proliferation and motility of prostate
cancer DU145 cells. Pathol Oncol Res. 18:903–910. 2012. View Article : Google Scholar : PubMed/NCBI
|
|
45
|
Zhu G, Wang X, Yang Z, Cao H, Meng Z, Wang
Y and Chen D: Effects of TRPM8 on the proliferation and
angiogenesis of prostate cancer PC-3 cells in vivo. Oncol Lett.
2:1213–1217. 2011.
|
|
46
|
Wertz IE and Dixit VM: Characterization of
calcium release-activated apoptosis of LNCaP prostate cancer cells.
J Biol Chem. 275:11470–11477. 2000. View Article : Google Scholar
|
|
47
|
Gkika D, Flourakis M, Lemonnier L and
Prevarskaya N: PSA reduces prostate cancer cell motility by
stimulating TRPM8 activity and plasma membrane expression.
Oncogene. 29:4611–4616. 2010. View Article : Google Scholar : PubMed/NCBI
|
|
48
|
Zhang L and Barritt GJ: TRPM8 in prostate
cancer cells: A potential diagnostic and prognostic marker with a
secretory function? Endocr Relat Cancer. 13:27–38. 2006. View Article : Google Scholar : PubMed/NCBI
|
|
49
|
Sweat SD, Pacelli A, Murphy GP and
Bostwick DG: Prostate-specific membrane antigen expression is
greatest in prostate adenocarcinoma and lymph node metastases.
Urology. 52:637–640. 1998. View Article : Google Scholar : PubMed/NCBI
|
|
50
|
Yao V, Berkman CE, Choi JK, O'Keefe DS and
Bacich DJ: Expression of prostate-specific membrane antigen (PSMA),
increases cell folate uptake and proliferation and suggests a novel
role for PSMA in the uptake of the non-polyglutamated folate, folic
acid. Prostate. 70:305–316. 2010.
|
|
51
|
Macciò A, Madeddu C, Gramignano G, Mulas
C, Tanca L, Cherchi MC, Floris C, Omoto I, Barracca A and Ganz T:
The role of inflammation, iron, and nutritional status in
cancer-related anemia: Results of a large, prospective,
observational study. Haematologica. 100:124–132. 2015. View Article : Google Scholar :
|