Introduction
For patients with colorectal cancer (CRC), the
overall survival benefits of systemic treatments, including tumor
resection, 5-fluorouracil (5-FU)-based chemotherapy and targeted
therapies, have been firmly established (1,2).
Nevertheless, recurrence and metastasis caused by the drug
resistance of tumor cells continue to obstruct significant
therapeutic efficacy.
The development of CRC is a multi-gene, multi-step
and multi-factor interactive process. The improvement of
therapeutic efficacy significantly relies on improved studies of
gene functions and mechanisms (3).
It has been widely recognized that abnormal bioenergetics is one of
the most common phenotypes of a number of tumor cells, including
CRC (4). Changes in ATP synthetase
are found in tumor cells and are considered to be associated with
the energy metabolism and drug resistance within the tumor
(5,6).
ATP synthase-coupling factor 6, mitochondrial
(ATP5J) is a protein connecting F0 and F1, which are two components
of ATP synthetase (7). ATP5J has
been hypothesized to recover the activity of ATPase inhibited by
oligomycin, as well as the exchange between ATP and inorganic
phosphorus (8). Our previous study
reported that ATP5J may be a tumor biomarker. Higher expression of
ATP5J was found in CRC tissue compared with that in normal tissue,
and in metastatic lymph nodes compared with that in primary tumors
(9). In vitro experiments
demonstrated that upregulation of ATP5J expression in DLD1
cells enhances cell migration and 5-FU resistance, while
downregulation reverses this reaction. Investigation of ATP5J has
been mainly focused on cardiovascular disease. Only a few studies
have discussed the role of ATP5J in cancer, including renal
carcinoma and hepatocellular carcinoma (10,11).
The molecular mechanism of ATP5J in CRC cells remains unknown.
Based on previous studies, the following study
investigated differentially expressed mRNAs (DEmRNAs) and lncRNAs
(DElncRNAs) using microarray and bioinformatics methods. The
obtained results may provide valuable information on the function
and mechanism of ATP5J in CRC, and a better understanding may be
beneficial for the improvement of CRC management.
Materials and methods
Cell lines
In our previous study (9), the human colon cancer DLD1 cell line
was used for cell transfection and stable colony selection. The
expression of ATP5J was highly downregulated in clone 4, while it
was highly upregulated in clone 2. Consequently, 4 DLD1 cells that
were stably transfected with pcDNA3.1(+)/ATP5J plasmid (DLD1/A2),
ATP5J short hairpin (sh)RNA plasmid (DLD1/SA4) and the
corresponding control vectors (DLD1/C6 and DLD1/CA6), respectively,
were selected and used in the present study.
RNA extraction and microarray
Total RNA was extracted from the 4 cell types by
TRIzol reagent (Invitrogen; Thermo Fisher Scientific, Inc.,
Waltham, MA, USA) according to the manufacturer's protocols. RNA
quality was detected by an Agilent 2100 Bioanalyzer (Agilent
Technologies, Inc., Santa Clara, CA, USA). The microarray analysis
was performed by CapitalBio Corporation (Beijing, China). Total RNA
was extracted from the cells and the cDNA that was then produced by
reverse transcription served as the template to synthesize the
fluorescently labeled (Cy5 or Cy3) cDNA using Klenow fragment
polymerase. The labeled cDNA was hybridized on the lncRNA + mRNA
Human Gene Expression Microarray (4×180K; Agilent Technologies,
Inc.). The microarrays were washed three times with wash solution
(0.2% SDS, 2X SSC at 42°C for 120 sec) and scanned using an Agilent
G2565CA Microarray Scanner (Agilent Technologies, Inc.), according
to the manu facturer' s protocols. The raw data were analyzed and
then normalized using percentile normalization. Only the mRNAs or
lncRNAs with a fold-change ≥2.0 and a P-value cutoff of <0.05
were considered as DEmRNAs or DElncRNAs.
Pathway enrichment analysis of
DEmRNAs
The Database for Annotation, Visualization and
Integrated Discovery (DAVID; https://david.ncifcrf.gov/) provides a comprehensive
set of functional annotation tools for investigators to extract
biological meaning from genes or proteins. The Kyoto Encyclopedia
of Genes and Genomes (KEGG; http://www.kegg.jp/) is a database resource for
functional interpretation and annotation of enriched pathways using
large-scale gene datasets. The Gene Ontology (GO; http://www.geneontology.org/) database is commonly
used to unify the representation of gene and gene product
attributes. GO and KEGG pathway enrichment analyses were conducted
for differentially expressed genes using DAVID. A P-value of
<0.05 was selected as the cut-off criterion.
Protein-protein interaction (PPI) network
construction
The Search Tool for the Retrieval of Interacting
Genes (STRING; http://www.string-db.org/) database is an online
database containing direct and indirect associations of proteins.
DEmRNAs were mapped to STRING to assess the interactions. Next, PPI
networks were established using Cytoscape software (version 3.6.0;
http://www.cytoscape.org/). The Molecular Complex
Detection (MCODE) plug-in was utilized to filter the modules of the
PPI network in Cytoscape. An MCODE score of >5 was the selection
criteria. Hub genes were exported. Function and pathway enrichment
analyses were performed for DEmRNAs in the modules. A P-value of
<0.05 was considered statistically significant.
Reverse transcription-quantitative
polymerase chain reaction (RT-qPCR)
RNA was extracted as aforementioned. RNA was
quantified using a NanoDrop 2000c spectrophotometer (Thermo Fisher
Scientific, Inc.). cDNA was generated using an RNeasy Mini kit
(Takara Bio, Inc., Otsu, Japan). qPCR analysis was performed with
SYBR-Green Master mix (Takara Bio, Inc.) for lncRNA and mRNA
detection. The qPCR was performed at 95°C for 2 min, 40 cycles of
95°C for 5 sec and 60°C for 30 sec, one cycle of 95°C for 5 sec,
60°C for 1 min and 95°C for 15 sec, and finally, 50°C for 30 sec.
Relative expression was analyzed using the 2−ΔΔCq method
(12). Human GAPDH was used as an
endogenous reference gene. The sequences of the primers are shown
in Table I.
 | Table ISequences of primers used for reverse
transcription-quantitative polymerase chain reaction. |
Table I
Sequences of primers used for reverse
transcription-quantitative polymerase chain reaction.
| mRNAs/lncRNAs | Primer
sequences |
|---|
| ATP5J | F:
TCAGCCGTCTCAGTCCATTT |
| R:
CCAAACATTTGCTTGAGCTT |
| CRTAM | F:
CCAAATACCAGCTTCTTCATCA |
| R:
CTTCAAACCGGAAGGGTGCT |
| CD44 | F:
AGTCACAGACCTGCCCAATGCCTTT |
| R:
TTTGCTCCACCTTCTTGACTCCCATG |
| CST1 | F:
AGGAGACCATGGCCCAGTAT |
| R:
GCAGCGGACGTCTGTAGTAG |
| EEF1A2 | F:
TCTCCAAGAATGGGCAGACG |
| R:
TTGACGATCTCGTCGTAGCG |
| XIST | F:
CTCTCCATTGGGTTCAC |
| R:
GCGGCAGGTCTTAAGAGATGAG |
| AKT2 | F:
GCCACCATGAATGAGGTGAATA |
| R:
CCTTGTACCCAATGAAGGAGC |
| GAPDH | F:
ACCACAGTCCATGCCATCAC |
| R:
TCCACCACCCTGTTGCTGTA |
Construction of DEmRNA-DElncRNA
co-expression network
A DElncRNA-DEmRNA co-expression network was
constructed to explore the association between the RNAs. Pearson's
correlation coefficient (PCC) was calculated between DElncRNAs and
DEmRNAs according to corresponding expression levels. The criteria
of |PCC| ≥0.90 was used to determine DElncRNA-DEmRNA pairs for
network construction. The DElncRNA-DEmRNA network was constructed
using Cytoscape 3.5.1 (http://cytoscape.org/).
Statistical analysis
The results of the qPCR were presented using Graph
Pad Prism (version 6.0; GraphPad Software, Inc., La Jolla, CA,
USA). Data are presented as the mean ± standard error of the mean.
The independent samples t-test was performed for data comparison.
P<0.05 was considered to indicate a statistically significant
difference.
Results
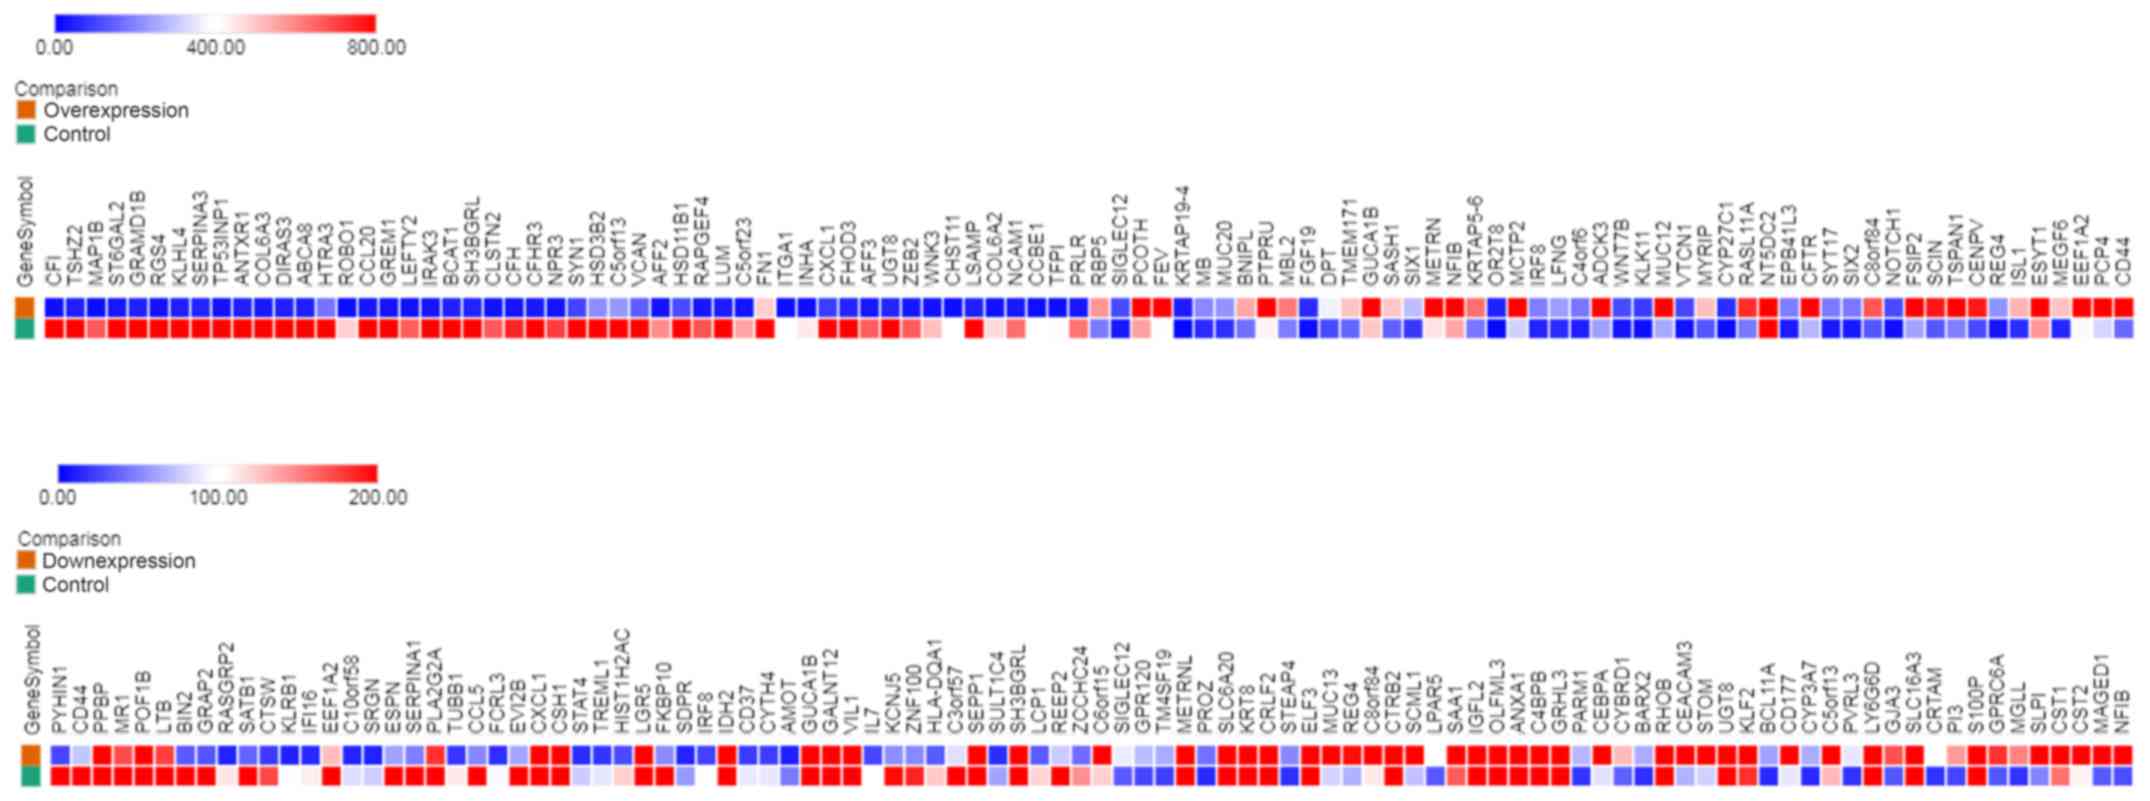
Identification of DEmRNAs
According to microarray analysis, 32,206 mRNAs were
detected in two pairs of cells, including 2,190 DEmRNAs (503
upregulated and 1,687 downregulated), which were significantly
differentially expressed with a fold-change of ≥2.0. In addition,
the DEmRNAs were divided into two sets: Set A contained all DEmRNAs
from cell pair DLD1/A2 vs. DLD1/C6, and set B contained all DEmRNAs
from DLD1/SA4 vs. DLD1/CA6. Heat map representation showed the top
100 differentially DEmRNAs (Fig.
1).
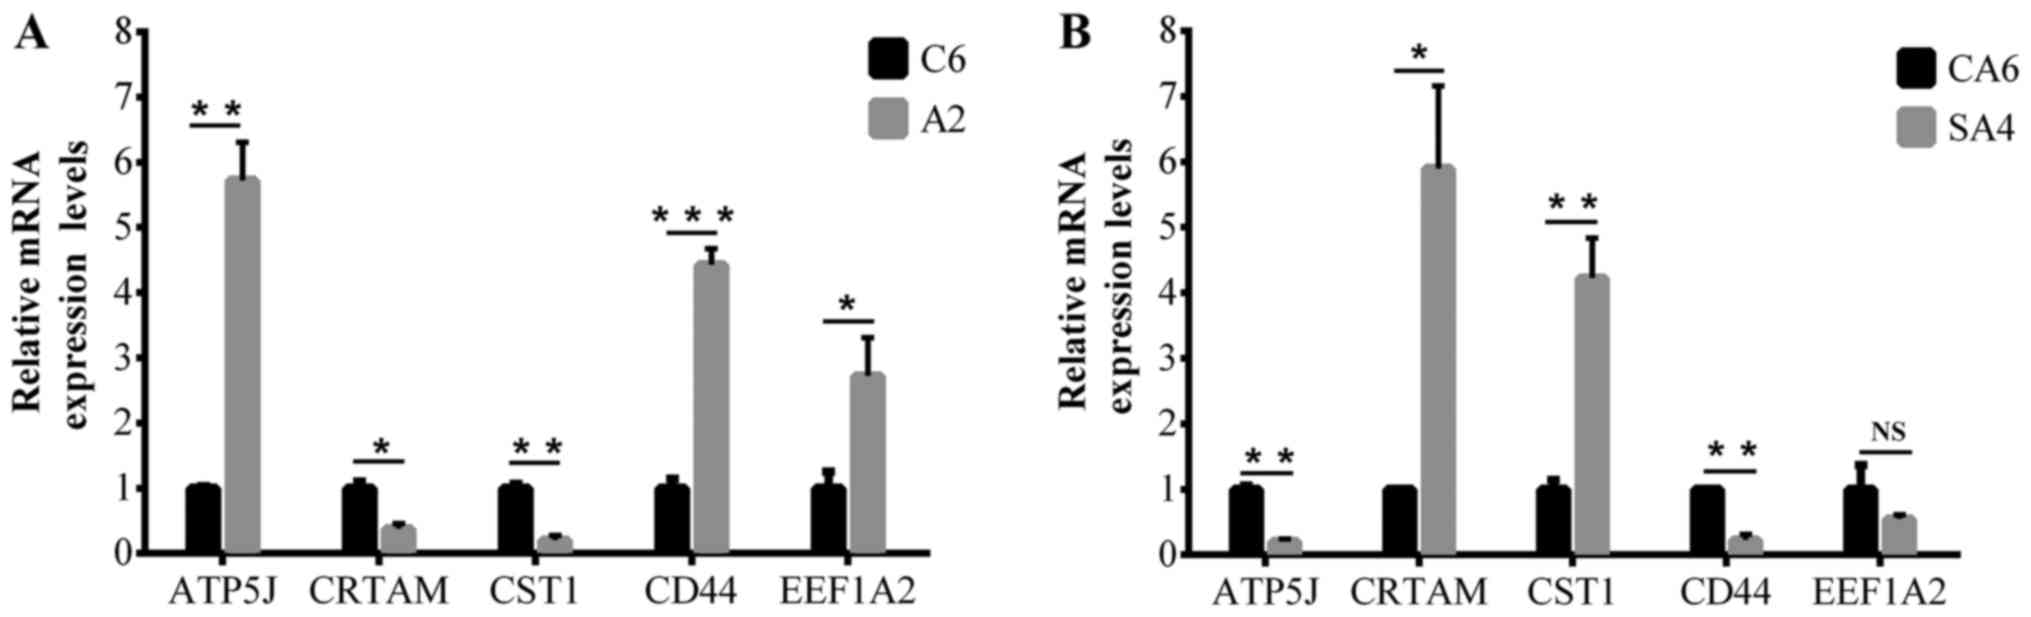
RT-qPCR validation of DEmRNAs
To validate the results of microarray analysis,
RT-qPCR was performed in ATP5J and four randomly selected
mRNAs. As shown in Fig. 2,
cytotoxic and regulatory T cell molecule and cystatin SN were
downregulated in DLD1/A2 vs. DLD1/C6 and upregulated in DLD1/SA4
vs. DLD1/CA6, while opposite results were obtained for
ATP5J, cluster of differentiation 44 and eukaryotic
translation elongation factor 1α2. The PCR results were basically
concurrent with the microarray data.
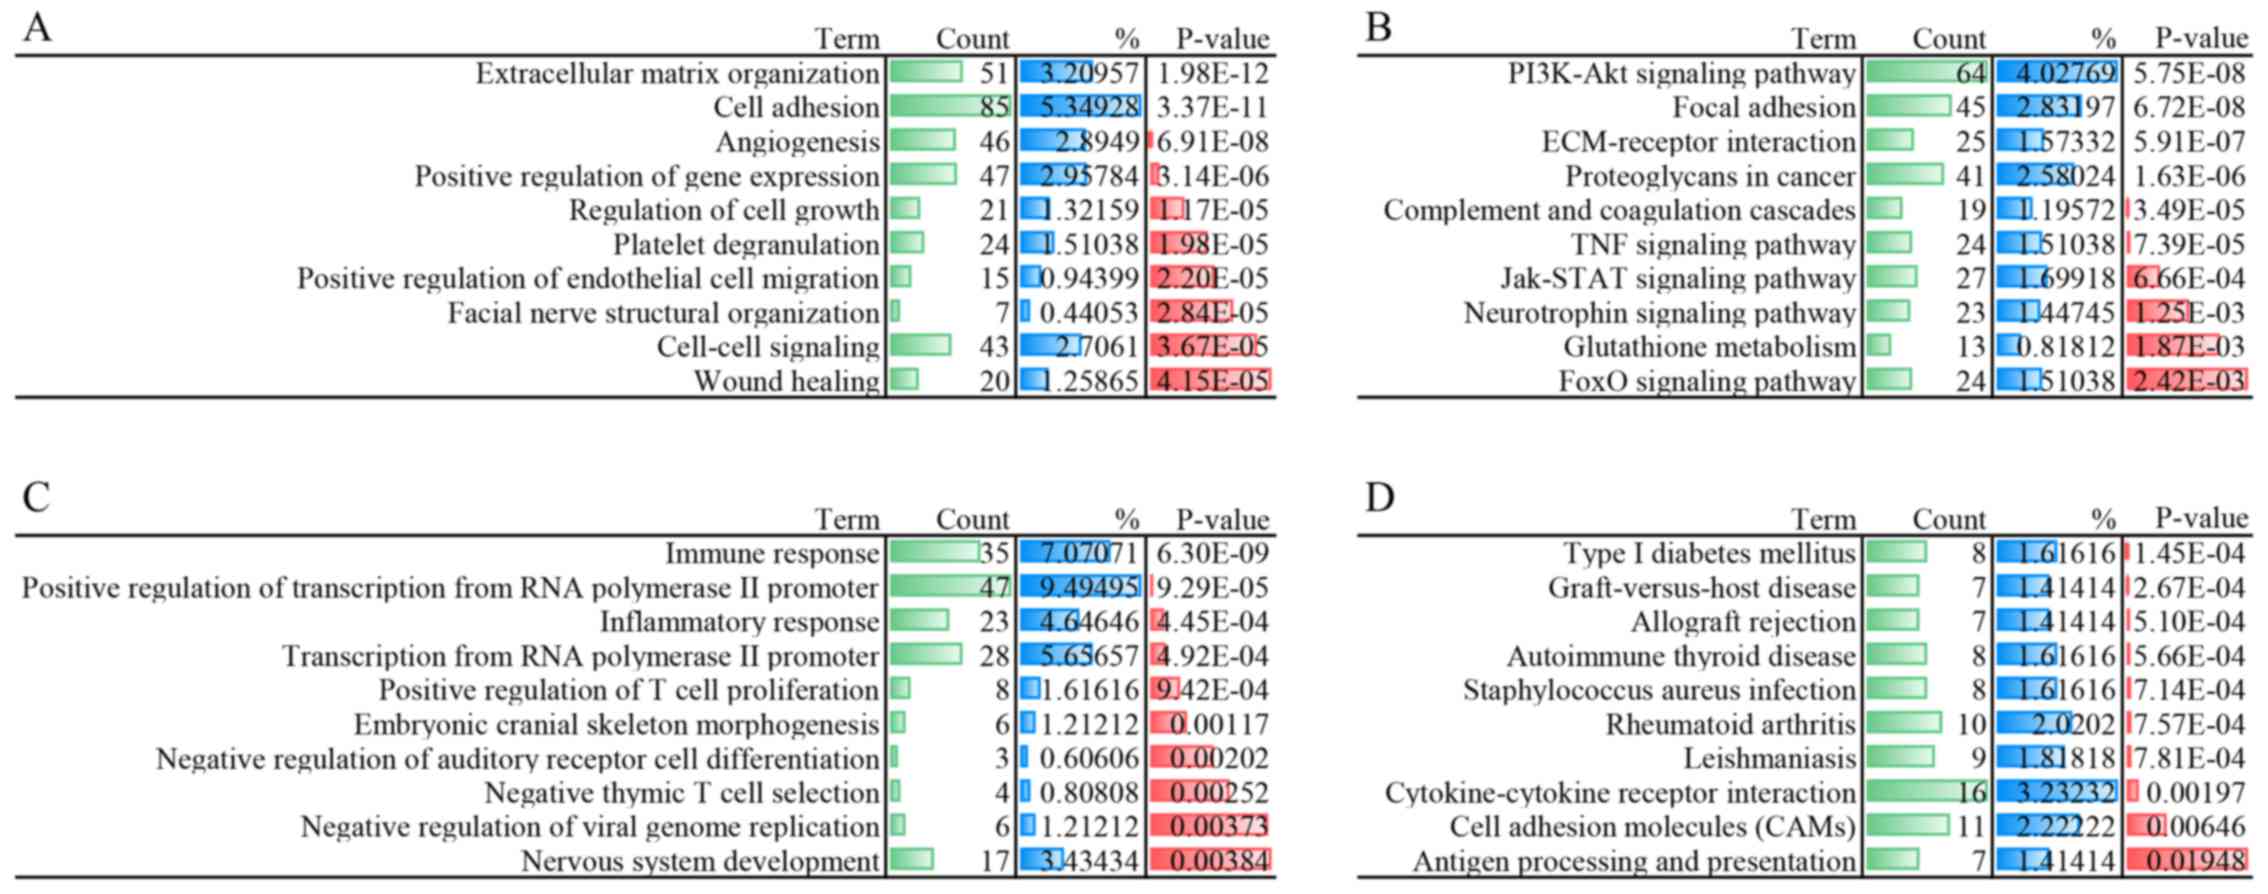
Functional and pathway enrichment
analysis
In order to investigate potential gene and gene
products, GO functional and KEGG pathway enrichment analyses were
performed for sets A and B, respectively. The DEmRNAs from set A
were mainly enriched in biological processes associated with
'positive regulation of gene expression', 'cell-cell signaling' and
'regulation of cell growth'. The 10 most significantly enriched GO
terms for DEmRNAs from sets A and B are shown in Fig. 3A and C, while the 10 most
significantly enriched KEGG pathways in sets A and B are presented
in Fig. 3B and D.
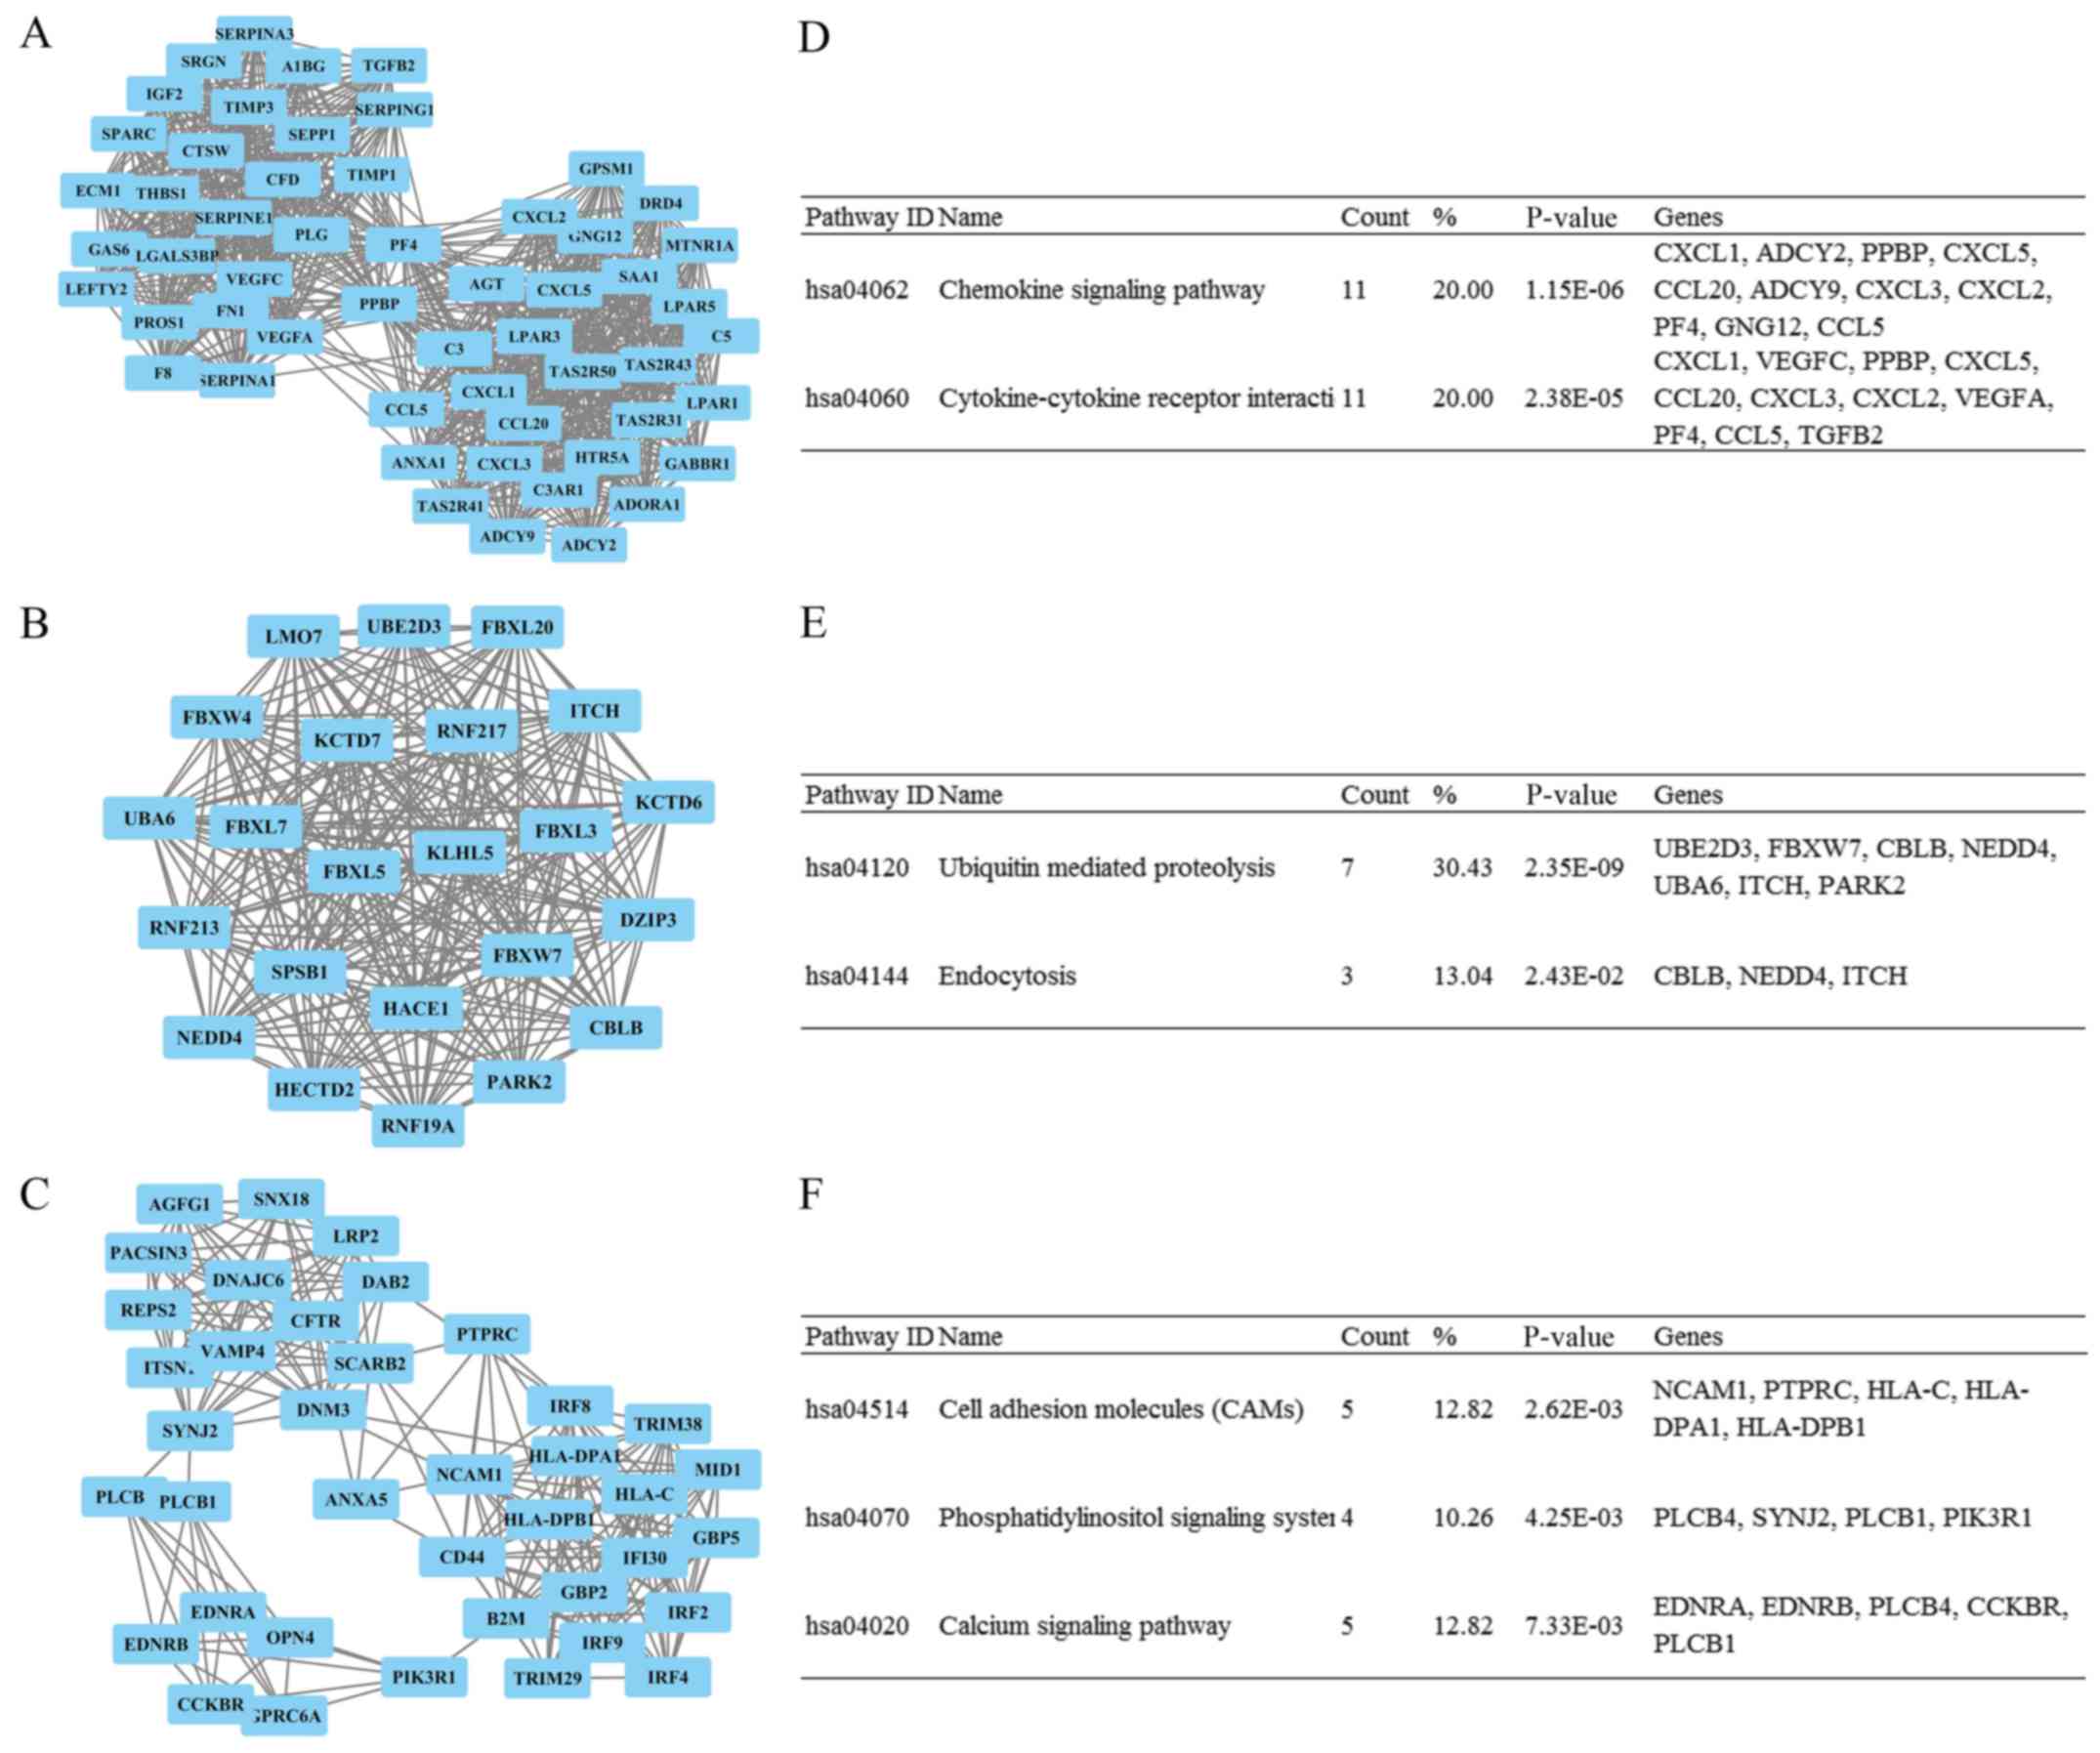
PPI network analysis
By submitting all DEmRNAs from sets A and B into
STRING, the PPI network was obtained (data not shown). Next, the
MCODE plug-in was used to analyze the results of STRING in
Cytoscape software. The 3 most significant modules were acquired;
the functions were mainly associated with 'cytokine-cytokine
receptor interaction', 'ubiquitin-mediated proteolysis' and 'cell
adhesion molecules (CAMs)' (Fig.
4). Moreover, a total of 20 genes were considered as hub genes
(Table II), among which AKT
serine/threonine kinase 2 (AKT2) obtained the highest value for
neighborhood connectivity, outdegree and closeness centrality. This
meant that AKT2 was the most important gene within the PPI network
and represented the closest connection with other genes in the
module (13).
| Table IIHub genes from Molecular Complex
Detection analysis. |
Table II
Hub genes from Molecular Complex
Detection analysis.
| Gene symbol | Neighborhood
connectivity | Outdegree | Closeness
centrality |
|---|
| MTNR1A | 42.20 | 12 |
3.23×10⁻¹ |
| SPSB1 | 30.65 | 8 |
2.93×10⁻¹ |
| CCKBR | 47.25 | 8 |
2.94×10⁻¹ |
| AKT2a | 57.50 | 34 |
3.54×10⁻¹ |
| GPX3 | 16.18 | 15 |
2.62×10⁻¹ |
| PTPN6 | 41.71 | 31 |
3.38×10⁻¹ |
| CLIC3 | 17.20 | 5 |
2.28×10⁻¹ |
|
TNFRSF19 | 10.00 | 6 |
2.56×10⁻¹ |
| IFT80 | 45.83 | 2 |
2.03×10⁻¹ |
| AMHR2 | 34.69 | 1 |
2.93×10⁻¹ |
| MAMLD1 | 41.00 | 8 |
2.96×10⁻¹ |
| DHRSX | 30.63 | 3 |
1.93×10⁻¹ |
| SLC47A1 | 5.00 | 1 | 1.00 |
| SLC30A4 | 3.75 | 0 | 0.00 |
| CYBRD1 | 19.33 | 1 | 1.00 |
| INTS6 | 14.67 | 0 | 0.00 |
| CLDN7 | 9.50 | 4 |
2.04×10⁻¹ |
| TNFSF12 | 56.67 | 9 |
2.93×10⁻¹ |
| DGKA | 21.50 | 3 |
3.13×10⁻¹ |
| HOMER2 | 27.13 | 2 |
2.49×10⁻¹ |
Co-expression network of
DEmRNA-DElncRNA
Based on microarray analysis, 39,304 lncRNAs were
detected. A total of 3,002 DElncRNAs (2,319 in DLD1/A2 vs. DLD1/C6;
683 in DLD1/SA4 vs. DLD1/CA6) were significantly differentially
expressed with a fold-change of ≥2.0. For further analysis,
DElncRNAs upregulated in DLD1/A2 vs. DLD1/C6 and downregulated in
DLD1/SA4 vs. DLD1/CA6 were selected, which meant that the
expression of DElncRNAs was positively associated with the
expression of ATP5J in the two cell pairs. The DElncRNAs that were
negatively associated with ATP5J in the two cell pairs were also
included. Certain DEmRNAs were selected according to the
aforementioned criteria. Therefore, 51 DEmRNAs and 30 DElncRNAs
were identified and listed in Tables
III and IV.
| Table IIISelected differentially expressed
mRNAs for co-expression network construction (n=51). |
Table III
Selected differentially expressed
mRNAs for co-expression network construction (n=51).
| Ensemble ID | Gene symbol | Log2FC
(A2 vs. C6) | log2FC
(SA4 vs. CA6) |
|---|
| Upregulation | | | |
|
ENST00000463422 | ATOH8 | 2.3664742 | −1.5749975 |
|
ENST00000308108 | CCNE2 | 1.0017490 | −1.0507374 |
|
ENST00000278385 | CD44 | 3.8303200 | −3.9564400 |
|
ENST00000298912 | CLMN | 1.2790971 | −1.2013025 |
|
ENST00000329882 | CSH1 | 1.2013025 | −2.2145548 |
|
ENST00000249749 | DLL4 | 1.4630564 | −1.3910798 |
|
ENST00000217182 | EEF1A2 | 3.5102847 | −2.7776937 |
|
ENST00000371021 | FRAT1 | 1.1014051 | −1.1662812 |
|
ENST00000435292 | GUCA1B | 1.7285424 | −1.9108304 |
|
ENST00000377791 |
HIST1H2AC | 1.0301589 | −2.0924091 |
|
ENST00000330062 | IDH2 | 1.3220385 | −2.0191135 |
|
ENST00000518982 | IL7 | 1.3051137 | −1.8685079 |
|
ENST00000268638 | IRF8 | 1.8297353 | −2.0302430 |
|
ENST00000378111 | KCNAB2 | 1.1377705 | −1.4946451 |
|
ENST00000394683 |
KIAA1199 | 1.0515032 | −1.0550995 |
|
ENST00000420981 |
MGC39372 | 1.2202988 | −1.6457891 |
|
ENST00000396217 | MYRIP | 1.9900737 | −1.2685270 |
|
ENST00000277541 | NOTCH1 | 2.4109862 | −1.5415106 |
|
ENST00000276124 | POF1B | 1.1683197 | −3.3742200 |
|
ENST00000313755 | PRODH | 1.1842122 | −1.4703089 |
|
ENST00000341901 | SBK1 | 1.1663734 | −1.3532438 |
|
ENST00000247182 | SIX1 | 1.7563076 | −1.2851509 |
|
ENST00000393062 | SPIRE2 | 1.3516588 | −1.1577921 |
|
ENST00000328526 | XKRX | 1.1844625 | −1.1355352 |
| Downregulation | | | |
|
ENST00000376726 | ACSS1 | −1.4264563 | 1.0032806 |
|
ENST00000374111 |
C10orf53 | −3.0494199 | 2.7619016 |
|
ENST00000397899 | C2orf55 | −1.0406728 | 1.8891068 |
|
ENST00000492730 | C4BPB | −1.8177981 | 1.7743891 |
|
ENST00000509979 | C5orf13 | −4.4611087 | 2.1796174 |
|
ENST00000503763 | CRHBP | −2.4869404 | 1.2709899 |
|
ENST00000227348 | CRTAM | −2.1076543 | 2.4206290 |
|
ENST00000450719 | CSHL1 | −1.2476245 | 1.3876114 |
|
ENST00000398402 | CST1 | −1.7663736 | 3.7468631 |
|
ENST00000304725 | CST2 | −3.1294575 | 4.1763420 |
|
ENST00000292414 | CYP3A7 | −1.5009923 | 2.0561150 |
|
ENST00000317811 | FJX1 | −1.1050119 | 1.2775639 |
|
ENST00000310357 | GPRC6A | −1.3399930 | 2.4899235 |
|
ENST00000393584 | GSTA5 | −1.7383062 | 1.0165440 |
|
ENST00000309446 | KLF7 | −1.5819120 | 1.1883107 |
|
ENST00000375827 | LY6G6D | −1.1885548 | 2.3284416 |
|
ENST00000427231 | NEB | −2.4703722 | 1.1157570 |
|
ENST00000319792 | PVRL3 | −4.1147676 | 2.2300897 |
|
ENST00000216392 | PYGL | −3.4774067 | 1.2769729 |
|
ENST00000405158 | SAA1 | −3.2550786 | 1.6204370 |
|
ENST00000414546 | SAA2 | −1.4848727 | 1.1160498 |
|
ENST00000051659 | SCML1 | −2.6339436 | 1.5956994 |
|
ENST00000486749 | SLC2A3 | −2.8174708 | 1.1550741 |
|
ENST00000358525 | SLC6A20 | −1.2244166 | 1.4633511 |
|
ENST00000338380 | SLPI | −1.9716522 | 3.2052798 |
|
ENST00000394511 | UGT8 | −4.2315920 | 1.8874178 |
| Table IVSelected differentially expressed
long non-coding RNAs for co-expression network construction
(n=30). |
Table IV
Selected differentially expressed
long non-coding RNAs for co-expression network construction
(n=30).
| Ensemble gene
ID | Gene symbol | log2FC (A2 vs.
C6) | log2FC (SA4 vs.
CA6) |
|---|
| Upregulation | | | |
|
ENSG00000026508 | CD44 | 5.7112436 | −4.6520596 |
|
ENSG00000248690 |
HAS2-AS1 | 1.5613460 | −1.3604736 |
|
ENSG00000104432 | IL7 | 1.2327710 | −2.0651786 |
|
ENSG00000242887 | IGHJ3 | 1.1636353 | −1.1661916 |
|
ENSG00000227372 |
TP73-AS1 | 1.1705691 | −1.1062335 |
|
ENSG00000237807 |
RP11-400K9.4 | 1.0098063 | −1.4481292 |
|
ENSG00000227357 |
HLA-DRB4 | 1.0012778 | −1.1985005 |
|
ENSG00000212999 |
AC117834.1 | 1.2642217 | −1.2010332 |
|
ENSG00000170011 | MYRIP | 1.9657596 | −1.1791620 |
|
ENSG00000174562 | KLK15 | 1.7544044 | −1.0959578 |
|
ENSG00000140968 | IRF8 | 2.0519360 | −1.8488283 |
| Downregulation | | | |
|
ENSG00000100181 | TPTEP1 | −1.1547785 | 1.0562963 |
|
ENSG00000256124 |
RP11-84E24.3 | −1.0987811 | 1.4957023 |
|
ENSG00000255071 |
SAA2-SAA4 | −2.9303002 | 1.6360683 |
|
ENSG00000080823 | MOK | −1.2133837 | 1.0177355 |
|
ENSG00000253668 |
RP11-463C14.1 | −3.7030535 | 2.1768303 |
|
ENSG00000151612 | ZNF827 | −1.9309711 | 1.2170410 |
|
ENSG00000225383 | SFTA1P | −1.1355629 | 1.3586316 |
|
ENSG00000229791 |
LINC00420 | −1.6585293 | 1.3905687 |
|
ENSG00000236654 |
AC079780.3 | −4.6469680 | 1.8889217 |
|
ENSG00000254148 |
RP11-84E24.2 | −2.1362443 | 1.6749586 |
|
ENSG00000102098 | SCML2 | −1.3423405 | 1.0036592 |
|
ENSG00000229807 | XIST | −2.4771900 | 1.0491910 |
|
ENSG00000173432 | SAA1 | −1.9162921 | 1.2718056 |
|
ENSG00000212232 | SNORD17 | −1.2717161 | 1.0156708 |
|
ENSG00000206402 | LY6G6D | −1.5264271 | 2.9315690 |
|
ENSG00000071575 | TRIB2 | −1.3852354 | 1.0461107 |
|
ENSG00000138735 | PDE5A | −1.5525875 | 1.1479750 |
|
ENSG00000183531 |
Z98256.1 | −2.9538560 | 2.0470590 |
|
ENSG00000174607 | UGT8 | −3.3867934 | 2.0097785 |
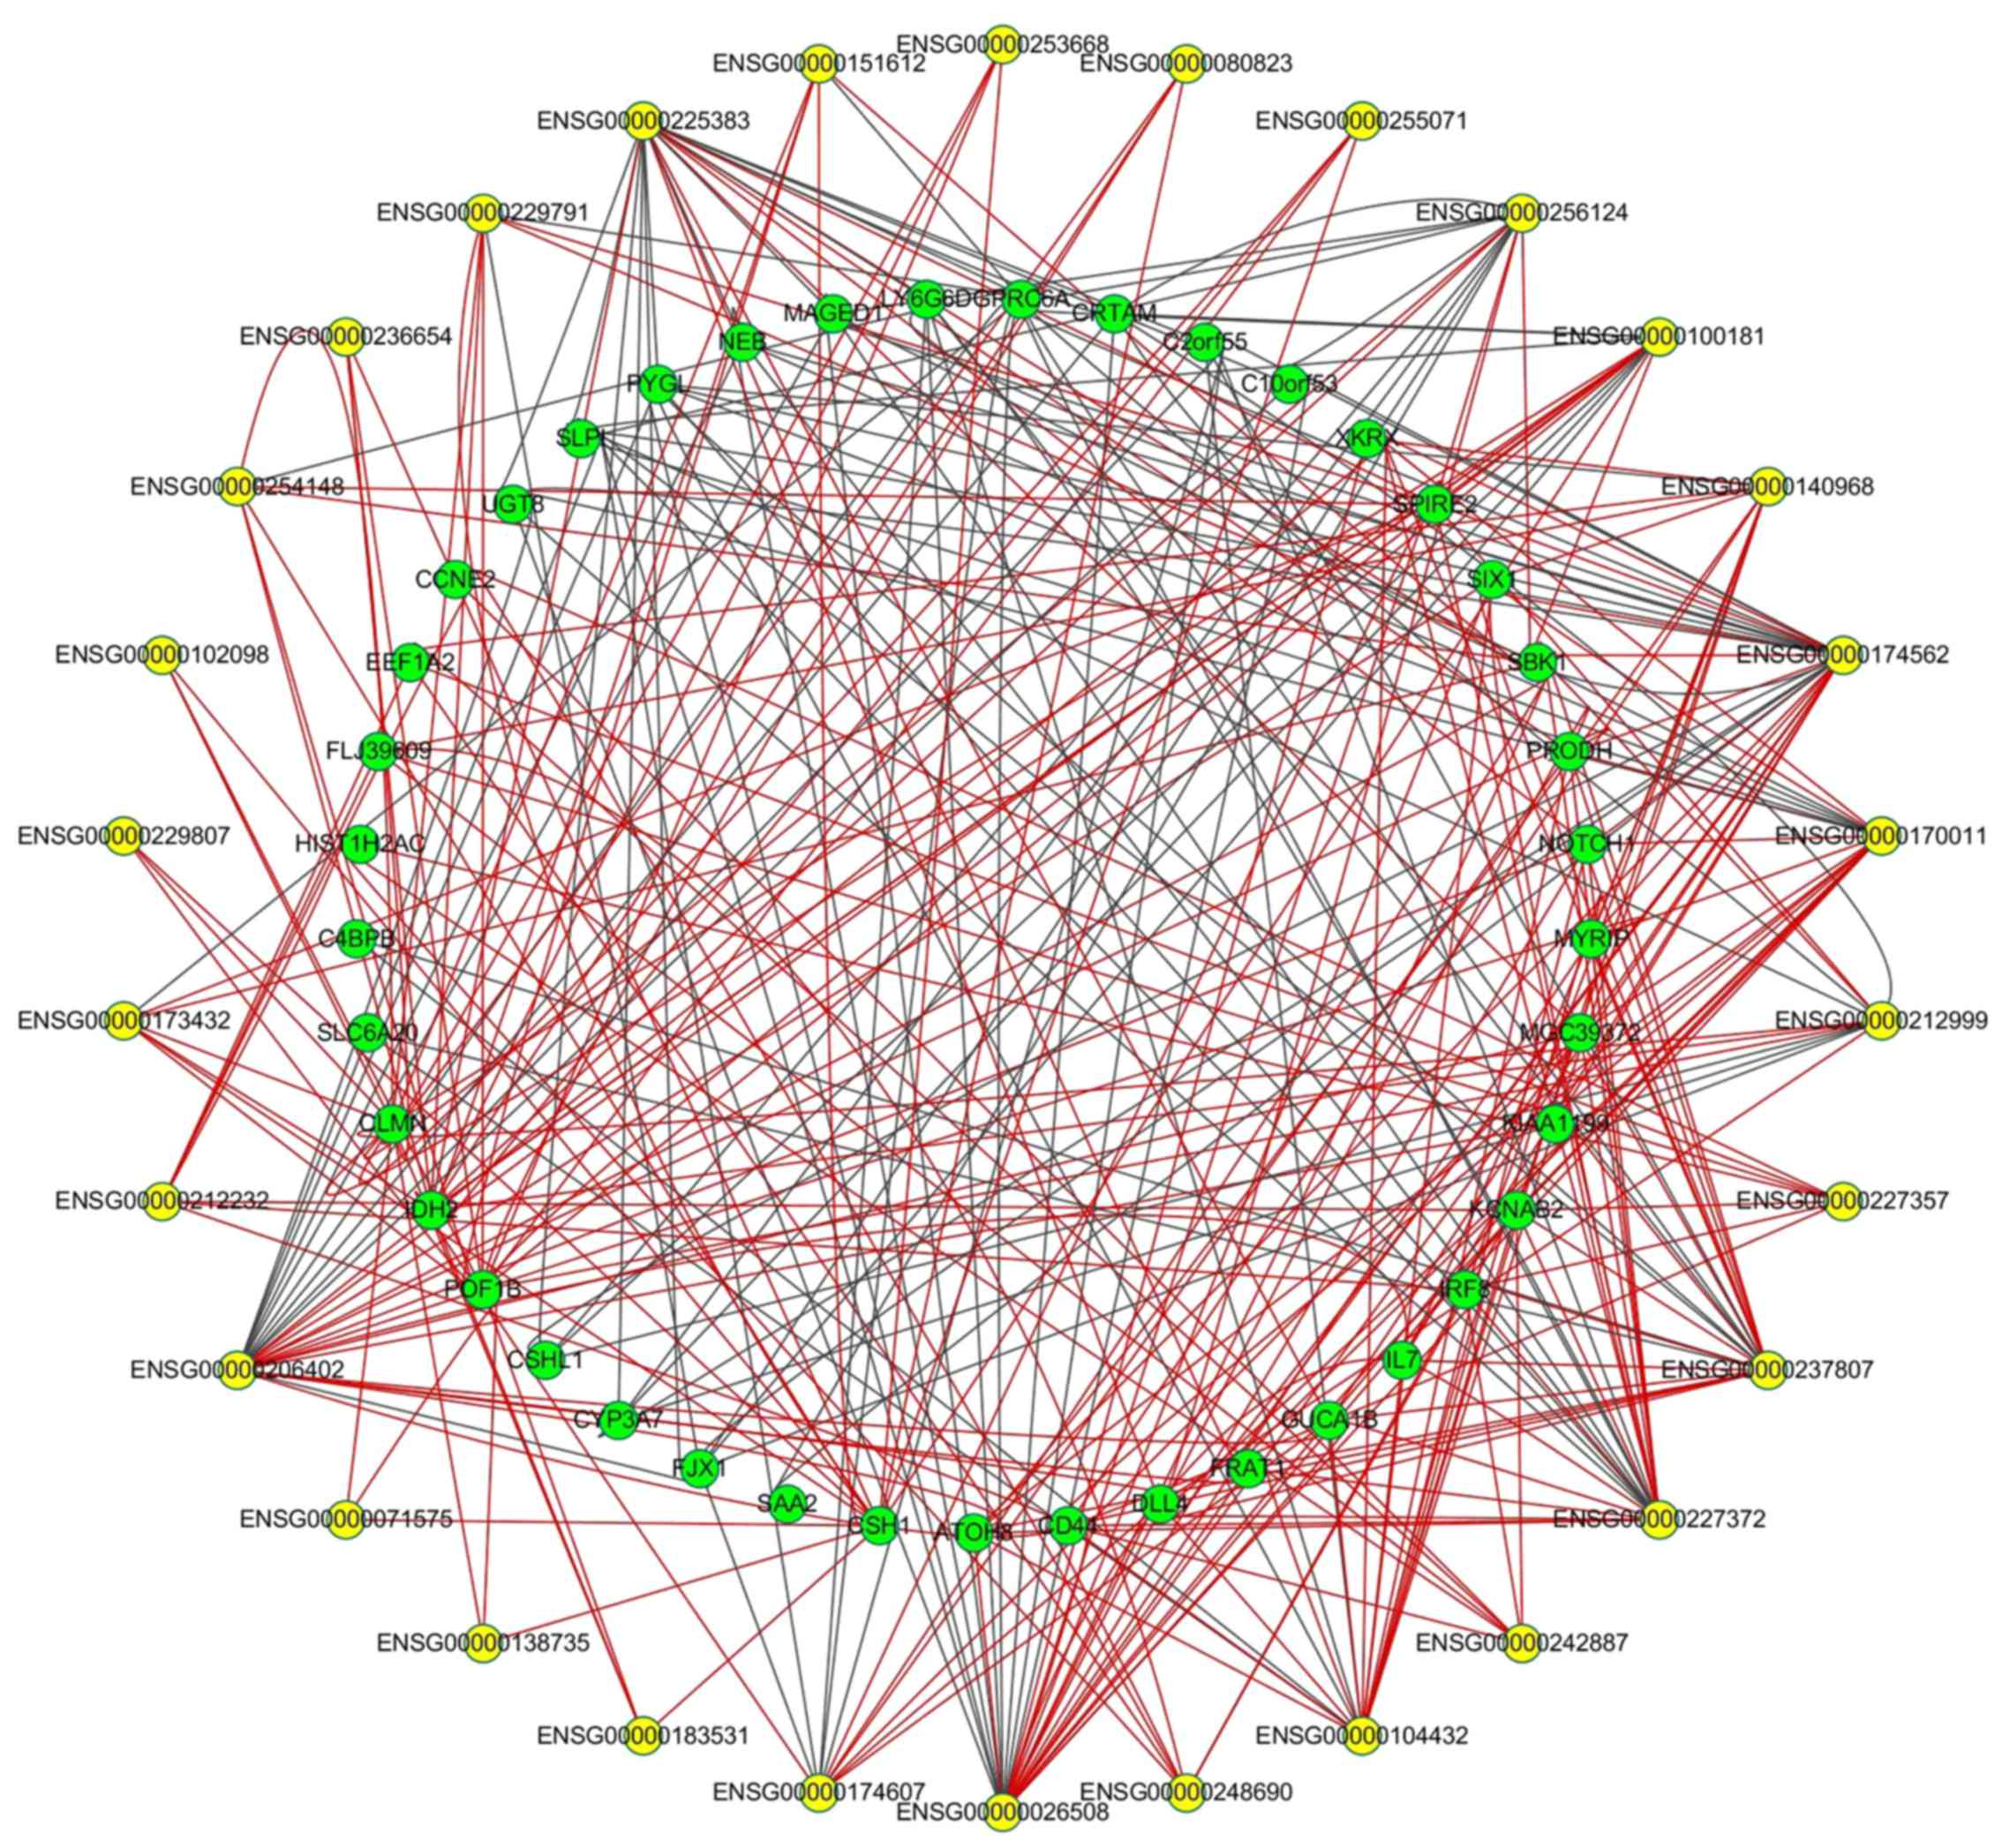
To further investigate the potential association
between DEmRNAs and DElncRNAs, PCC was calculated according to the
expression levels of 51 DEmRNAs and 30 DElncRNAs. Using |PCC|
≥0.90, 343 DEmRNA/DElncRNA pairs were used to construct the
co-expression network, including 239 pairs exhibiting positive
correlation. The network is shown in Fig. 5. The pair of premature ovarian
failure 1B (POF1B) and ENSG00000236654 presented the most
significant positive correlation coefficiency, while the most
marked negative correlation coefficiency was found in the pair of
glycogen phosphorylase L and ENSG00000170011. One DElncRNA may
target multiple DEmRNAs; for example, XIST was associated with
POF1B, chorionic somatomammotropin hormone 1 (CSH1) and
calmin (CLMN), leading to multiple signaling pathways or
mechanisms.
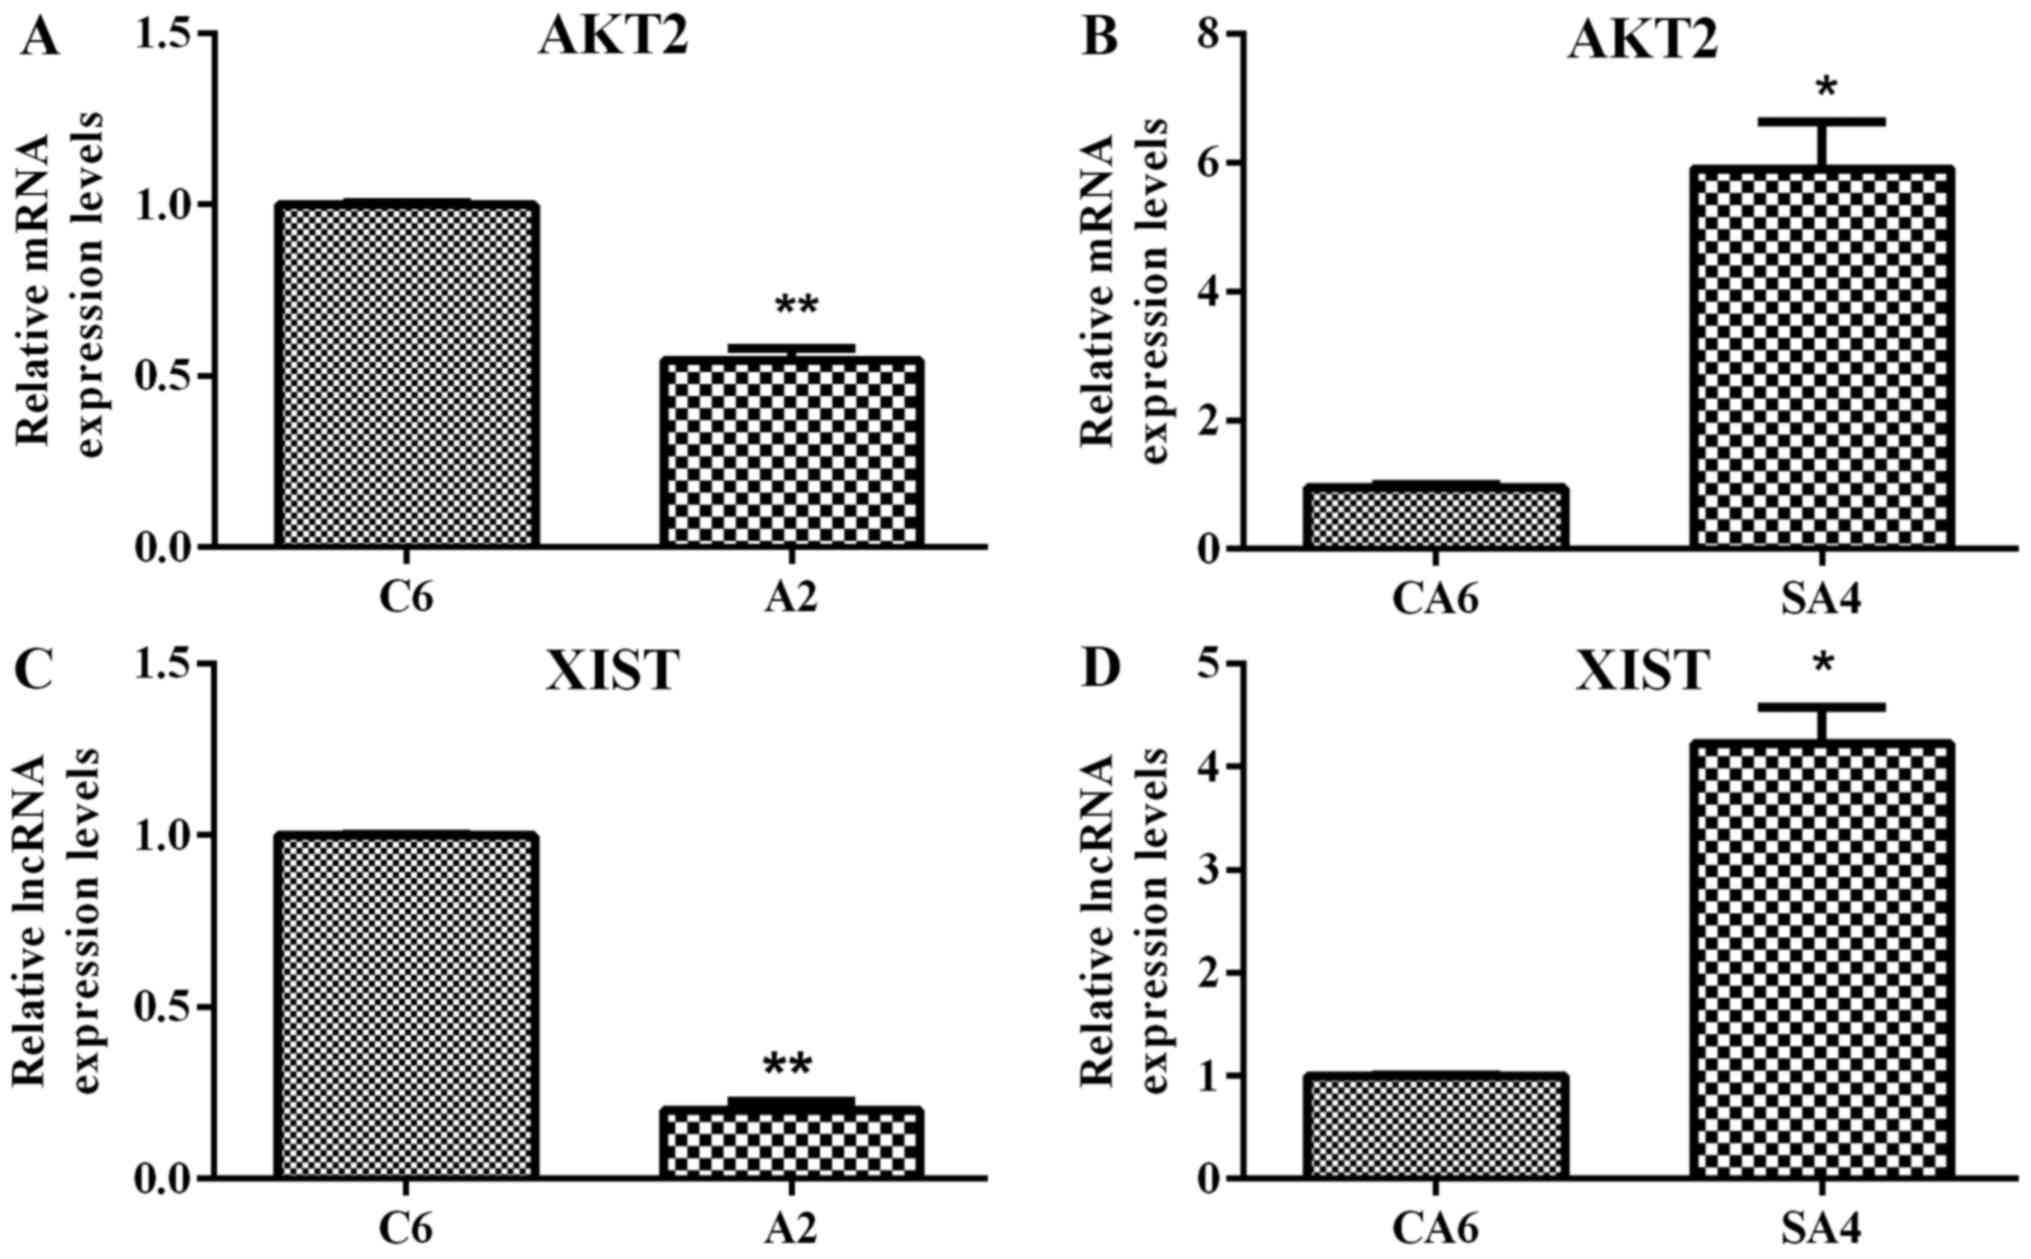
RT-qPCR validation of hub genes and
DElncRNA
RT-qPCR was used to validate AKT2 and
XIST. As shown in Fig. 6,
AKT2 and XIST were downregulated in DLD1/A2 vs.
DLD1/C6 (P<0.01) and upregulated in DLD1/SA4 vs. DLD1/CA6
(P<0.05). In general, the validation results were consistent
with the microarray data.
Discussion
ATP5J has been associated with several cancer
types, including diffuse large B-cell lymphoma renal carcinoma and
hepatocellular carcinoma (10,11,14).
Furthermore, our previous study confirmed that ATP5J is associated
with CRC cell migration and 5-fluorouracil resistance. The present
study further investigated the molecular mechanism and potential
key genes interacting with ATP5J in CRC via microarray and
bioinformatics analyses.
The mRNAs from set A, which were differentially
expressed in the upregulation of ATP5J, were mainly enriched
in the GO terms of 'extracellular matrix organization', 'cell
adhesion', 'positive regulation of gene expression' and 'regulation
of cell growth'. These biological processes are essential for tumor
cell survival and growth. Emerging data have confirmed the crucial
role of the extracellular matrix in tumor metastasis (15,16).
Changes in the content of the extracellular matrix may influence
tumor cell properties, including proliferation and motility
(17). Moreover, the primary
enriched GO terms of set B contained enzyme regulation ('regulation
of transcription from RNA polymerase II promoter') and biological
responses ('immune response' and 'inflammatory response'). It is
widely accepted that a causal association exists between
inflammation, immunity and cancer (18). Human immunity responses, such as
immune surveillance, are part of an innate and efficient
antineoplastic system. Therefore, it could be concluded that the
upregulation of ATP5J may affect cell migration and 5-FU
sensitivity by influencing the biological processes of the
intracellular and extracellular environment, thus promoting cell
growth; its downregulation may operate by regulating immune and
inflammatory responses. The KEGG pathways of set A were enriched
primarily in tumor-related processes, including the
phosphoinositide 3-kinase-protein kinase B signaling pathway, the
tumor necrosis factor (TNF) signaling pathway and the Janus
kinase-signal transducer and activator of transcription signaling
pathway (19,20).
According to PPI network analysis, several
biomarkers were identified. Some of these genes are associated with
CRC biological behavior, including AKT2, TNF receptor
superfamily member 19, claudin 7, cholecystokinin B receptor,
glutathione peroxidase 3 and homer scaffolding protein 2.
AKT2, one of the most significantly meaningful genes, has
been shown to be essential in several cellular pathways involved in
cell proliferation, metastasis and drug resistance (21). Overexpression of AKT2 has been
detected in breast, ovarian and colon cancer (22,23).
Previous studies have investigated the role of AKT2 in CRC via the
construction of cell and animal models. The results showed that
AKT2 deficiency may decrease the metastatic ability of CRC cells in
mice (24). In addition, an
shRNA-mediated AKT2-knockdown system has been shown to decrease
cell survival and proliferation in primary tumors (25). Furthermore, low AKT2 expression in
HCT116 cells has been shown to be correlated with increased
chemosensitivity to paclitaxel (26). Taken together, the regulation of
AKT2 may be a critical process for ATP5J exerting an effect on CRC
cell biological functions.
Numerous studies have confirmed the association
between lncRNAs and tumors. Previous studies have indicated that
lncRNAs could have an important regulatory role in gene expression
and are associated with cancer development (27). In the present study, microarray
analysis was performed for lncRNAs. From the lncRNA expression
profiles, DElncRNAs meeting the criteria were selected for further
analysis. According to the results, TP73-AS1,
HAS2-AS1, SFTA1P and XIST were highlighted and
have been previously associated with the development and
progression of certain cancer types, including hepatocellular
carcinoma and oral squamous cell carcinoma (28–30).
Among them, XIST was the only lncRNA that has been
previously investigated in CRC (31). XIST, located in the X
chromosome, was one of the first lncRNAs to be found that was
involved in the progression of cancer, including non-small cell
lung cancer and human glioblastoma (32,33).
Certain studies have found the mechanism of XIST in several
cancer types; for example, the lncRNA XIST has been shown to
promote the malignancy of esophageal squamous cell carcinoma
through the modulation of miR-101/enhancer of zeste homolog 2
(34). In addition, by regulating
miR-186-5p, XIST controls cell proliferation and invasion in
non-small cell lung cancer (35).
Moreover, significantly high XIST expression has been found
in CRC tumor tissues compared with that in paired adjacent normal
tissues (36). High-level
expression of XIST could predict poor disease-free survival times
in CRC patients. Moreover, XIST is considered to be an
oncogene that could promote cell proliferation through the
miR-132-3p/mitogen-activated protein kinase 1 axis (31).
To further elucidate the potential functions of
lncRNAs and find out their target genes in the cell pairs of the
present study, a co-expression network of DEmRNA/DElncRNA was
constructed. XIST was associated with 3 mRNAs (POF1B,
CSH1 and CLMN). The gene encoding POF1B was critical
for ovarian function (37).
However, its impact was also confirmed in the regulation of cell
adhesion in human intestinal cell lines (38). CLMN has been shown to regulate the
cell cycle in a report involving neuroblastoma cells (39). Therefore, we hypothesized that the
co-repression of XIST and POF1B and CLMN was involved in the
molecular mechanisms of ATP5J in CRC cells, which will be confirmed
by further cell line experiments in future studies.
In conclusion, the present study determined the
expression profiles of mRNAs and lncRNAs in CRC cells
overexpressing/underexpressing ATP5J. According to bioinformatics
analyses, AKT2 and XIST expression was identified as
a potential biomarker participating in the effect of ATP5J in CRC,
which in turn was associated with cell migration and 5-FU
resistance. Further research is necessary to confirm this
hypothesis.
Acknowledgments
This study represents partial fulfillment of the
requirements for a Master degree for Dr Bingjun Bai.
Notes
[1]
Funding
This study was supported by the National Natural
Science Foundation of China (grant no. 81272681) and the Medical
and Health Science and Technology Foundation of Zhejiang Province
(grant no. 2017 KY593).
[2] Availability
of data and materials
The datasets analyzed during the current study are
not publicly available as they will be used in our further studies,
but they are available from the corresponding author on reasonable
request.
[3] Authors'
contributions
Guarantor of integrity of entire study: BJB, BBX,
ZYP and HBZ. Study concepts: BJB, BBX, ZYP and HBZ. Study design:
BJB, BBX, ZYP and HBZ. Data acquisition: LNS and ZJP. Data
analysis/interpretation: LNS and ZJP. Statistical analysis: BJB,
BBX, ZYP and HBZ. Manuscript preparation: LNS and ZJP. Manuscript
revision/review: BJB, BBX, ZYP and HBZ. Manuscript final version
approval: BJB, BBX, ZYP and HBZ.
[4] Ethics
approval and consent to participate
Not applicable.
[5] Consent for
publication
Not applicable.
[6] Conflicts of
interest
All authors listed in the manuscript agree on the
content of the and this submission. The authors declare no conflict
of interest.
References
|
1
|
Chau I and Cunningham D: Chemotherapy in
colorectal cancer: New options and new challenges. Br Med Bull.
64:159–180. 2002. View Article : Google Scholar : PubMed/NCBI
|
|
2
|
Shao YC, Chang YY, Lin JK, Lin CC, Wang
HS, Yang SH, Jiang JK, Lan YT, Lin TC, Li AF, et al: Neoadjuvant
chemotherapy can improve outcome of colorectal cancer patients with
unresectable metastasis. Int J Colorectal Dis. 28:1359–1365. 2013.
View Article : Google Scholar : PubMed/NCBI
|
|
3
|
Liu HY and Zhang CJ: Identification of
differentially expressed genes and their upstream regulators in
colorectal cancer. Cancer Gene Ther. 24:244–250. 2017. View Article : Google Scholar : PubMed/NCBI
|
|
4
|
Pedersen PL: Bioenergetics of cancer cells
- A brief orientation to this minireview series. J Bioenerg
Biomembr. 29:301–302. 1997. View Article : Google Scholar
|
|
5
|
Cuezva JM, Krajewska M, de Heredia ML,
Krajewski S, Santamaría G, Kim H, Zapata JM, Marusawa H, Chamorro M
and Reed JC: The bioenergetic signature of cancer: A marker of
tumor progression. Cancer Res. 62:6674–6681. 2002.PubMed/NCBI
|
|
6
|
Shin YK, Yoo BC, Chang HJ, Jeon E, Hong
SH, Jung MS, Lim SJ and Park JG: Down-regulation of mitochondrial
F1F0-ATP synthase in human colon cancer cells with induced
5-fluorouracil resistance. Cancer Res. 65:3162–3170. 2005.
View Article : Google Scholar : PubMed/NCBI
|
|
7
|
Collinson IR, van Raaij MJ, Runswick MJ,
Fearnley IM, Skehel JM, Orriss GL, Miroux B and Walker JE: ATP
synthase from bovine heart mitochondria. In vitro assembly of a
stalk complex in the presence of F1-ATPase and in its absence. J
Mol Biol. 242:408–421. 1994.PubMed/NCBI
|
|
8
|
Joshi S and Pringle MJ: ATP synthase
complex from bovine heart mitochondria. Passive H+
conduction through mitochondrial coupling factor 6-depleted F0
complexes. J Biol Chem. 264:15548–15551. 1989.PubMed/NCBI
|
|
9
|
Zhu H, Chen L, Zhou W, Huang Z, Hu J, Dai
S, Wang X, Huang X and He C: Over-expression of the ATP5J gene
correlates with cell migration and 5-fluorouracil sensitivity in
colorectal cancer. PLoS One. 8:e768462013. View Article : Google Scholar : PubMed/NCBI
|
|
10
|
Yang W, Lu Y, Xu Y, Xu L, Zheng W, Wu Y,
Li L and Shen P: Estrogen represses hepatocellular carcinoma (HCC)
growth via inhibiting alternative activation of tumor-associated
macrophages (TAMs). J Biol Chem. 287:40140–40149. 2012. View Article : Google Scholar : PubMed/NCBI
|
|
11
|
Bjerregaard H, Pedersen S, Kristensen SR
and Marcussen N: Reference genes for gene expression analysis by
real-time reverse transcription polymerase chain reaction of renal
cell carcinoma. Diagn Mol Pathol. 20:212–217. 2011. View Article : Google Scholar : PubMed/NCBI
|
|
12
|
Livak KJ and Schmittgen TD: Analysis of
relative gene expression data using real-time quantitative PCR and
the 2(−Delta Delta C(T)) method. Methods. 25:402–408. 2001.
View Article : Google Scholar
|
|
13
|
Carson MB and Lu H: Network-based
prediction and knowledge mining of disease genes. BMC Med Genomics.
8(Suppl 2): S92015. View Article : Google Scholar : PubMed/NCBI
|
|
14
|
Zamani-Ahmadmahmudi M, Najafi A and
Nassiri SM: Reconstruction of canine diffuse large B-cell lymphoma
gene regulatory network: Detection of functional modules and hub
genes. J Comp Pathol. 152:119–130. 2015. View Article : Google Scholar : PubMed/NCBI
|
|
15
|
Lu P, Weaver VM and Werb Z: The
extracellular matrix: A dynamic niche in cancer progression. J Cell
Biol. 196:395–406. 2012. View Article : Google Scholar : PubMed/NCBI
|
|
16
|
Hynes RO: The extracellular matrix: Not
just pretty fibrils. Science. 326:1216–1219. 2009. View Article : Google Scholar : PubMed/NCBI
|
|
17
|
Gilkes DM, Semenza GL and Wirtz D: Hypoxia
and the extracellular matrix: Drivers of tumour metastasis. Nat Rev
Cancer. 14:430–439. 2014. View
Article : Google Scholar : PubMed/NCBI
|
|
18
|
Coussens LM and Werb Z: Inflammation and
cancer. Nature. 420:860–867. 2002. View Article : Google Scholar : PubMed/NCBI
|
|
19
|
Martini M, De Santis MC, Braccini L,
Gulluni F and Hirsch E: PI3K/AKT signaling pathway and cancer: An
updated review. Ann Med. 46:372–383. 2014. View Article : Google Scholar : PubMed/NCBI
|
|
20
|
Groner B and von Manstein V: Jak Stat
signaling and cancer: Opportunities, benefits and side effects of
targeted inhibition. Mol Cell Endocrinol. 451:1–14. 2017.
View Article : Google Scholar : PubMed/NCBI
|
|
21
|
Cheung M and Testa JR: Diverse mechanisms
of AKT pathway activation in human malignancy. Curr Cancer Drug
Targets. 13:234–244. 2013. View Article : Google Scholar : PubMed/NCBI
|
|
22
|
Agarwal E, Brattain MG and Chowdhury S:
Cell survival and metastasis regulation by Akt signaling in
colorectal cancer. Cell Signal. 25:1711–1719. 2013. View Article : Google Scholar : PubMed/NCBI
|
|
23
|
Chau NM and Ashcroft M: Akt2: A role in
breast cancer metastasis. Breast Cancer Res. 6:55–57. 2004.
View Article : Google Scholar :
|
|
24
|
Rychahou PG, Kang J, Gulhati P, Doan HQ,
Chen LA, Xiao SY, Chung DH and Evers BM: Akt2 overexpression plays
a critical role in the establishment of colorectal cancer
metastasis. Proc Natl Acad Sci USA. 105:20315–20320. 2008.
View Article : Google Scholar : PubMed/NCBI
|
|
25
|
Agarwal E, Robb CM, Smith LM, Brattain MG,
Wang J, Black JD and Chowdhury S: Role of Akt2 in regulation of
metastasis suppressor 1 expression and colorectal cancer
metastasis. Oncogene. 36:3104–3118. 2017. View Article : Google Scholar : PubMed/NCBI
|
|
26
|
Ding Z, Xu F, Li G, Tang J, Tang Z, Jiang
P and Wu H: Knockdown of Akt2 expression by shRNA inhibits
proliferation, enhances apoptosis, and increases chemosensitivity
to paclitaxel in human colorectal cancer cells. Cell Biochem
Biophys. 71:383–388. 2015. View Article : Google Scholar
|
|
27
|
Prensner JR and Chinnaiyan AM: The
emergence of lncRNAs in cancer biology. Cancer Discov. 1:391–407.
2011. View Article : Google Scholar : PubMed/NCBI
|
|
28
|
Li S, Huang Y, Huang Y, Fu Y, Tang D, Kang
R, Zhou R and Fan XG: The long non-coding RNA TP73-AS1 modulates
HCC cell proliferation through miR-200a-dependent HMGB1/RAGE
regulation. J Exp Clin Cancer Res. 36:512017. View Article : Google Scholar : PubMed/NCBI
|
|
29
|
Zhu G, Wang S, Chen J, Wang Z, Liang X,
Wang X, Jiang J, Lang J and Li L: Long noncoding RNA HAS2-AS1
mediates hypoxia-induced invasiveness of oral squamous cell
carcinoma. Mol Carcinog. 56:2210–2222. 2017. View Article : Google Scholar : PubMed/NCBI
|
|
30
|
Zhang H, Xiong Y, Xia R, Wei C, Shi X and
Nie F: The pseudogene-derived long noncoding RNA SFTA1P is
downregulated and suppresses cell migration and invasion in lung
adenocarcinoma. Tumour Biol. 39:10104283176914182017.
|
|
31
|
Song H, He P, Shao T, Li Y, Li J and Zhang
Y: Long non-coding RNA XIST functions as an oncogene in human
colorectal cancer by targeting miR-132-3p. J BUON. 22:696–703.
2017.PubMed/NCBI
|
|
32
|
Fang J, Sun CC and Gong C: Long noncoding
RNA XIST acts as an oncogene in non-small cell lung cancer by
epigenetically repressing KLF2 expression. Biochem Biophys Res
Commun. 478:811–817. 2016. View Article : Google Scholar : PubMed/NCBI
|
|
33
|
Yao Y, Ma J, Xue Y, Wang P, Li Z, Liu J,
Chen L, Xi Z, Teng H, Wang Z, et al: Knockdown of long non-coding
RNA XIST exerts tumor-suppressive functions in human glioblastoma
stem cells by up-regulating miR-152. Cancer Lett. 359:75–86. 2015.
View Article : Google Scholar : PubMed/NCBI
|
|
34
|
Wu X, Dinglin X, Wang X, Luo W, Shen Q, Li
Y, Gu L, Zhou Q, Zhu H, Li Y, et al: Long noncoding RNA XIST
promotes malignancies of esophageal squamous cell carcinoma via
regulation of miR-101/EZH2. Oncotarget. 8:76015–76028.
2017.PubMed/NCBI
|
|
35
|
Wang H, Shen Q, Zhang X, Yang C, Cui S,
Sun Y, Wang L, Fan X and Xu S: The long non-coding RNA XIST
controls non-small cell lung cancer proliferation and invasion by
modulating miR-186-5p. Cell Physiol Biochem. 41:2221–2229. 2017.
View Article : Google Scholar : PubMed/NCBI
|
|
36
|
Kara M, Yumrutas O, Ozcan O, Celik OI,
Bozgeyik E, Bozgeyik I and Tasdemir S: Differential expressions of
cancer-associated genes and their regulatory miRNAs in colorectal
carcinoma. Gene. 567:81–86. 2015. View Article : Google Scholar : PubMed/NCBI
|
|
37
|
Bione S, Rizzolio F, Sala C, Ricotti R,
Goegan M, Manzini MC, Battaglia R, Marozzi A, Vegetti W, Dalprà L,
et al: Mutation analysis of two candidate genes for premature
ovarian failure, DACH2 and POF1B. Hum Reprod. 19:2759–2766. 2004.
View Article : Google Scholar : PubMed/NCBI
|
|
38
|
Crespi A, Bertoni A, Ferrari I, Padovano
V, Della Mina P, Berti E, Villa A and Pietrini G: POF1B localizes
to desmosomes and regulates cell adhesion in human intestinal and
keratinocyte cell lines. J Invest Dermatol. 135:192–201. 2015.
View Article : Google Scholar
|
|
39
|
Marzinke MA and Clagett-Dame M: The
all-trans retinoic acid (atRA)-regulated gene Calmin (Clmn)
regulates cell cycle exit and neurite outgrowth in murine
neuroblastoma (Neuro2a) cells. Exp Cell Res. 318:85–93. 2012.
View Article : Google Scholar
|