Introduction
Gliomas are the most common type of primary brain
tumor in adults; malignant glioma in the brain mainly is referred
to as astrocytoma [World Health Organization (WHO) III] and
glioblastoma (GBM; WHO IV) (1).
Despite the optimal treatments available, the 5-year relative
survival rate is only 4.7% for patients with GBM and 25.9% for
patients with astrocytoma, which is less than the rates associated
with other types of glioma (2).
One of the most likely explanations for the low survival rate and
high levels of recurrence in malignant astrocytoma (MA) may be its
diffuse infiltrative nature (1).
Therefore, gaining a greater understanding of the molecular
mechanisms underlying the invasive phenotypes of MA is crucial for
the development of novel treatment strategies for MA.
To date, a number of modern technologies have been
developed that have provided new opportunities for the
identification of novel strategies and biomarkers for cancer
diagnosis, therapies and prognosis (3). Bioinformatics, including nucleic acid
sequence analysis, protein sequence analysis and genomics, can be
used to collect, process, store, classify, analyze and interpret
biological information through the application of mathematics and
computer technology. For example, when combined with microarray
technology, bioinformatics analysis can identify the connection
between meaningful molecular interactions and evaluate the
associated signaling pathways (4).
In the present study, high-throughput data were
down-loaded from online databases, which were then analyzed through
bioinformatics methods using R language, Database for Annotation,
Visualization, and Integrated Discovery (DAVID), STRING and
Cytoscape software. Survival analysis was then performed using
public statistical data in order to identify the malignant
progression-associated biomarkers of MA. Additional experimental
approaches were also performed in order to validate these
results.
In this study, the collagen type I α1
(COL1A1) gene was identified as a invasion-related gene from
bioinformatics analysis. The α1 chain of type I collagen, encoded
by the COL1A1 gene, the major extracellular matrix (ECM)
component, has been reported in multiple types of cancer, including
GBM (5,6) and has been reported to be involved in
multiple biological behaviors, including cell proliferation,
invasion, metastasis and angiogenesis (7,8). In
this study, using bioinformatics intervention, we made a firm
confirmation of the high level of expression of COL1A1 in MA, which
may have an impact on the survival rate of patients.
Materials and methods
Microarray data
Gene Expression Omnibus (GEO; http://www.ncbi.nlm.nih.gov/geo) is a public
repository for data storage, such as microarray and next-generation
sequencing, which is open access and freely available. The GSE4290,
GSE15824 and GSE19728 datasets were used to download expression
data, including different grades (WHO) of astrocytoma and normal
brain data. In the present study, the platform used to collect the
microarray data was all based on the GPL570 [HG-U133_Plus_2]
Affymetrix Human Genome U133 Plus 2.0 Array (9). In the GSE4290 data series, there were
23 samples from patients with epilepsy, which were used as
non-tumor samples in the present study, and 26 astrocytoma and 81
GBM samples, which were used as the tumor samples (10). The GSE15824 series included 19
frozen human glioma tissue samples and 2 normal brain samples that
were obtained during surgery, which were processed according to the
guidelines of the Ethics Committee of the University Hospitals of
Basel (11). The GSE19728 series
comprised total RNA that was isolated from 17 patient tumor tissues
and 4 pooled samples of normal tissue (12).
Data processing and identification of
differentially expressed genes (DEGs)
R is a well-designed open source language that is
essential for data analysis and visualization. The R-based packages
provide a broad range of statistical and graphical techniques
(13). The above probe-level data
(.cel files) were processed using R language, which included the
use of affy package, an R package for the analysis of
oligonucleotide arrays manufactured by Affymetrix; Thermo Fisher
Scientific, Inc. (Waltham, MA, USA) (9), and the MAS5 algorithm, a well-known
pre-processing technique (14). To
analyze the upregulated DEGs between the high-grade glioma and
normal brain groups in each microarray dataset, a classical t-test
with a cut-off criterion of P<0.05 and a fold control (FC) of
≥2.0 were used. To evaluate the different interactions between the
upregulated DEGs, Venny's online software (http://bioinfogp.cnb.csic.es/tools/venny/index.html)
was used to draw Venn diagrams. Furthermore, where necessary, the
present study used the GeneChip® Human Genome U133 Plus
2.0 Array (http://www.affymetrix.com/estore/index.jsp) to
generate the gene expression profiling datasets annotated from the
raw data.
Gene Ontology (GO) and Kyoto Encyclopedia
of Genes and Genomes (KEGG) pathway enrichment analysis of
DEGs
GO is an updated, comprehensive, major
bioinformatics system that facilitates high-quality functional gene
annotation for all species (15,16).
KEGG (http://www.genome.jp/) is an online
encyclopedia of genes and genomes that provides information
associated with genomes, metabolism, biological pathways, diseases
and chemical substances (17).
DAVID (http://www.david.niaid.nih.gov) is an
online platform that provides query-based access. It integrates
biologically rich information from large datasets and displays
graphic summaries of functional information (18). The present study uploaded the DEGs
to DAVID and used the functional annotation tool to perform GO and
KEGG pathway enrichment analysis (P<0.01).
Integration of protein-protein
interaction (PPI) network and module analysis
The STRING database (http://string-db.org) is an online network that
critically assesses protein-protein, direct (physical) or indirect
(functional), interactions (19).
The present study input the DEGs on STRING in order to obtain the
PPI network from it (medium confidence: 0.400). Subsequently, the
PPI network was constructed using Cytoscape software (http://www.cytoscape.org). Cytoscape is a type of
software environment for visualizing molecular interaction networks
and biological pathways, with annotations, gene expression profiles
and other datasets (20). The
present study used 3 plugins of Cytoscape; MCODE, ClueGo and
CluePedia. MCODE is a Cytoscape application that clusters a given
network based on topology in order to produce highly interconnected
subgraphs of molecular complexes and parts of pathways (21). ClueGO is a Cytoscape plug-in that
can divide large clusters of genes into functional groups based on
GO, KEGG, Wiki Pathways and Reactome (22). CluePedia is a ClueGO plugin that
can integrate information regarding genes, proteins and microRNAs
into a network with ClueGO terms/pathways (23).
In the present study, MCODE was used to create
clusters. The main parameters were as follows: Fluff; Degree Cutoff
= 2; Node Density Cutoff = 0.1; node score cutoff = 0.2; K-Core =
2; and Maximum Depth = 100. Subsequently, the ClueGo and Cluepedia
plug-ins were used in combination to analyze the clusters and
visualize the functional groups based on GO and KEGG, as well as
the genes associated with these groups. The evidence codes used
were as follows: #Genes in KEGG, GO_MF, GO_CC and GO_BP;
P<0.05.
Analysis of protein expression
To determine the protein expression levels of the
corresponding genes in MA, the present study referred to the Human
Protein Atlas available from www.proteinatlas.org (24).
Survival analysis of DEGs
The Cancer Genome Atlas (TCGA; http://cancergenome.nih.gov/) is a comprehensive,
multi-dimensional map of the key genomic changes in 33 types of
cancer. The cBioPortal for Cancer Genomics is a user-friendly,
open-access web platform for the visualization, analysis, and
download of large-scale cancer genomics datasets (25). To evaluate the effects of the
selected DEGs on the survival of patients with MA, GBM Multiforme
(TCGA, Provisional) datasets were selected to generate the overall
survival (OS) and disease-free survival (DFS) Kaplan-Meier (KM)
plots using the cBioPortal online platform. In total, 166 tumor
samples with mRNA data (RNA-Seq V2) were selected as the patient
dataset and the mRNA expression z-Scores (RNA-Seq V2 RSEM) were
selected as the genomic profile (P<0.05).
Cell lines and culture
The human astrocytoma cell line, U251MG, and the GBM
of unknown origin cell line, U87MG (authenticated by STR
profiling), were maintained in Dulbecco's modified Eagle's medium
(DMEM; 1X High Glucose; Gibco/Thermo Fisher Scientific, Inc.)
supplemented with 10% fetal bovine serum (FBS; Gibco/Thermo Fisher
Scientific, Inc.) at 37°C and 5% CO2. The U251MG and
U87MG cells were used for stable transfection with siRNA directed
against COL1A1, which were was obtained from GenePharma (Shanghai).
U251MG and U87MG cells that were cultured with the COL1A1 siRNA
used as the experimental group were named as 'COL1A1 siRNA' cells.
U251MG and U87MG cells with the treatment of siControl served as
the control group were designated as 'Non-targeted' or 'NT' cells.
The growth medium was replenished every 4 days until >80% cells
reached confluence.
COL1A1 gene silencing
siRNA were purchased from GenePharma (Shanghai,
China). The sequences of the targeting siRNA and the control were
as follows: siRNA sense (5′-3′), CAUUGGUAAUGUUGGUGCUTT and
anti-sense (5′-3′), AGCACCAACAUUACCAAUGTT; and control sense
(5′-3′), UUCUCCGAACGUGUCACGUTT and antisense (5′-3′),
ACGUGACACGUUCGGAGAATT. The synthesized siRNAs were transfected into
the U251 or U87 cells using Lipofectamine 2000 according to the
manufacturer's instructions. Briefly, (1.5-2)×105 U251
or U87 glioma cells were seeded in 6-well plates for 24 h. siRNA
dissolved in serum free-medium was incubated for 20 min at room
temperature. The cells were then replaced with fresh medium
containing 25 nM siRNA, and then cultured for specific periods of
time (24 h) for further analysis.
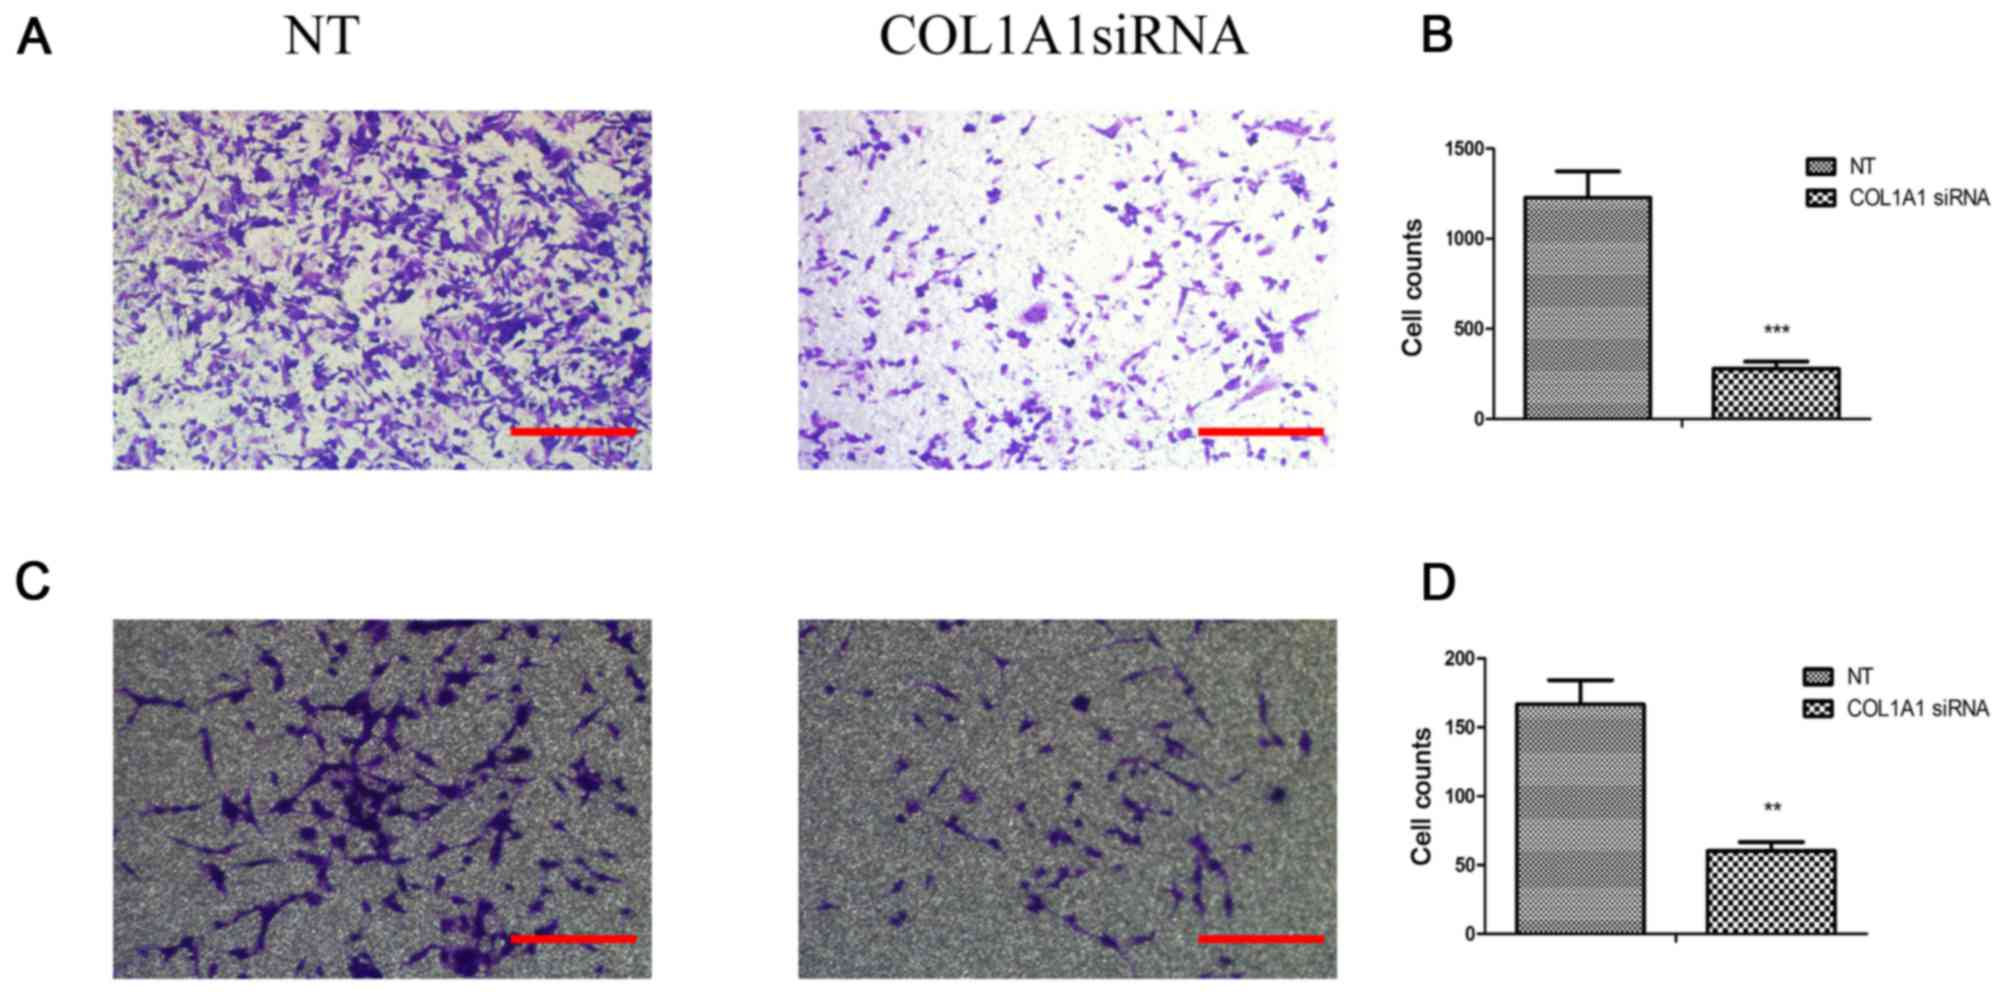
Invasion assay
Cell invasion assays were performed using Transwell
with Matrigel-coated membrane filter inserts in 24-well culture
plates (Corning Inc., Corning, NY, USA). The U251MG and U87MG cells
were seeded at a density of 1×10⁴ cells in 200 µl
of serum-free medium in the upper chamber. The bottom chamber was
fixed with 600 µl of culture medium containing 10% FBS and
1% penicillin streptomycin (Thermo Fisher Scientific, Inc.). The
cells on the lower surface of the membrane were fixed with 4%
form-aldehyde and stained with crystal violet (Vicmed Biotech Co.,
Ltd., Xuzhou, China). The stained invaded cells were photographed
under an inverted light microscope (magnifi-cation, ×100; Olympus
Corp., Tokyo, Japan) and counted in 5 random fields of view.
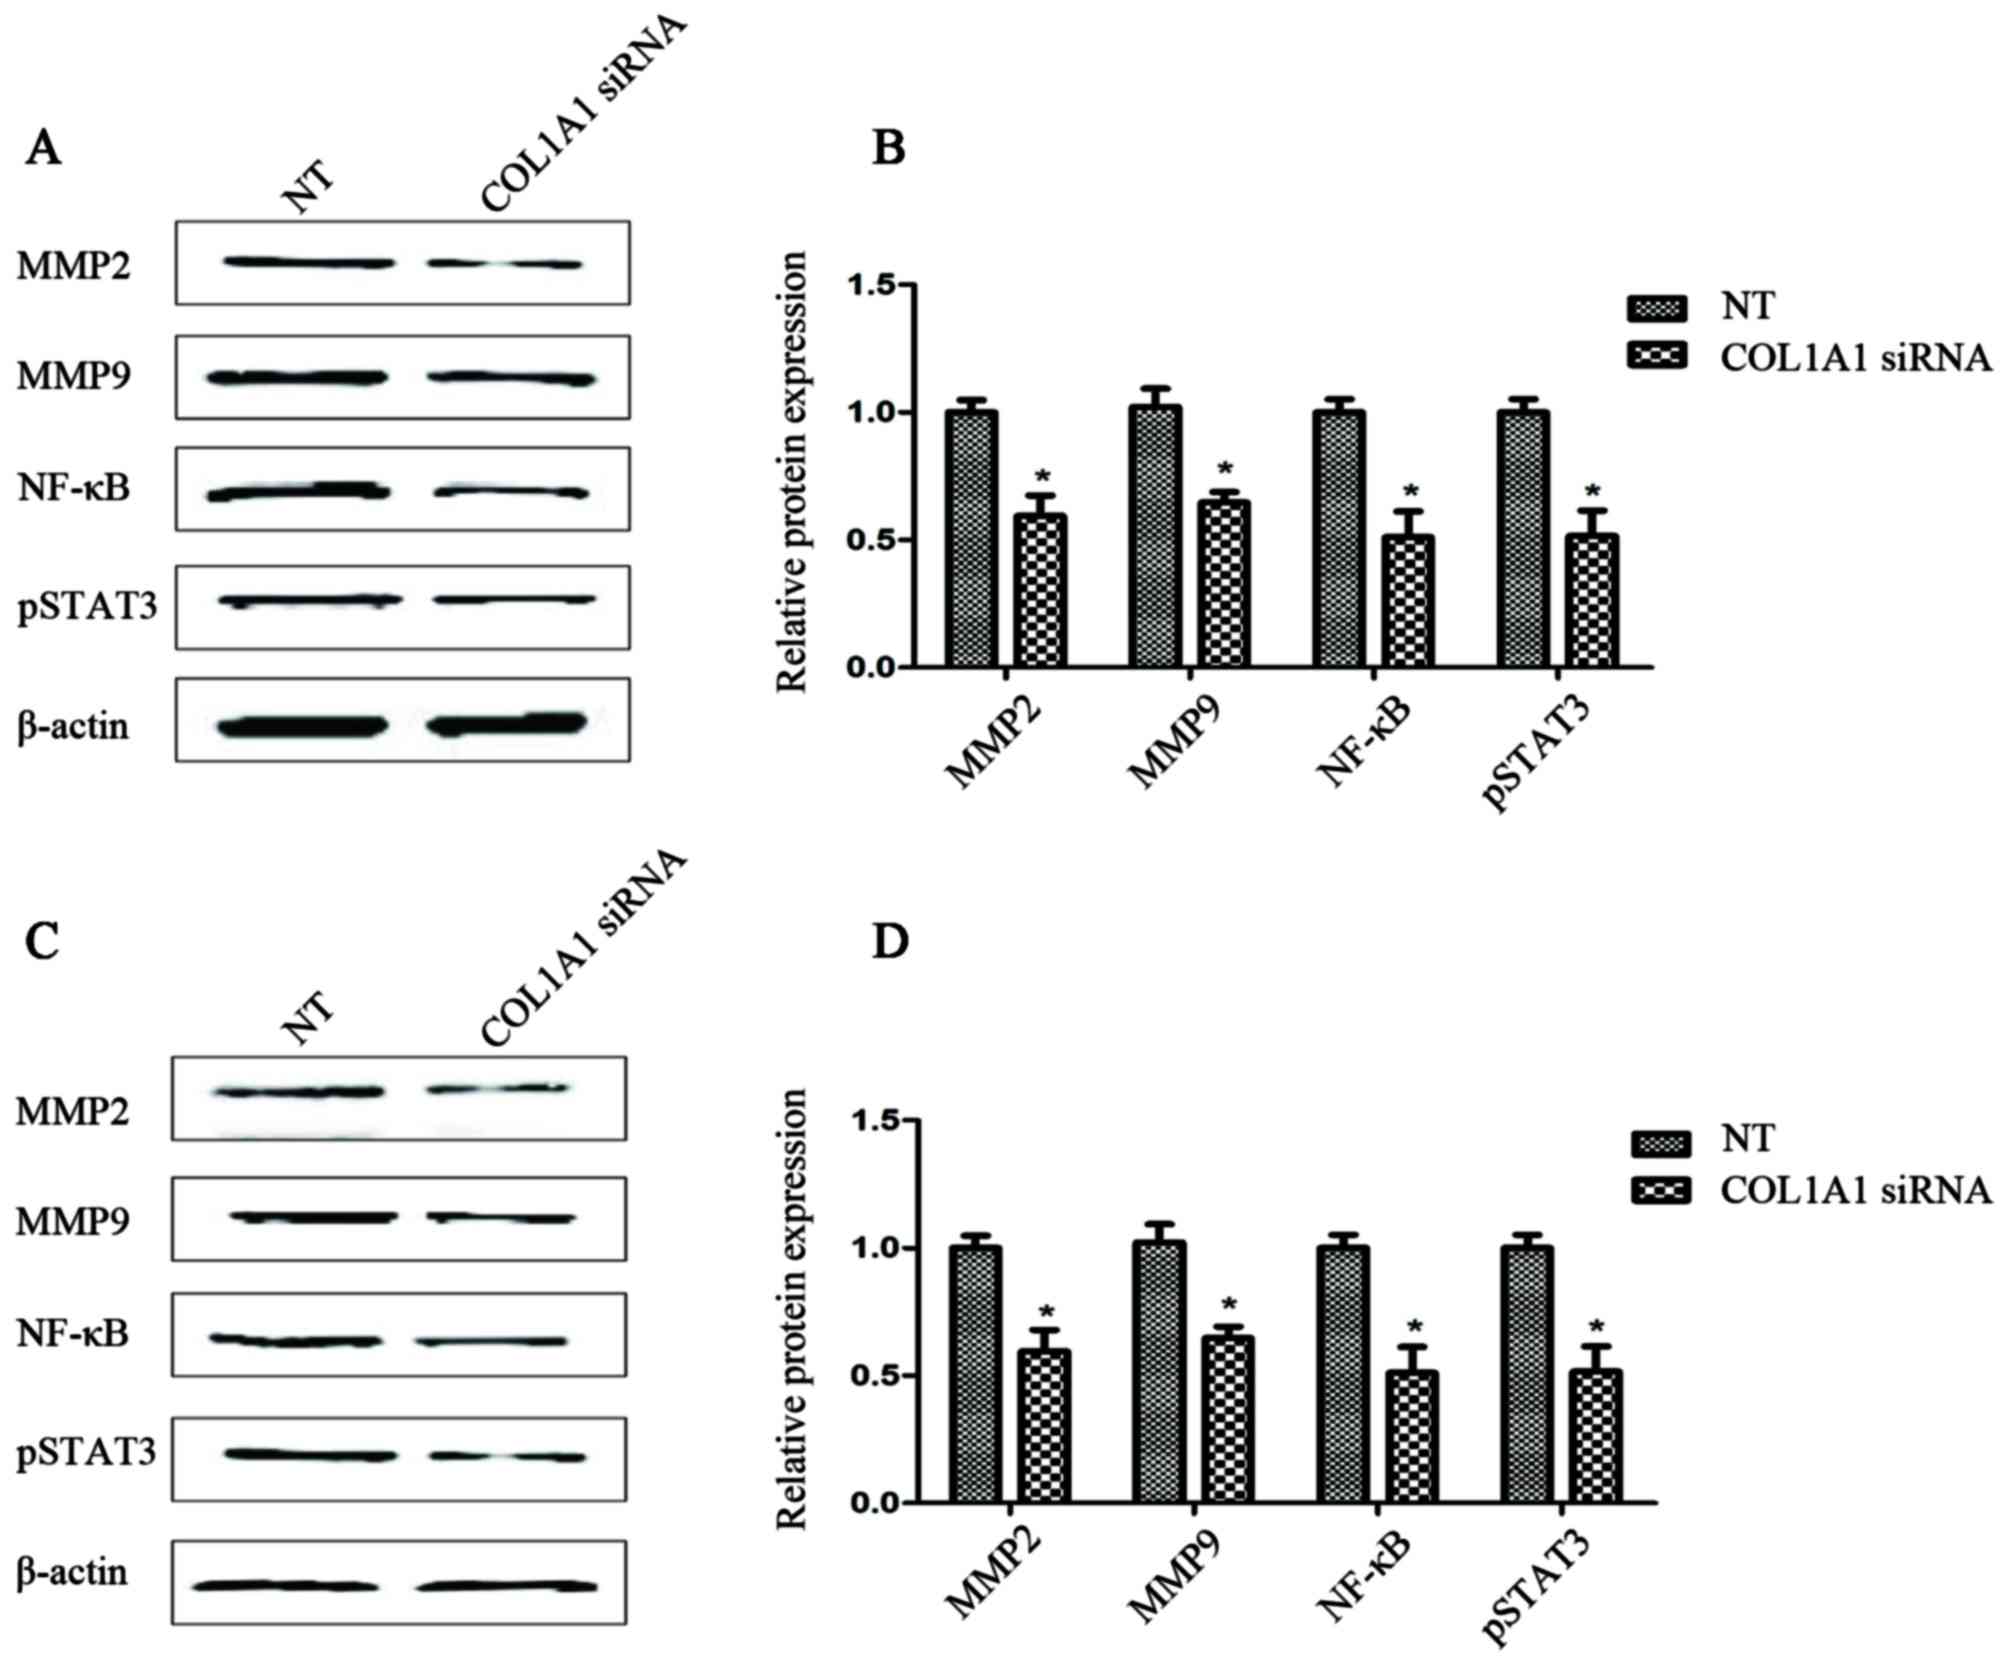
Western blot analysis
The matrix metalloproteinase (MMP)-2, MMP-9, nuclear
factor (NF)-κB and phosphorylated-signal transducer and activator
of transcription 3 (p-STAT3) protein levels were determined by
western blot analysis. Briefly, cells were collected following
treatment with COL1A1 siRNA for 24 h, and cell lysates were
prepared in 10 mm Tris (pH 7.5), 1 mm EDTA, 400 mm NaCl, 10%
glycerol, 0.5% NP40, 5 mm NaF, 0.5 mm sodium vanadate, 1 mm DTT and
0.1 mm phenylmethylsulfonyl fluoride. Proteins extracted from the
experimental and control groups were denatured, electrophoretically
separated by 8% SDS-PAGE and transferred onto nitrocellulose
membranes (EMD Millipore, Billerica, MA, USA). After blocking with
5% non-fat milk, the membranes were incubated overnight at 4°C with
the following primary antibodies: MMP-2 (10373-2-AP, 1:500;
ProteinTech Group, Inc., Chicago, IL, USA), MMP-9 (10375-2-AP,
1:500; ProteinTech Group, Inc.), pSTAT3 (CJ44121, 1:500; Bioworld
Technology, Co., Ltd., Nanjing, China) and NF-κB (MA D14E12,
1:1,000; Cell Signaling Technology, Inc., Danvers, MA, USA).
Anti-β-actin (1:10,000; Santa Cruz Biotechnology, Inc., Dallas, TX,
USA) was used as a protein loading control. The blots were then
incubated for 2 h with goat anti-rabbit (Lot No. C60321-05) or goat
anti-mouse (Lot No. C70124-05) secondary antibodies, respectively
(1:1,000; LI-COR Biosciences, Lincoln, NE, USA). All the protein
bands were scanned using the Odyssey Infrared laser scanning image
system (LI-COR Biosciences) once washed. The bands on the membranes
were analyzed using ImageJ 1.48v software (National Institutes of
Health, Bethesda, MD, USA).
Statistical analysis
All data were analyzed with SPSS 16.0 software
(SPSS, Inc., Chicago, IL, USA) and are expressed as the means ±
standard deviation. Independent sample t-tests were conducted to
identify significant differences in the mean values between the two
groups. One-way analysis of variance was performed to compare the
mean values of multiple samples. The post hoc LSD and S-N-K tests
were used for the comparison of the means of the control versus the
case groups. A value of P<0.05 was considered to indicate a
statistically significant difference.
Results
Identification of MA-related upregulated
DEGs
The Venn diagram revealed that the intersection
between the upregulated DEGs in the high-grade astrocytoma cases
(FCIV > FCIII) from the GSE4290, GSE19728
and GSE15824 datasets was 112 (Fig.
1A; termed group IV>III). Once the DEGs from the samples
with WHO grades I or II were removed, there were 15 DEGs remaining
(termed group 'IV>III, with no I or II'; Fig. 1B and C), including PCNA clamp
associated factor (PCLAF, also known as KIAA0101),
cluster of differentiation 151 (CD151), exoribonuclease 1
(ERI1), gap junction protein γ1 (GJC1), laminin
subunit γ1 (LAMC1), RAD51 associated protein 1
(RAD51AP1), pentraxin 3 (PTX3), chloride
intracellular channel protein 1 (CLIC1), ATPase family, AAA
domain containing 2 (ATAD2), structural maintenance go
chromosome 4 (SMC4), six-transmembrane epithelial antigen of
prostate 3 (STEAP3), COL1A1 and minichromosome maintenance
complex component 5 (MCM5).
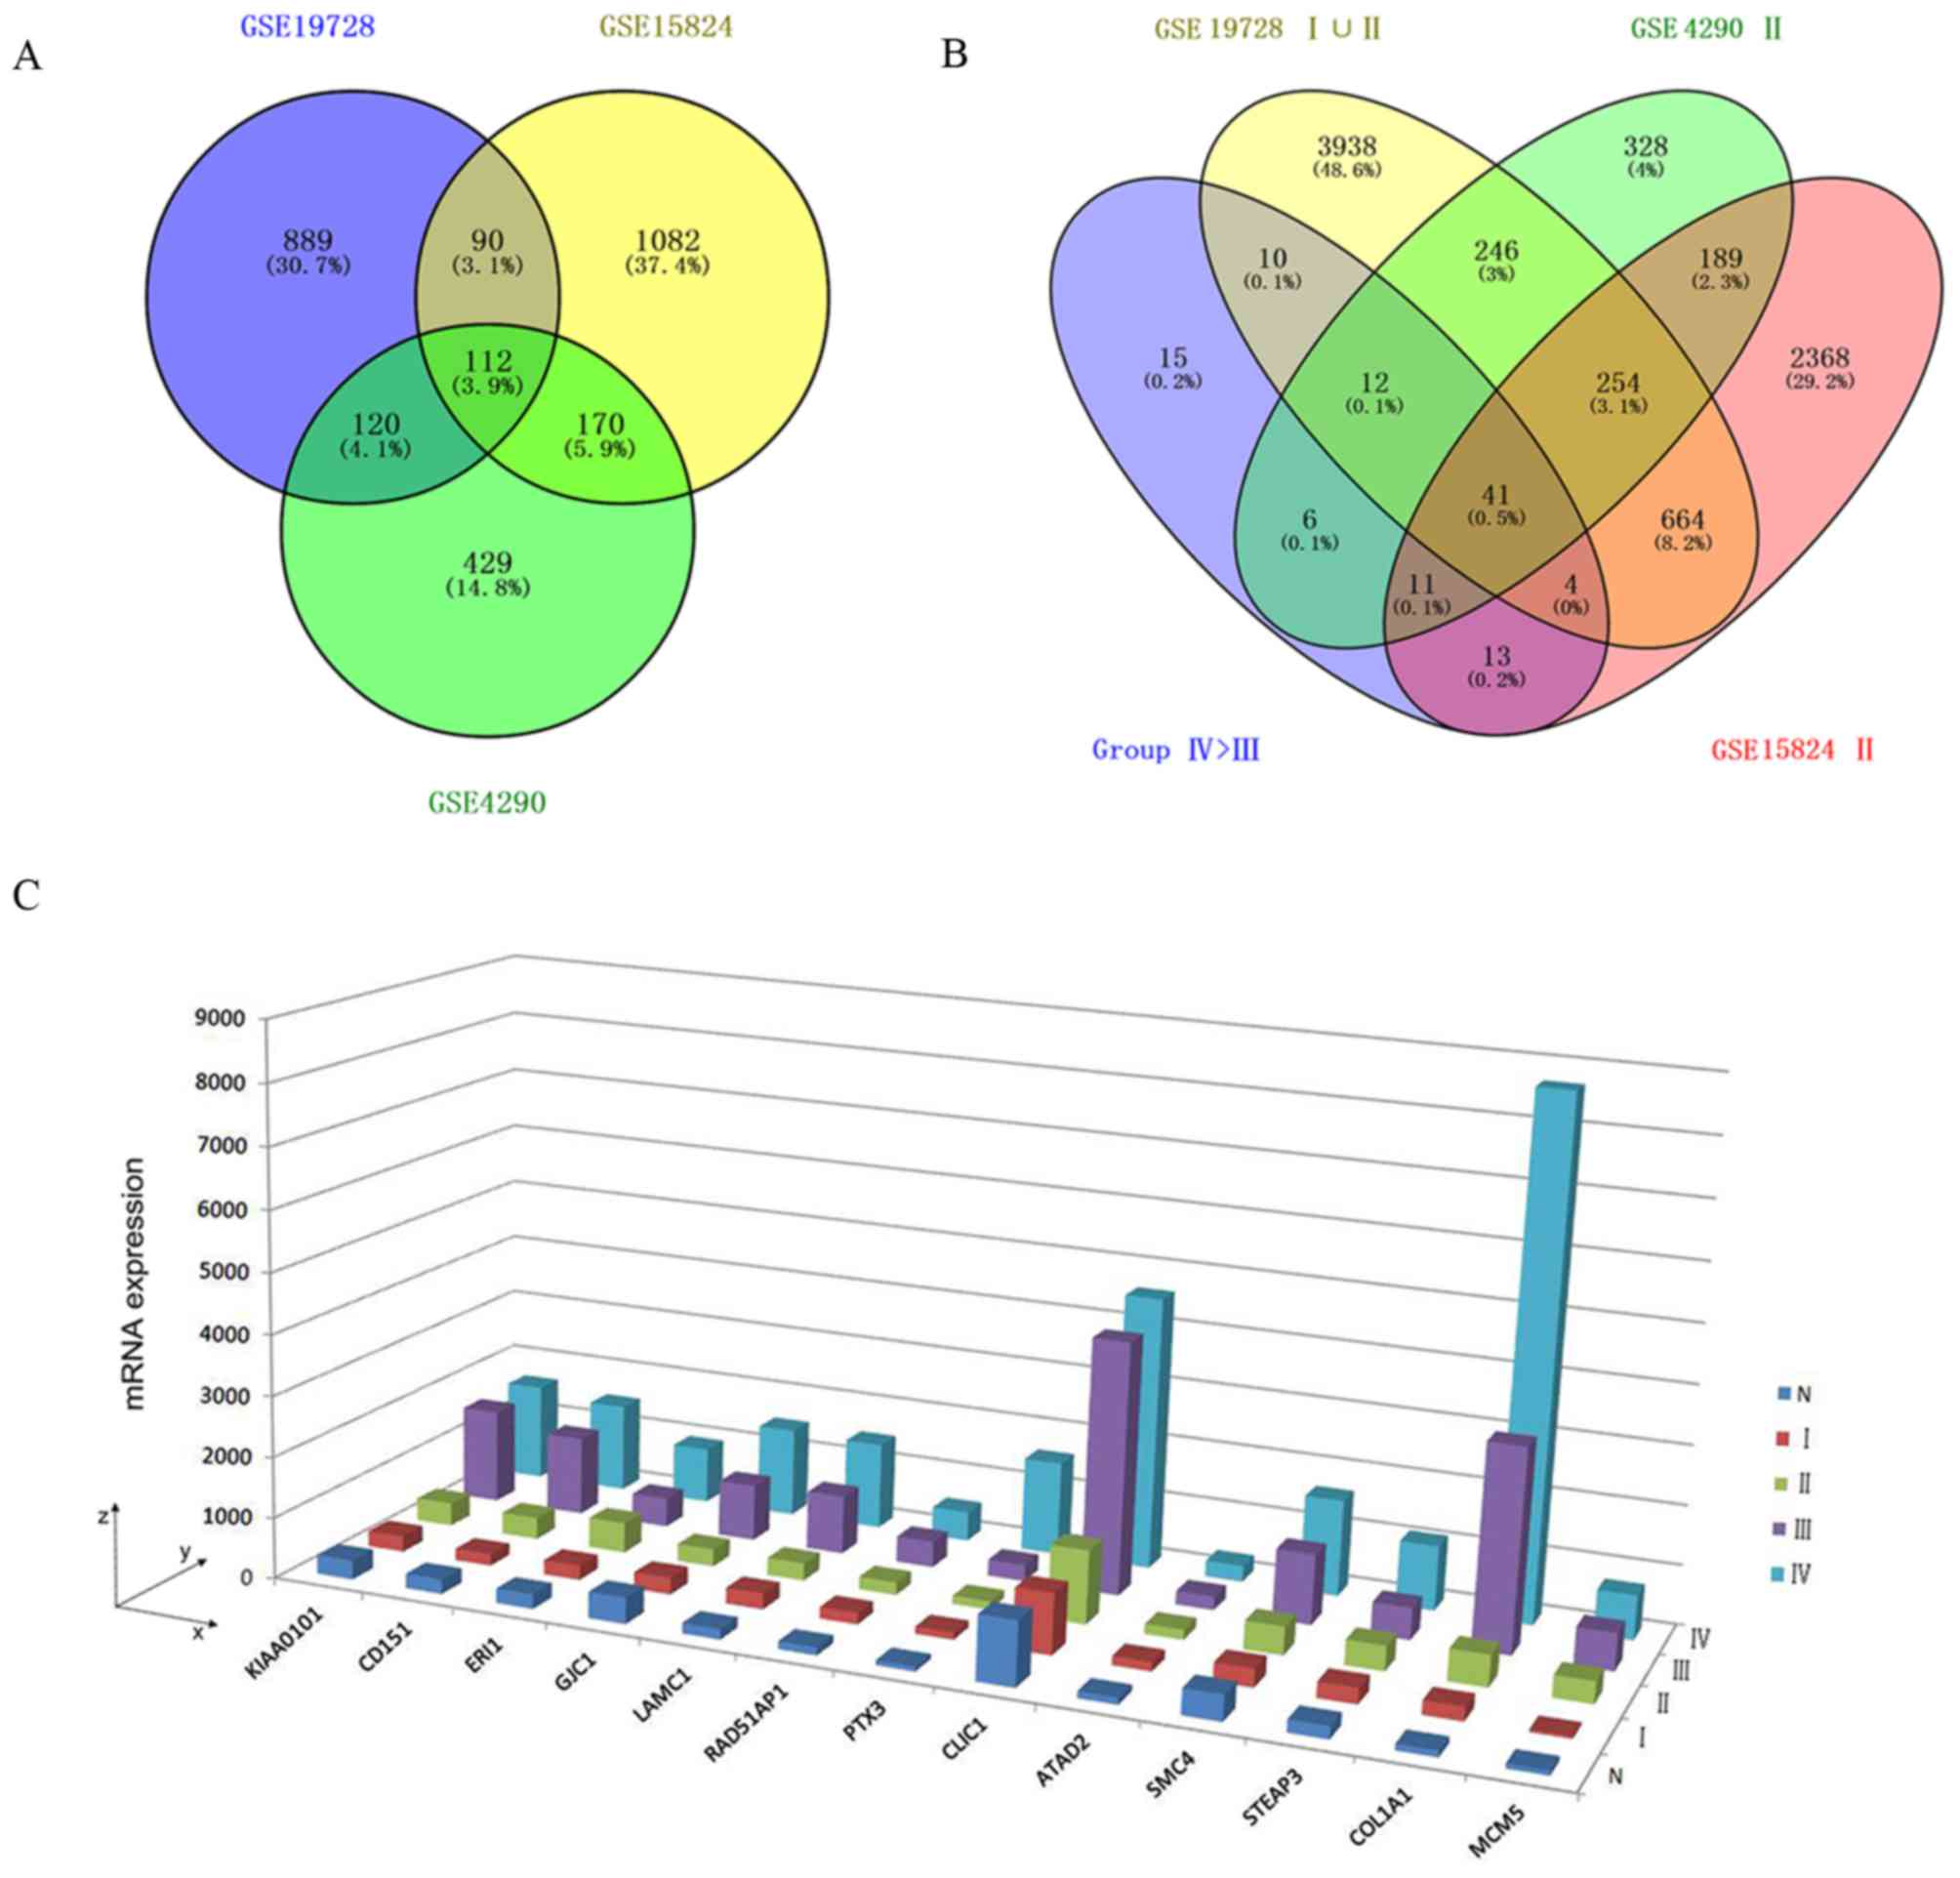 | Figure 1MA-related upregulated DEGs. (A) A
3-set Venn diagram presenting the intersection between upregulated
DEGs of high-grade astrocytoma (FCIV >
FCIII) from the GSE4290, GSE19728 and GSE15824
microarrays. (B) A 4-set Venn diagram presenting the intersection
between upregulated DEGs of Group IV>III, including GSE4290 II,
GSE15824 II and GSE19728 I∪II. (C) Three-dimensional histogram
presenting the mRNA expression of DEGs from Group IV>III, no I
or II, in GSE19728. x-axis, official gene symbols; y-axis, WHO
grades IV, III, II and I and normal brain (N); z-axis, mRNA
expression values. MA, malignant astrocytoma; DEGs, differentially
expressed genes; WHO, World Health Organization. |
GO term enrichment and KEGG pathway
analysis
Using the online software, DAVID, the DEGs of group
IV>III were annotated and the overrepresented GO terms and KEGG
pathways were identified. The results revealed that these DEGs were
significantly enriched in biological processes (BP), including
'extracellular matrix (ECM) organization' and 'cell adhesion'
(Table I). For molecular function
(MF), the upregulated DEGs might be enriched in 'ECM structural
constituent' (Table II). In
addition, the cell component (CC) analysis demonstrated that the
upregulated DEGs were significantly enriched in terms associated
with extracellular functions, such as extracellular exosome and
extracellular matrix (Table
III). Furthermore, using the gene annotation tool for the KEGG
pathway, the upregulated DEGs might be enriched in 'ECM-receptor
interaction', 'Focal adhesion' and 'phosphoinositide 3
(PI3K)-kinase-protein kinase B (Akt) signaling pathway' (Table IV).
 | Table ITop 10 terms of biological processes
(BP). |
Table I
Top 10 terms of biological processes
(BP).
| Category | Term | Description | P-value | Gene |
|---|
| GOTERM_BP
_DIRECT | GO:0030198 | Extracellular
matrix organization | 1.88E-09 | COL1A1, CD44,
COL3A, COL4A1, COL4A2, FN1, GFAP, ITGB2, LAMB2, LAMC1, NID1,
TNC |
| GOTERM_BP
_DIRECT | GO:0006958 | Complement
activation, classical pathway | 1.89E-06 | C1QA, C1QB, C1QC,
C1RL, C1R, C1S, C3 |
| GOTERM_BP
_DIRECT | GO:0050776 | Regulation of
immune response | 9.80E-06 | TYROBP, COL1A1,
COL3A1, C3, ITGB2, HLA-B, HLA-C, HLA-F |
| GOTERM_BP
_DIRECT | GO:0006956 | Complement
activation | 1.56E-05 | C1QA, C1QB, C1QC,
C1R, C1S, C3 |
| GOTERM_BP
_DIRECT | GO:0060333 |
Interferon-γ-mediated signaling
pathway | 2.07E-05 | CD44, GBP1, GBP2,
HLA-B, HLA-C |
| GOTERM_BP
_DIRECT | GO:0045087 | Innate immune
response | 3.45E-05 | TYROBP, C1QA, C1QB,
C1QC, C1RL, C1R, C1S, HLA-B, HLA-C, PTX3, RNF135 |
| GOTERM_BP
_DIRECT | GO:0009611 | Response to
wounding | 2.94E-04 | ZFP36L2, F2R, FN1,
GFAP, TNC |
| GOTERM_BP
_DIRECT | GO:0002480 | Antigen processing
and presentation of exogenous peptide antigen via MHC class I,
TAP-independent | 7.71E-04 | HLA-B, HLA-C,
HLA-F |
| GOTERM_BP
_DIRECT | GO:0006955 | Immune
response | 7.94E-04 | FYB, TNFRSF1A,
C1QC, C1R, C3, GBP2, HLA-B, HLA-C, HLA-F |
| GOTERM_BP
_DIRECT | GO:0007155 | Cell adhesion | 0.001423 | CD151, CD44,
COL1A1, FN1, IGFBP7, ITGB2, 22LAMB2, LAMC1, TNC |
| Table IITop 10 terms of molecular function
(MF). |
Table II
Top 10 terms of molecular function
(MF).
| Category | Term | Description | P-value | Gene |
|---|
| GOTERM_MF
_DIRECT | GO:0005201 | Extracellular
matrix structural constituent | 3.10E-04 | COL1A1, COL3A1,
COL4A1, COL4A2, LAMC1 |
| GOTERM_MF
_DIRECT | GO:0004252 | Serine-type
endopeptidase activity | 9.49E-04 | C1QA, C1QB, C1QC,
C1RL, C1R, C1S, C3 |
| GOTERM_MF
_DIRECT | GO:0048407 | Platelet-derived
growth factor binding | 1.24E-03 | COL1A1, COL3A1,
COL4A1 |
| GOTERM_MF
_DIRECT | GO:0005102 | Receptor
binding | 1.60E-03 | ABCA1, FYB, TYROBP,
F2R, C3, IDH1, HLA-B, HLA-F |
| GOTERM_MF
_DIRECT | GO:0005178 | Integrin
binding | 1.68E-03 | CD151, COL3A1, FN1,
GFAP, LAMB2 |
| GOTERM_MF
_DIRECT | GO:0001948 | Glycoprotein
binding | 3.52E-03 | FLNA, GFAP, ITGB2,
VIM |
| GOTERM_MF
_DIRECT | GO:0005515 | Protein
binding | 3.78E-03 | ABCA1, BARD1,
CD151, CD163, DAB2, FYB, KIAA0101, RAB13, RAD51AP1, STEAP3, TEAD1,
THOC2, TNFRSF1A, TYROBP, ZFP36L2, ANXA2, CALU, CHEK1, CLIC1, F2R,
COL1A1, COL3A1, C3, CDK1, DTX3L, FN1, FLNA, GFAP, GBP1, HMG20B,
IGFBP7, ITGB2, MCCC2, MCM5, MYOF, NOTCH2NL, PTX3, PTBP1, PTPRC,
RNF135, SLC40A1, UHRF1, VIM |
| GOTERM_MF
_DIRECT | GO:0042605 | Peptide antigen
binding | 1.05E-02 | HLA-B, HLA-C,
HLA-F |
| GOTERM_MF
_DIRECT | GO:0098641 | Cadherin binding
involved in cell-cell adhesion | 1.33E-02 | ARHGAP18, ANXA2,
CALD1, CLIC1, FLNA, IDH1 |
| GOTERM_MF
_DIRECT | GO:0046977 | TAP binding | 0.014459 | HLA-B, HLA-C |
| Table IIITop 10 terms of cell component
(CC). |
Table III
Top 10 terms of cell component
(CC).
| Category | Term | Description | P-value | Gene |
|---|
| GOTERM_CC
_DIRECT | GO:0005576 | Extracellular
region | 7.98E-10 | CD163, TNFRSF1A,
APOC1, CALU, F2R, COL1A1, COL3A1, COL4A1, COL4A2, C1QA, C1QB, C1QC,
C1R, C1S, C3, FN1, FLNA, GBP1, IGFBP7, LAMB2, LAMC1, HLA-C, NID1,
NOTCH2NL, PTX3, PLTP, TNC, TFPI |
| GOTERM_CC
_DIRECT | GO:0031012 | Extracellular
matrix | 9.55E-09 | ANXA2, COL1A1,
COL3A1, COL4A1, COL4A2, FN1, FLNA, IGFBP7, LAMB2, LAMC1, NID1, TNC,
VIM |
| GOTERM_CC
_DIRECT | GO:0070062 | Extracellular
exosome | 6.04E-07 | ATAD2, CD44, DAB2,
FCGR2A, RAB13, ANXA2, APOC1, CLIC1, COL4A2, C1QA, C1QB, C1QC, C1RL,
C1R, C1S, C3, CDK1, FN1, FLNA, IGFBP7, ITGB2, IDH1, LAMB2, LAMC1,
HLA-B, HLA-C, MYOF, NID1, PTBP1, PSMB9, PTPRC, VIM |
| GOTERM_CC
_DIRECT | GO:0005604 | Basement
membrane | 1.99E-06 | CD151, ANXA2,
COL4A1, LAMB2, LAMC1, NID1, TNC |
| GOTERM_CC
_DIRECT | GO:0072562 | Blood
microparticle | 4.90E-05 | CLIC1, C1QB, C1QC,
C1R, C1S, C3, FN1 |
| GOTERM_CC
_DIRECT | GO:0005581 | Collagen
trimer | 5.93E-05 | COL1A1, COL3A1,
C1QA, C1QB, C1QC, MSR1 |
| GOTERM_CC
_DIRECT | GO:0009986 | Cell surface | 2.05E-04 | CD44, TNFRSF1A,
TYROBP, ANXA2, F2R, ITGB2, HLA-B, HLA-C, HLA-F, PTPRC, TFPI |
| GOTERM_CC
_DIRECT | GO:0005615 | Extracellular
space | 3.27E-04 | TNFRSF1A, ANXA2,
CHEK1, CLIC1, COL1A1, COL3A1, C1QC, C1RL, C3, FN1, IGFBP7, LAMC1,
PTX3, PLTP, PTPRZ1, TNC, TFPI |
| GOTERM_CC
_DIRECT | GO:0042612 | MHC class I protein
complex | 1.51E-03 | HLA-B, HLA-C,
HLA-F |
| GOTERM_CC
_DIRECT | GO:0005605 | Basal lamina | 0.002026 | FN1, LAMB2,
NID1 |
| Table IVTop 10 terms of KEGG pathway. |
Table IV
Top 10 terms of KEGG pathway.
| Category | Term | Description | P-value | Gene |
|---|
| KEGG_PATHWAY | hsa05150 | Staphylococcus
aureus infection | 5.89E-08 | FCGR2A, C1QA, C1QB,
C1QC, C1R, C1S, C3, ITGB2 |
| KEGG_PATHWAY | hsa04512 | ECM-receptor
interaction | 9.60E-08 | CD44, COL1A1,
COL3A1, COL4A1, COL4A2, FN1, LAMB2, LAMC1, TNC |
| KEGG_PATHWAY | hsa04610 | Complement and
coagulation cascades | 3.33E-07 | F2R, C1QA, C1QB,
C1QC, C1R, C1S, C3, TFPI |
| KEGG_PATHWAY | hsa05146 | Amoebiasis | 6.22E-06 | COL1A1, COL3A1,
COL4A1, COL4A2, FN1, ITGB2, LAMB2, LAMC1 |
| KEGG_PATHWAY | hsa05133 | Pertussis | 1.01E-05 | C1QA, C1QB, C1QC,
C1R, C1S, C3, ITGB2 |
| KEGG_PATHWAY | hsa04510 | Focal adhesion | 6.30E-05 | COL1A1, COL3A1,
COL4A1, COL4A2, FN1, FLNA, LAMB2, LAMC1, TNC |
| KEGG_PATHWAY | hsa04145 | Phagosome | 6.80E-05 | FCGR2A, C1R, C3,
ITGB2, MSR1, HLA-B, HLA-C, HLA-F |
| KEGG_PATHWAY | hsa05322 | Systemic lupus
erythematosus | 2.66E-04 | FCGR2A, C1QA, C1QB,
C1QC, C1R, C1S, C3 |
| KEGG_PATHWAY | hsa05020 | Prion diseases | 0.001395 | C1QA, C1QB, C1QC,
LAMC1 |
| KEGG_PATHWAY | hsa04151 | PI3K-Akt signaling
pathway | 0.002024 | F2R, COL1A1,
COL3A1, COL4A1, COL4A2, FN1, LAMB2, LAMC1, TNC |
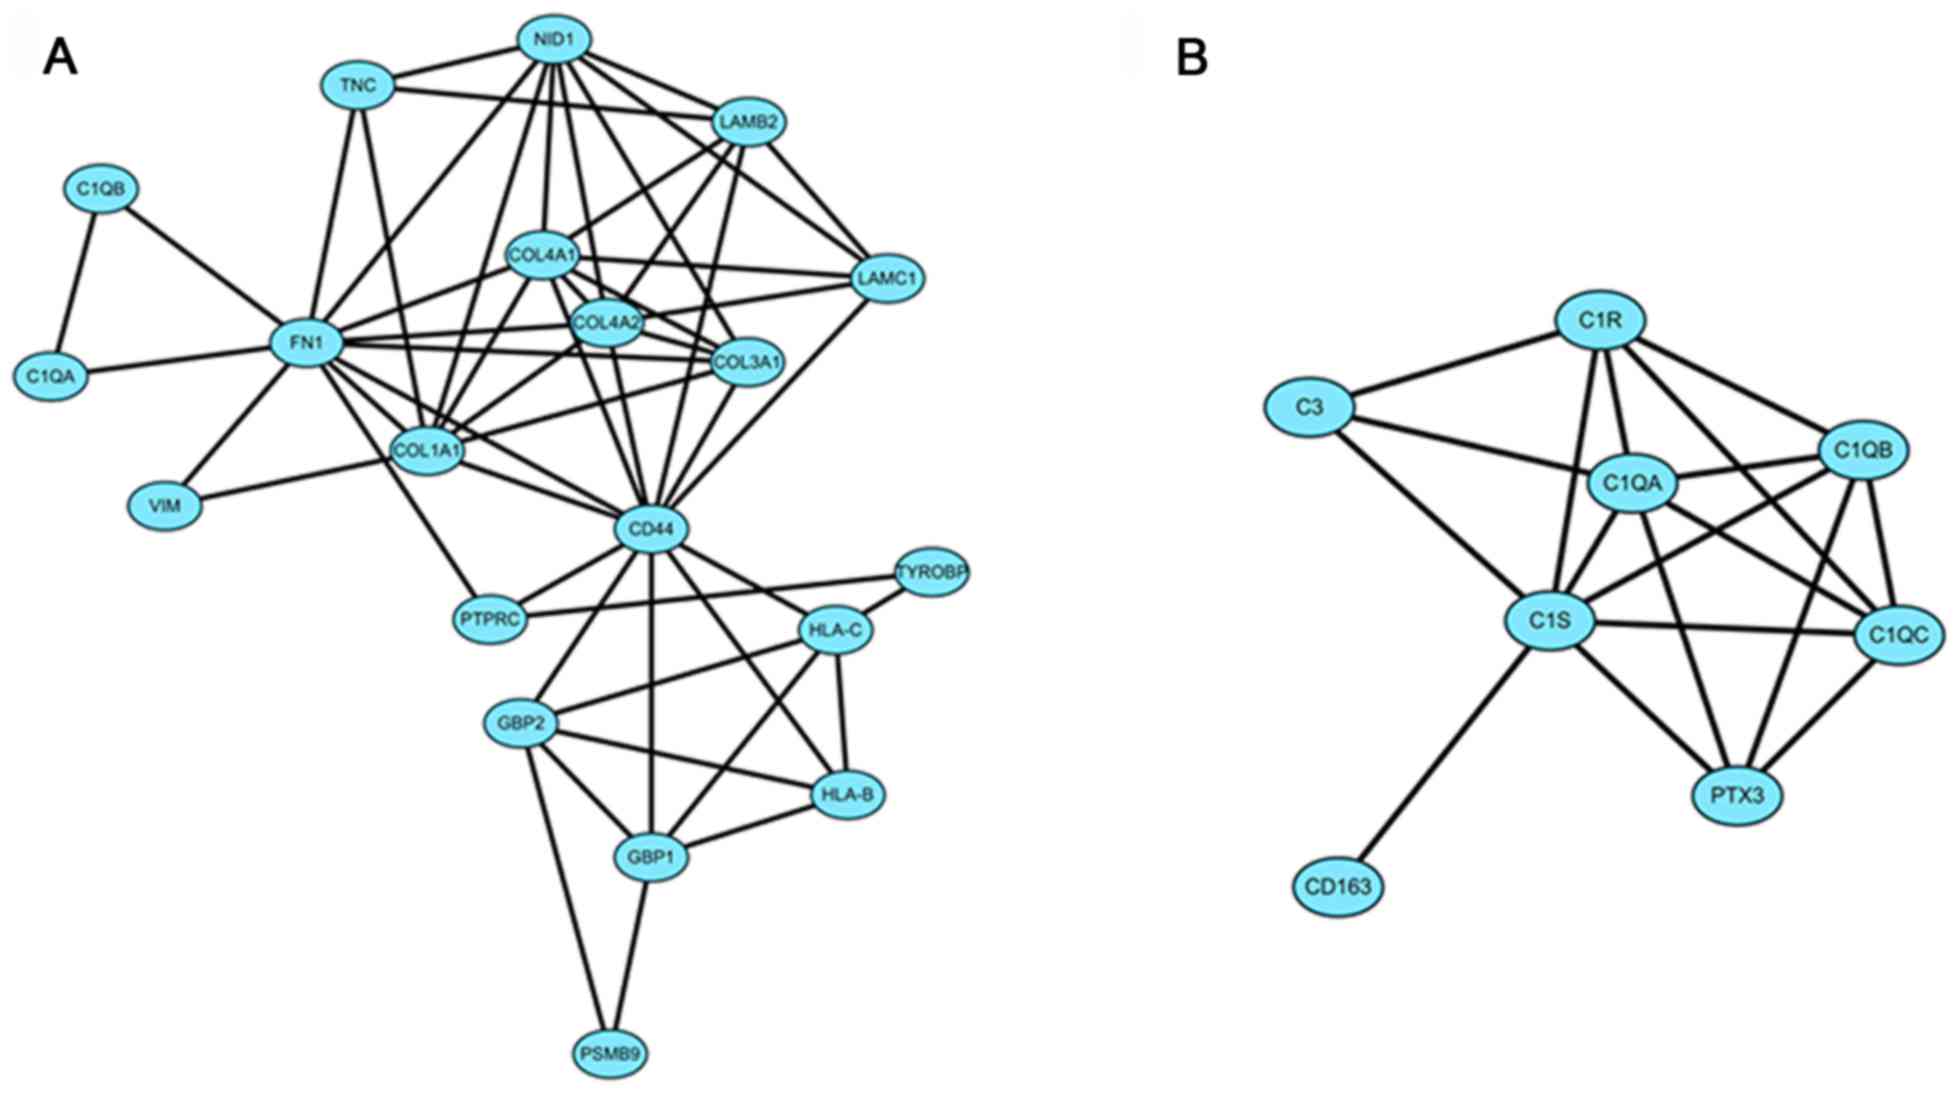
Module screening from the PPI
network
The DEGs of group IV>III were input into STRING
online and the acquired interaction network of DEGs was then
reconstructed to form the network using Cytoscape-MCODE. The
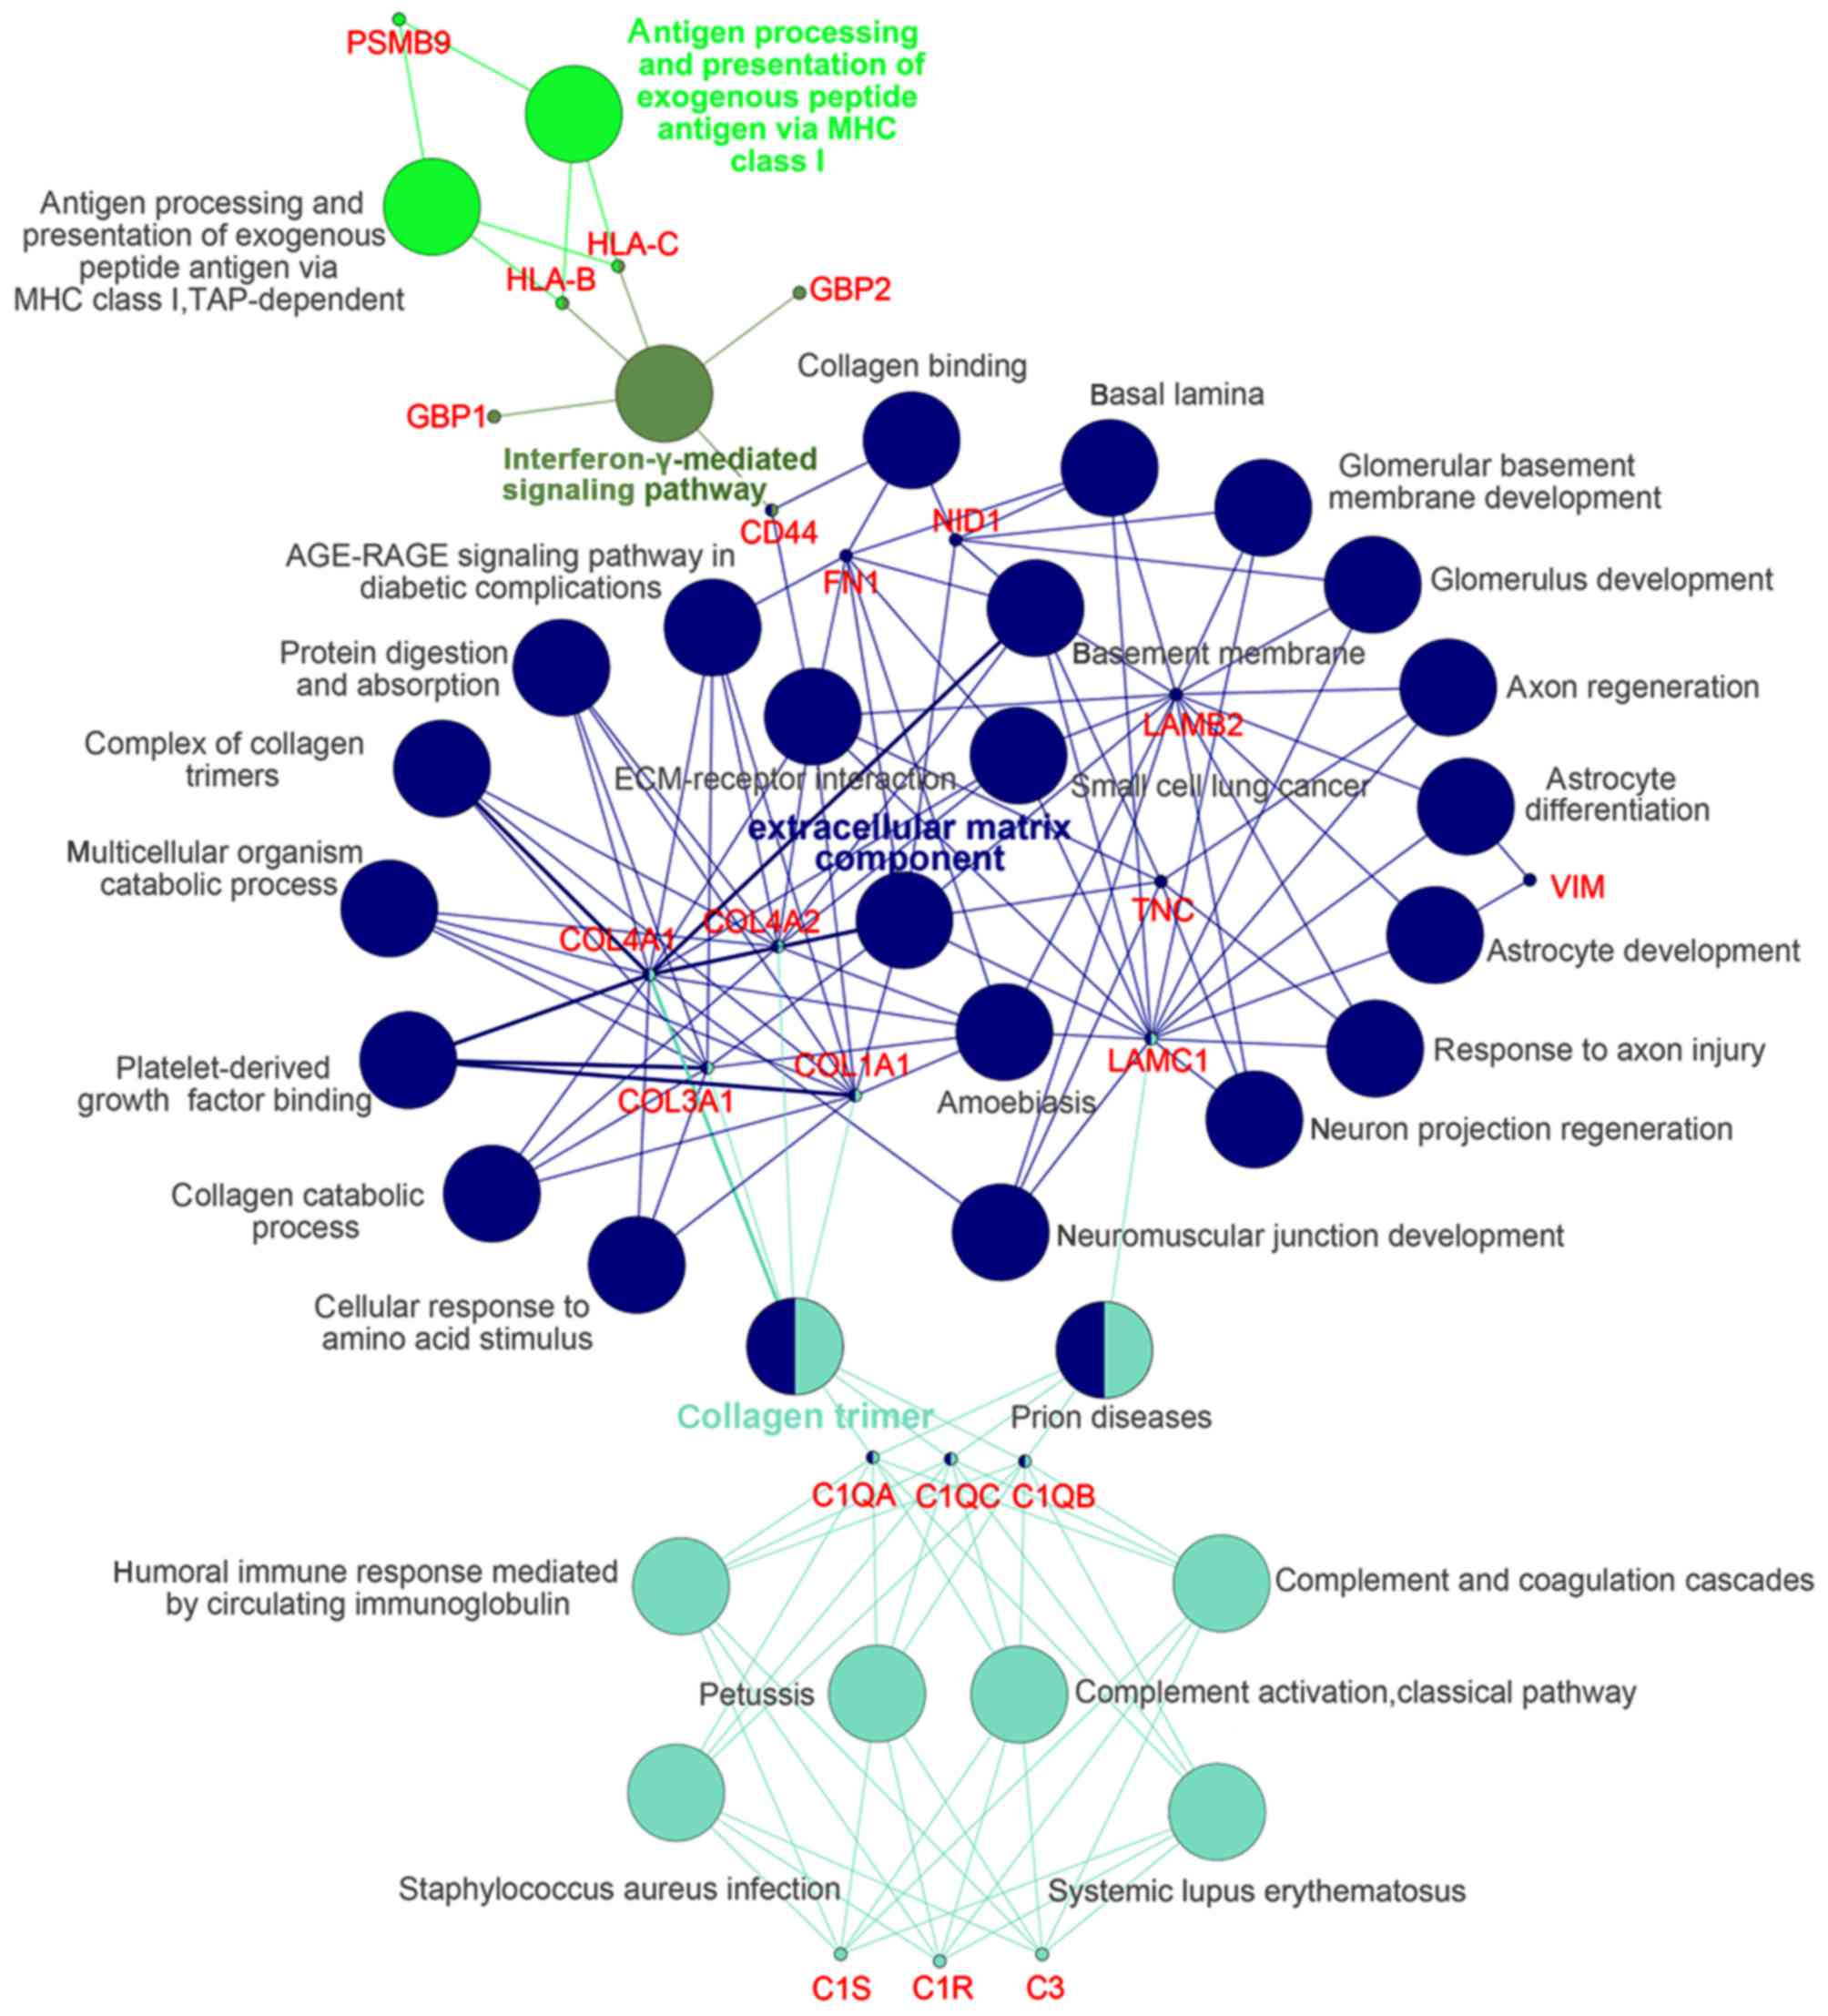
results revealed that there were 2 clusters (Fig. 2). Further
Cytoscape-ClueGo/CluePedia analysis demonstrated that in cluster 1,
there were mainly 4 functional modules enriched such as 'ECM
component' and 'collagen trimer' and the corresponding genes
included COL1A1, LAMC1 and fibronectin 1 (FN1)
(Fig. 3).
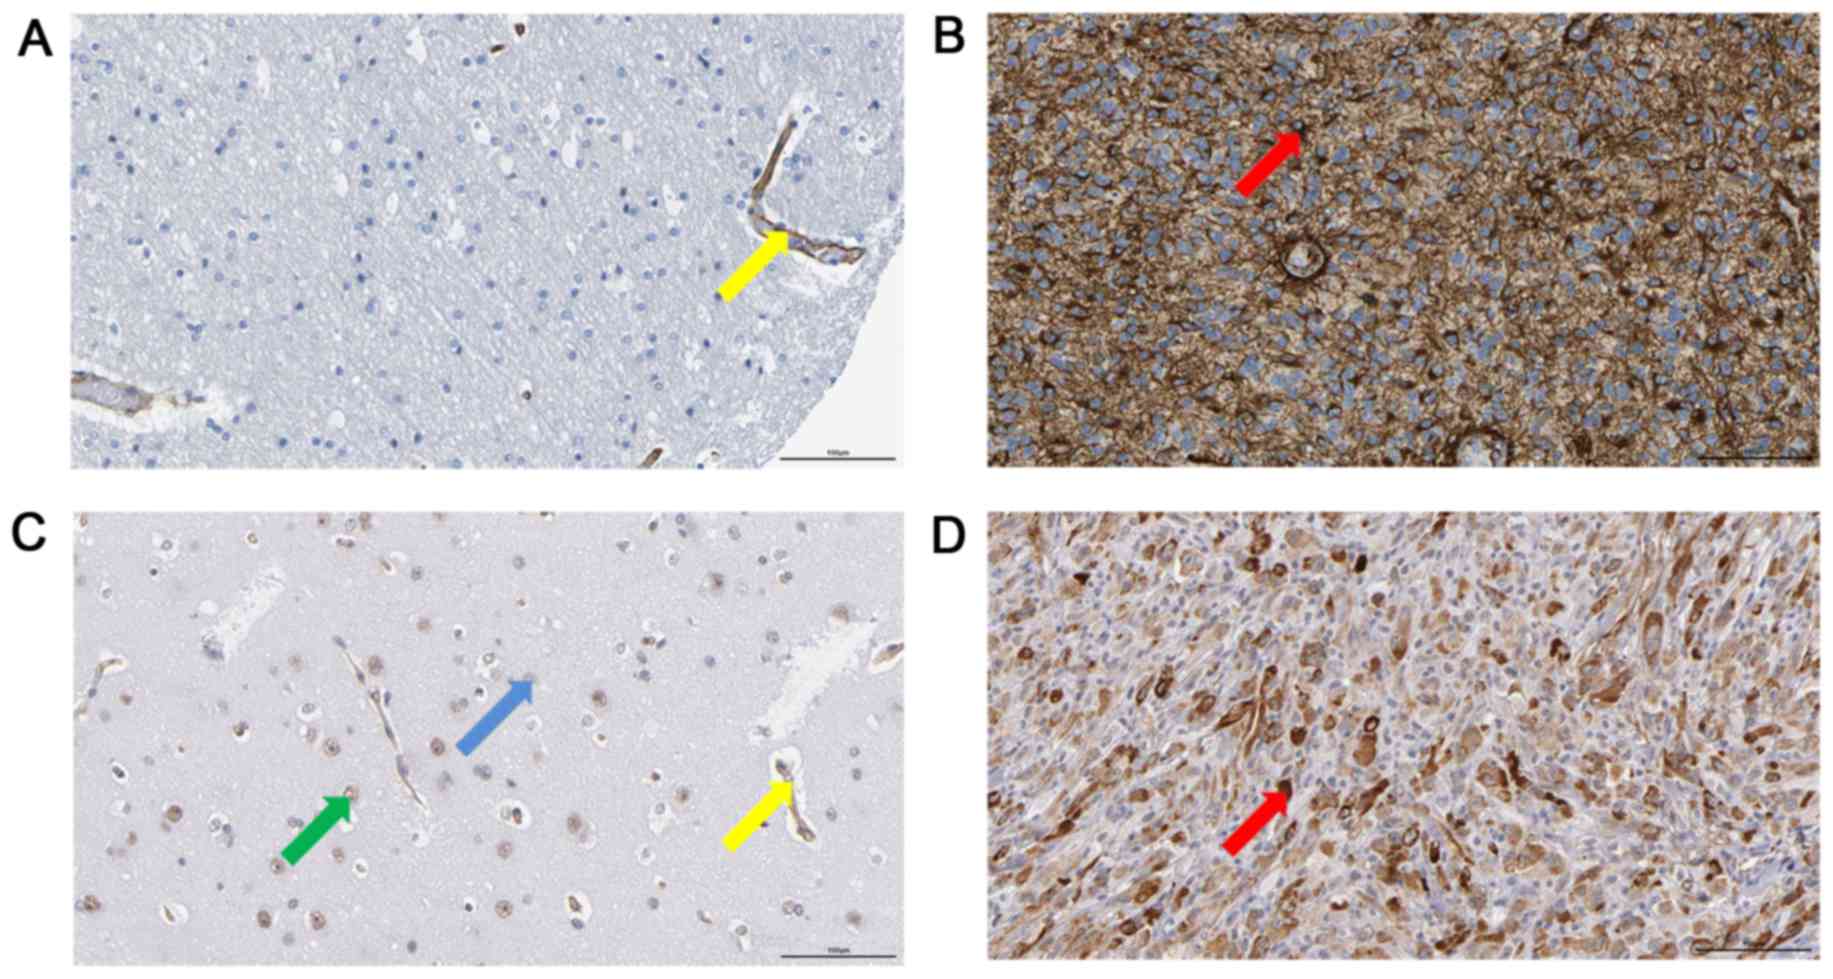
COL1A1 and LAMC1 are overexpressed in
human MA
By searching the Human Protein Atlas, the present
study revealed that in some patients with MA, there was a positive
expression of COL1A1 or LAMC1 in the tumor cells, while in the
normal cerebral cortex, there was no positive staining of COL1A1 or
LAMC1 in glial cells (Fig. 4).
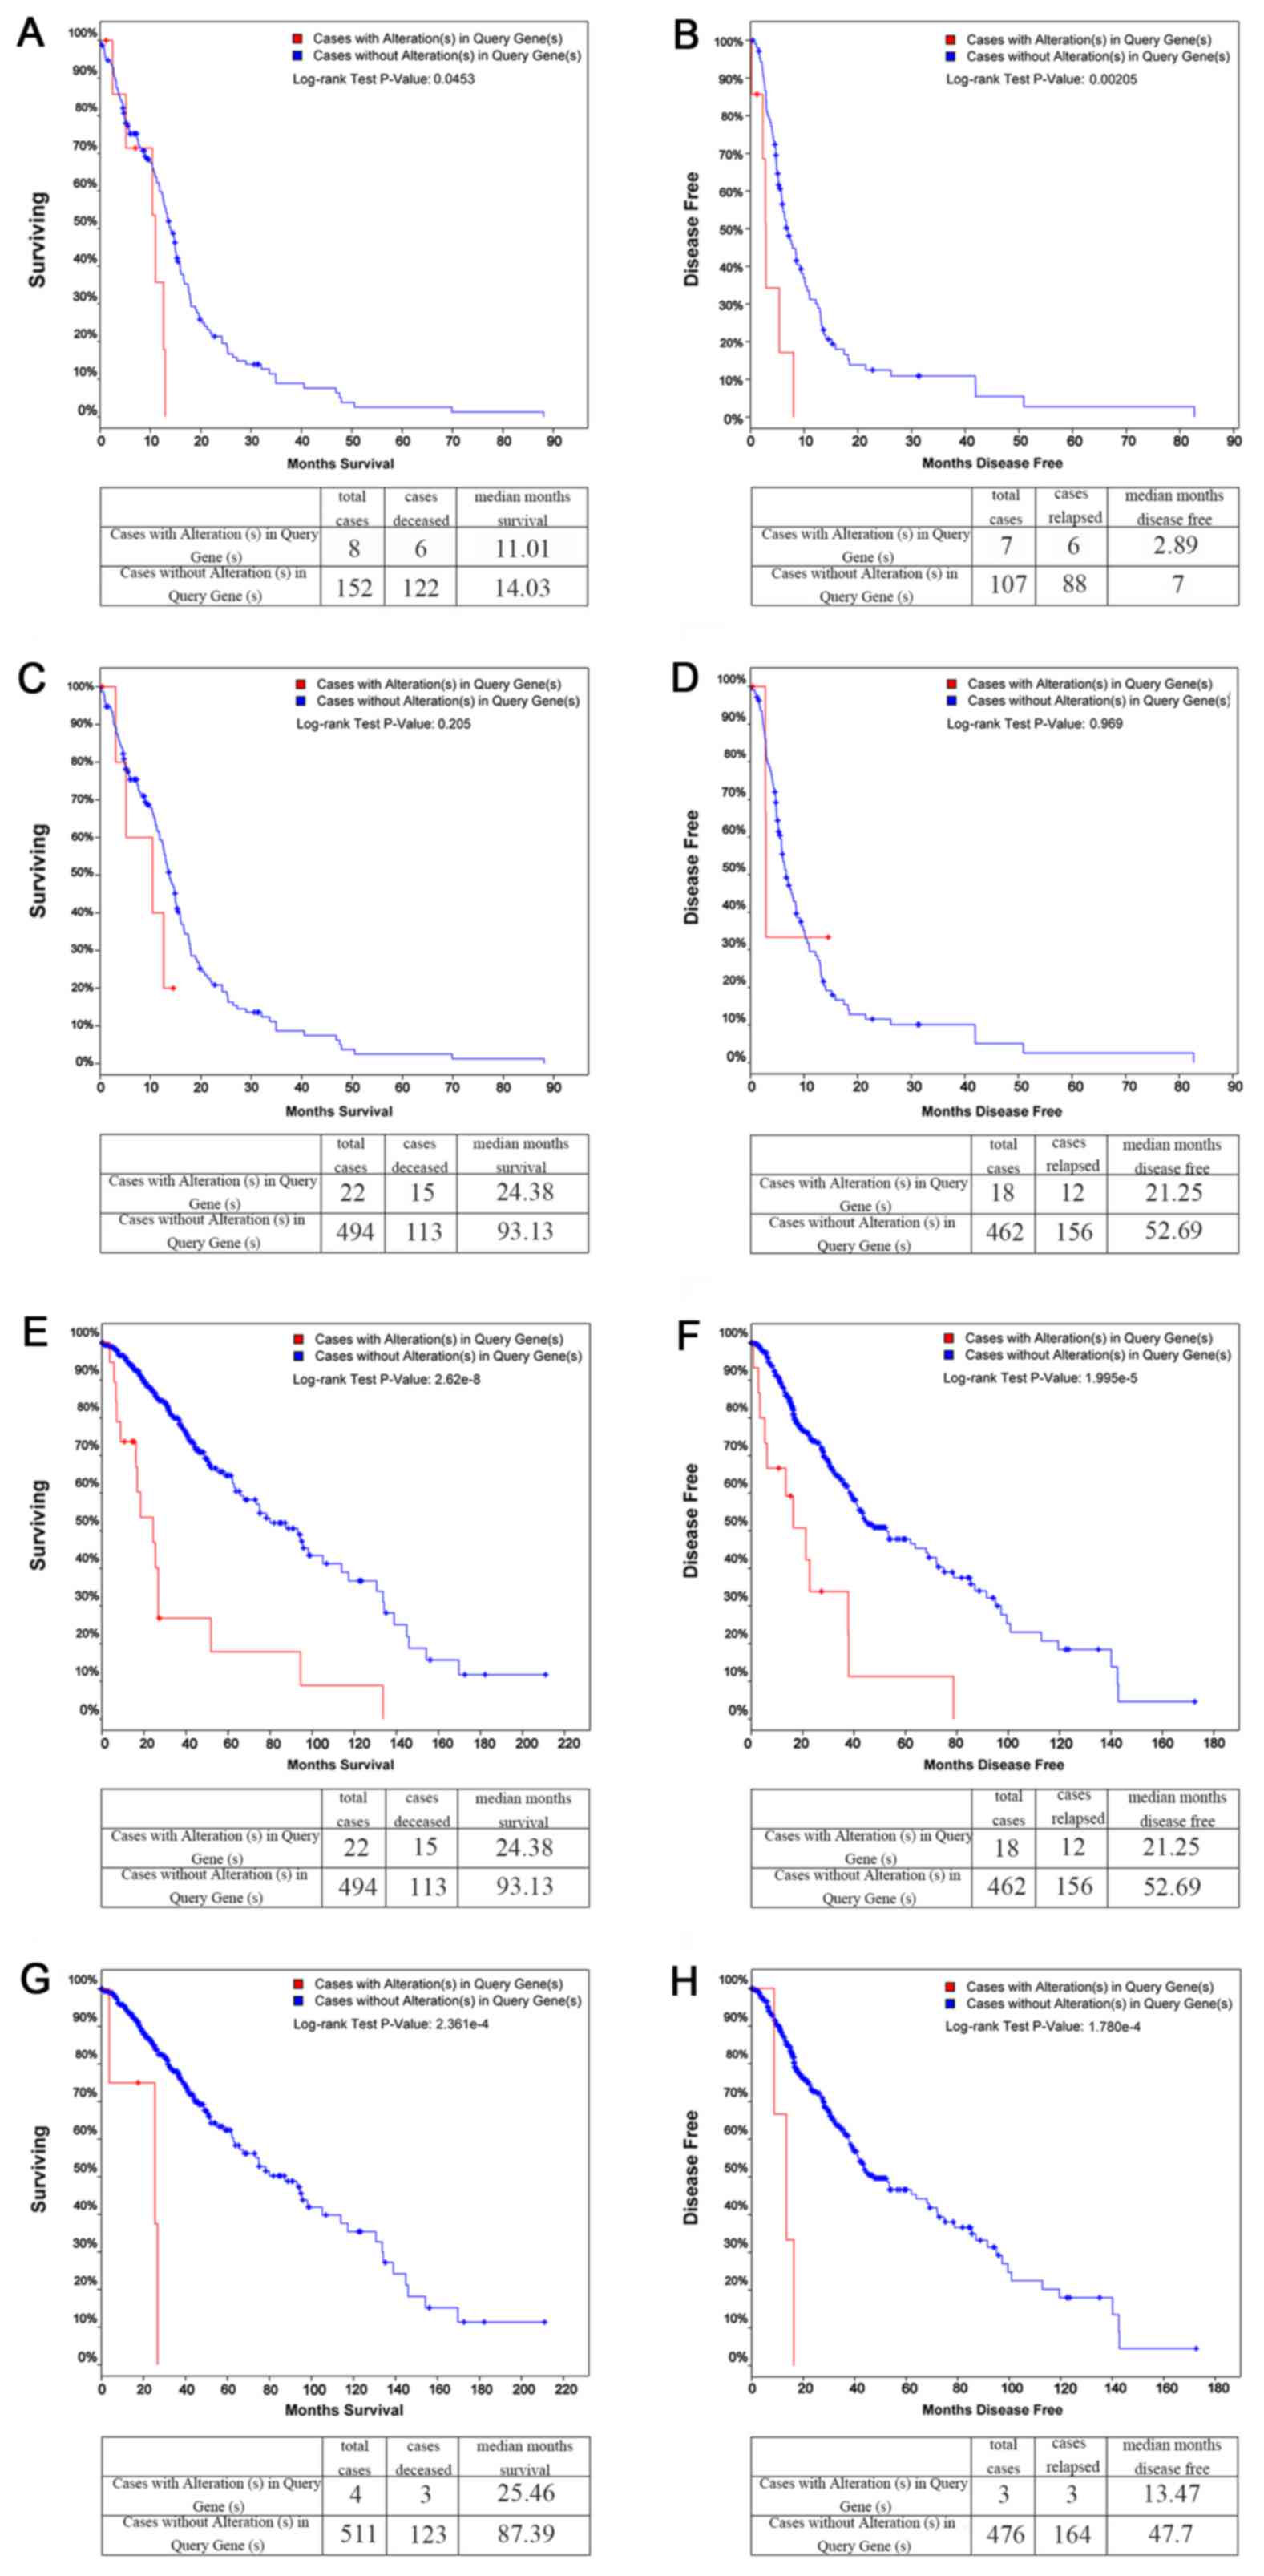
KM plots
Comparisons between the cases with and without
alterations in Query Genes, OS and DFS KM estimates were then made.
The results revealed that in GBM, COL1A1 was altered in 8 of
the queried samples, while its OS (Fig. 5A) and DFS KM plots (Fig. 5B) both exhibited significant
differences (P<0.05). LAMC1, on the other hand, was
altered in 6 of the queried samples, and neither of its OS
(Fig. 5C) nor DFS KM plots
(Fig. 5D) exhibited significant
differences (P>0.05). However, in brain Lower Grade Glioma
(LGG), both COL1A1 and LAMC1 exhibited significant
differences in the OS and DFS KM plots (Fig. 5E–H).
COL1A1 promotes glioma cell invasion
The effects of COL1A1 on U251MG or U87MG cell
invasion were quantitatively determined by Transwell assay
(Fig. 6). The investigated COL1A1
siRNA-treated groups exhibited an unequivocal decrease in their
invasive capacities relative to the control cells (P<0.001).
Downregulation of COL1A1 may lead to a
reduction in the levels of recognized invasion-related factors
A comparison between the results of western blot
analysis (Fig. 7) and those of the
invasion assay (Fig. 6) indicated
that, as was expected, the cells transfected with COL1A1 siRNA
expressed lower levels of p-STAT3 (up to 60%) when compared with
the endogenous levels in the U251MG or U87MG control cells. As
shown in Fig. 7, the COL1A1
siRNA-transfected glioma cells exhibited a significant decrease (up
to 60%) in the MMP-2 and MMP-9 protein levels. Furthermore, the
expression of NF-κB in the COL1A1 siRNA-transfected group was
significantly lower (up to 50%) than that observed in the NT group
(Fig. 7).
Discussion
The development and progression of malignant glioma
are driven by a series of genomic alterations, including changes in
mRNA expression (26).
Understanding the molecular mechanisms associated with malignant
glioma is crucial for its diagnosis and treatment. Since
microarrays and high-throughput sequencing can provide the
expression levels of thousands of genes in the human genome
simultaneously, they are now widely used to identify the potential
therapeutic targets for MA (27).
In the present study, to increase the reliability of
the results, gene expression profile data were downloaded from the
microarrays GSE15824, GSE4290 and GSE19728, which all originated
from 3 independent research object groups, from the GEO database.
For comparisons with the normal brain, the upregulated DEGs of
high-grade gliomas were organized, subjected to GO and KEGG pathway
annotation, and used to construct the PPI network and for
functional module analysis.
The results from these 2 technologies were
comparable in terms of the ECM-related terms identified.
The ECM is comprised of a collection of
extracellular molecules, including a mesh of fibrous proteins and
glycosaminoglycans (GAGs), that are secreted by cells, providing
the basis for cellular autonomy and cellular cooperation (28). The interactions between tumor cells
and the host are key for the invasion of tumor cells (29). It has been previously reported that
cell adhesion and migration in gliomas were increased by several
ECM components, such as laminin (30,31)
and collagen (32,33). The results of the present study
support the notion that the ECM is important for the invasion of
MA.
In addition, in this study, from the results of GO
and KEGG analysis, it was indicated that cell adhesion and the
PI3K/Akt signaling pathway may be of particular interest. Cell
adhesion is a biological process through which cells interact and
attach to ECM component or other cells. It is mediated by
interactions between molecules on the cell surface and occurs via
transmembrane cell adhesion molecules. Previous studies have
demonstrated that a number of cell adhesion molecules are
aberrantly expressed in gliomas and are involved in its malignant
progression (34,35). The PI3K/Akt signaling pathway is a
signal transduction pathway that promotes survival and growth in
response to extracellular signals and it also plays an important
role in the progression of tumors (36,37).
Previous studies have revealed that the PI3K/Akt signaling pathway
is abnormally expressed during malignant glioma progression
(38) and alterations in the
PI3K/Akt signaling pathway lead to glioma formation (39). The results of the present study
confirm the association between cell adhesion and the PI3K/Akt
signaling pathway and tumor invasion.
In order to further determine the tumor
invasion-related molecules, the present study generated Venn
diagrams to count the number of upregulated DEGs that existed in
both WHO grades III and IV (FC value: IV>III), and those that
were not presented in WHO grades I or II, in order to obtain the
genes that were mostly associated with the malignant progression of
tumor. A PPI network of the upregulated DEGs that existed in both
WHO grades III and IV (FC value: IV>III), was created and
analyzed using STRING and Cytoscape software; this allowed for the
acquisition of genes that were in the most relevant module for MA
invasion. Considering these two results, it was hypothesized that
COL1A1 and LAMC1 may be the two most probable genes
to be related to MA invasion.
COL1A1 is a key component of the ECM and plays an
important role in cell adhesion and differentiation. A previous
in vitro silencing experiment also demonstrated that COL1A1
was involved in GBM cell invasion (40). A recent study revealed that there
was a higher expression of COL1A1 in GBM than in low-grade gliomas
(6). By searching the Human
Protein Atlas, the present study also observed that some MA tumor
cells exhibited COL1A1 positive staining.
LAMC1 belongs to the laminins family of ECM
glycoproteins. It has been reported that a high expression of LAMC1
together with a large GBM tumor size may be associated with a
shorter median OS (41).
In order to further clarify the clinical
significance of the abnormal changes in COL1A1 and LAMC, the
present study utilized the Survival KM estimate on cBioportal TCGA
online. The results demonstrated that COL1A1 was associated with
the survival rate and recurrence in patients with MA, while LAMC1
was not. Of note, in patients with LGG, both LAMC1 and COL1A1 had
significant effects on the survival KM curve. Therefore, it was
concluded that, although COL1A1 and LAMC1 are closely related to MA
invasion, their abnormal expression levels exert differential
effects on patient survival and recurrence, which were also
associated with the pathological levels in glioma patients. While
COL1A1 exerted significant effects on the survival and recurrence
of both GBM and LGG, the abnormal expression of LAMC1 only had
significant effects on the survival and recurrence rate of LGG. In
addition, using the above-mentioned bioinformatics approach, the
present study revealed that COL1A1 was the most likely
invasion-related DEG in MA.
Bioinformatics analysis was applied to predict the
functions of DEGs in MA; it was assumed that an assessment such as
this should accompany several experimental parameters. The present
study confirmed some of the aforementioned results through
experiments using a cell model of MA. The expression of COL1A1 in
the U251M cell line was associated with an increase in cell
motility and invasiveness. An in vitro Transwell assay
revealed that cells in which COL1A1 was knocked down were less
invasive than the control cells. These results were consistent with
those of the bioinformatics analysis, as well as those of the
aforementioned previous studies. A recent study performed by
Balbous et al (40), which
aimed to identify a mesenchymal glioma stem cell profile, reported
that the silencing of COL1A1 resulted in a significant reduction in
cell invasive capabilities.
However, it is important to identify which signaling
pathways are involved in COL1A1-induced glioma invasion. In this
study, following a literature research, three signaling pathways,
Janus kinase (JAK)/STAT3, PI3K/Akt and NF-κB, were identified to be
closely related to glioma invasion.
When the JAK/STAT3 signaling pathway is activated,
STAT3 is phosphorylated and p-STAT3 forms dimers that are then
translocated to the nucleus. As a result, these activities may
facilitate transcription and expression of genes related to the
cell cycle (42), cell
proliferation (43), invasion and
metastasis (44). Furthermore, the
cell invasive ability is known to have a close association with the
degradation of ECM, and MMPs, which downstream of the PI3K/AKT
signaling pathway, are also involved in these events. Previous
studies have reported that there is an association between tumor
invasion and the expression of MMP-2 and MMP-9 (45,46).
Additionally, the sustained activation of NF-κB in gliomas has also
been reported (47). The aberrant
activation of NF-κB has been shown to play key roles in a range of
biological behaviors, such as cell proliferation (48), angiogenesis (49), metastasis (50) and invasion (51). Of note, there is crosstalk between
the three pathways. NF-κB signaling leads to MMP activation
(52). JAK overexpression induces
the activation of NF-κB, which frequently cooperates with STAT3 to
upregulate metastasis, promoting genes such as MMPs and cytokines
(53). As p-STAT3, NF-κB and MMPs
are known to be crucial factors that may facilitate tumor invasion,
it was hypothesized that they may also be involved in
COL1A1-induced glioma cell invasion.
To text this hypothesis, in this study, experiments
were designed and performed; key factors within these signaling
pathways were investigated by western blotting. The downregulation
of COL1A1 in the U251MG or U87MG cells reduced the protein levels
of the recognized invasion-related factors, such as p-STAT3, MMP-2,
MMP-9 and NF-κB, suggesting that the JAK/STAT3, PI3K/AKT and NF-κB
signaling path-ways may be involved in COL1A1-mediated
invasion.
The results of the present study are in agreement
with those of a previous study that demonstrated that there was
elevated COL1A1 expression in cancer (54). A previous in vitro study
also suggested that COL1A1 activity may promote cancer cell
proliferation and/or invasion (7).
However, to the best of our knowledge, no studies to date have
analyzed COL1A1 expression in gliomas, and as such, this may be one
of the first reports. Unfortunately, the present study did not
fully elucidate the mechanism underlying how COL1A1 affects these
signaling pathways.
The identification of COL1A1 within gliomas provides
the basis for future targeted treatments; the overexpression of
COL1A1 facilitating cell invasion in glioma is a major therapeutic
target. In the future, this may be a key prognostic factor for
predicting OS.
Based on the high throughput data using
bioinformatics technologies, the present study further investigated
the MA microarray data. The results revealed that 'ECM', 'cell
adhesion', and 'PI3K-Akt signaling pathway' were the most closely
related GO or KEGG terms associated with MA invasion. In addition,
further analysis highlighted COL1A1 and LAMC1 as
major genes involved in MA invasion. Due to its correlation with
the survival and recurrence of MA, COL1A1 may be a candidate
biomarker for the prognosis and treatment of MA. Future experiments
may provide evidence that COL1A1 may contribute to glioma invasion
and participate in the JAK/STAT3, PI3K/Akt and NF-κB signaling
pathways.
Acknowledgments
Not applicable.
Funding
This study was funded by the National Natural
Science Research Foundation of China (grant no. 81772688). The
writer would like to express his deep gratitude to the research
team.
Availability of data and materials
The datasets used and/or analyzed during the current
study are available from the corresponding author on reasonable
request.
Authors' contributions
SS was involved in the conception and design of the
study, project administration and drafted the manuscript; YWa
performed most of the experiments and conducted the submission of
the manuscript; YWu collected data from the internet, performed
Bioinformatics analyses and organized the figures and tables; YG,
QL, AAA, XFL and GQJ performed literature search. JG, LL, and FPW
studied conception and design; YQL was involved in the conception
and design of the study, and project supervision; DSG acquired the
funding, was involved in the conception and design of the study,
supervised the study and critically reviewed the manuscript. All
authors have read and approved the final manuscript
Ethics approval and consent to
participate
Not applicable.
Patient consent for publication
Not applicable.
Competing interests
The authors declare that they have no competing
interests.
References
|
1
|
Van Meir EG, Hadjipanayis CG, Norden AD,
Shu HK, Wen PY and Olson JJ: Exciting new advances in
neurooncology: The avenue to a cure for malignant glioma. CA Cancer
J Clin. 60:166–193. 2010. View Article : Google Scholar : PubMed/NCBI
|
|
2
|
Dolecek TA, Propp JM, Stroup NE and
Kruchko C: CBTRUS statistical report: Primary brain and central
nervous system tumors diagnosed in the United States in 2005-2009.
Neuro-oncol. 14(Suppl 5): v1–v49. 2012. View Article : Google Scholar : PubMed/NCBI
|
|
3
|
Kulasingam V and Diamandis EP: Strategies
for discovering novel cancer biomarkers through utilization of
emerging technologies. Nat Clin Pract Oncol. 5:588–599. 2008.
View Article : Google Scholar : PubMed/NCBI
|
|
4
|
Muhammad SA, Raza W, Nguyen T, Bai B, Wu X
and Chen J: Cellular Signaling Pathways in Insulin
Resistance-Systems Biology Analyses of Microarray Dataset Reveals
New Drug Target Gene Signatures of Type 2 Diabetes Mellitus. Front
Physiol. 8:132017. View Article : Google Scholar : PubMed/NCBI
|
|
5
|
Wu YH, Chang TH, Huang YF, Huang HD and
Chou CY: COL11A1 promotes tumor progression and predicts poor
clinical outcome in ovarian cancer. Oncogene. 33:3432–3440. 2014.
View Article : Google Scholar
|
|
6
|
Mustafa DA, Sieuwerts AM, Zheng PP and
Kros JM: Overexpression of Colligin 2 in Glioma Vasculature is
Associated with Overexpression of Heat Shock Factor 2. Gene Regul
Syst Bio. 4:103–107. 2010.PubMed/NCBI
|
|
7
|
Wang Q and Yu J: MiR-129-5psuppresses
gastric cancer cell invasion and proliferation by inhibiting
COL1A1. Biochem Cell Biol. 96:19–25. 2018. View Article : Google Scholar
|
|
8
|
Ilhan-Mutlu A, Siehs C, Berghoff AS,
Ricken G, Widhalm G, Wagner L and Preusser M: Expression profiling
of angiogenesis-related genes in brain metastases of lung cancer
and melanoma. Tumour Biol. 37:1173–1182. 2016. View Article : Google Scholar
|
|
9
|
Gautier L, Cope L, Bolstad BM and Irizarry
RA: affy - analysis of Affymetrix GeneChip data at the probe level.
Bioinformatics. 20:307–315. 2004. View Article : Google Scholar : PubMed/NCBI
|
|
10
|
Sun L, Hui AM, Su Q, Vortmeyer A,
Kotliarov Y, Pastorino S, Passaniti A, Menon J, Walling J, Bailey
R, et al: Neuronal and glioma-derived stem cell factor induces
angiogenesis within the brain. Cancer Cell. 9:287–300. 2006.
View Article : Google Scholar : PubMed/NCBI
|
|
11
|
Grzmil M, Morin P Jr, Lino MM, Merlo A,
Frank S, Wang Y, Moncayo G and Hemmings BA: MAP kinase-interacting
kinase 1 regulates SMAD2-dependent TGF-β signaling pathway in human
glioblastoma. Cancer Res. 71:2392–2402. 2011. View Article : Google Scholar : PubMed/NCBI
|
|
12
|
Liu Z, Yao Z, Li C, Lu Y and Gao C: Gene
expression profiling in human high-grade astrocytomas. Comp Funct
Genomics. 2011:2451372011. View Article : Google Scholar : PubMed/NCBI
|
|
13
|
Gentleman RC, Carey VJ, Bates DM, Bolstad
B, Dettling M, Dudoit S, Ellis B, Gautier L, Ge Y, Gentry J, et al:
Bioconductor: Open software development for computational biology
and bioinformatics. Genome Biol. 5:R802004. View Article : Google Scholar : PubMed/NCBI
|
|
14
|
Lahti L, Torrente A, Elo LL, Brazma A and
Rung J: A fully scalable online pre-processing algorithm for short
oligonucleotide microarray atlases. Nucleic Acids Res. 41:e1102013.
View Article : Google Scholar : PubMed/NCBI
|
|
15
|
Ashburner M, Ball CA, Blake JA, Botstein
D, Butler H, Cherry JM, Davis AP, Dolinski K, Dwight SS, Eppig JT,
et al: The Gene Ontology Consortium: Gene ontology: Tool for the
unification of biology. Nat Genet. 25:25–29. 2000. View Article : Google Scholar : PubMed/NCBI
|
|
16
|
Lomax J: Get ready to GO! A biologist's
guide to the Gene Ontology. Brief Bioinform. 6:298–304. 2005.
View Article : Google Scholar : PubMed/NCBI
|
|
17
|
Kanehisa M, Furumichi M, Tanabe M, Sato Y
and Morishima K: KEGG: New perspectives on genomes, pathways,
diseases and drugs. Nucleic Acids Res. 45(D1): D353–D361. 2017.
View Article : Google Scholar :
|
|
18
|
Dennis G Jr, Sherman BT, Hosack DA, Yang
J, Gao W, Lane HC and Lempicki RA: DAVID: Database for Annotation,
Visualization, and Integrated Discovery. Genome Biol. 4:32003.
View Article : Google Scholar
|
|
19
|
Szklarczyk D, Franceschini A, Wyder S,
Forslund K, Heller D, Huerta-Cepas J, Simonovic M, Roth A, Santos
A, Tsafou KP, et al: STRING v10: Protein-protein interaction
networks, integrated over the tree of life. Nucleic Acids Res.
43(D1): D447–D452. 2015. View Article : Google Scholar
|
|
20
|
Shannon P, Markiel A, Ozier O, Baliga NS,
Wang JT, Ramage D, Amin N, Schwikowski B and Ideker T: Cytoscape: A
software environment for integrated models of biomolecular
interaction networks. Genome Res. 13:2498–2504. 2003. View Article : Google Scholar : PubMed/NCBI
|
|
21
|
Bader GD and Hogue CW: An automated method
for finding molecular complexes in large protein interaction
networks. BMC Bioinformatics. 4:22003. View Article : Google Scholar : PubMed/NCBI
|
|
22
|
Bindea G, Mlecnik B, Hackl H, Charoentong
P, Tosolini M, Kirilovsky A, Fridman WH, Pagès F, Trajanoski Z and
Galon J: ClueGO: A Cytoscape plug-in to decipher functionally
grouped gene ontology and pathway annotation networks.
Bioinformatics. 25:1091–1093. 2009. View Article : Google Scholar : PubMed/NCBI
|
|
23
|
Bindea G, Galon J and Mlecnik B: CluePedia
Cytoscape plugin: Pathway insights using integrated experimental
and in silico data. Bioinformatics. 29:661–663. 2013. View Article : Google Scholar : PubMed/NCBI
|
|
24
|
Uhlén M, Fagerberg L, Hallström BM,
Lindskog C, Oksvold P, Mardinoglu A, Sivertsson Å, Kampf C,
Sjöstedt E, Asplund A, et al: Proteomics. Tissue-based map of the
human proteome. Science. 347:12604192015. View Article : Google Scholar : PubMed/NCBI
|
|
25
|
Cerami E, Gao J, Dogrusoz U, Gross BE,
Sumer SO, Aksoy BA, Jacobsen A, Byrne CJ, Heuer ML, Larsson E, et
al: The cBio cancer genomics portal: An open platform for exploring
multi-dimensional cancer genomics data. Cancer Discov. 2:401–404.
2012. View Article : Google Scholar : PubMed/NCBI
|
|
26
|
Cancer Genome Atlas Research Network:
Comprehensive genomic characterization defines human glioblastoma
genes and core pathways. Nature. 455:1061–1068. 2008. View Article : Google Scholar : PubMed/NCBI
|
|
27
|
Loging WT, Lal A, Siu IM, Loney TL,
Wikstrand CJ, Marra MA, Prange C, Bigner DD, Strausberg RL and
Riggins GJ: Identifying potential tumor markers and antigens by
database mining and rapid expression screening. Genome Res.
10:1393–1402. 2000. View Article : Google Scholar : PubMed/NCBI
|
|
28
|
Michel G, Tonon T, Scornet D, Cock JM and
Kloareg B: The cell wall polysaccharide metabolism of the brown
alga Ectocarpus siliculosus. Insights into the evolution of
extracellular matrix polysaccharides in Eukaryotes. New Phytol.
188:82–97. 2010. View Article : Google Scholar : PubMed/NCBI
|
|
29
|
Pauli BU, Schwartz DE, Thonar EJ and
Kuettner KE: Tumor invasion and host extracellular matrix. Cancer
Metastasis Rev. 2:129–152. 1983. View Article : Google Scholar : PubMed/NCBI
|
|
30
|
Goldbrunner RH, Haugland HK, Klein CE,
Kerkau S, Roosen K and Tonn JC: ECM dependent and integrin mediated
tumor cell migration of human glioma and melanoma cell lines under
serum-free conditions. Anticancer Res. 16(6B): 3679–3687.
1996.PubMed/NCBI
|
|
31
|
Ljubimova JY, Fujita M, Khazenzon NM,
Ljubimov AV and Black KL: Changes in laminin isoforms associated
with brain tumor invasion and angiogenesis. Front Biosci. 11:81–88.
2006. View Article : Google Scholar
|
|
32
|
Senner V, Ratzinger S, Mertsch S, Grässel
S and Paulus W: Collagen XVI expression is upregulated in
glioblastomas and promotes tumor cell adhesion. FEBS Lett.
582:3293–3300. 2008. View Article : Google Scholar : PubMed/NCBI
|
|
33
|
Maestro RD, Shivers R, McDonald W and
Maestro AD: Dynamics of C6 astrocytoma invasion into
three-dimensional collagen gels. J Neurooncol. 53:87–98. 2001.
View Article : Google Scholar : PubMed/NCBI
|
|
34
|
Izumoto S, Ohnishi T, Arita N, Hiraga S,
Taki T and Hayakawa T: Gene expression of neural cell adhesion
molecule L1 in malignant gliomas and biological significance of L1
in glioma invasion. Cancer Res. 56:1440–1444. 1996.PubMed/NCBI
|
|
35
|
Wang YB, Hu Y, Li Z, Wang P, Xue YX, Yao
YL, Yu B and Liu YH: Artemether combined with shRNA interference of
vascular cell adhesion molecule-1 significantly inhibited the
malignant biological behavior of human glioma cells. PLoS One.
8:e608342013. View Article : Google Scholar : PubMed/NCBI
|
|
36
|
Osaki M, Oshimura M and Ito H: PI3K-Akt
pathway: its functions and alterations in human cancer. Apoptosis.
9:667–676. 2004. View Article : Google Scholar : PubMed/NCBI
|
|
37
|
Cantley LC and Neel BG: New insights into
tumor suppression: PTEN suppresses tumor formation by restraining
the phosphoinositide 3-kinase/AKT pathway. Proc Natl Acad Sci USA.
96:4240–4245. 1999. View Article : Google Scholar : PubMed/NCBI
|
|
38
|
Choe G, Horvath S, Cloughesy TF, Crosby K,
Seligson D, Palotie A, Inge L, Smith BL, Sawyers CL and Mischel PS:
Analysis of the phosphatidylinositol 3′-kinase signaling pathway in
glioblastoma patients in vivo. Cancer Res. 63:2742–2746.
2003.PubMed/NCBI
|
|
39
|
Yuan TL and Cantley LC: PI3K pathway
alterations in cancer: Variations on a theme. Oncogene.
27:5497–5510. 2008. View Article : Google Scholar : PubMed/NCBI
|
|
40
|
Balbous A, Cortes U, Guilloteau K,
Villalva C, Flamant S, Gaillard A, Milin S, Wager M, Sorel N,
Guilhot J, et al: A mesen-chymal glioma stem cell profile is
related to clinical outcome. Oncogenesis. 3:e912014. View Article : Google Scholar
|
|
41
|
Huang SX, Zhao ZY, Weng GH, He XY, Wu CJ,
Fu CY, Sui ZY, Zhong XM and Liu T: The correlation of microRNA-181a
and target genes with poor prognosis of glioblastoma patients. Int
J Oncol. 49:217–224. 2016. View Article : Google Scholar : PubMed/NCBI
|
|
42
|
Sainz-Perez A, Gary-Gouy H, Gaudin F,
Maarof G, Marfaing-Koka A, de Revel T and Dalloul A: IL-24 induces
apoptosis of chronic lymphocytic leukemia B cells engaged into the
cell cycle through dephosphorylation of STAT3 and stabilization of
p53 expression. J Immunol. 181:6051–6060. 2008. View Article : Google Scholar : PubMed/NCBI
|
|
43
|
Zhang Y, Jia Y, Li P, Li H, Xiao D, Wang Y
and Ma X: Reciprocal activation of α5-nAChR and STAT3 in
nicotine-induced human lung cancer cell proliferation. J Genet
Genomics. 44:355–362. 2017. View Article : Google Scholar : PubMed/NCBI
|
|
44
|
Sp N, Kang DY, Kim DH, Park JH, Lee HG,
Kim HJ, Darvin P, Park YM and Yang YM: Nobiletin Inhibits
CD36-Dependent Tumor Angiogenesis, Migration, Invasion, and Sphere
Formation Through the Cd36/Stat3/Nf-Kb Signaling Axis. Nutrients.
10:102018. View Article : Google Scholar
|
|
45
|
Liabakk NB, Talbot I, Smith RA, Wilkinson
K and Balkwill F: Matrix metalloprotease 2 (MMP-2) and matrix
metalloprotease 9 (MMP-9) type IV collagenases in colorectal
cancer. Cancer Res. 56:190–196. 1996.PubMed/NCBI
|
|
46
|
Sugiura Y, Shimada H, Seeger RC, Laug WE
and DeClerck YA: Matrix metalloproteinases-2 and -9 are expressed
in human neuroblastoma: Contribution of stromal cells to their
production and correlation with metastasis. Cancer Res.
58:2209–2216. 1998.PubMed/NCBI
|
|
47
|
Nagai S, Washiyama K, Kurimoto M, Takaku
A, Endo S and Kumanishi T: Aberrant nuclear factor-kappaB activity
and its participation in the growth of human malignant astrocytoma.
J Neurosurg. 96:909–917. 2002. View Article : Google Scholar : PubMed/NCBI
|
|
48
|
Huang F, Xiong X, Wang H, You S and Zeng
H: Leptin-induced vascular smooth muscle cell proliferation via
regulating cell cycle, activating ERK1/2 and NF-kappaB. Acta
Biochim Biophys Sin (Shanghai). 42:325–331. 2010. View Article : Google Scholar
|
|
49
|
Ni H, Zhao W, Kong X, Li H and Ouyang J:
Celastrol inhibits lipopolysaccharide-induced angiogenesis by
suppressing TLR4-triggered nuclear factor-kappa B activation. Acta
Haematol. 131:102–111. 2014. View Article : Google Scholar
|
|
50
|
Hsiao YT, Fan MJ, Huang AC, Lien JC, Lin
JJ, Chen JC, Hsia TC, Wu RS and Chung JG: Deguelin Impairs Cell
Adhesion, Migration and Invasion of Human Lung Cancer Cells through
the NF-[Formula: See text]B Signaling Pathways. Am J Chin Med.
46:209–229. 2018. View Article : Google Scholar
|
|
51
|
Zhang J, Xu YJ, Xiong WN, Zhang ZX, Du CL,
Qiao LF, Ni W and Chen SX: Inhibition of NF-kappaB through
IkappaBalpha transfection affects invasion of human lung cancer
cell line A549. Ai Zheng. 27:710–715. 2008.In Chinese. PubMed/NCBI
|
|
52
|
Shihab PK, Al-Roub A, Al-Ghanim M, Al-Mass
A, Behbehani K and Ahmad R: TLR2 and AP-1/NF-kappaB are involved in
the regulation of MMP-9 elicited by heat killed Listeria
monocytogenes in human monocytic THP-1 cells. J Inflamm (Lond).
12:322015. View Article : Google Scholar
|
|
53
|
Teng Y, Ross JL and Cowell JK: The
involvement of JAK-STAT3 in cell motility, invasion, and
metastasis. JAK-STAT. 3:e280862014. View Article : Google Scholar : PubMed/NCBI
|
|
54
|
Liu S, Liao G and Li G: Regulatory effects
of COL1A1 on apoptosis induced by radiation in cervical cancer
cells. Cancer Cell Int. 17:732017. View Article : Google Scholar : PubMed/NCBI
|