Introduction
The incidence of breast cancer continues to increase
globally. According to the most recent Globocan estimates (2012),
breast cancer ranks as the fifth highest cause of mortality from
cancer overall, and is the most frequent cause of cancer
mortalities in women in developing countries (1). In Africa, there is a substantial
variation in the estimated breast cancer incidence across different
regions, which may be attributed to the exposure to different
environmental factors (2). South
Africa (SA) presents the highest incidence of breast cancer,
affecting primarily young women (≤50 years old), who are diagnosed
at a mean age of 10 years younger compared with women in Western
countries. However, the mortality rates in SA remain high (~17%)
among female populations of all ages, potentially due to the late
stage of the disease at diagnosis (1). The high rates of incidence and
mortality are due to multiple and complex social, cultural and
economic factors that directly impact breast cancer diagnosis and
response to treatment. The health care system in SA and other
Sub-Saharan countries, in general, face inadequate health
personnel, offer poor health insurance programs and limited
facilities for cancer screening and treatment, and are compounded
by prohibitive costs for breast biopsies and pathological exams
(3). Other factors involve
lifestyle-associated risks including smoking, alcohol consumption
and high fat diets (4). In
addition, several studies have demonstrated that in the Sub-Saharan
region, including SA, there is an over-representation of breast
cancer subtypes that denote poorer prognosis, most notably among
pre-menopausal women (5-9). Although the standard classification
of breast cancer, based on three surrogate immunohistochemistry
(IHC) markers, the estrogen (ER), progesterone (PR) and human
epidermal growth factor receptor 2 (HER2) receptors, is not
routinely performed in the majority of SA cancer centers, but
studies have demonstrated the prevalence of hormonal negative tumor
subtypes, including a high rate of triple negative breast cancer
(TNBC) and HER2-positive tumor subtypes. These two subtypes are
known to present a clinically aggressive phenotype, including
resistance to treatment and high rates of disease recurrence
(7-9). Although the determinants for the high
prevalence of these unfavorable tumor subtypes is unclear, several
studies implicate intrinsic genetic differences, such as the
presence of founder mutations in breast cancer susceptibility
genes, including the BRCA1 gene (10-12)
or unknown genomic variants identified by genomic wide association
studies (13-16).
The extensive characterization of the molecular
profiling in breast cancer with the use of multiomics platforms,
have allowed for extraordinary progress in the understanding of the
biological factors and their clinical impact on each breast cancer
subtype (17,18). In African countries, however, they
remain poorly characterized, mainly due to the unavailability and
the high costs of such platforms in addition to the poor annotation
of patients’ clinical data (19).
Among the African countries, SA has the highest number of published
genomic research studies (assessed between 2004-2013), however only
6.1% of these studies are associated with cancer (20). To the best of our knowledge, few
breast cancer studies have characterized patient genomic profiles
and/or specific molecular alterations in their populations
(14,21-25).
As a consequence, there is limited knowledge on their tumor biology
and the corresponding lack of clinically relevant biomarkers that
would be particularly beneficial for the prognosis and treatment of
patients with breast cancer representative of the diverse racial
groups of SA.
The integrity of the genome is crucial for tumor
suppression. Genomic instability, one of the hallmarks of cancer,
can be evidenced by the presence of DNA copy number changes
(26,27). The presence of gains and losses in
specific cytobands of chromosomes is a clear evidence of loss of
the genomic integrity control cancers (28). The recurrence of these specific
alterations, which may affect the function of cancer driver genes
mapped in these regions, including oncogenes and tumor suppressors,
occurs during tumor progression and may also facilitate this
process (29).
In the present study, the main aim was to determine
the patterns of the genome-wide copy number alterations (CNAs) and
their potential impact on functional cellular pathways targeted by
cancer driver genes in patients with breast cancer from the Western
Cape region of SA. This study further assessed the correlations
between the genomic results with the patients clinicopathological
data. In addition, considering the extensive genetic diversity of
the SA population, composed of groups originating from Europe, Asia
and various African countries, the present study also aimed to
determine whether the main copy number patterns observed were
associated with patient’s ethnicity.
Materials and methods
Sample population
Formalin-fixed paraffin-embedded (FFPE) breast tumor
specimens were obtained from 28 female patients from the archives
of the Division of Anatomical Pathology, National Health Laboratory
Services, Groote Schuur Hospital (Cape Town, SA). These cases were
obtained retrospectively between 2006 and 2010 with ethical
approval from the Groote Schuur Hospital (Human Research Ethics
Committee protocol no. 454/2010); patient identities were kept
anonymous at all stages of the study. The specimens were collected
at diagnosis and prior to any cancer treatment. The clinical data
pertaining to age, ethnicity, tumor stage and receptor status were
obtained for each patient. The mean age of the study population at
diagnosis was 48.2±12.9 years, ranging from 22 to 80 years old. All
cases were of infiltrating ductal carcinoma and the mean tumor size
was 40.6±18.9 mm. Tumor types were classified according to the
Tumor Node Metastasis staging system (30) and were of grade 1, 2 and 3 in 16%,
44%, and 40% of the cases, respectively. Stages I, II and III were
observed in 7.4%, 22.2%, and 70.4% of the cases, respectively. The
cases were evaluated for ER, PR and HER2 receptor status by IHC, as
previously described (31,32). ER and HER2 positivity was observed
in 57.1% and 53.8% of cases, respectively. PR status was available
for only 21.4% of the patients, out of which 33% (2/6) were
positive. Three patients were of the TNBC subtype.
Information regarding ethnicity was obtained from
self-reported records. The majority of the patients were of the
Colored group (57.1%), while 21.4% were White, 17.9% were Black and
3.6% were Asian. Based on the South African census nomenclature and
definitions, these categories refer to people with common
characteristics in terms of history and descent, which were mostly
defined in the Apartheid period (31). The Colored group is composed of
highly admixed individuals who present ancestry from Europe and
Asia and various indigenous tribes of SA. They form the majority
population of the Western Cape region, and genetic studies have
demonstrated that they are mainly descendants of the Khoisan tribe
(31,32). White refers to people of European
descent, mainly from the Netherlands, Germany, France and England.
Black refers to individuals of African tribe origin including Zulu,
Xhosa and Basotho tribes (31).
The samples were not selected based on any of the clinical
information and ethnicity. The main inclusion criteria, subsequent
to institutional review board local approval, included patients
with invasive breast cancer and with known hormonal and ERBB2
status and clinicopathological data. The distribution of the
clinicopathological data and ethnic groups in the studied
population is presented in Table
I.
 | Table IClinicopathological and ethnicity
information and corresponding CNAs observed in the South African
patients with breast cancer used in the present study. |
Table I
Clinicopathological and ethnicity
information and corresponding CNAs observed in the South African
patients with breast cancer used in the present study.
| Patient no. | Age | Ethnicity | Tu.Sizea | Tu.Grade | Tu.Stage | ER | PR | HER2 | CNA number | 2p25.3 | 4p16.3-p15 | 6p21-p25 8q11 | 16p13 | 19p13 | Xp22 |
|---|
| 1 | 56 | White | 40 | 2 | II | POS | NA | POS | 14 | No CNA | No CNA | No CNA Gain | Gain | No CNA | No CNA |
| 2 | 80 | Colored | 110 | 2 | III | POS | NA | NEG | 3 | No CNA | No CNA | No CNA No CNA | No CNA | No CNA | No CNA |
| 3 | 58 | Black | 33 | 2 | III | POS | NA | POS | 9 | Loss | Loss | Loss No CNA | No CNA | No CNA | Gain |
| 4 | 44 | Colored | 40 | 3 | II | NEG | NA | POS | 14 | No CNA | No CNA | No CNA No CNA | No CNA | No CNA | No CNA |
| 5 | 38 | Black | 50 | 3 | III | NEG | NEG | NEG | 2 | No CNA | No CNA | No CNA No CNA | No CNA | No CNA | No CNA |
| 6 | 57 | Colored | 19 | 2 | I | NEG | NA | POS | 12 | No CNA | No CNA | Gain Gain | No CNA | Gain | Gain |
| 7 | 57 | Colored | 25 | 3 | III | NEG | NA | POS | 5 | No CNA | No CNA | Loss Gain | No CNA | ampl. | No CNA |
| 8 | 60 | Colored | 55 | 1 | III | POS | NA | NEG | 5 | Deletion | Loss | Deletion No
CNA | No CNA | No CNA | Gain |
| 9 | 59 | Black | 50 | NA | III | POS | NA | NEG | 10 | No CNA | No CNA | Gain No CNA | Gain | Gain | Gain |
| 10 | 55 | White | 65 | 2 | III | POS | NA | POS | 5 | Deletion | Loss | Deletion No
CNA | No CNA | No CNA | Gain |
| 11 | 36 | White | 30 | 2 | III | POS | NA | NEG | 25 | No CNA | No CNA | ampl. Gain | ampl. | Gain | No CNA |
| 12 | 43 | Asian | 35 | 3 | II | NEG | NEG | NEG | 4 | Loss | No CNA | No CNA No CNA | No CNA | No CNA | No CNA |
| 13 | 44 | White | 58 | 2 | III | POS | NA | NEG | 5 | Loss | No CNA | No CNA Gain | No CNA | No CNA | No CNA |
| 14 | 46 | Colored | 20 | NA | NA | NA | NA | NA | 15 | No CNA | No CNA | Gain, loss
Gain | Gain | Gain | Gain |
| 15 | 45 | Black | 35 | 2 | III | POS | NA | NEG | 10 | No CNA | No CNA | ampl., loss No
CNA | No CNA | Gain | No CNA |
| 16 | 35 | Colored | 30 | NA | III | POS | NA | POS | 3 | No CNA | No CNA | No CNA Gain | No CNA | No CNA | No CNA |
| 17 | 40 | Black | 45 | 3 | III | NEG | NA | NEG | 7 | No CNA | No CNA | No CNA Gain | No CNA | No CNA | Gain |
| 18 | 29 | Colored | 45 | 1 | III | POS | POS | POS | 15 | Loss | Loss | ampl., loss No
CNA | Gain | Gain | Gain |
| 19 | 78 | Colored | 55 | 2 | III | POS | NA | NEG | 8 | No CNA | No CNA | ampl. No CNA | ampl. | Gain | Gain |
| 20 | 55 | Colored | 60 | 3 | III | NEG | NA | POS | 1 | No CNA | No CNA | No CNA No CNA | No CNA | No CNA | No CNA |
| 21 | 39 | Colored | 25 | 2 | III | NEG | NEG | POS | 15 | Loss | Loss | ampl., loss No
CNA | Gain | Gain | Gain |
| 22 | 38 | White | 18 | 1 | I | POS | POS | NEG | 12 | Deletion | Loss | Deletion No
CNA | No CNA | Gain | ampl. |
| 23 | 51 | White | 30 | 2 | II | POS | NA | NEG | 2 | No CNA | No CNA | No CNA No CNA | No CNA | No CNA | Gain |
| 24 | 49 | Colored | 45 | 3 | III | NEG | NEG | NEG | 3 | No CNA | Loss | No CNA No CNA | No CNA | No CNA | Gain |
| 25 | 48 | Colored | 25 | 3 | II | POS | NA | POS | 1 | No CNA | No CNA | No CNA No CNA | No CNA | No CNA | No CNA |
| 26 | 36 | Colored | 24 | 3 | III | NEG | NA | POS | 8 | Deletion | Loss | Deletion No
CNA | No CNA | No CNA | ampl. |
| 27 | 22 | Colored | 40 | 3 | III | POS | NA | POS | 8 | No CNA | No CNA | ampl. No CNA | ampl. | ampl. | Gain |
| 28 | 53 | Colored | 30 | 1 | II | POS | NA | POS | 22 | No CNA | Loss | Gain Gain | Gain | no CNA | Gain |
Array-comparative genomic hybridization
(array-CGH) analysis
DNA copy number analysis was performed using an
oligonucleotide array-CGH platform (SurePrint G3 Human CGH
Microarray 8×60K; Agilent Technologies Inc., Santa Clara, CA, USA),
according to the protocol for FFPE samples that were established as
previously described (33,34). Prior to DNA isolation, 5-μm
sections of FFPE tissue from each case were evaluated by a
pathologist from the Division of Anatomical Pathology, University
of Cape Town (National Health Laboratory Service, Groote Schuur
Hospital, Cape Town), to confirm the tumor histopathology and the
presence of breast epithelial cancer cells. These cells were
identified and microdissected in tissue sections that were 5
μm thick from consecutive unstained slides to ensure the
array-CGH analysis of a pure tumor cell population. DNA was
isolated using the standard phenol-chlorophorm method as was
previously described (32). Normal
(reference) DNA was prepared from the peripheral blood of a pool of
multiple healthy female donors, as previously described (35,36).
Equal amounts of tumor and reference genomic DNA (300-500 ng) were
digested and enzymatically labeled using the SureTag Complete DNA
Labeling kit (Agilent Technologies, Inc.) and hybridized to the
arrays, according to the manufacture’s protocols. The array data
was analyzed using the Feature Extraction v.10.10 and Agilent
Cytogenomics v.3.0 software (Agilent Technologies Inc.), (ADM)
after aberration detection method-2 algorithm, a threshold of 6.0
and an aberration filter with a minimum number of >3 probes.
Copy number gains and losses were defined as previously described
(34): Minimum mean absolute
log2 ratio [intensity of the Cy5 dye (reference
DNA)/intensity of the Cy3 dye (test DNA) value] of ≥0.25 and
≤-0.25, respectively, as per the array-CGH analytics analysis.
Amplifications and deletions were determined using values of
log2≥2 and log2≤-2, respectively.
Functional enriched pathways
The identification of the genes and microRNAs
(miRNAs) mapped in the cytobands that presented CNAs was obtained
from the Agilent Cytogenomics v.7.0 (Agilent Technologies, Inc.)
interval base reports (based on the analysis parameters described
above). DIANA-miRPath v.3 (37)
was used to perform the pathway enrichment analysis, based on the
Kyoto Encyclopedia of Genes and Genomes database (37). miRNA targets were identified using
TarBase v.7.0 (38). Only
miRNA/mRNA targets that presented a miRNA Target Gene (miTG) score
>0.7 based on the microT-CDS (39) interactions were included.
Correlation of CNAs with
clinicopathological data and ethnicity
Spearman bivariate correlation analysis was
performed to determine the association among the number of CNAs and
the most frequent affected cytobands with patient
clinicopathological data (age <50 or ≥50 years, mean tumor size
+ and - standard deviation, tumor grades 1-3, tumor stages I-III,
ER and HER2 expression status) and ethnicity. Data is presented as
Spearman’s correlation coefficient (r), and P<0.05 was
considered to indicate a statistically significant difference.
Statistical analysis was performed using SPSS Statistics 20 (IBM
Corp., Armonk, NY, USA).
Results
DNA copy number changes
Array-CGH analysis was performed for all cases. The
CNAs ranged from 1 to 25, with a mean number of 8.68±6.18 CNAs per
case. Twelve cases presented CNAs above or equal the mean and 16
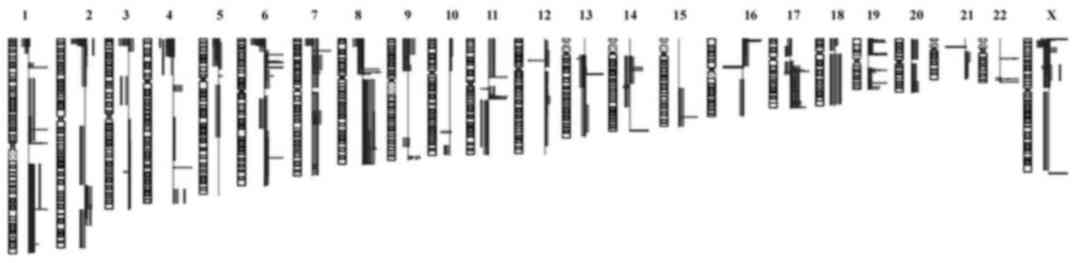
cases below. The combined genomic profile of the cases analyzed are
presented in Fig. 1. The most
frequent affected chromosome cytobands were Xp22.3 and 6p21-p25
(57.14% of the cases), 19p13.3-p13.11 (35.7%), followed by
2p25.3-p24.3, 4p16.3-p15.3, 8q11.1-q24.3 and 16 p13.3-p11.2
(32.14%) (Table I). Chromosomes 2p
and 4p were mostly affected by losses and deletions of copy number,
whereas chromosomes 8q, 16p and Xp by gains and amplifications, and
chromosome 6p by gains and amplifications (mainly 6p22.2-p21) and
losses/deletions (mainly 6p25-p24).
A higher number of CNAs (CNAs ≥8.68) were
significantly correlated with the cases that present with CNAs in
the 6p (r=0.458; P<0.05), 16p (r=0.486; P<0.01) and 19p
(r=0.486; P<0.01) cytobands. CNAs on 2p were significantly
correlated with CNAs on 4p (r=0.580; P<0.001); CNAs on 4p were
significantly correlated with CNAs on 6p (r=0.442; P<0.05) and
Xp (r=0.596; P<0.001); CNAs on 6p were significantly correlated
with CNAs on 19p (r=0.697; P<0.001) and Xp (r=0.563; P<0.01)
and CNAs on 16p were significantly correlated with CNAs on 19p
(r=0.542; P<0.01).
The identification of the genes mapped in these
cytobands, using the Agilent Cytogenomics interval base reports,
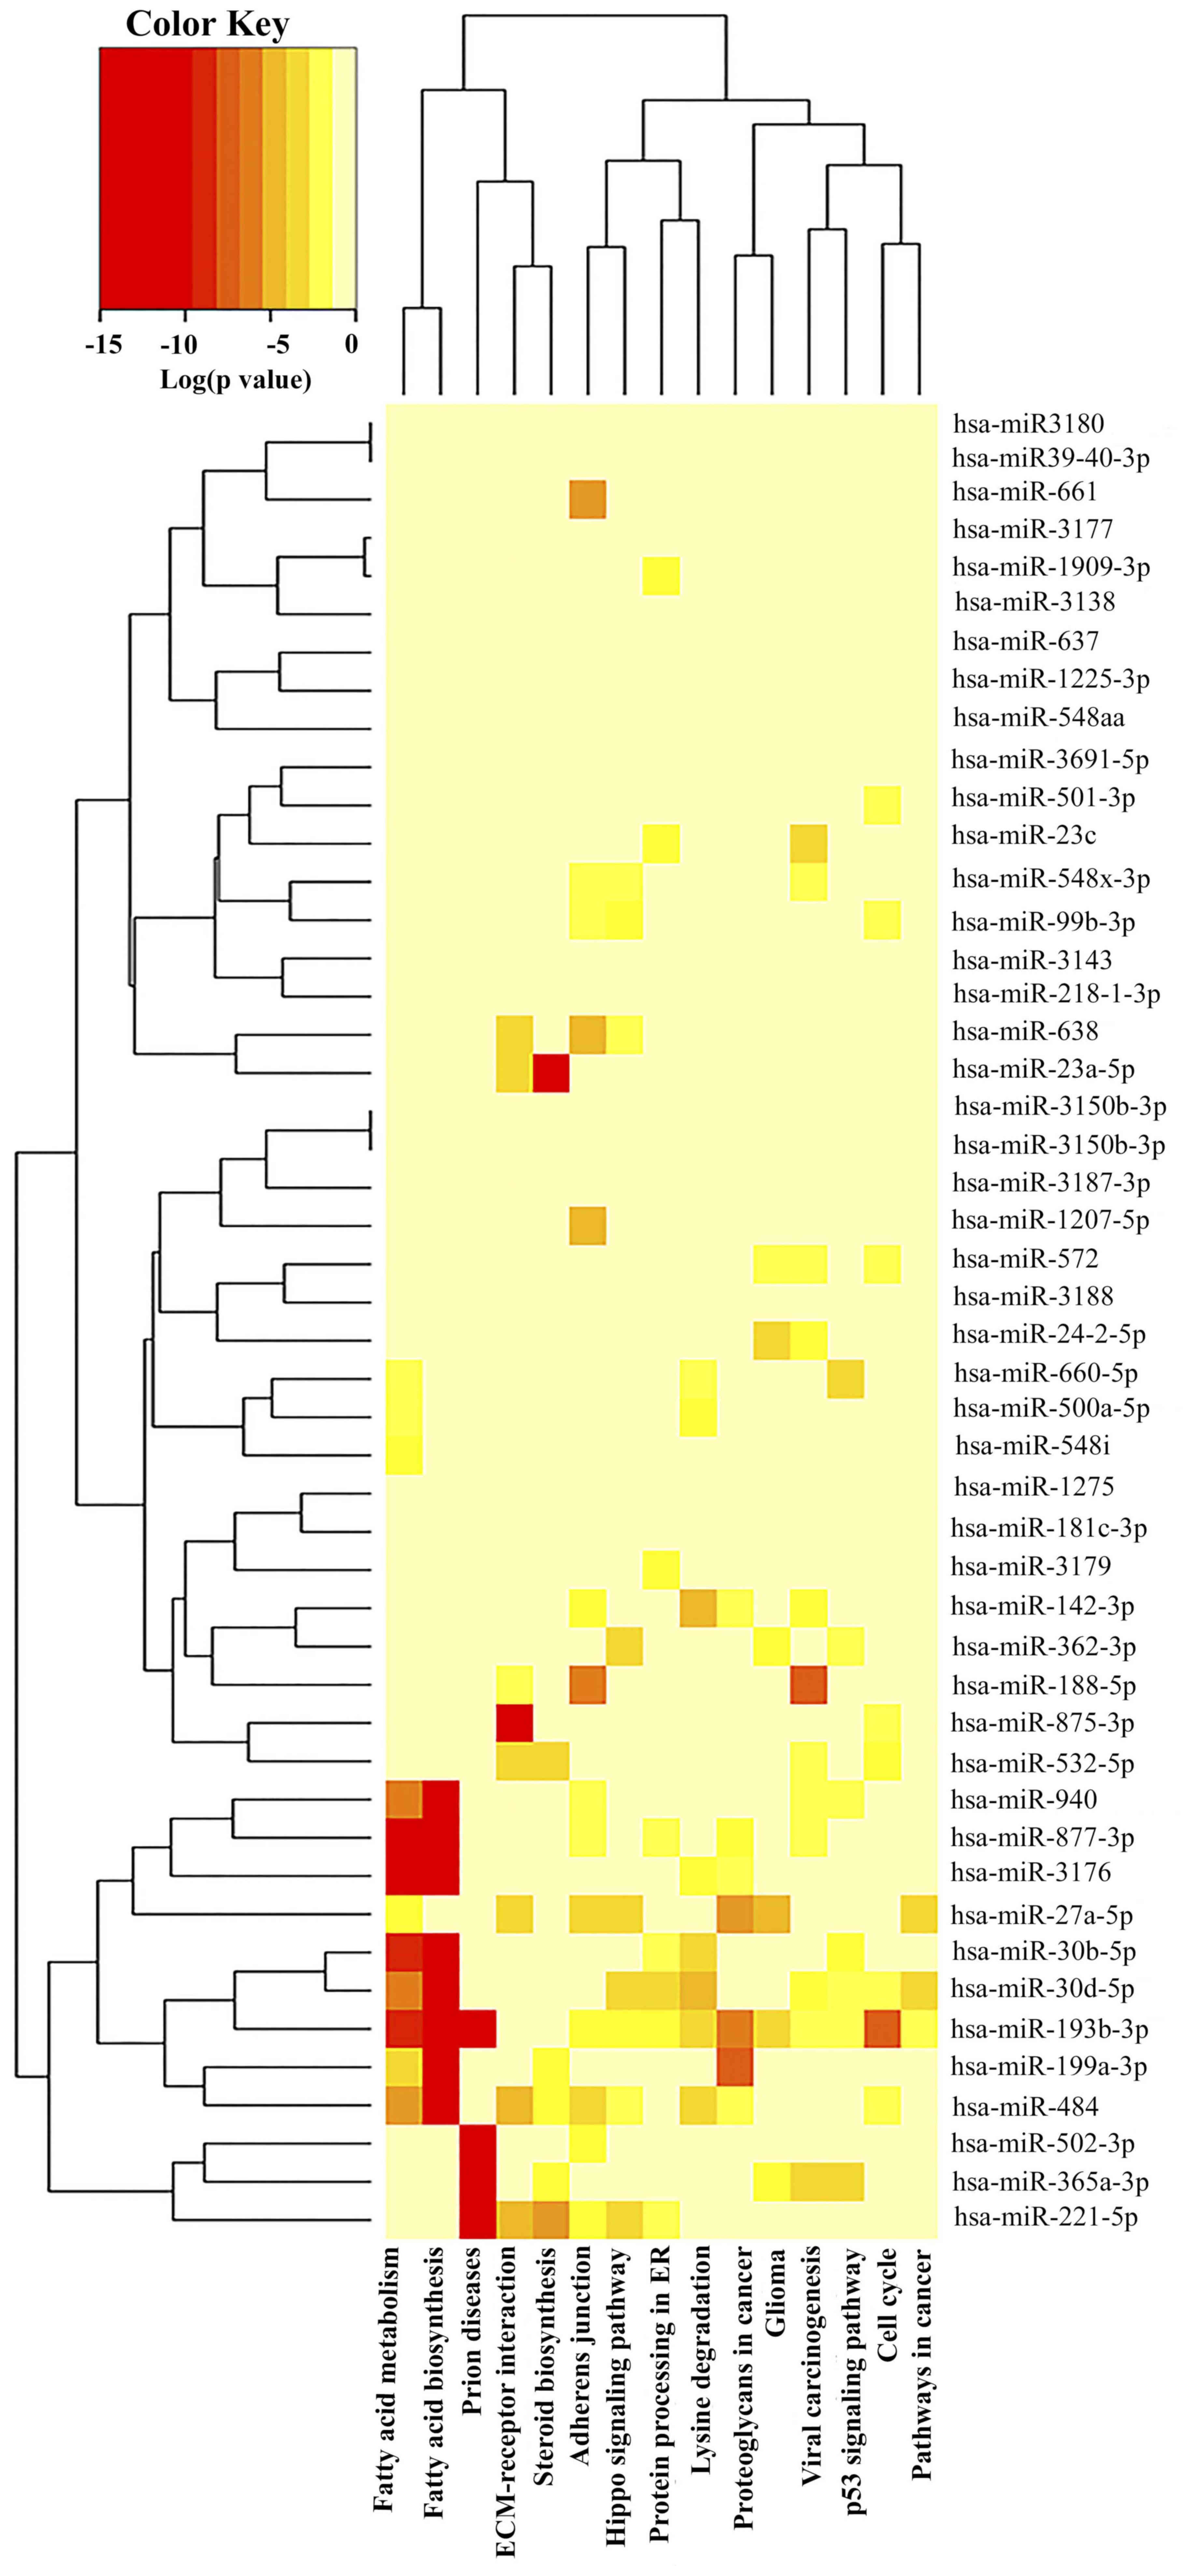
revealed a total number of 2,719 genes and 93 miRNAs (Table II). To investigate the function of
these specific genes and miRNAs that may be affected by the
presence of CNAs in these cytobands, pathway enrichment analysis
(DIANA-miRPath v.3) was used. Among the top 15 pathways identified,
based on P-value, were pathways associated with prion diseases,
fatty acid biosynthesis and metabolism, adherens junction,
extracellular matrix (ECM)-receptor interaction, hippo and tumor
protein p53 (TP53) signaling pathways (Fig. 2; Table III). Among these top pathways,
the ones that were affected by the largest number of miRNAs were
the adherens junctions (14 miRNAs), fatty acid metabolism and the
viral carcinogenesis pathway (12 miRNAs each) (Table III).
| Table IIMain cytobands affected by copy
number alterations and corresponding genes and miRNAs observed in
the South African patients with breast cancer. |
Table II
Main cytobands affected by copy
number alterations and corresponding genes and miRNAs observed in
the South African patients with breast cancer.
| Chr | Cytoband | Start | Stop | Size (kb) | Number of
genesa | Number of
miRNAs | miRNA names |
|---|
| chr 2 | p25.3-p24.3 | 42444 | 10655131 | 10,61 | 46 | 0 | - |
| chr 4 | p16.3-p15.2 | 71552 | 20593307 | 20,52 | 122 | 6 | miR-218-1,
miR-3138, miR-4274, miR-548i2, miR-572, miR-943 |
| chr 6 | p25.3-p21.1 | 255350 | 33284818 | 33,03 | 647 | 9 | miR-1266, miR-1275,
miR-219-1, miR-3143, miR-3691, miR-3925, miR-548a1, miR-586,
miR-879 |
| chr 8 | p23.3-q24.3 | 47681335 | 146230967 | 98,54 | 454 | 20 | miR-1204, miR-1205,
miR-1206, miR-1207, miR-1208, miR-1234, miR-142-2, miR-2052,
miR-2053, miR-30b, miR-30d, miR-3150, miR-3150b, miR-3151,
miR-3610, miR-599, miR-661, miR-875, miR-937, miR-939 |
| chr 16 | p13.3-p11.2 | 106271 | 34226300 | 34,12 | 494 | 22 | miR-1225, miR-193b,
miR-3176, miR-3177, miR-3178, miR-3179-1, miR-3179, miR-3179-3,
miR-3180-1,-2,-3,-4, miR-3180, miR-365, miR-3670, miR-3766,
miR-3680, miR-484, miR-548aa2, miR-66, miR-762, miR-94 |
| chr 19 | p13.3-q13.43 | 651028 | 19290536 | 18,639 | 570 | 21 | miR-1181, miR-1227,
miR-1238, miR-1470, miR-181c, miR-181d, miR-1909, miR-199A1,
miR-23a, miR-24-2, miR-27a, miR-3187, miR-3188, miR-3189, miR-3940,
miR-4321, miR-4322, miR-637, miR-638, miR-639, miR-7 |
| chr X | p22.33-p21.1 | 61091 | 36204752 | 36,14 | 386 | 15 | miR-188, miR-221,
miR-22, miR-23c, miR-362, miR-3690, miR-500a, miR-500b, miR-501,
miR-502, miR-532, miR-651, miR-660, miR-98, miR-let7f |
| Table IIITop 15 KEGG pathways identified by
miRNAs located in the main cytobands affected by CNAs. |
Table III
Top 15 KEGG pathways identified by
miRNAs located in the main cytobands affected by CNAs.
| KEGG
pathwaya | P-value | Number of
genes | Number of
miRNAs | miRNA names |
|---|
| Prion diseases |
<1.00×10⁻³³ | 13 | 4 | miR-193b-3p,
miR-221-5p, miR-365a-3p, miR-502-3p |
| Fatty acid
biosynthesis |
<1.00×10⁻³³ | 5 | 8 | miR-193b-3p,
miR-199a-3p, miR-30b-5p, miR-30d-5p, miR-3176, miR-484, miR-877-3p,
miR-940 |
| Fatty acid
metabolism |
<1.00×10⁻³³ | 22 | 12 | miR-193b-3p,
miR-199a-3p, miR-27a-5p, miR-30b-5p, miR-30d-5p, miR-3176, miR-484,
miR-500a-5p, miR-548i, miR-660-5p, miR-877-3p, miR-940 |
| Adherens
junction |
1.72×10⁻¹⁴ | 47 | 14 | miR-142-3p,
miR-188-5p, miR-193b-3p, miR-1207-5p, miR-27a-5p, miR-221-5p,
miR-484, miR-502-3p, miR-548×-3p, miR-638, miR-661, miR-877-3p,
miR-940, miR-99b-3p |
| Viral
carcinogenesis |
1.62×10⁻¹¹ | 98 | 12 | miR-142-3p,
miR-188-5p, miR-193b-3p, miR-23c, miR-24-2-5p, miR-30d-5p,
miR-364a-3p, miR-532-5p, miR-548×-3p, miR-572, miR-877-3p,
miR-940 |
| Proteoglycans in
cancer |
1.14×10⁻⁸ | 90 | 7 | miR-142-3p,
miR-193b-3p, miR-199a-3p, miR-27a-5p, miR-3176, miR-484, miR-
877-3p |
| Extracellular
matrix-receptor interaction |
4.37×10⁻⁸ | 30 | 8 | miR-188-5p,
miR-23a-5p, miR-27a-5p, miR-221-5p, miR-484, miR-532-5p, miR-638,
miR-875-3p |
| Lysine
degradation |
1.56×10⁻⁶ | 30 | 8 | miR-142-3p,
miR-193b-3p, miR-30b-5p, miR-30d-5p, miR-3176, miR-484,
miR-500a-5p, miR-660-5p |
| Hippo signaling
pathway |
1.94×10⁻⁵ | 70 | 9 | miR-193b-3p,
miR-27a-5p, miR-221-5p, miR-30d-5p, miR-362-3p, miR-484,
miR548×-3p, miR-638, miR-99b-3p |
| Cell cycle |
7.53×10⁻⁵ | 61 | 8 | miR-193b-3p,
miR-30d-5p, miR-484, miR-501-3p, miR-532-5p, miR-572, miR-875-3p,
miR-99b-3p |
| Glioma |
1.07×10⁻⁵ | 29 | 6 | miR-193b-3p,
miR-24-2-5p, miR-27a-5p, miR-362-3p, miR-365a-3p, miR-572 |
| Protein processing
in endoplasmic reticulum |
1.77×10⁻² | 79 | 8 | miR-193b-3p,
miR-1909-3p, miR-23c, miR-221-5p, miR-30b-5p, miR-30d-5p, miR-3179,
miR-877-3p |
| Steroid
biosynthesis |
1.05×10⁻² | 6 | 6 | miR-199a-3p,
miR-23a-5p, miR-221-5p, miR-365a-3p, miR-484, miR-532-5p |
| p53 signaling
pathway |
2.80×10⁻² | 34 | 7 | miR-193b-3p,
miR-30b-5p, miR-30d-5p, miR-362-3p, miR-365a-3p, miR-660-5p,
miR-940 |
| Pathways in
cancer |
4.25×10⁻² | 113 | 3 | miR-193b-3p,
miR-27a-5p, miR-30d-5p |
Using miRNA target prediction analysis (using
TarBase v.7.0), 512 targets predicted to be regulated by these
miRNAs were identified (miTG score >0.7- microT-CDS
interactions). A number of common miRNA targets were observed
within these 15 pathways, including the cancer driver genes
CCND1 in 46.7% of the pathways, CDKN1A, MAPK1 and
MDM2 in 40%, SMAD2 in 33.3% and CCND2, IGF1R,
KRAS, SMAD3 and TP53 genes in 26.7% (data not
shown).
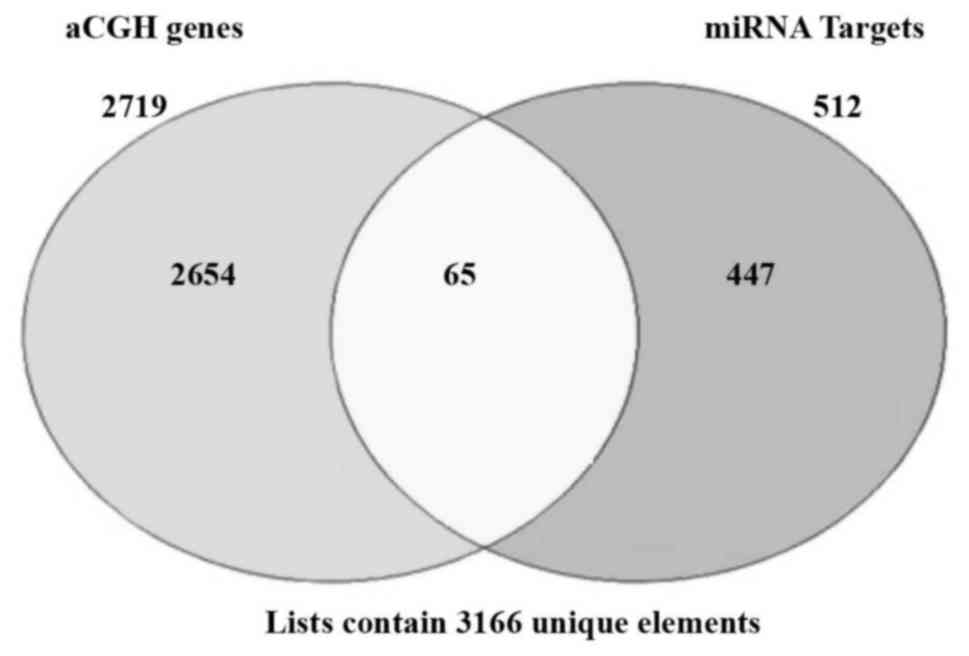
The integration of these miRNAs gene targets with
the 2,719 genes that were mapped in the cytobands with CNAs, as
generated by the Cytogenomic interval base reports (Table III), revealed a number of 65
common genes (Fig. 3). From these
common genes, that may be potentially affected by copy number and
miRNA expression regulation, 35.4% were mapped at the 6p25.3-p21.1
cytoband, 18.5% at 8q11.1-q24.3, 17% at 16p13.3-p11.2 and
19p13.3-p13.11, 7.7% at Xp22.33-p21.1, 3% at 4p16.3-p15.2 and 1.5%
at 2p25.3-p24.3. The majority of these 65 common genes were
involved in viral carcinogenesis (33.8%) and cell cycle pathways
(16.9%) (Table IV). Among these
genes are known cancer driver genes, including CDKN1A, MAPKs,
MYC and VEGFA.
| Table IVCommon genes targeted by microRNAs
and copy number alterations in the main affected cytobands and
their corresponding involvement in signaling pathways. |
Table IV
Common genes targeted by microRNAs
and copy number alterations in the main affected cytobands and
their corresponding involvement in signaling pathways.
| Genes name | Chromosome | Kyoto Encylopedia
of Genes and Genomes Pathway |
|---|
| YWHAQ | 2p25.3-p24.3 | Viral
carcinogenesis; Hippo Signaling; Cell Cycle |
| WFS1 | 4p16.3-p15.2 | Protein processing
RE |
| WHSC1 | 4p16.3-p15.2 | Lysine
degradation |
| CCND3 | 6p25.3-p21.1 | TP53 signaling
pathway; Cell Cycle; Hippo signaling |
| CDKN1A | 6p25.3-p21.1 | Proteoglycans in
cancer; Viral Carcinogenesis; Gliomas; Cell cycle; TP53 signaling
pathway |
| E2F3 | 6p25.3-p21.1 | Gliomas; Pathways
in Cancer; Cell cycle |
|
HIST1H2BD | 6p25.3-p21.1 | Viral
carcinogenesis |
|
HIST1H2BH | 6p25.3-p21.1 | Viral
carcinogenesis |
|
HIST1H4C | 6p25.3-p21.1 | Viral
carcinogenesis |
|
HIST1H4D | 6p25.3-p21.1 | Viral
carcinogenesis |
| HLA-A | 6p25.3-p21.1 | Viral
carcinogenesis |
| HLA-B | 6p25.3-p21.1 | Viral
carcinogenesis |
| HLA-C | 6p25.3-p21.1 | Viral
carcinogenesis |
|
HSP90AB1 | 6p25.3-p21.1 | Pathways in Cancer;
Protein processing RE |
| HSPA1A | 6p25.3-p21.1 | Protein processing
RE; Prion disease |
| HSPA1B | 6p25.3-p21.1 | Protein processing
RE |
| HSPA1L | 6p25.3-p21.1 | Protein processing
RE |
| ITPR3 | 6p25.3-p21.1 | Proteoglycans in
cancer |
| MAPK13 | 6p25.3-p21.1 | Proteoglycans in
cancer |
| MRPS18B | 6p25.3-p21.1 | Viral
carcinogenesis |
| PPARD | 6p25.3-p21.1 | Pathways in
cancer |
| PPT2 | 6p25.3-p21.1 | Fatty Acid
Metabolism |
| SRF | 6p25.3-p21.1 | Viral
carcinogenesis |
| SSR1 | 6p25.3-p21.1 | Protein processing
RE |
| TEAD3 | 6p25.3-p21.1 | Hippo
signaling |
| VEGFA | 6p25.3-p21.1 | Pathways in Cancer;
Proteoglycans in cancer |
| CCNE2 | 8q11.1-q24.3 | Viral
carcinogenesis; Cell cycle; TP53 signaling pathway; Pathways in
cancer |
| FZD6 | 8q11.1-q24.3 | Proteoglycans in
cancer; Hippo Signaling |
| LYN | 8q11.1-q24.3 | Viral
carcinogenesis |
| MCM4 | 8q11.1-q24.3 | Cell cycle |
| MYC | 8q11.1-q24.3 | Hippo Signaling;
Pathways in cancer; Cell cycle |
| PRKDC | 8q11.1-q24.3 | Cell cycle |
| PTK2 | 8q11.1-q24.3 | Proteoglycans in
cancer; Pathways in cancer |
| RAD21 | 8q11.1-q24.3 | Cell cycle |
| RRM2B | 8q11.1-q24.3 | TP53 signaling
pathway; |
| SCRIB | 8q11.1-q24.3 | Viral
carcinogenesis; Hippo Signaling |
| SQLE | 8q11.1-q24.3 | Steroid
Biosynthesis |
| YWHAZ | 8q11.1-q24.3 | Viral
carcinogenesis; Hippo Signaling |
| ADCY9 | 16p13.3-p11.2 | Pathways in
cancer |
| AXIN1 | 16p13.3-p11.2 | Hippo
signaling |
| CREBBP | 16p13.3-p11.2 | Adherens in
junction; Viral carcinogenesis |
| DNAJA3 | 16p13.3-p11.2 | Viral
carcinogenesis |
| MAPK3 | 16p13.3-p11.2 | Prion disease;
Adherens in junction; Proteoglycans in cancer; Gliomas; Pathways in
cancer |
| PKMYT1 | 16p13.3-p11.2 | Cell cycle |
| PLK1 | 16p13.3-p11.2 | Cell cycle |
| PRKCB | 16p13.3-p11.2 | Proteoglycans in
cancer; Gliomas |
| SETD1A | 16p13.3-p11.2 | Lysine
degradation |
| TFAP4 | 16p13.3-p11.2 | Proteoglycans in
cancer |
| USP7 | 16p13.3-p11.2 | Viral
carcinogenesis |
| DNAJB1 | 19p13.3-p13.11 | Protein processing
RE |
| DOT1L | 19p13.3-p13.11 | Lysine
degradation |
| FZR1 | 19p13.3-p13.11 | Cell cycle |
| INSR | 19p13.3-p13.11 | Adherens in
junction |
| JAK3 | 19p13.3-p13.11 | Viral
carcinogenesis |
| MAP2K2 | 19p13.3-p13.11 | Gliomas |
| MAP2K7 | 19p13.3-p13.11 | Protein processing
RE |
| PIK3R2 | 19p13.3-p13.11 | Proteoglycans in
cancer; Viral Carcinogenesis |
| PRKACA | 19p13.3-p13.11 | Prion Disease;
Viral Carcinogenesis |
| PRKCSH | 19p13.3-p13.11 | Protein processing
RE |
| TECR | 19p13.3-p13.11 | Fatty acid
metabolism |
| DDX3X | Xp22.33-p21.1 | Viral
carcinogenesis |
| MBTPS2 | Xp22.33-p21.1 | Protein processing
RE |
| PRKX | Xp22.33-p21.1 | Prion disease |
| SMC1A | Xp22.33-p21.1 | Viral
carcinogenesis; Hippo Signaling |
| UBQLN2 | Xp22.33-p21.1 | Protein processing
RE |
Correlation of CNAs with
clinicopathological parameters and ethnicity
Prior to the association between the
clinicopathological data and ethnicity (Table I) with the copy number data, a
significant correlation between tumor size and tumor stage
(r=0.532; P<0.01) was observed. Inverse correlations were
observed between ER status and tumor grade (ER positivity and lower
tumor grade r=-0.664; P<0.001) and HER2 status and tumor size
(r=-0.408; P<0.05). No correlation was observed among the other
clinicopathological parameters and/ or the diverse ethnic
groups.
For the association with the number of CNAs, the
cases were divided into two groups; one with the number of CNAs
higher and one lower than the mean number of CNAs observed among
the cases (≥8.68 and <8.68, respectively). Unpredictably, the
cases in the group with a lower number of CNAs were significantly
associated with higher tumor size (r=-0.401; P<0.05) and tumor
grade (r=-0.516; P<0.01). The association of the most frequent
cytobands affected with the clinicopathological parameters above,
revealed correlation of CNAs on 4p (r=-0.452; P<0.05) and 6p
(r=-0.491; P<0.05) with tumor grade. No significant association
was observed among CNAs and/or specific cytobands with any ethnic
group.
Discussion
Genome-wide molecular signatures are well-defined
and established in breast cancer, characterizing the distinct
intrinsic subtypes and their impact on prognosis and clinical
outcome (18,19). However, there are limited genomic
signatures characterizing breast cancer based on the ancestry of a
patient, particularly associated with their tumor somatic profiles.
In patients of African descent, the majority of the studies
available are based on genetic variants, including single
nucleotide polymorphism and copy number variation (CNV) (13,15,16).
While they are relevant in determining cancer risk and
susceptibility in specific populations, they fail to characterize
the tumor genomic signatures and corresponding imbalances in gene
dosages and mutations that are prevalent and may affect cancer
genes.
CNAs in the tumor genome may result in the
gain/amplification of oncogenes and/or loss/deletion of tumor
suppressor genes and are major drivers of tumor development
(27,40). A genome-wide analysis of CNAs
conducted in different types of cancer revealed that a specific
tumor type presents 17% of regions with amplifications and 16% of
deletions, compared with <0.5% in normal samples (40). The patterns of these somatic tumor
alterations, as CNVs, may also vary within ethnic groups (35,41).
The majority of the studies assessing these alterations, in
addition to their gene and epigenetic expression profiles, are in
White European and African American patients with breast cancer
(35,40-45).
Few studies have been performed in patients from Sub-Saharan
countries (24,25). Thus, the consequences of CNAs due
to the genetic instability of their tumor types remain largely
unknown.
In the present study, genome-wide copy number
profiling in patients with breast cancer patients from the Western
Cape region of SA was performed. Array-CGH analysis revealed
recurrent CNAs in the cases analyzed, with the most frequent
affecting the cytobands 2p25.3-p24.3, 4p16.3-p15.3, 6p25.3-p22.3,
6p22.3-p.21.1, 8q11.1-q24.3, 16p13.3-p11.2, 19p13.3-p13.11 and
Xp22.3. A number of these CNAs, including gains on 8q and 16p, are
commonly reported in breast cancer, and are not necessarily
associated with specific tumor subtypes and/or ethnicity (18). A number of reports, however, have
demonstrated that patients with TNBC and other
BRCA1-associated tumor types, which are frequently
identified in women of African descent (46,47),
present a significantly higher frequency of focal amplifications on
8q24, where C-MYC is located (48). This amplification was, however, not
a distinguishing characteristic associated with ancestry, as it was
observed both in patients of European and African-American descent
(18).
Interestingly, losses on 2p, 4p and gains on 6p, 8q,
16p and 19p were previously reported in the array-CGH analysis of a
set of 28 breast cancer cases from patients from Sub-Saharan Africa
(24). Among these alterations,
gains on 6p presented a significant higher level of copy number
increase when compared to American patients with breast cancer,
previously analyzed (49). In a
previous study in African-American (AA) and Non-Hispanic White
patients (NHW) patients with breast cancer (35), it was observed that in the AA group
there was a higher frequency of copy number gains, affecting 6p and
8q, when compared with the NHW group. However, in these cases, a
significant higher level of genome-wide CNAs was observed in the AA
group, which may justify the observed increased in the copy number
in these chromosome regions. In fact, CNAs were the only
significantly different variable between AA and NHW patients with
TNBC tumor subtypes (P<0.01) when clinicopathological parameters
were taken into account (35).
A direct correlation was observed among the total
number of CNAs and the main cytobands observed; a higher number of
CNAs were significantly correlated with the cases that presented
with CNAs in the 6p, 16p and 19p cytobands. Direct correlations
were observed among CNAs on 2p, 4p, 6p, 16p, 16p and Xp. No inverse
correlations among the main cytobands affected by CNAs were
observed.
The mean number of CNAs and the specific cytobands
affected were correlated with clinicopathological parameters and
the diverse SA ethnic groups. Surprisingly, a negative correlation
was observed between the mean number of CNAs and tumor size and
grade. CNAs on the 4p, 6p and Xp cytobands were also negatively
correlated with tumor grade. In general, the increase in genomic
instability is associated with poor prognostic parameters (50). However, a number of observations
have demonstrated that there are clonal subpopulations of tumor
types, including tumor types of epithelial origin, with high levels
of somatic CNAs that are associated with a potentially better
prognosis (and overall survival time) compared with tumor types
with intermediate levels of CNAs (50-53).
This interesting observation reflects the well-known intra-tumor
heterogeneity marked by the presence of coexisting clones with
diverse genomic compositions (52,53).
This may explain the unexpected results of the present study, as it
was observed that there were higher levels of CNAs in the
aforementioned cytobands in tumor types with lower tumor grade and
smaller size.
Alterations on 8p were significantly correlated with
PR status; however, this correlation may be spurious, considering
that only 6 cases presented PR status information. CNAs on
chromosome 21p were the only ones associated with ethnicity; no
other significant differences were observed between the mean number
of CNAs and/or the other most commonly affected cytobands (2p, 4p,
6p, 8q, 16p, 19p and Xp) and ethnicity, indicating that these
alterations occur in SA patients irrespective of their genetic
descent. Furthermore, multivariate analyses revealed that no
clinical or pathological variable, including age, tumor size, grade
and stage, and ER, PR and ERBB2/HER2 status were significantly
correlated with ethnicity of the patients. However, the comparison
of the mean number of CNAs of these SA patients to the mean number
of CNAs present in the AA and NHW patients of our previous study
(35) revealed significant
differences between the Black SA and AA patients (P<0.05), but
interestingly no differences between the White SA and NHW patients
(P>0.05), which may indicate a common European ancestry.
However, when the Colored SA group of patients were compared with
the AA and NHW groups, significant differences were observed
(P<0.0001 and P<0.001, respectively), which may be resultant
of the large variation in ethnicity in this particular group of
patients (from Europe and Asia and various tribes of SA).
Finally, by performing functional enrichment
analysis of genes and miRNA targets mapped in the cytobands most
affected by CNAs, it was observed that they affected a number of
critical cancer-associated pathways, including fatty acid
biosynthesis and metabolism, adherens junctions, ECM-receptor
interaction, hippo and TP53 signaling pathways. These pathways
include a number of cancer driver genes associated with breast
cancer (54), including CCND1,
CDKN1A, MAPK1, MDM2, TP53 and SMAD2. A number of the
pathways observed in the present study were also identified in the
AA patients with breast cancer with TNBC of a previous study
(35), in which a direct
integration of copy number and miRNA data conducted on the same
samples was performed. Remarkably, CNAs are one of the mechanisms
that may result in miRNA dysregulation (55-57).
In fact, 15/26 miRNAs of the miRNAs that were identified in the AA
patients (of the TNBC subtype) (35) were mapped in cytobands that are
frequently affected by recurrent CNAs in breast cancer, including
the 6p25.3-p21.1, 8q11.1-q24.3, 16p13.3-p11.2 and 19p13.3-p13.11
similar to the present study.
In conclusion, the present study presents the
pattern of copy number changes in the genome of SA patients with
breast cancer and demonstrates their potential impact on critical
cancer pathways associated with their tumor genomes. Additional
genomic tumor profiling in SA and other Sub-Saharan patients with
breast cancer in independent and larger sample size cohorts are
required in order to determine the association of these alterations
with their prognosis and clinical outcome, including response to
therapy.
Funding
The present study was supported by The Cancer
Association of South Africa (CANSA) (to Professor Sahar
Abdul-Rasool and Dr Bridget C. Langa). Scholarships to Dr Bruna
Sugita and Professor Silma R.F. Pereira were provided by
Coordenação de Aperfeiçoamento de Pessoal de Nível Superior,
(CAPES) and the scholarship to Dr Aline S. Fonseca was provided by
Conselho Nacional de Desenvolvimento Científico e Tecnológico
(CNPq). Additionally, the Genomics and Epigenomics Shared Resource
of the Lombardi Comprehensive Cancer Center partially supported the
present study (grant no. P30-CA051008).
Availability of data and materials
The datasets used and/or analyzed during the current
study are available from the corresponding author on reasonable
request.
Authors’ contributions
KL performed the experiments. SEE performed data
analysis and wrote the manuscript. ASF assisted in the data
analysis. SHW verified the statistical analysis. BS assisted in the
data analysis. BCL contributed to the initial design of the study.
SRFP contributed to the initial design of the study. DG performed
the pathological analysis of the cases. EP provided the specimens
and clinical data. DH and SAR contributed to scientific discussions
and revised the final copy of the manuscript for intellectual
content. LRC designed the study and conducted the final editing of
the manuscript. All authors read and approved the manuscript.
Ethics approval and consent to
participate
The present study was approved by the Human Research
Ethics Committee (HREC 454/2010) of the Groote Schuur Hospital
(Cape Town, SA). The analysis of the human samples used in the
present study was performed following the international and
national regulations in accordance with the Declaration of
Helsinki.
Patient consent for publication
Not applicable.
Competing interests
The authors declare that they have no competing
interests.
Acknowledgments
The authors would like to thank the personnel from
the Division of Anatomical Pathology, National Health Laboratory
Services at the Groote Schuur Hospital (Cape Town, SA) for
performing the tissue sections of the cases and the Genomics and
Epigenomics Shared Resource of the Lombardi Comprehensive Cancer
Center for performing the washes and scanning of the array
slides.
Referenes
|
1
|
Ferlay J, Soerjomataram I, Dikshit R, Eser
S, Mathers C, Rebelo M, Parkin DM, Forman D and Bray F: Cancer
incidence and mortality worldwide: Sources, methods and major
patterns in GLOBOCAN 2012. Int J Cancer. 136:E359–E386. 2015.
View Article : Google Scholar
|
|
2
|
Brinton LA, Figueroa JD, Awuah B, Yarney
J, Wiafe S, Wood SN, Ansong D, Nyarko K, Wiafe-Addai B and
Clegg-Lamptey JN: Breast cancer in Sub-Saharan Africa:
Opportunities for prevention. Breast Cancer Res Treat. 144:467–478.
2014. View Article : Google Scholar : PubMed/NCBI
|
|
3
|
Tetteh DA and Faulkner SL: Sociocultural
factors and breast cancer in sub-Saharan Africa: Implications for
diagnosis and management. Wom Health Lond. 12:147–156. 2016.
View Article : Google Scholar
|
|
4
|
Wu S, Powers S, Zhu W and Hannun YA:
Substantial contribution of extrinsic risk factors to cancer
development. Nature. 529:43–47. 2016. View Article : Google Scholar :
|
|
5
|
Bird PA, Hill AG and Houssami N: Poor
hormone receptor expression in East African breast cancer: Evidence
of a biologically different disease? Ann Surg Oncol. 15:1983–1988.
2008. View Article : Google Scholar : PubMed/NCBI
|
|
6
|
Huo D, Ikpatt F, Khramtsov A, Dangou JM,
Nanda R, Dignam J, Zhang B, Grushko T, Zhang C, Oluwasola O, et al:
Population differences in breast cancer: Survey in indigenous
African women reveals over-representation of triple-negative breast
cancer. J Clin Oncol. 27:4515–4521. 2009. View Article : Google Scholar : PubMed/NCBI
|
|
7
|
Ly M, Antoine M, André F, Callard P,
Bernaudin JF and Diallo DA: Breast cancer in Sub-Saharan African
women: Review. Bull Cancer. 98:797–806. 2011.In French. PubMed/NCBI
|
|
8
|
Ly M, Antoine M, Dembélé AK, Levy P,
Rodenas A, Touré BA, Badiaga Y, Dembélé BK, Bagayogo DC, Diallo YL,
et al: High incidence of triple-negative tumors in sub-saharan
Africa: A prospective study of breast cancer characteristics and
risk factors in Malian women seen in a Bamako university hospital.
Oncology. 83:257–263. 2012. View Article : Google Scholar : PubMed/NCBI
|
|
9
|
Galukande M, Wabinga H, Mirembe F,
Karamagi C and Asea A: Molecular breast cancer subtypes prevalence
in an indigenous Sub Saharan African population. Pan Afr Med J.
17:2492014. View Article : Google Scholar : PubMed/NCBI
|
|
10
|
Reeves MD, Yawitch TM, van der Merwe NC,
van den Berg HJ, Dreyer G and van Rensburg EJ: BRCA1 mutations in
South African breast and/or ovarian cancer families: Evidence of a
novel founder mutation in Afrikaner families. Int J Cancer.
110:677–682. 2004. View Article : Google Scholar : PubMed/NCBI
|
|
11
|
van der Merwe NC, Hamel N, Schneider SR,
Apffelstaedt JP, Wijnen JT and Foulkes WD: A founder BRCA2 mutation
in non-Afrikaner breast cancer patients of the Western Cape of
South Africa. Clin Genet. 81:179–184. 2012. View Article : Google Scholar
|
|
12
|
Fackenthal JD, Zhang J, Zhang B, Zheng Y,
Hagos F, Burrill DR, Niu Q, Huo D, Sveen WE, Ogundiran T, et al:
High prevalence of BRCA1 and BRCA2 mutations in unselected Nigerian
breast cancer patients. Int J Cancer. 131:1114–1123. 2012.
View Article : Google Scholar
|
|
13
|
Zheng Y, Ogundiran TO, Falusi AG,
Nathanson KL, John EM, Hennis AJ, Ambs S, Domchek SM, Rebbeck TR,
Simon MS, et al: Fine mapping of breast cancer genome-wide
association studies loci in women of African ancestry identifies
novel susceptibility markers. Carcinogenesis. 34:1520–1528. 2013.
View Article : Google Scholar : PubMed/NCBI
|
|
14
|
Francies FZ, Wainstein T, De Leeneer K,
Cairns A, Murdoch M, Nietz S, Cubasch H, Poppe B, Van Maerken T,
Crombez B, et al: BRCA1, BRCA2 and PALB2 mutations and CHEK2
c1100delC in different South African ethnic groups diagnosed with
premenopausal and/or triple negative breast cancer. BMC Cancer.
15:9122015. View Article : Google Scholar
|
|
15
|
Couch FJ, Kuchenbaecker KB, Michailidou K,
Mendoza-Fandino GA, Nord S, Lilyquist J, Olswold C, Hallberg E,
Agata S, Ahsan H, et al: Identification of four novel
susceptibility loci for oestrogen receptor negative breast cancer.
Nat Commun. 7:113752016. View Article : Google Scholar : PubMed/NCBI
|
|
16
|
Huo D, Feng Y, Haddad S, Zheng Y, Yao S,
Han YJ, Ogundiran TO, Adebamowo C, Ojengbede O, Falusi AG, et al:
Genome-wide association studies in women of African ancestry
identified 3q26.21 as a novel susceptibility locus for oestrogen
receptor negative breast cancer. Hum Mol Genet. 25:4835–4846.
2016.
|
|
17
|
Network CGA; Cancer Genome Atlas Network:
Comprehensive molecular portraits of human breast tumours. Nature.
490:61–70. 2012. View Article : Google Scholar : PubMed/NCBI
|
|
18
|
Ciriello G, Gatza ML, Beck AH, Wilkerson
MD, Rhie SK, Pastore A, Zhang H, McLellan M, Yau C, Kandoth C, et
al TCGA Research Network: Comprehensive molecular portraits of
invasive lobular breast cancer. Cell. 163:506–519. 2015. View Article : Google Scholar : PubMed/NCBI
|
|
19
|
Basro S and Apffelstaedt JP: Breast cancer
in young women in a limited-resource environment. World J Surg.
34:1427–1433. 2010. View Article : Google Scholar
|
|
20
|
Adedokun BO, Olopade CO and Olopade OI:
Building local capacity for genomics research in Africa:
Recommendations from analysis of publications in Sub-Saharan Africa
from 2004 to 2013. Glob Health Action. 9:310262016. View Article : Google Scholar : PubMed/NCBI
|
|
21
|
Sjögren S, Inganäs M, Norberg T, Lindgren
A, Nordgren H, Holmberg L and Bergh J: The p53 gene in breast
cancer: Prognostic value of complementary DNA sequencing versus
immunohistochemistry. J Natl Cancer Inst. 88:173–182. 1996.
View Article : Google Scholar : PubMed/NCBI
|
|
22
|
Sluiter M, Mew S and van Rensburg EJ:
PALB2 sequence variants in young South African breast cancer
patients. Fam Cancer. 8:347–353. 2009. View Article : Google Scholar : PubMed/NCBI
|
|
23
|
van Bogaert LJ: Breast cancer molecular
subtypes as identified by immunohistochemistry in South African
black women. Breast J. 19:210–211. 2013. View Article : Google Scholar : PubMed/NCBI
|
|
24
|
Valent Ly M, Diallo A, Penault-Lorca G,
Dumke F, Marty K, Viehl V, Lazar P, Job V, Richon BC, et al: Gene
copy number variations in breast cancer of Sub-Saharan African
women. Breast. 22:295–300. 2013. View Article : Google Scholar
|
|
25
|
Langa BC, Oliveira MM, Pereira SR, Lupicki
K, Marian C, Govender D, Panieri E, Hiss D, Cavalli IJ,
Abdul-Rasool S, et al: Copy number analysis of the DLX4 and ERBB2
genes in South African breast cancer patients. Cytogenet Genome
Res. 146:195–203. 2015. View Article : Google Scholar : PubMed/NCBI
|
|
26
|
Hanahan D and Weinberg RA: The hallmarks
of cancer. Cell. 100:57–70. 2000. View Article : Google Scholar : PubMed/NCBI
|
|
27
|
Hanahan D and Weinberg RA: Hallmarks of
cancer: The next generation. Cell. 144:646–674. 2011. View Article : Google Scholar : PubMed/NCBI
|
|
28
|
Negrini S, Gorgoulis VG and Halazonetis
TD: Genomic instability - an evolving hallmark of cancer. Nat Rev
Mol Cell Biol. 11:220–228. 2010. View Article : Google Scholar : PubMed/NCBI
|
|
29
|
Korkola J and Gray JW: Breast cancer
genomes - form and function. Curr Opin Genet Dev. 20:4–14. 2010.
View Article : Google Scholar : PubMed/NCBI
|
|
30
|
Cancer A-AJCo: Cancer Staging Manual.
Society AC: Springer; 2002
|
|
31
|
de Wit E, Delport W, Rugamika CE, Meintjes
A, Möller M, van Helden PD, Seoighe C and Hoal EG: Genome-wide
analysis of the structure of the South African coloured population
in the Western Cape. Hum Genet. 128:145–153. 2010. View Article : Google Scholar : PubMed/NCBI
|
|
32
|
Quintana-Murci L, Harmant C, Quach H,
Balanovsky O, Zaporozhchenko V, Bormans C, van Helden PD, Hoal EG
and Behar DM: Strong maternal Khoisan contribution to the South
African coloured population: A case of gender-biased admixture. Am
J Hum Genet. 86:611–620. 2010. View Article : Google Scholar : PubMed/NCBI
|
|
33
|
Santos SC, Cavalli IJ, Ribeiro EM, Urban
CA, Lima RS, Bleggi-Torres LF, Rone JD, Haddad BR and Cavalli LR:
Patterns of DNA copy number changes in sentinel lymph node breast
cancer metastases. Cytogenet Genome Res. 122:16–21. 2008.
View Article : Google Scholar : PubMed/NCBI
|
|
34
|
Torresan C, Oliveira MM, Pereira SR,
Ribeiro EM, Marian C, Gusev Y, Lima RS, Urban CA, Berg PE, Haddad
BR, et al: Increased copy number of the DLX4 homeobox gene in
breast axillary lymph node metastasis. Cancer Genet. 207:177–187.
2014. View Article : Google Scholar : PubMed/NCBI
|
|
35
|
Sugita B, Gill M, Mahajan A, Duttargi A,
Kirolikar S, Almeida R, Regis K, Oluwasanmi OL, Marchi F, Marian C,
et al: Differentially expressed miRNAs in triple negative breast
cancer between African-American and non-Hispanic white women.
Oncotarget. 7:79274–79291. 2016. View Article : Google Scholar : PubMed/NCBI
|
|
36
|
Cavalli LR, Man YG, Schwartz AM, Rone JD,
Zhang Y, Urban CA, Lima RS, Haddad BR and Berg PE: Amplification of
the BP1 homeobox gene in breast cancer. Cancer Genet Cytogenet.
187:19–24. 2008. View Article : Google Scholar : PubMed/NCBI
|
|
37
|
Vlachos IS, Kostoulas N, Vergoulis T,
Georgakilas G, Reczko M, Maragkakis M, Paraskevopoulou MD,
Prionidis K, Dalamagas T and Hatzigeorgiou AG: DIANA miRPath v2.0:
Investigating the combinatorial effect of microRNAs in pathways.
Nucleic Acids Res. 40W:W498–W504. 2012. View Article : Google Scholar
|
|
38
|
Vlachos IS, Paraskevopoulou MD, Karagkouni
D, Georgakilas G, Vergoulis T, Kanellos I, Anastasopoulos IL,
Maniou S, Karathanou K, Kalfakakou D, et al: DIANA-TarBase v7.0:
indexing more than half a million experimentally supported
miRNA:mRNA interactions. Nucleic Acids Res. 43D:D153–D159. 2015.
View Article : Google Scholar
|
|
39
|
Paraskevopoulou MD, Georgakilas G,
Kostoulas N, Vlachos IS, Vergoulis T, Reczko M, Filippidis C,
Dalamagas T and Hatzigeorgiou AG: DIANA-microT web server v5.0:
Service integration into miRNA functional analysis workflows.
Nucleic Acids Res. 41W:W169–W173. 2013. View Article : Google Scholar
|
|
40
|
Beroukhim R, Mermel CH, Porter D, Wei G,
Raychaudhuri S, Donovan J, Barretina J, Boehm JS, Dobson J,
Urashima M, et al: The landscape of somatic copy-number alteration
across human cancers. Nature. 463:899–905. 2010. View Article : Google Scholar : PubMed/NCBI
|
|
41
|
Loo LW, Wang Y, Flynn EM, Lund MJ, Bowles
EJ, Buist DS, Liff JM, Flagg EW, Coates RJ, Eley JW, et al:
Genome-wide copy number alterations in subtypes of invasive breast
cancers in young white and African American women. Breast Cancer
Res Treat. 127:297–308. 2011. View Article : Google Scholar : PubMed/NCBI
|
|
42
|
Field LA, Love B, Deyarmin B, Hooke JA,
Shriver CD and Ellsworth RE: Identification of differentially
expressed genes in breast tumors from African American compared
with Caucasian women. Cancer. 118:1334–1344. 2012. View Article : Google Scholar
|
|
43
|
Sturtz LA, Melley J, Mamula K, Shriver CD
and Ellsworth RE: Outcome disparities in African American women
with triple negative breast cancer: A comparison of epidemiological
and molecular factors between African American and Caucasian women
with triple negative breast cancer. BMC Cancer. 14:622014.
View Article : Google Scholar : PubMed/NCBI
|
|
44
|
Keenan T, Moy B, Mroz EA, Ross K,
Niemierko A, Rocco JW, Isakoff S, Ellisen LW and Bardia A:
Comparison of the genomic landscape between primary breast cancer
in African American versus white women and the association of
racial differences with tumor recurrence. J Clin Oncol.
33:3621–3627. 2015. View Article : Google Scholar : PubMed/NCBI
|
|
45
|
Ademuyiwa FO, Tao Y, Luo J, Weilbaecher K
and Ma CX: Differences in the mutational landscape of
triple-negative breast cancer in African Americans and Caucasians.
Breast Cancer Res Treat. 161:491–499. 2017. View Article : Google Scholar
|
|
46
|
Zhang J, Fackenthal JD, Zheng Y, Huo D,
Hou N, Niu Q, Zvosec C, Ogundiran TO, Hennis AJ, Leske MC, et al:
Recurrent BRCA1 and BRCA2 mutations in breast cancer patients of
African ancestry. Breast Cancer Res Treat. 134:889–894. 2012.
View Article : Google Scholar : PubMed/NCBI
|
|
47
|
Churpek JE, Walsh T, Zheng Y, Moton Z,
Thornton AM, Lee MK, Casadei S, Watts A, Neistadt B, Churpek MM, et
al: Inherited predisposition to breast cancer among African
American women. Breast Cancer Res Treat. 149:31–39. 2015.
View Article : Google Scholar :
|
|
48
|
Rodriguez-Pinilla SM, Jones RL, Lambros
MB, Arriola E, Savage K, James M, Pinder SE and Reis-Filho JS: MYC
amplification in breast cancer: A chromogenic in situ hybridisation
study. J Clin Pathol. 60:1017–1023. 2007. View Article : Google Scholar
|
|
49
|
Andre F, Job B, Dessen P, Tordai A,
Michiels S, Liedtke C, Richon C, Yan K, Wang B, Vassal G, et al:
Molecular characterization of breast cancer with high-resolution
oligonucleotide comparative genomic hybridization array. Clin
Cancer Res. 15:441–451. 2009. View Article : Google Scholar : PubMed/NCBI
|
|
50
|
Andor N, Maley CC and Ji HP: Genomic
instability in cancer: Teetering on the limit of tolerance. Cancer
Res. 77:2179–2185. 2017. View Article : Google Scholar : PubMed/NCBI
|
|
51
|
Birkbak NJ, Eklund AC, Li Q, McClelland
SE, Endesfelder D, Tan P, Tan IB, Richardson AL, Szallasi Z and
Swanton C: Paradoxical relationship between chromosomal instability
and survival outcome in cancer. Cancer Res. 71:3447–3452. 2011.
View Article : Google Scholar : PubMed/NCBI
|
|
52
|
Mroz EA, Tward AD, Hammon RJ, Ren Y and
Rocco JW: Intra-tumor genetic heterogeneity and mortality in head
and neck cancer: Analysis of data from the Cancer Genome Atlas.
PLoS Med. 12:e10017862015. View Article : Google Scholar : PubMed/NCBI
|
|
53
|
Andor N, Graham TA, Jansen M, Xia LC,
Aktipis CA, Petritsch C, Ji HP and Maley CC: Pan-cancer analysis of
the extent and consequences of intratumor heterogeneity. Nat Med.
22:105–113. 2016. View Article : Google Scholar
|
|
54
|
Rajendran BK and Deng CX: Characterization
of potential driver mutations involved in human breast cancer by
computational approaches. Oncotarget. 8:50252–50272. 2017.
View Article : Google Scholar : PubMed/NCBI
|
|
55
|
Calin GA, Sevignani C, Dumitru CD, Hyslop
T, Noch E, Yendamuri S, Shimizu M, Rattan S, Bullrich F, Negrini M,
et al: Human microRNA genes are frequently located at fragile sites
and genomic regions involved in cancers. Proc Natl Acad Sci USA.
101:2999–3004. 2004. View Article : Google Scholar : PubMed/NCBI
|
|
56
|
Calin GA and Croce CM: MicroRNAs and
chromosomal abnormalities in cancer cells. Oncogene. 25:6202–6210.
2006. View Article : Google Scholar : PubMed/NCBI
|
|
57
|
Zhang L, Huang J, Yang N, Greshock J,
Megraw MS, Giannakakis A, Liang S, Naylor TL, Barchetti A, Ward MR,
et al: microRNAs exhibit high frequency genomic alterations in
human cancer. Proc Natl Acad Sci USA. 103:9136–9141. 2006.
View Article : Google Scholar : PubMed/NCBI
|