Introduction
Pancreatic cancer (PC) has one of the highest
mortality rates among all cancers worldwide with an estimated
5-year survival rate of <5% (1). In the past decade, the incidence of
pancreatic cancer has been on the rise in areas such as the United
States of America, China, Japan and some European countries
(2,3). Prognosis remains poor due to its
clinically elusive nature; patients often present with late-stage
disease. Aside from surgery, other treatment options have not been
reported to improve survival (4).
Approximately 10% of patients are diagnosed with early stage PC,
while 52% of patients often present with metastasis to surrounding
tissues or organs (4). Although
pancreatic cancer is the fourth leading cause of cancer-associated
mortality worldwide, limited attention and funding have been placed
into investigating PC; thus, determining novel biomarkers of this
disease is delayed (5-7). Its genetically complex histological
nature has also contributed to the slow progress in identifying new
molecular targets (8,9). Various genes, such as cell-cell
adhesion molecules, members of the cadherin families and integrins
have been identified as modulators of metastatic progression
(10). Furthermore, other
molecules, including metalloproteinases and metastatic suppressor
genes, have been shown to serve crucial roles in distant metastasis
(11). Circulating exosomes as
markers of early detection have demonstrated promising outcomes;
however, they often have lower predictive efficacies and lack
specificity (12,13). Therefore, further investigation
into PC is required to identify novel biomarkers with higher
prognostic potential. The lack of effective predictive markers for
PC has been associated with poor survival rates in patients with
this devastating disease (14).
This suggests that identifying genes and proteins that serve key
roles in the invasion and metastasis of PC is important.
Collagen type VI α1 chain (COL6A1), a gene located
on chromosome 21, contributes to maintaining the integrity of
various tissues (15). This gene
encodes the α1 (VI) chain of type VI collagen which is a primary
extracellular matrix protein (16). Its expression in tissues such as
the gastrointestinal tract, brain, and pancreas is notably low
(17). In tumors, however, the
expression of COL6A1 transcripts and the of collagen VI proteins
are markedly higher than in corresponding normal tissues (18). Overexpression of COL6A1 in these
tissues has been reported to enhance motility and metastasis of
lung, prostate, and cervical cancers cells, while knockdown of
COL6A1 has led to the suppression of metastatic ability (18-20).
In addition, COL6A1 stimulates cell motility and supports distant
colonization via the expression of oncogenic transcription factors
by altering tumor suppressor P53 and SMAD family member 4 (21,22).
COL6A1 has been associated with invasiveness and metastatic
activity in other cancers; however, its role in the metastasis and
prognosis of PC remains unknown (11,18,23).
In this study, we successfully established a novel
pancreatic cancer cell model, BxPC-M8, with enhanced migratory and
invasive characteristics, derived from the parent cell line BxPC-3.
COL6A1 was found to be significantly upregulated in BxPC-M8 cells.
Furthermore, its suppressed metastatic ability became apparent
after downregulating COL6A1 via RNA interference. Coupling these
findings with the clinical parameters of patients, we reported an
association between COL6A1 expression and shorter overall survival
(OS). To the best of our knowledge, the present study is the first
to demonstrate that COL6A1 could promote metastasis and portends
poor prognosis in patients with PC.
Materials and methods
Patients and clinical samples
The present study was approved by The First
Affiliated Hospital of Zhejiang University (FAHZJU) Ethics
Committee (approval no. 2018-1033) and was conducted in accordance
with the 1964 Declaration of Helsinki and its later amendments.
Written informed consent was obtained from patients. The data of 65
patients with a confirmed pancreatic adenocarcinoma who underwent
Whipple surgery or distal pancreatectomy were reviewed
retrospectively from January 2015 to October 2017. Other pancreatic
tumor types, such as neuroendocrine and acinar cell carcinomas were
not included. We analyzed clinical parameters, such as age, sex,
pre-surgical carbohydrate antigen 19-9 (CA199) levels, histological
types, tumor size/location and stage at diagnosis according to the
AJCC Cancer Staging Manual 8th Edition: Pancreas and Hepatobiliary
Cancers Staging (24).
Paraffin-embedded tissues samples were acquired from the tissue
bank of FAHZJU. Patients were regularly followed-up by telephone or
at scheduled clinic visits. Initial follow-up after surgery was
conducted once a month for the first 6 months, then every 3 months
for a total of 50 months. Initially, 67 patients were recruited in
the study; however, as of the mismatch of clinical data for certain
samples, 2 patients were omitted from analysis. Thus, only 65
patients (27 males and 38 females) with median age 62 years (range,
24-82 years) were used in the final data analysis. In addition,
survival data in association with COL6A1 expression was obtained
from The Cancer Genome Atlas and the Genotype-Tissue Expression
databases through the Gene Expression Profiling Interactive
Analysis (GEPIA) website (https://gepia.cancer-pku.cn/) (25). GEPIA data of 178 PC patients with
COL6A1 expression data were used in the OS and disease-free
survival (DFS) plots. Under single gene analysis, the OS and DFS
analysis were set as follows: Select Gene was 'COL6A1'; group
cutoff-high (%) vs. group cutoff-low (%) in respective groups were
set to '40', Hazard ratio and 95% confidence interval (CI) were set
to 'Yes' with 'months' as the axis unit, and 'PAAD' was selected as
thecancer type in the dataset selection menu.
Cell lines and cell culture
Polycarbonate Transwell membrane inserts with
8-μm pores (6-well, Corning 3428, Corning Inc.) were used to
isolate cells with high migration ability from the parent BxPC-3
cell line (China Center for Type Culture Collection). First, 24 h
serum-starved BxPC-3 cells were suspended in serum-free RPMI-1640
(Meilunbio) to a final cell density of 20×104 cells/ml.
Cell suspension (1 ml) was applied into the upper chamber, while
the lower well beneath the polycarbonate membranes was filled with
2 ml RPMI-1640 supplemented with 10% FBS (Biological Industries) to
create a chemotactic gradient to stimulate penetration of the
cells. Following 24 h of incubation at 37°C, the cells on the
underside of the membrane were harvested aseptically, expanded and
re-seeded in RPMI-1640 containing 10% FBS. After eight rounds of
harvest and expansion, the highly metastatic cells which migrated
through to the underside of the membranes were harvested and
labeled as BxPC-M8. BxPC-3 and BxPC-M8 cells were cultured in
RPMI-1640 with 10% FBS.
Cell morphology and growth rate in
vitro
BxPC-3 and BxPC-M8 cells were sub-cultured into
60-mm dishes for 48 h. Giemsa staining was carried out by a
commercial kit (Nanjing Jiancheng Bioengineering Institute).
Stained cells were observed and photographed with a bright field
microscope (x100 magnification). To determine the cell growth rate
in vitro, BxPC-3 and BxPC-M8 were plated into 6-well tissue
culture plates at a density of 4×10⁴ cells/well. Three
counts for each cell line were made by Beckman Vi-CELL Automated
Cell Viability Analyzer (Boston Industries, Inc.) every 24 h for 8
days. The doubling time (DT) was calculated using the equation DT=
[2log/(logN-logNo)]x t, where t indicates the number of hours,
while No and N represent the time at inoculation and after culture
t-hours, respectively.
Wound healing assay
Cells were seeded into two 6-cm Petri dishes and
incubated for 72 h in RPMI-1640 solution supplemented with 10%
bovine serum at 37°C to 100% confluence. A 200-μl sterile
pipette tip was used to create a scratch wound on the monolayer of
cells. The detached cells were then removed by washing the
supernatant with serum-free RPMI-1640 medium. Subsequently, fresh
growth medium with 10% FBS was added, and cells were placed in a
humidified incubator at 37°C with 5% CO2. Images were
captured at 0 and 24 h. The migrating distance was recorded as the
relative distance of scratch closure from time 0 and 24 h using
measurements from analysis using an inverted microscope (x100
magnification) and MIPAR Image Analysis software v1 (MIPAR LLC).
Three fields per view were analyzed for each cell line. Experiments
were performed in triplicate.
Cell migration and invasion assays
Polycarbonate membrane Transwell (24 well, Corning
3422, Corning, Inc.) and Matrigel (BD Biosciences) were used for
the migration and invasion assays. BxPC-3 and BxPC-3 M8 cells were
each suspended in serum-free RPMI-1640 medium to a final cell
density of 20×104 cells/ml, and 200 μl of the
cell suspension was seeded to the upper chamber, while 500
μl fresh growth medium with 10% FBS was added to the lower
chamber as a chemoattractant. After 24 h at 37°C with 5%
CO2 in a humidified incubator, the FBS-free medium in
the upper chamber was discarded, and the non-migrated or
non-invasive cells were completely removed with a cotton swab. The
upper chamber was then taken and placed in different wells
containing 360 μl Giemsa stain A solution (Nanjing Jiancheng
Bioengineering Institute) for 2 min followed by 720 μl
Giemsa stain B solution (Nanjing Jiancheng Bioengineering
Institute) for 6 min at room temperature. The membrane was removed
and placed on respective slides (BxPC-3 and BxPC-3 M8) for
microscopic observation. Cells were then counted under an inverted
light microscope in three independent fields at x100 magnification.
Experiments were independently performed in triplicate.
Gene sequencing and reverse
transcription-quantitative polymerase chain reaction (RT-qPCR)
analysis
Using TRIzol reagent (Thermo Fisher Scientific,
Inc.), total RNA was extracted from BxPC-3 and BxPC-M8 cells; total
RNA was sent to the Beijing Genomics Institute for gene sequencing.
A 2-fold or greater difference denoted differential expression from
normalized fluorescence intensity between the BxPC-3 and BxPC-M8
cells. Subsequently, total RNA was reverse transcribed into cDNA
using the iScript cDNA Synthesis kit (Bio-Rad Laboratories, Inc.)
according to the manufacturer's protocol. qPCR was performed on an
ABI PRISM 7900 Sequence Detection System (Applied Biosystems;
Thermo Fisher Scientific Inc, CA, USA) using an iTaq universal SYBR
Green supermix (Bio-Rad Laboratories, Inc.). Amplification
reactions required 1 μl of cDNA template, 0.3 μl each
of the forward and reverse primers (10 μM), 0.2 μl of
50X ROX Reference Dye II (Takara Bio Inc.), 5 μl of 2X SYBR
Premix DimerEraserin, and 3.5 μl ddH2O to a total
volume of 10 μl. Sequences of the primers used are listed in
Tables SI-IIII. Amplification of
the transcripts involved an initial denaturation at 95°C for 30
sec, followed by 40 cycles at 95°C for 5 sec, 55°C for 30 sec, and
72°C for 34 sec. Relative quantification was determined using the
comparative threshold cycle method. β-actin was used as an internal
control for normalization. All RT-qPCR reactions were performed in
triplicate. Data were calculated using the 2−ΔΔCq method
(26).
3-(4,5-Dimethylthiazol-2-yl)-2,5-diphenyltetrazolium bromide
assay
Cells were collected and resuspended to a final
concentration of 104 cells/ml in separate BxPC-M8 and
BxPC-3-labeled plates respectively. Aliquots of the cell suspension
were evenly distributed into 96-well plates. After incubating for
24 h at 37°C, the designated columns were treated with gemcitabine
(Meilunbio) at concentrations 0, 0.2, 0.5, 1, 2, 5, 10, 20, 50 nM
and incubated for 72 h at 37°C. MTT was added 4 h prior to
analysusis. Formazan, the metabolite of MTT was dissolved with 150
μl dimethyl sulfoxide in each well. After 4 h of incubation
at 37°C, all aliquots were discarded. The absorbance in individual
wells was determined at 570 nm using a microplate reader (Bio-Rad
Laboratories, Inc.).
Western blotting
Cells were seeded into a 6-cm petri dish in
RPMI-1640 medium supplemented with 10% bovine serum. At ~80%
confluence, cells were lysed with radioimmunoprecipitation assay
buffer (Beyotime Institute of Biotechnology) containing protease
and phosphatase inhibitors. The lysates were subjected to several
freeze-thaw cycles to ensure complete lysis. The concentration of
lysates was determined with the micro-bicinchoninic acid protein
estimation kit (Bio-Rad Laboratories, Inc.). The protein
concentrations were adjusted, and solutions were prepared under
reducing conditions with 5% β-mercaptoethanol. Equal amounts (30
μg/lane) of protein were fractionated via 12% SDS-PAGE gels
and transferred to polyvinylidene difluoride membranes, blocked in
5% milk in PBS at room temperature for 1 h, and incubated with
primary antibodies against COL6A1 (ab151422, Abcam), β-actin
(13E5), E-cadherin (24E10), N-cadherin (D421H), vimentin (D21H3),
snail (C15D3) and matrix metalloproteinase (MMP)-9 (D603H) (Cell
Signaling Technology, Inc.) in a dilution of 1:1,000 overnight at
4°C. After washing with TBS containing 0.1% (v/v) Tween-20, the
membranes were incubated with horseradish peroxidase-conjugated
goat anti-mouse (ab6728, Abcam) or rabbit (ab6721, Abcam) secondary
antibodies in a dilution of 1:2,000 at room temperature for 2 h.
The expression levels of COL6A1, β-actin, E-cadherin, N-cadherin,
vimentin, snail and MMP-9 were analyzed. Bands were visualized
using ECL kits according to the manufacturer's instructions
(Abcam). Densitometric analysis was performed using Image Lab ver.
6.0.0 build 26 (Bio-Rad Laboratories, Inc.).
Tissue microarray (TMA) and
immunohistochemistry (IHC) analyses
Paraffin-embedded tissue samples were sent to
Shanghai Outdo Biotech Co. Ltd. For TMA construction.
Immunohistochemistry was performed using an indirect
immunoperoxidase method, as previously described (27). Briefly, after incubation at 60°C,
slices were deparaffinized in xylene and rehydrated in alcohol.
Antigen retrieval was performed in citrate buffer at 120°C for 10
min in a decloaking chamber. Endogenous peroxidase was blocked by
3% hydrogen peroxide for 10 min at room temperature. Sections (4
μm thickness) were incubated with anti-COL6A1 primary
antibody (ab151422, Abcam) at 1:700 dilution overnight at 4°C.
After applying horseradish peroxidase-conjugated rabbit secondary
antibody (ab6721, Abcam) in a 1:2,000 dilution at room temperature
for 2 h, sections were treated with a Liquid DAB+ Substrate
Chromogen System (K3468; Dako; Agilent Technologies, Inc.) for the
chromogenic reaction and with Mayer's hematoxylin for
counterstaining according to the manufacturer's protocol. Images
were captured with the NanoZoomer Digital Pathology 2.0RS and
analyzed with NDP.view2 Viewing software version 2.7.25 (Hamamatsu
Photonics K.K.). Three independent research pathologists
semi-qualitatively categorized all samples into two groups. Similar
to previously described (28)
scoring method, the cytoplasmic dye color intensity of tumor cells
from each sample was determined and denoted '+' for stained
cytoplasm and '-' for negative staining. Samples with '−' were
assigned 'COL6A1−' expression, whiles those identified
as '+' were assigned 'COL6A1+'.
RNA interference
All small interfering RNAs (siRNAs) were purchased
from Shanghai GenePharma Co., Ltd. Transient transfection of each
siRNA for COL6A1 knockdown was conducted using Lipofectamine® 2000
transfection reagent (Invitrogen; Thermo Fisher Scientific, Inc.),
according to the manufacturer's protocols. The siRNA sequences were
as follows: genOFFTM st-h-COL6A1_001, 5′-GCATTGGCCTGCAGAACTT-3′;
genOFFTM st-h-COL6A1_002, 5′-CGGTGCCTTTGGACTGAAA-3′; genOFFTM
st-h-COL6A1_003, 5′-CCATGGACTTTATCAACGA-3′ and negative control
(NC)-siRNA, 5′-UUCUCCGAACGUGUCACGUTT-3′. The cells weretransfected
with st-h-COL6A1 or (NC)-siRNA for 48 h at a final concentration of
30 nM, and the efficiency of each siRNA oligo duplex was confirmed
by RT-qPCR.
Statistical analysis
Statistical analysis was performed using IBM SPSS
Statistics software for macOS v.25.0 (IBM Corp.) and GraphPad Prism
7.0a (GraphPad Software, Inc.). The OS was calculated as the time
from the date of primary surgery to the date of reported mortality
from any cause and survival was censored at the date of the last
contact. Pearson's χ2 test was used in the qualitative
analysis. In addition, a Student's t-test, Mann-Whitney U or
Kruskal-Wallis test adjusted by the Bonferroni correction, was
performed. Patient survival was analyzed via Kaplan-Meier analysis
followed by a log-rank test. The Cox proportional hazard model was
used for the univariate and multivariate analysis. All analysis
were two-tailed; P<0.05 was considered to indicate a
statistically significant difference.
Results
BxPC-M8 shares similar biological
characteristics to BxPC-3 but possesses an epithelial-mesenchymal
transition (EMT) morphological phenotype
To study potential factors associated with
metastasis in PC, we established a novel metastatic pancreatic
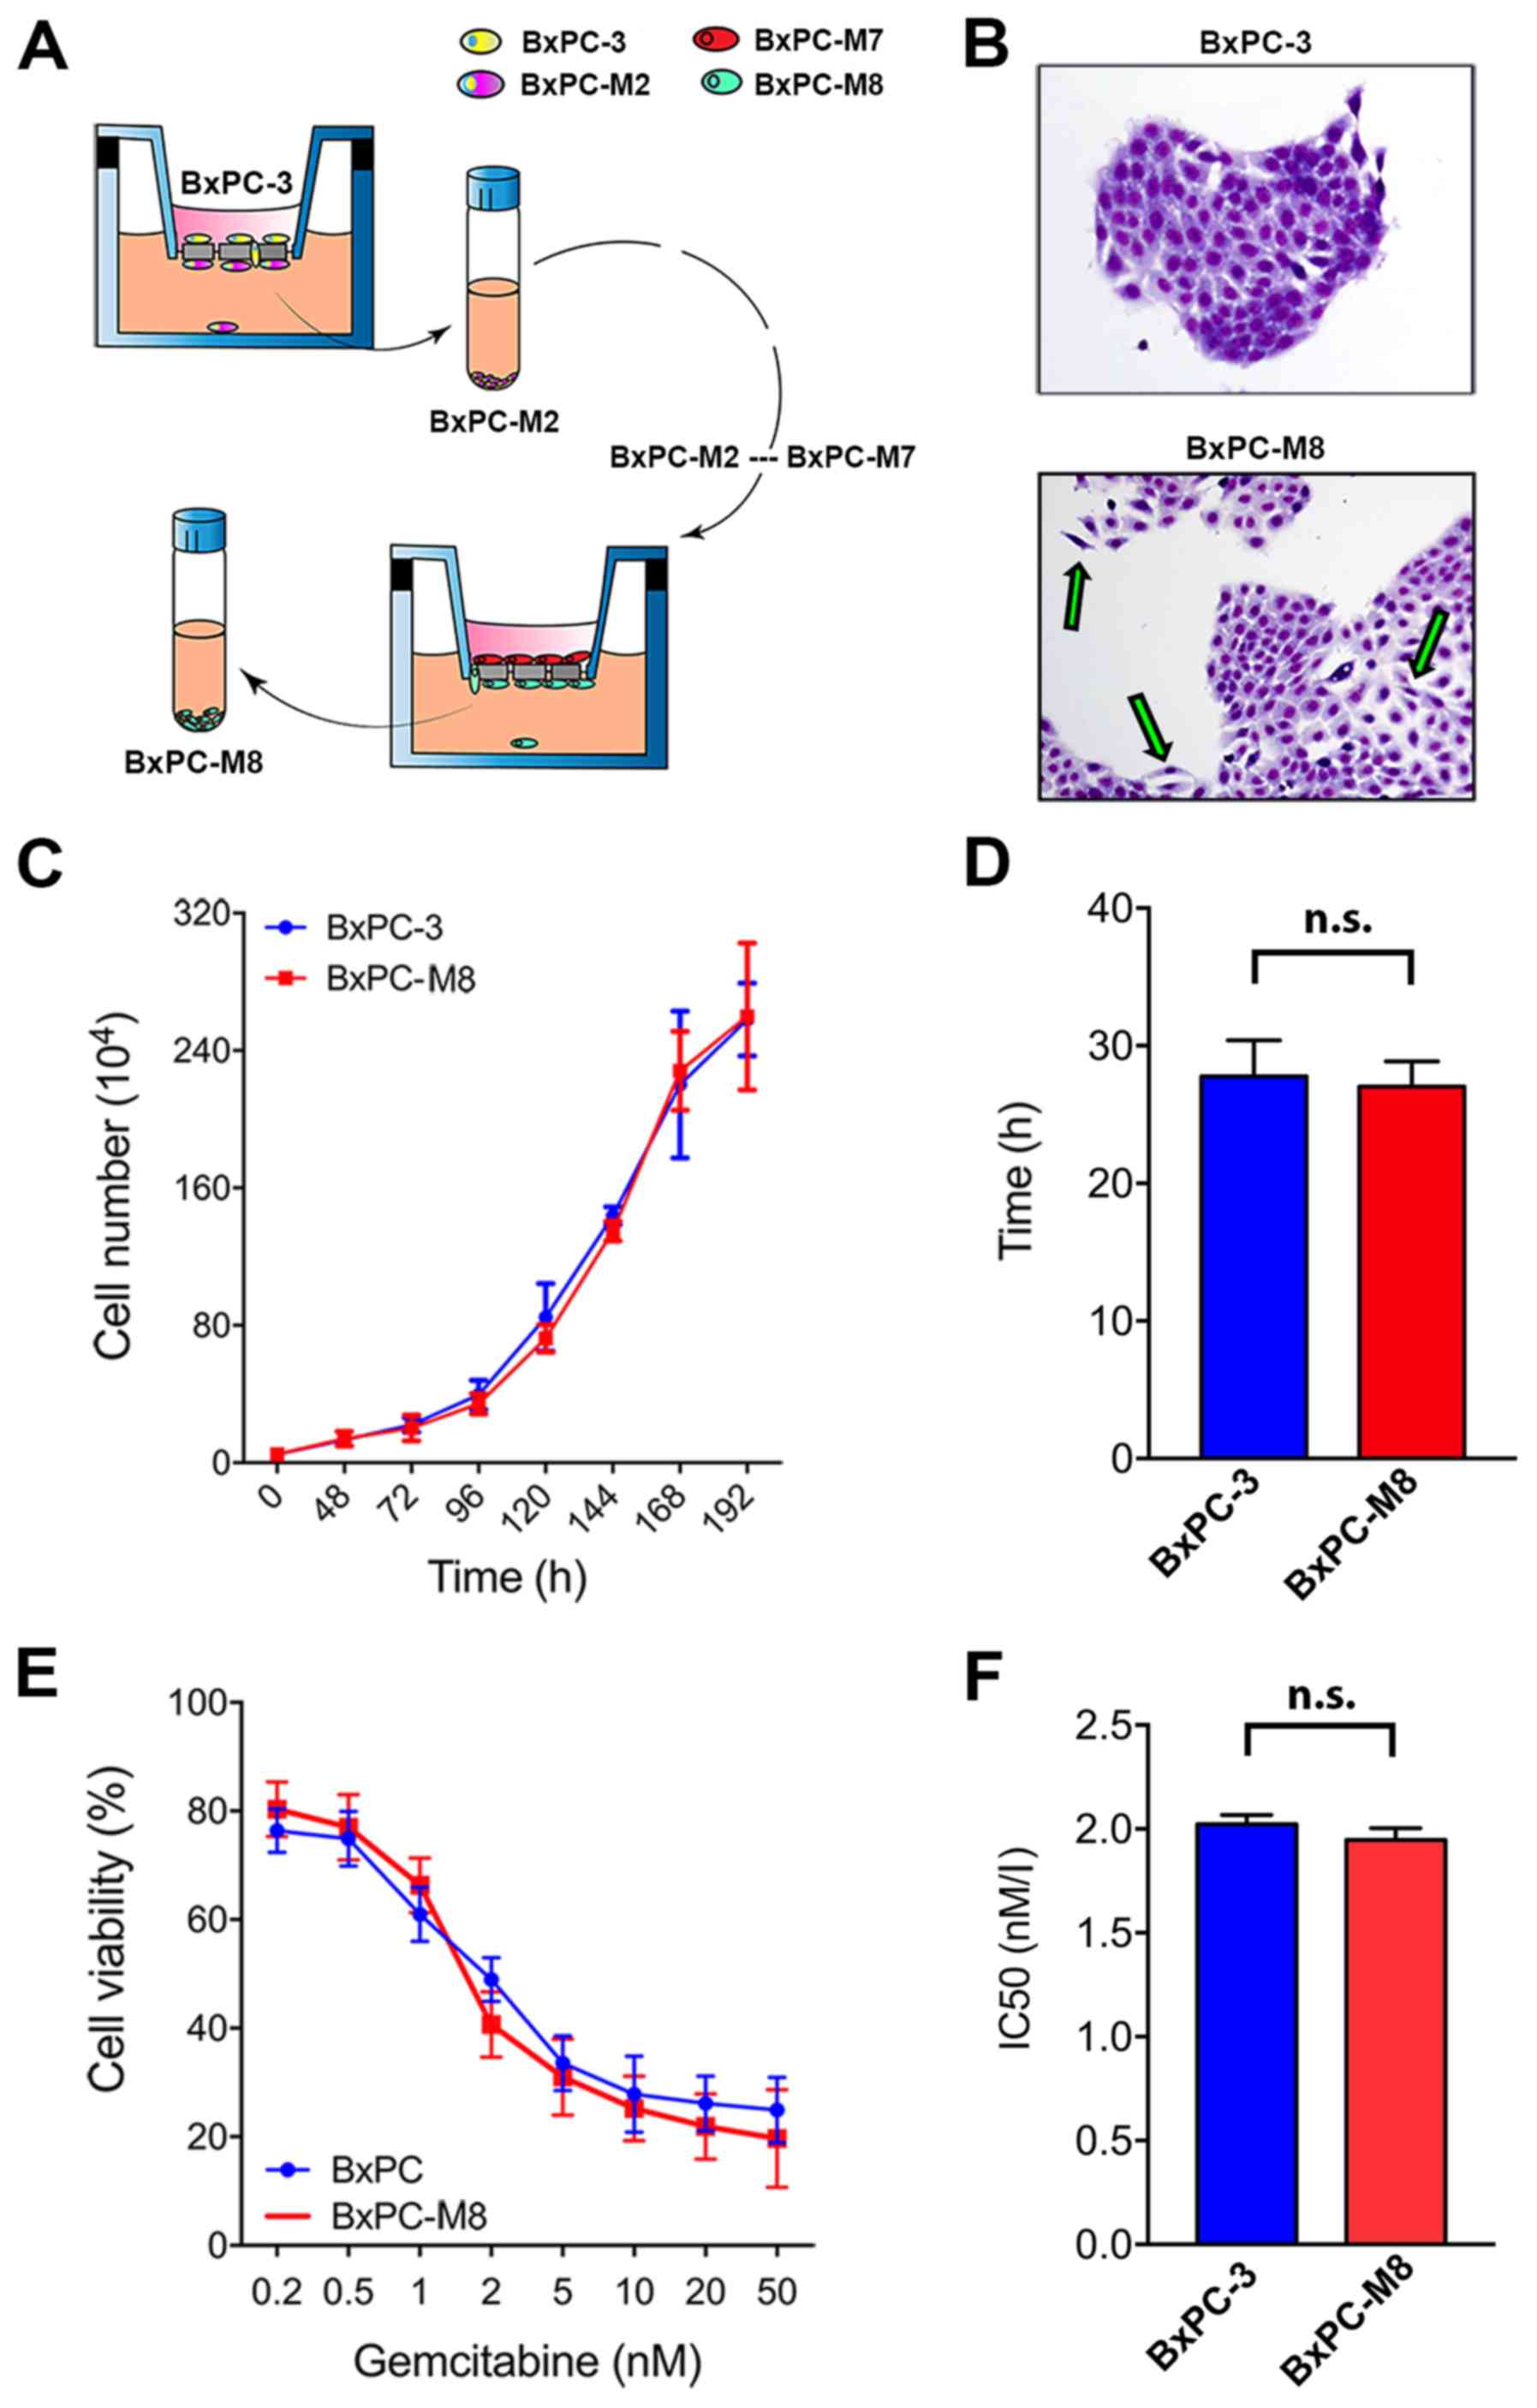
cancer cell model, BxPC-M8, from BxPC-3 cells (Fig. 1A). STR profiling revealed an
identity score of 1.00, validating that all allele locations of
BxPC-M8 matched those of BxPC-3, indicating no cross contamination
(Table SIV). As presented in
Fig. 1B, BxPC-3 cells demonstrated
more cohesion with clear demarcations and tight colony edges, while
BxPC-M8 cells appeared spindle-shaped with a relatively reduced
nucleus-to-cytoplasm ratio. These characteristics suggested that
BxPC-M8 exhibited morphological features associated with EMT as
described in other PC cell lines (29,30).
The growth assay showed that both BxPC-3 and BXPC-M8 cells had
similar proliferation rates (Fig.
1C). The DTs for the BxPC-3 and BxPC-M8 cell lines were
27.8±2.6 and 27.0±1.8 h, respectively (Fig. 1D). Additionally, sensitivity to the
commonly used chemotherapeutic drug gemcitabine was comparable
between BxPC-3 and BxPC-M8 with, with half-maximal inhibitory
concentration values of 2.02±0.08 and 1.95±0.08 nM, respectively
(Fig. 1E and F). These results
indicated that BxPC-M8 has a notably similar proliferation pattern
and drug sensitivity to BxPC-3.
BxPC-M8 demonstrates enhanced migration
and invasive abilities
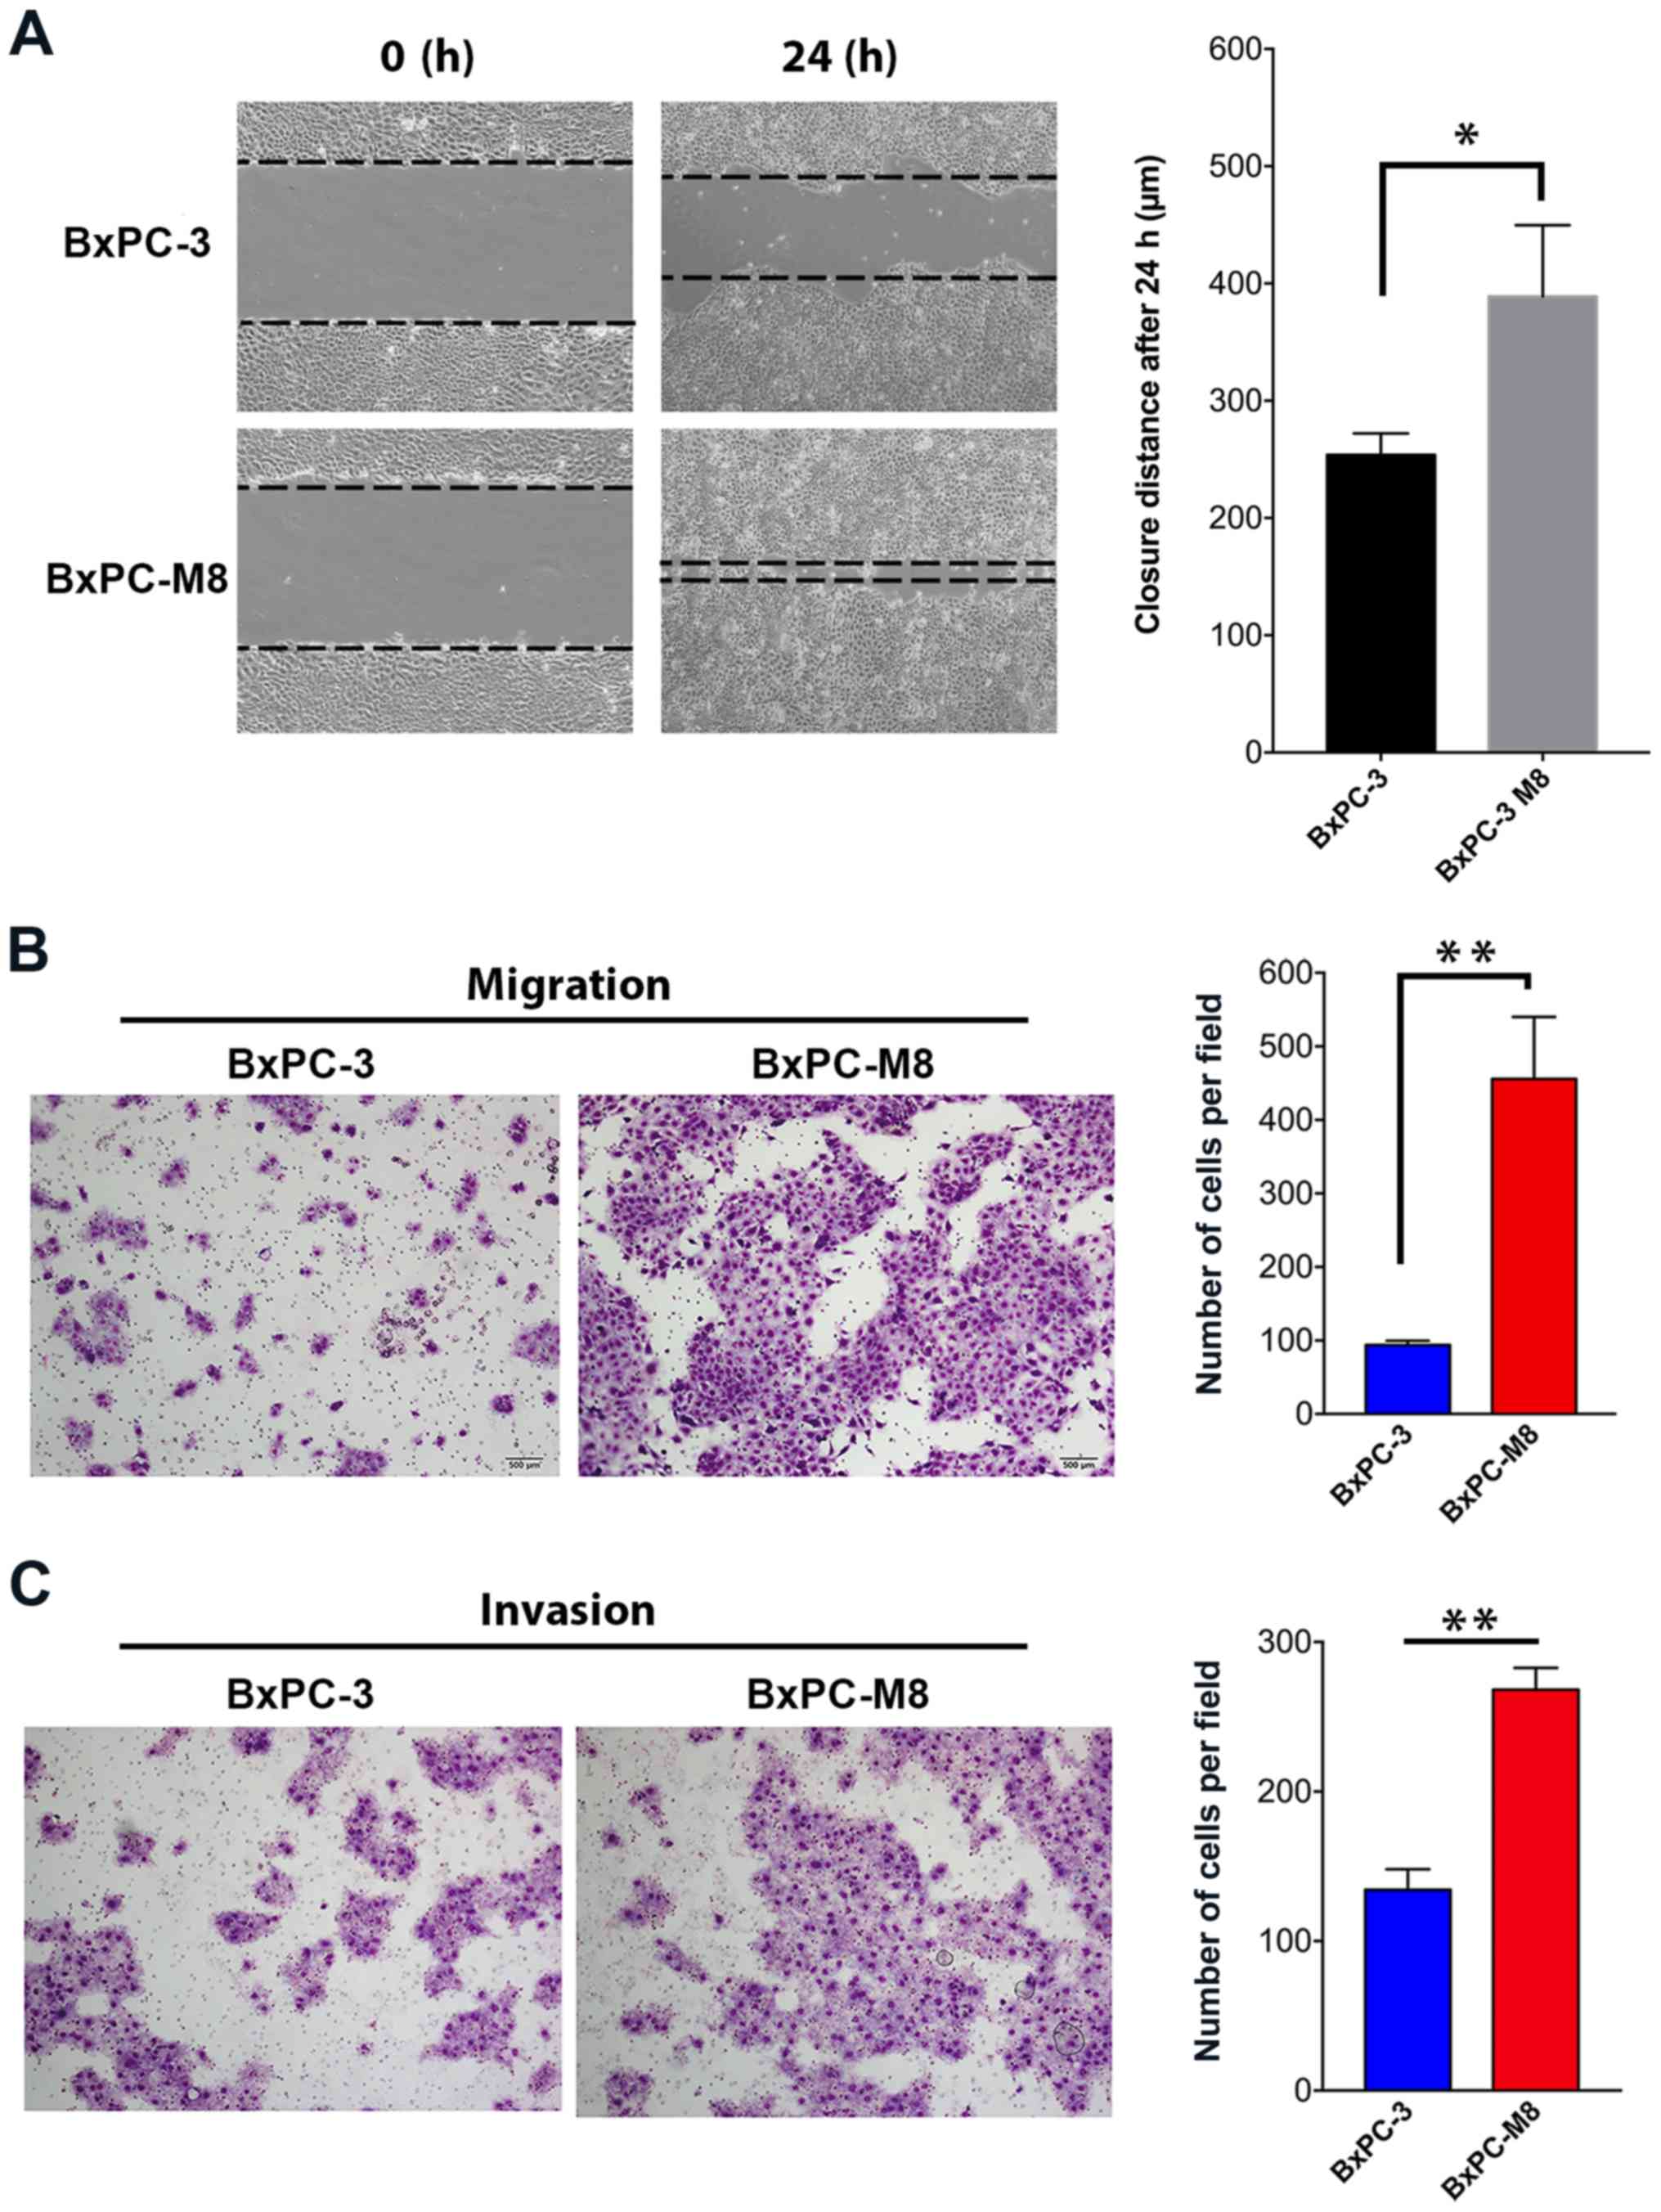
The migration abilities between the BxPC-3 and
BxPC-M8 cell lines were first compared using a wound-healing assay
(Fig. 2A). The size of the wound
as a function of the migration ability of each cell line was
determined at 0 and 24 h. Compared with the parental BxPC-3, we
observed a near complete closure of the central area of confluence
in BxPC-M8 cells, indicating an enhanced migration ability of
BxPC-M8 cells (P=0.021; Fig. 2A).
Migrated cells in the Transwell assay were quantified by microscopy
(Fig. 2B). The resules revealed
93±5 versus 455±84 migrated cells per field view in BxPC-3 and
BxPC-M8, respectively (P<0.01; Fig.
2B). Furthermore, similar results were also observed in the
Matrigel invasion assays between BxPC-3 and BxPC-M8 cells; 135±14
invading cells were counted per field for BxPC-3, while those for
BxPC-M8 were 268±14 (P<0.05; Fig.
2C). In both experiments, each field was counted in triplicate.
Our findings indicated that BxPC-M8 cells exhibited significantly
enhanced migration and invasive properties compared with parent
BxPC-3 cells.
COL6A1 is a potential metastatic
gene
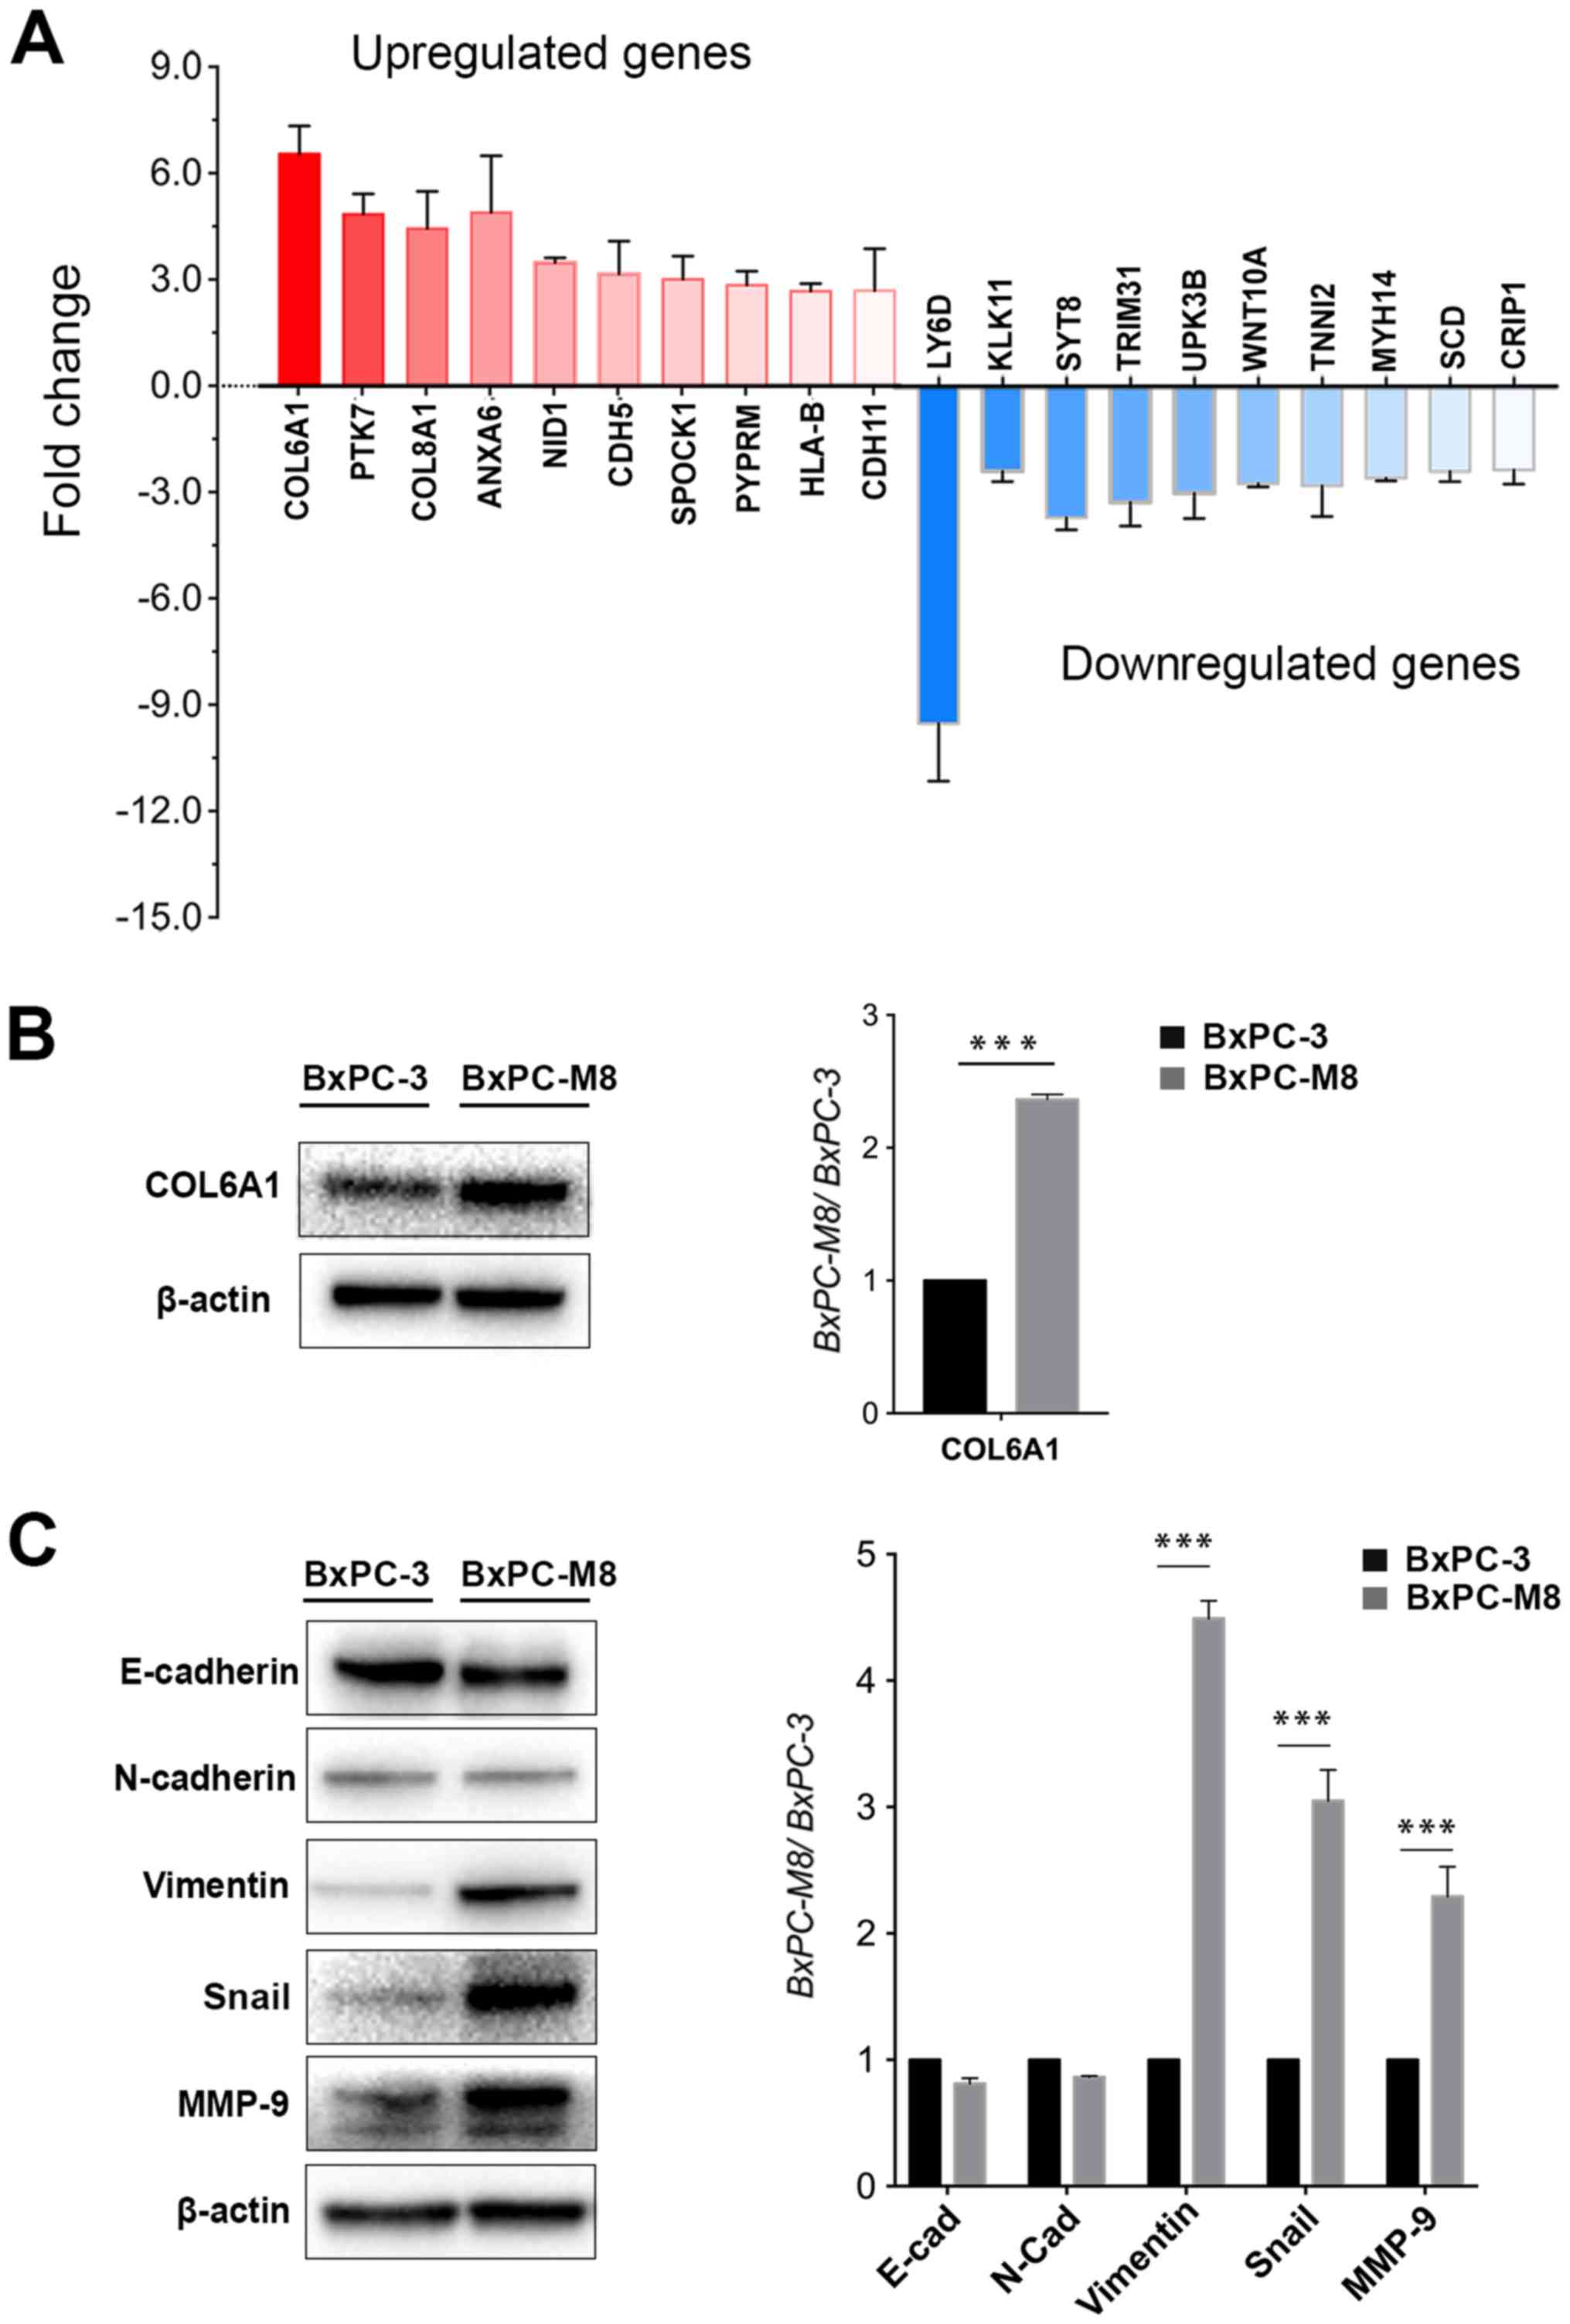
To further understand the molecular mechanisms
underlying the highly metastatic activity of BxPC-M8, the
differential expression of numerous genes were investigated by gene
sequencing. The results revealed >1,000 genes to be
differentially expressed (>1.5-fold change) between BxPC-3 and
BxPC-M8 cells. A total of 20 genes with the highest difference in
expression between BxPC-3 and BxPC-M8 were selected. Subsequently,
RT-qPCR revealed that COL6A1, protein tyrosine kinase 7, Annexin
A6, nidogen 1 and cadherin (CDH)5 were upregulated with a
>3-fold increase, while osteonectin, protein tyrosine
phosphatase receptor type M, major histocompatibility complex,
class I, B, CDH11 and C-C motif chemokine ligand 21 had a
>2-fold increase in expression. In contrast, lymphocyte antigen
6 family member D, kallikrein 11, synaptotagmin 8, and tripartite
motif containing 31 were downregulated with a >3-fold difference
(Fig. 3A). Western blot analysis
indicated that COL6A1 was also upregulated in BxPC-M8 compared with
BxPC-3 (Fig. 3B). Among the
collagen type VI encoding genes COL6A1, COL6A2, COL6A3, COL6A4P1,
COL6A4P2, COL6A5 and COL6A6, only COL6A1 could adequately be
detected according to whole-genome sequencing of BxPC-3 and BxPC-M8
(data not shown). As established, COL6A1 only encodes the collagen
VI α1 chain (31). This suggested
that increased expression of COL6A1 could be linked to the enhanced
migratory and invasive abilities we observed in the present study.
In addition, the expression of EMT-related proteins were
investigated in BxPC-3 and BxPC-M8 cells. Compared with parent
BxPC-3 cells, the expression of Snail, vimentin and MMP-9 were
significantly increased in BxPC-M8 (P<0.001; Fig. 3C). Our results indicated that
BxPC-M8 could express a typical EMT phenotype. We proposed that
COL6A1 may be associated with EMT and potentially contributes to PC
metastasis.
COL6A1 silencing inhibits the migration
and invasion of BxPC-M8 cells
To examine whether COL6A1 plays a key role in PC
metastasis, we knocked down COL6A1 expression by using three siRNA
vectors targeting different regions of COL6A1 mRNA. Only the third
siRNA vector (Si3 group) resulted in a signficant decrease in
COL6A1 expression (1.88-fold) compared with the NC (P<0.01;
Fig. 4A). Western blot analysis
confirmed a signficant decrease in COL6A1 expression in the Si3
group cells compared with the NC group (Fig. 4B). As expected, expression levels
of Snail and vimentin were signficantly decreased in the Si3 group
compared with the NC group. The expression levels of E-cadherin
were significantly increased in the Si3 group than in the NC group
(P<0.001). These results suggested that COL6A1 knockdown could
inhibit EMT in PC. On the contrary, no significant difference in
MMP-9 expression was observed after siRNA knockdown of COL6A1,
which indicates that COL6A1 expression and its pathways may exert
little or no influence on MMP-9 expression in BxPC-M8 cells.
Furthermore, we examined the migration ability of BxPC-M8 via a
Transwell assay after silencing COL6A1. The number of migrated
cells in the NC and Si3 groups were quantified under microscopy as
presented in Fig. 4D. A
significant decrease in cell count was seen in the Si3 group
compared with in the NC group; 168±13 for the NC group vs. 93±7
cells for the Si3 cells per field (P<0.05). The invasive ability
between NC and Si3 was evaluated and a quantitative assessment
indicated significant reductions in cell invasion in the Si3 group
compared with the NC group. Invasive cells counted per field for
the NC group were 217±31, while those for Si3 group was 100±17
(P<0.01; Fig. 4E). This
suggests that silencing of COL6A1 can decrease the migration and
invasion of PC cells via regulation of EMT-associated proteins.
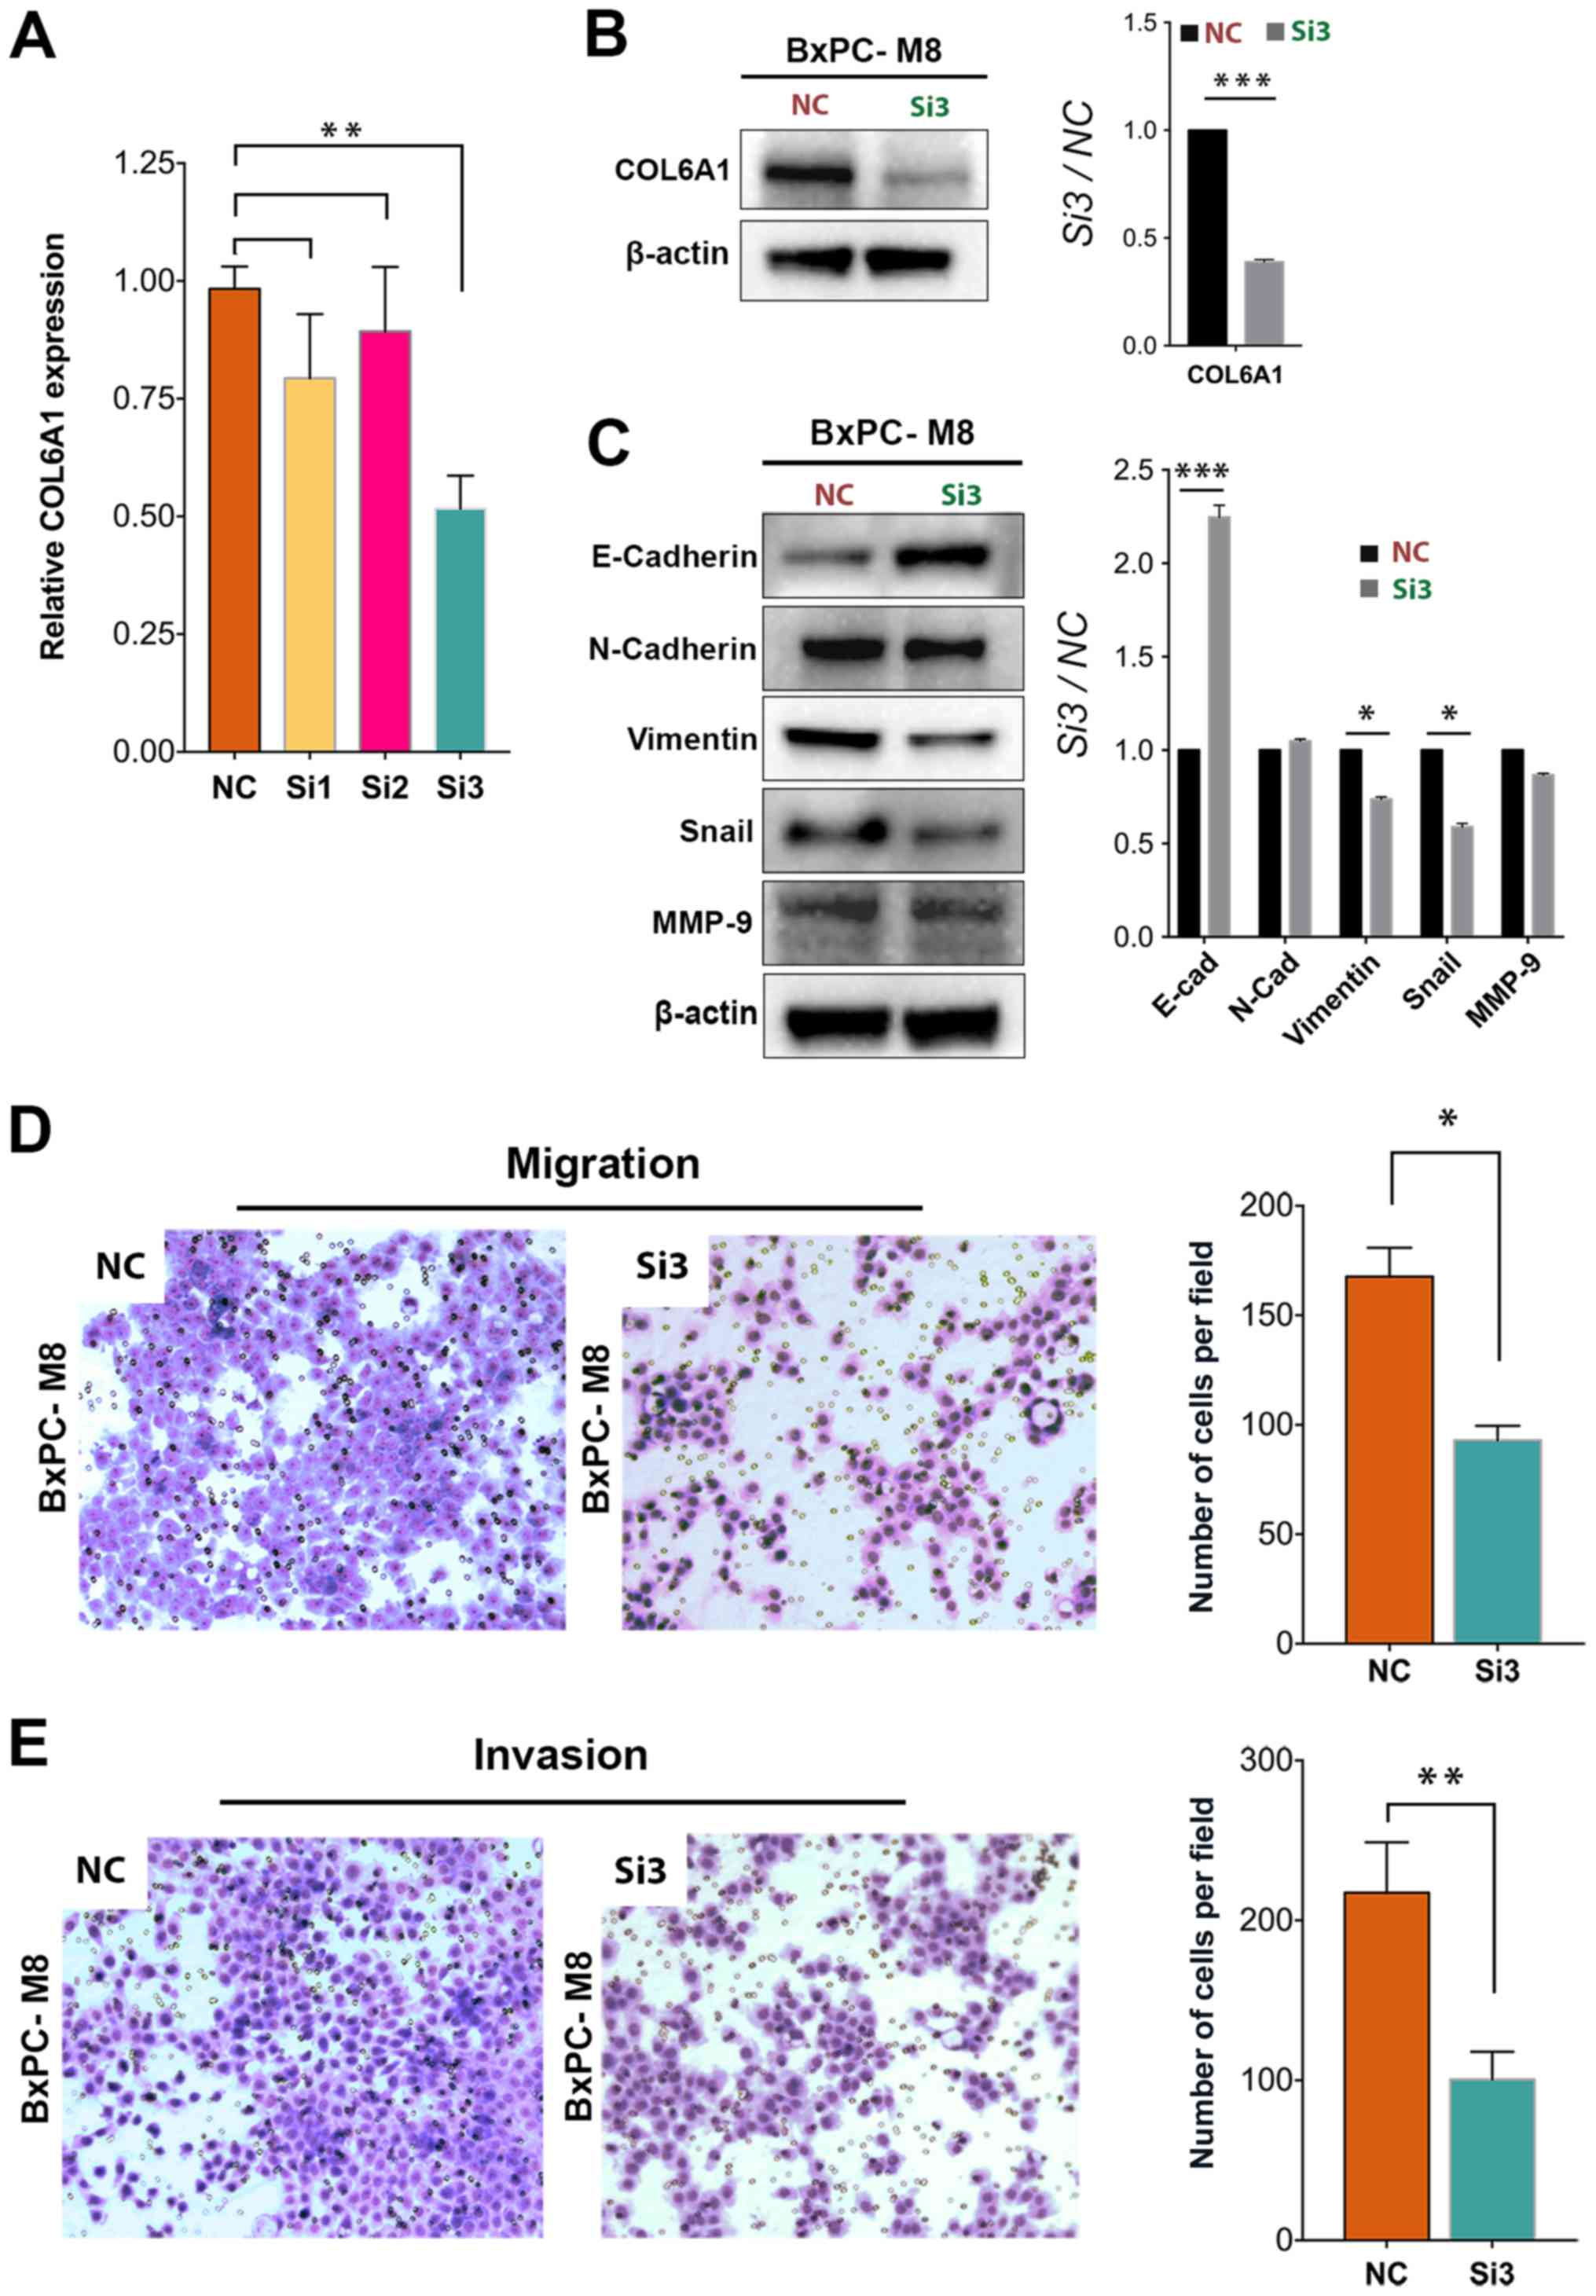 | Figure 4Knockdown of COL6A1 significantly
decreases the migration and invasion of BxPC-M8 cells. (A)
Significantly decreased COL6A1 expression was observed following
COL6A1 knockdown between the NC and the Si3 knockdown group,
(P=0.022 by Kruskal-Wallis test; error bars indicate the standard
deviation). (B and C) siRNA knockdown of COL6A1 causes significant
decreases in epithelial-mesenchymal transition proteins, such as
vimentin but increased the expression of E-cad in BxPC-M8 cells, as
determined by western blotting (left panel). Relative
semi-quantitative analysis results are also presented (right
panel). (D and E) COL6A1 knockdown revealed decreases in the
migration and invasion of BxPC-M8 cells as determined by Boyden
Chamber and Matrigel-coated Boyden Chamber assays, respectively.
Images are Giemsa stained and captured at x100 magnification.
*P<0.05, **P<0.01,
***P<0.001. COL6A1, collagen type VI α1 chain; E-cad,
E-cadherin; N-cad, N-cadherin; MMP-9, matrix metalloproteinase-9;
NC, negative control; siRNA, small interfering RNA; Si3, third
siRNA. |
COL6A1 expression predicts poor prognosis
in patients with PC
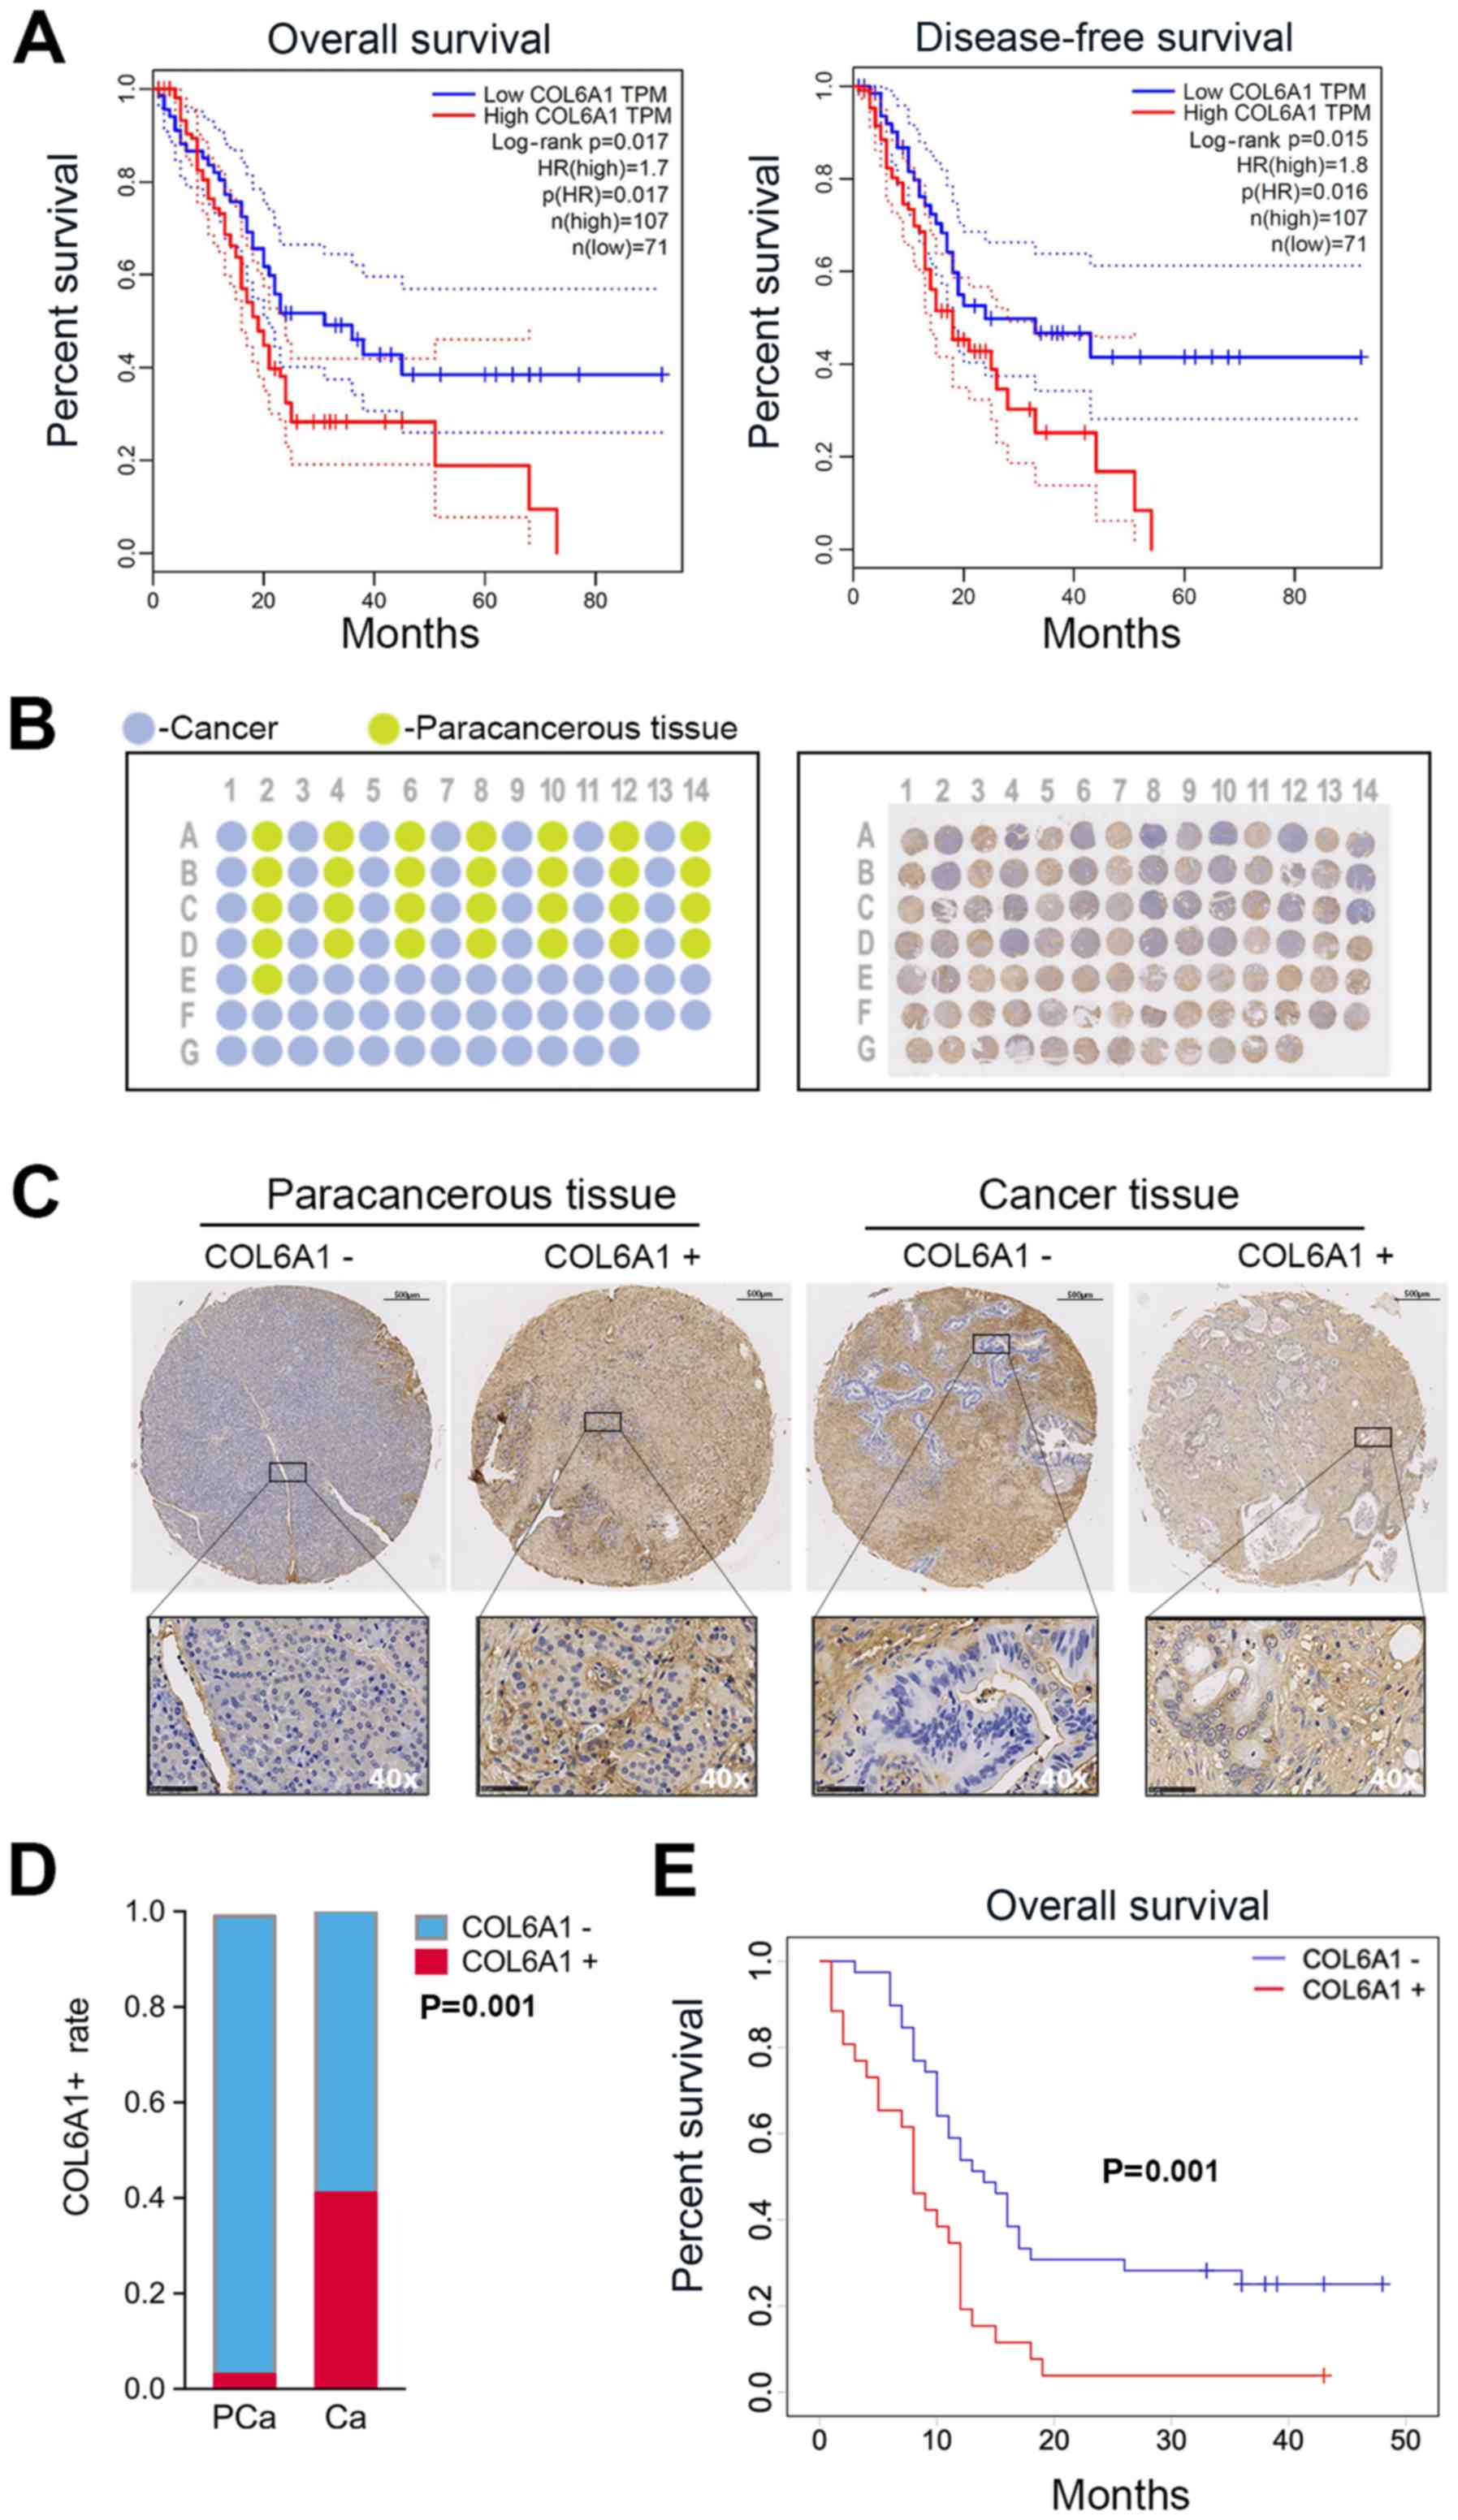
We first determined the relevance of COL6A
expression in human PC by generating survival plots from the GEPIA
database. The preset parameters used for the OS and DFS analysis
were set as follows: Group cutoff-high (%) vs. group cutoff-low (%)
in respective groups set to 40 with a 95% confidence interval (CI).
The results showed a significant increase in OS in patients with
low COL6A1 expression compared with high COL6A1 expression
[P=0.017; hazard ratio (HR) 1.70; n=178]. DFS analysis revealed
increased DFS times in the low COL6A1 expression group compared
with those exhibiting high expression [P=0.016; HR 1.80; n=178]
(Fig. 5A).
To further determine the association between COL6A1
expression and clinical outcomes, paraffin-embedded tissue samples
underwent TMA analysis. A schematic representation of the completed
TMA block from patients are shown in Fig. 5B. Cancer and paracancerous tissues
are represented on the schematic as blue and green circular spots
respectively (Fig. 5B). IHC
analysis of the tissue sections with COL6A1-antibody was performed
to generate a single TMA slide with circular spots (n=96) and TMA
of cancer/paracancerous tissue pairs (n=58) versus cancer only
samples (n=38, Fig. 5B). Circular
sections were fitted onto a single block for further analysis.
Histological grade and tumor type were compared with the clinical
data. Samples from 2 subjects, denoted as E01 and D01, were
determined as inconsistent with clinical and histological data and
were excluded in the final analysis. Representative
COL6A1+ or COL6A1− cancer and paracancerous
tissues have been shown in Fig.
5C. COL6A1+ versus COL6A1− rates between
cancer and paracancerous sample pairs were compared. The results
indicated a significant increase in COL6A1 expression among cancer
samples (11/27, 40.7%) compared with paracancerous tissue pairs
(1/27, 3.7%, Fig. 5D).
Of the patients confirmed for the study (n=65), the
median follow-up was 11 months (range, 1-50 months). The median age
in years for males and females was 62±10 (range, 24-82 years, P=
0.70), with the majority being females (n=38) 58.5% versus (n=27)
41.5%. Significant differences in COL6A1 expression were found
among the the three CA199 categories (P=0.018), metastatic status
(P=0.011), vascular involvement (P=0.004) and American Joint
Committee on Cancer (AJCC) staging (P=0.022) (Table I). Vascular invasion was observed
in 76.9% of patients with COL6A1 expression relative to patients
with negative expression at the time of surgery (41.0%). In the
univariate analysis, COL6A1 expression (HR 2.38, 95% CI 1.38-4.14,
P=0.002), N2-category (HR 2.31, 95% CI 1.18-4.55, P=0.015),
M1-category (HR 2.54, 95% CI 1.43-4.54, P=0.002), advanced AJCC
stages III/IV (HR 2.80, 95% CI 1.51-5.19, P=0.001), vascular (HR
2.28, 95% CI 1.32-3.97, P=0.003) and neural invasion (HR 1.93, 95%
CI 1.08-3.60, P=0.027) were associated with shorter survival, while
N1/N0, M0 and earlier AJCC stages I/II were associated with
relatively longer OS. Multivariate analysis also revealed that
COL6A1+ (HR 1.90, 95% CI 1.04-3.47), distant metastasis
(HR 2.35, 95% CI 1.24-4.47, P=0.009) and vascular invasion (HR
2.08, 95% CI 1.16-3.73, P=0.014) were independent predictors of OS
and were associated with shorter survival (Table II). Kaplan-Meier survival analysis
revealed that patients with COL6A1+ expression had
significantly worse outcomes compared with COL6A1- patients
(Fig. 5E). The median OS for the
COL6A1− group was 14±7 months in contrast to 8±4 months
among the COL6A1+ group. The results from survival
analysis using Kaplan-Meier curves from this study were in parallel
with the data of the GEPIA database. This indicates that COL6A1
expression may be associated with poor prognosis in patients with
PC.
 | Table IClinicopathological characteristics
and COL6A1 expression in pancreatic tumor specimens. |
Table I
Clinicopathological characteristics
and COL6A1 expression in pancreatic tumor specimens.
| | COL6A1 expression
| | |
|---|
| Clinicopathological
parameters | n (%) | − [(n) %)] | + [(n) %] | P-value
(χ2) | P-value
(Kruskal-Wallis) |
|---|
| All cases (n) | 65 | 39 | 26 | | |
| Age (years) | | | | | |
| ≤55 | 14 (21.5) | 11 (28.2) | 3 (11.5) | 0.109 | |
| >55 | 51 (78.5) | 28 (71.8) | 23 (88.5) | | |
| Sex | | | | | |
| Male | 27 (41.5) | 19 (48.7) | 8 (30.8) | 0.150 | |
| Female | 38 (58.5) | 20 (51.3) | 18 (69.2) | | |
| Tumor location | | | | | |
| Head | 40 (61.5) | 25 (64.1) | 15 (57.7) | 0.603 | |
| Body/tail | 25 (38.5) | 14 (35.9) | 11 (42.3) | | |
| Tumor grade | | | | | |
| I | 13 (21.3) | 6 (16.2) | 7 (29.2) | | 0.521 |
| II | 37 (60.7) | 24 (64.9) | 13 (54.2) | | |
| III | 11 (18.0) | 7 (18.9) | 4 (16.6) | | |
| CA199 (U/ml) | | | | | |
| ≤37 | 9 (13.9) | 8 (20.5) | 1 (3.8) | | 0.018a |
| Increased
<300 | 11 (16.9) | 3 (7.7) | 8 (30.9) | | |
| >300 | 45 (69.2) | 28 (71.8) | 17 (69.2) | | |
| T stage | | | | | |
| T1 | 4 (6.2) | 3 (7.7) | 1 (3.8) | | 0.536 |
| T2 | 36 (55.4) | 23 (59.0) | 13 (50.0) | | |
| T3 | 25 (38.4) | 13 (33.3) | 12 (46.2) | | |
| N stage | | | | | |
| N0/N1 | 54 (83.1) | 32 (82.1) | 22 (84.6) | 0.787 | |
| N2 | 11 (16.9) | 7 (17.9) | 4 (15.4) | | |
| M stage | | | | | |
| M0 | 30 (46.2) | 23 (59.0) | 7 (26.9) | 0.011a | |
| M1 | 35 (53.8) | 16 (41.0) | 19 (73.1) | | |
| AJCC staging | | | | | |
| IA/IB | 7 (10.8) | 7 (17.9) | 0 (0.0) | | 0.022a |
| IIA/IIB | 18 (27.7) | 13 (33.3) | 5 (19.2) | | |
| III | 4 (6.2) | 3 (7.7) | 1 (3.9) | | |
| IV | 36 (55.3) | 16 (41.1) | 20 (76.9) | | |
| Vascular
invasion | | | | | |
| Yes | 36 (55.4) | 16 (41.0) | 20 (76.9) | 0.004a | |
| No | 29 (44.6) | 23 (59.0) | 6 (23.1) | | |
| Neural
invasion | | | | | |
| Yes | 41 (63.1) | 25 (64.1) | 16 (64.0) | 0.834 | |
| No | 24 (36.9) | 14 (35.9) | 10 (44.0) | | |
| Table IICox regression analysis for overall
survival. |
Table II
Cox regression analysis for overall
survival.
| Univariate analysis
| Multivariate
analysis
|
|---|
|
Characteristics | HR | 95% CI | P-value | HR | 95% CI | P-value |
|---|
| Age (years) | | | | | | |
| >55 vs ≤55 | 0.70 | 0.36-1.35 | 0.285 | | | |
| Sex | | | | | | |
| Female vs.
male | 1.55 | 0.89-2.69 | 0.121 | | | |
| Tumor location | | | | | | |
| Body/tail vs.
head | 1.09 | 0.63-1.89 | 0.758 | | | |
| Tumor grade | | | | | | |
| II vs. I | 1.03 | 0.51-2.11 | 0.928 | | | |
| III vs. I | 0.86 | 0.34-2.17 | 0.741 | | | |
| COL6A1
expression | | | | | | |
| COL6A1+
vs. COL6A1− | 2.39 | 1.38-4.14 | 0.002a | 1.90 | 1.04-3.47 | 0.037a |
| CA199 (U/ml) | | | | | | |
| >37 vs ≤37 | 1.39 | 0.59-3.27 | 0.448 | | | |
| T stage | | | | | | |
| T2 vs. T1 | 0.25 | 0.09-0.75 | 0.130 | | | |
| T3 vs. T1 | 0.45 | 0.15-1.33 | 0.149 | | | |
| N stage | | | | | | |
| N2 vs. N1/N0 | 2.32 | 1.18-4.55 |
0.015a | | | |
| M stage | | | | | | |
| M1 vs. M0 | 2.54 | 1.43-4.54 | 0.002a | 2.35 | 1.24-4.47 | 0.009a |
| AJCC staging | | | | | | |
| III/IV vs.
I/II | 2.80 | 1.51-5.19 | 0.001a | | | |
| Vascular
invasion | | | | | | |
| Yes vs. no | 2.28 | 1.32-3.97 | 0.003a | 2.08 | 1.16-3.73 | 0.014a |
| Neural
invasion | | | | | | |
| Yes vs. no | 1.93 | 1.08-3.60 | 0.027a | | | |
Discussion
In this study, we explored potential
metastasis-related factors in PC. By establishing the robust PC
cell line BxPC-M8 from parent cells (BxPC-3), our findings may
improve understanding of the metastatic and invasive
characteristics between the two cell lines. Genetic profiling of
the cell lines unveiled COL6A1 as a potential metastasis-associated
gene. Knockdown of COL6A1 in BxPC-M8 cells led to a significant
decrease in cell migration and invasive abilities confirming the
metastatic role of COL6A1. Furthermore, COL6A1 expression was
significantly associated with CA199 levels, distant metastasis and
vascular invasion. COL6A1 was also determined to be an independent
predictor of poor prognosis in patients with PC.
One of the major challenges in establishing
preclinical PC cell models which can recapitulate the biological
behavior in humans includes contamination and incongruity with the
clinical characteristics of the disease in focus (30,32).
At present, few cellular models are available for investigations
into PC metastasis (33-35). BxPC-M8 demonstrated stable culture
properties; its growth rate and sensitivity to conventional
chemotherapeutic drugs were found to be comparable to parent BxPC-3
cells. However, BxPC-M8 differs from BxPC-3 in enhanced metastatic
and invasive capabilities, making it a potential metastatic
research model for PC.
Several studies have detected increased expression
of COL6A1 in tumors and is associated with tumor progression
(36,37). Other reports have also shown that
collagen VI can promote the adhesion, penetration and invasion of
tumor cells in an autocrine manner (18). In a quantitative secretomics
functional analysis of metastasis-associated proteins, COL6A1
expression was reported to enhance metastatic abilities, while RNA
interference-based knockdown of COL6A1 suppressed the metastatic
activity of lung cancer cells (20). Furthermore, the migratory and
metastatic activity of PC via runt-related transcription factor 3
(Runx3) signaling can be induced by the expression of COL6A1
(36,38). In our research, COL6A1 was found to
be upregulated in BxPC-M8, and was associated with increased
invasive and metastatic ability compared with parent BxPC-3 cells,
suggesting a potential pro-metastatic role in PC. Additionally, an
increase in EMT-associated proteins, such as Snail and vimentin,
which were upregulated in BxPC-M8 compared with BxPC-3 cells,
indicate a possible relation to EMT characteristics. Similar to
previous reports on other cancer types (18-20),
we reported that the migration and invasion of BxPC-M8 cells were
significantly decreased after COL6A1 knockdown, while the
expression of E-cadherin increased, but that of Snail and vimentin
were decreased. The heterotrimeric structure of type VI collagen is
formed by three α chains among six possible genes (COL6A1-6)
(39). The present study
investigated the effects of silenced COL6A1, which encodes the α1
chain of collagen type VI, and its relation to EMT protein
expression. In future research, we aim to explore the potential
link between EMT and other genes associated with the structure of
type VI collagen, as well as its specific downstream targets.
Even though researchers have reported the
correlation between high COL6A1 expression and poor clinical
prognosis in patients with cervical cancer and prostate cancer
(18,19), its prognostic role in PC remains
unclear. To improve understanding into the relationship between
COL6A1 and patient outcomes, we initially analyzed RNA sequencing
data from GEPIA database (25). We
observed that high COL6A1 expression was associated with shorter OS
and DFS. The relationship between COL6A1 expression and clinical
parameters, including the prognosis of PC patients was explored.
The AJCC Cancer Staging Manual, Eighth Edition, 2017 (24) was used throughout our study for
tumor staging. Clinicopathological investigations revealed that
COL6A1 expression was closely associated with CA199 levels, distant
metastasis, vascular invasion and AJCC stage. It has been proposed
that regional lymph node metastasis has high prognostic value in
relation to COL6A1 expression in cervical and prostate cancers
(18,19). However, our findings did not
indicate a significant association between local lymph node
metastasis and COL6A1 expression. In line with studies reporting a
positive relationship between COL6A1 and distant metastasis
(36), we found that 73.1% of
COL6A1+ patients had distant metastasis. Also, 76.9% of
our patients with COL6A1 expression had vascular encroachment at
the time of surgery. The median OS for COL6A1+ group was
8±4 months compared with 14±7 months in COL6A1− group.
Survival analysis using Kaplan-Meier curves from this study
demonstrated that expression of COL6A1 was associated with poor OS
in PC patients, in accordance with the data of the GEPIA database.
In addition, ~40% of patients with low COL6A1 expression survived
>5 years according to GEPIA database. The follow-up in this
study was conducted for up to 50 months; however, long-term
follow-up is required to validate our findings with the GEPIA
database.
Research regarding the metastasis of PC has been
limited in recent years due to insufficient stable cell lines. The
present study established a potentially useful BxPC-M8 cell model,
which may provide further insight into the metastatic and
prognostic molecular markers in PC. Additionally, to the best of
our knowledge, our study is the first to demonstrate the clinical
significance of COL6A1 in patients with PC, and highlights COL6A1
as an effective prognostic marker and a potential target for
developing pharmacological therapies in the future.
Supplementary Data
Abbreviations:
|
AJCC
|
American Joint Committee on Cancer
|
|
CA199
|
carbohydrate antigen 19-9
|
|
COL6A1
|
collagen type VI α1 chain
|
|
DFS
|
disease-free survival
|
|
FBS
|
fetal bovine serum
|
|
GEPIA
|
Gene Expression Profiling Interactive
Analysis
|
|
OS
|
overall survival
|
|
PC
|
pancreatic cancer
|
|
RT-qPCR
|
reverse transcription-quantitative
polymerase chain reaction
|
|
siRNA
|
small interfering RNA
|
Acknowledgments
We thank Dr Kenneth Goldblatt from the University
Medical Center of Princeton At Plainsboro for his help in revising
the final manuscript before submission. Special thanks to Dr
Rongliang Tong and Dr Chuanhui Peng from the Department of
Hepatobiliary and Pancreatic Surgery (The First Affiliated Hospital
of Zhejiang University) for their clinical and technical input in
tumor and SPSS data matching.
Funding
The present study was supported by The Innovative
Research Groups of National Natural Science Foundation of China
(grant no. 81721091); Zhejiang Provincial Natural Science
Foundation (grant no. LY18H160017); Major program of National
Natural Science Foundation of China (grant no. 91542205); National
S&T Major Project (grant no. 2017ZX10203205); the Fundamental
Research Funds for the Central Universities (grant no.
2019XZZX005-1-08) and Zhejiang International Science and Technology
Cooperation Project (grant no. 2016C04003).
Availability of data and materials
All data generated or analyzed during this study are
included in this published article. Supplementary files can also be
located at https://doi.org/10.6084/m9.figshare.7562813.v1
Authors' contributions
DJ and KGOA performed experiments, analyzed results
and wrote the manuscript. GS performed siRNA knockdown. RC
performed western blot analysis and repeated experiments. DJ and BC
established the cell line. BC and LZ performed all IHC staining and
TMA slide. HX and LZ and an independent pathologist performed the
scoring of all TMA cores. MIAE and JL collected tissues samples and
analyzed clinical data. DJ and KGOA performed statistical analysis,
as well as the construction of the tables and figures.
Conceptualization, methodology, and supervision of the project were
performed by DJ and JW and SZ revised the final manuscript. All
authors read and approved the final manuscript.
Ethics approval and consent to
participate
This research was approved by the First Affiliated
Hospital of Zhejiang University Ethics Committee (approval no.
2018-1033).
Patient consent for publication
Not applicable.
Competing interests
All authors declare that they have no competing
interests.
References
|
1
|
Ferlay J, Colombet M, Soerjomataram I,
Mathers C, Parkin DM, Piñeros M, Znaor A and Bray F: Estimating the
global cancer incidence and mortality in 2018: GLOBOCAN sources and
methods. Int J Cancer. 144:1941–1953. 2019.
|
|
2
|
Noone AM, Cronin KA, Altekruse SF,
Howlader N, Lewis DR, Petkov VI and Penberthy L: Cancer incidence
and survival trends by subtype using data from the Surveillance
Epidemiology and End Results (SEER) Program, 1992-2013. Cancer
Epidemiol Biomarkers Prev. 26:632–641. 2017. View Article : Google Scholar
|
|
3
|
Wang L, Yang GH, Li H and Lu XH: The
changing pancreatic cancer mortality in China (1991-2000). Zhonghua
Nei Ke Za Zhi. 44:509–513. 2005.In Chinese. PubMed/NCBI
|
|
4
|
Cancer.Net: Pancreatic Cancer: Statistics.
American Society of Clinical Oncology ASCO; 2018
|
|
5
|
Malvezzi M, Carioli G, Bertuccio P, Rosso
T, Boffetta P, Levi F, La Vecchia C and Negri E: European cancer
mortality predictions for the year 2016 with focus on leukaemias.
Ann Oncol. 27:725–731. 2016. View Article : Google Scholar : PubMed/NCBI
|
|
6
|
Siegel RL, Jemal A, Wender RC, Gansler T,
Ma J and Brawley OW: An assessment of progress in cancer control.
CA Cancer J Clin. 68:329–339. 2018. View Article : Google Scholar : PubMed/NCBI
|
|
7
|
Hidalgo M, Cascinu S, Kleeff J, Labianca
R, Löhr JM, Neoptolemos J, Real FX, Van Laethem JL and Heinemann V:
Addressing the challenges of pancreatic cancer: Future directions
for improving outcomes. Pancreatology. 15:8–18. 2015. View Article : Google Scholar
|
|
8
|
Jones S, Zhang X, Parsons DW, Lin JC,
Leary RJ, Angenendt P, Mankoo P, Carter H, Kamiyama H, Jimeno A, et
al: Core signaling pathways in human pancreatic cancers revealed by
global genomic analyses. Science. 321:1801–1806. 2008. View Article : Google Scholar : PubMed/NCBI
|
|
9
|
Hanahan D and Weinberg RA: Hallmarks of
cancer: The next generation. Cell. 144:646–674. 2011. View Article : Google Scholar : PubMed/NCBI
|
|
10
|
Du YX, Liu ZW, You L, Wu WM and Zhao YP:
Advances in understanding the molecular mechanism of pancreatic
cancer metastasis. Hepatobiliary Pancreat Dis Int. 15:361–370.
2016. View Article : Google Scholar : PubMed/NCBI
|
|
11
|
Rhim AD, Oberstein PE, Thomas DH, Mirek
ET, Palermo CF, Sastra SA, Dekleva EN, Saunders T, Becerra CP,
Tattersall IW, et al: Stromal elements act to restrain, rather than
support, pancreatic ductal adenocarcinoma. Cancer Cell. 25:735–747.
2014. View Article : Google Scholar : PubMed/NCBI
|
|
12
|
Zhao K, Liang G, Sun X and Guan L:
Comparative miRNAome analysis revealed different miRNA expression
profiles in bovine sera and exosomes. BMC Genomics. 17:6302016.
View Article : Google Scholar : PubMed/NCBI
|
|
13
|
Carmicheal J, Hayashi C, Huang X, Liu L,
Lu Y, Krasnoslobodtsev A, Lushnikov A, Kshirsagar PG, Patel A, Jain
M, et al: Label-free characterization of exosome via surface
enhanced Raman spectroscopy for the early detection of pancreatic
cancer. Nanomedicine (Lond). 16:88–96. 2019. View Article : Google Scholar
|
|
14
|
Jiang XT, Tao HQ and Zou SC: Detection of
serum tumor markers in the diagnosis and treatment of patients with
pancreatic cancer. Hepatobiliary Pancreat Dis Int. 3:464–468.
2004.PubMed/NCBI
|
|
15
|
Tanaka T, Ikari K, Furushima K, Okada A,
Tanaka H, Furukawa K, Yoshida K, Ikeda T, Ikegawa S, Hunt SC, et
al: Genomewide linkage and linkage disequilibrium analyses identify
COL6A1, on chromosome 21, as the locus for ossification of the
posterior longitudinal ligament of the spine. Am J Hum Genet.
73:812–822. 2003. View
Article : Google Scholar : PubMed/NCBI
|
|
16
|
Uhlen M, Zhang C, Lee S, Sjöstedt E,
Fagerberg L, Bidkhori G, Benfeitas R, Arif M, Liu Z, Edfors F, et
al: A pathology atlas of the human cancer transcriptome. Science.
357:3572017. View Article : Google Scholar
|
|
17
|
Pontén F, Jirström K and Uhlen M: The
Human Protein Atlas–a tool for pathology. J Pathol. 216:387–393.
2008. View Article : Google Scholar
|
|
18
|
Hou T, Tong C, Kazobinka G, Zhang W, Huang
X, Huang Y and Zhang Y: Expression of COL6A1 predicts prognosis in
cervical cancer patients. Am J Transl Res. 8:2838–2844.
2016.PubMed/NCBI
|
|
19
|
Zhu YP, Wan FN, Shen YJ, Wang HK, Zhang GM
and Ye DW: Reactive stroma component COL6A1 is upregulated in
castration-resistant prostate cancer and promotes tumor growth.
Oncotarget. 6:14488–14496. 2015. View Article : Google Scholar : PubMed/NCBI
|
|
20
|
Chiu KH, Chang YH, Wu YS, Lee SH and Liao
PC: Quantitative secretome analysis reveals that COL6A1 is a
metastasis-associated protein using stacking gel-aided purification
combined with iTRAQ labeling. J Proteome Res. 10:1110–1125. 2011.
View Article : Google Scholar
|
|
21
|
Birnbaum DJ, Adélaïde J, Mamessier E,
Finetti P, Lagarde A, Monges G, Viret F, Gonçalvès A, Turrini O,
Delpero JR, et al: Genome profiling of pancreatic adenocarcinoma.
Genes Chromosomes Cancer. 50:456–465. 2011. View Article : Google Scholar : PubMed/NCBI
|
|
22
|
Iacobuzio-Donahue CA: Genetic evolution of
pancreatic cancer: Lessons learnt from the pancreatic cancer genome
sequencing project. Gut. 61:1085–1094. 2012. View Article : Google Scholar :
|
|
23
|
Moriggi M, Giussani M, Torretta E,
Capitanio D, Sandri M, Leone R, De Palma S, Vasso M, Vozzi G,
Tagliabue E, et al: ECM remodeling in breast cancer with different
grade: Contribution of 2D-DIGE proteomics. Proteomics.
18:e18002782018. View Article : Google Scholar : PubMed/NCBI
|
|
24
|
Chun YS, Pawlik TM and Vauthey JN: 8th
Edition of the AJCC Cancer Staging Manual: Pancreas and
Hepatobiliary Cancers. Ann Surg Oncol. 25:845–847. 2018. View Article : Google Scholar
|
|
25
|
Tang Z, Li C, Kang B, Gao G, Li C and
Zhang Z: GEPIA: a web server for cancer and normal gene expression
profiling and interactive analyses. Nucleic Acids Res. 45:W98–W102.
2017. View Article : Google Scholar : PubMed/NCBI
|
|
26
|
Livak KJ and Schmittgen TD: Analysis of
relative gene expression data using real-time quantitative PCR and
the 2(-Delta Delta C(T)) Method. Methods. 25:402–408. 2001.
View Article : Google Scholar
|
|
27
|
Escobar-Hoyos LF, Shah R, Roa-Peña L,
Vanner EA, Najafian N, Banach A, Nielsen E, Al-Khalil R, Akalin A,
Talmage D, et al: Keratin-17 promotes p27KIP1 nuclear
export and degradation and offers potential prognostic utility.
Cancer Res. 75:3650–3662. 2015. View Article : Google Scholar : PubMed/NCBI
|
|
28
|
Alkushi A: Validation of tissue microarray
biomarker expression of breast carcinomas in Saudi women. Hematol
Oncol Stem Cell Ther. 2:394–398. 2009. View Article : Google Scholar
|
|
29
|
Miura K, Kimura K, Amano R, Yamazoe S,
Ohira G, Murata A, Nishio K, Hasegawa T, Yashiro M, Nakata B, et
al: Establishment and characterization of new cell lines of
anaplastic pancreatic cancer, which is a rare malignancy: OCUP-A1
and OCUP-A2. BMC Cancer. 16:2682016. View Article : Google Scholar : PubMed/NCBI
|
|
30
|
Torres MP, Rachagani S, Souchek JJ, Mallya
K, Johansson SL and Batra SK: Novel pancreatic cancer cell lines
derived from genetically engineered mouse models of spontaneous
pancreatic adenocarcinoma: Applications in diagnosis and therapy.
PLoS One. 8:e805802013. View Article : Google Scholar : PubMed/NCBI
|
|
31
|
Sato T, Takano R, Takahara N, Tokunaka K,
Saiga K, Tomura A, Sugihara H, Hayashi T, Imamura Y and Morita M:
Identification of a common epitope in the sequences of COL4A1 and
COL6A1 recognized by monoclonal antibody #141. J Biochem.
165:85–95. 2019. View Article : Google Scholar
|
|
32
|
Qiu W and Su GH: Challenges and advances
in mouse modeling for human pancreatic tumorigenesis and
metastasis. Cancer Metastasis Rev. 32:83–107. 2013. View Article : Google Scholar
|
|
33
|
Pan Y, Gao S, Hua YQ and Liu LM:
Establishment of a pancreatic cancer stem cell model using the
SW1990 human pancreatic cancer cell line in nude mice. Asian Pac J
Cancer Prev. 16:437–442. 2015. View Article : Google Scholar : PubMed/NCBI
|
|
34
|
Kim MJ, Kim MS, Kim SJ, An S, Park J, Park
H, Lee JH, Song KB, Hwang DW, Chang S, et al: Establishment and
characterization of 6 novel patient-derived primary pancreatic
ductal adenocarcinoma cell lines from Korean pancreatic cancer
patients. Cancer Cell Int. 17:472017. View Article : Google Scholar : PubMed/NCBI
|
|
35
|
Krzykawski MP, Krzykawska-Serda M,
Jasińska K and Marcinkiewicz J: Pan_02 murine pancreatic cancer
model. Folia Med Cracov. 55:15–24. 2015.
|
|
36
|
Jian Z, Cheng T, Zhang Z, Raulefs S, Shi
K, Steiger K, Maeritz N, Kleigrewe K, Hofmann T, Benitz S, et al:
Glycemic variability promotes both local invasion and metastatic
colonization by pancreatic ductal adenocarcinoma. Cell Mol
Gastroenterol Hepatol. 6:429–449. 2018. View Article : Google Scholar : PubMed/NCBI
|
|
37
|
Fujita A, Sato JR, Festa F, Gomes LR,
Oba-Shinjo SM, Marie SK, Ferreira CE and Sogayar MC: Identification
of COL6A1 as a differentially expressed gene in human astrocytomas.
Genet Mol Res. 7:371–378. 2008. View Article : Google Scholar : PubMed/NCBI
|
|
38
|
Whittle MC, Izeradjene K, Rani PG, Feng L,
Carlson MA, DelGiorno KE, Wood LD, Goggins M, Hruban RH, Chang AE,
et al: RUNX3 controls a metastatic switch in pancreatic ductal
adenocarcinoma. Cell. 161:1345–1360. 2015. View Article : Google Scholar : PubMed/NCBI
|
|
39
|
Sato T, Takano R, Tokunaka K, Saiga K,
Tomura A, Sugihara H, Hayashi T, Imamura Y and Morita M: Type VI
collagen α1 chain polypeptide in non-triple helical form is an
alternative gene product of COL6A1. J Biochem. 164:173–181. 2018.
View Article : Google Scholar : PubMed/NCBI
|