Introduction
Lung cancer is the leading cause of cancer-related
death worldwide and results in >1 million deaths annually
(1). The most common type of lung
cancer is the non-small cell lung cancer (NSCLC), which mainly
comprises lung adenocarcinoma and squamous cell carcinoma (2). Lung adenocarcinoma is the most common
form of lung cancer, and its 5-year survival rate is only 15%
(3). Although many treatment
modalities exist for lung adenocarcinoma, such as surgery,
radiotherapy, chemotherapy and targeted treatment, the prognosis
for patients with lung cancer is poor because of various
complications and diagnosis at late stages (4,5). The
present study explored potential novel biomarkers in liver kinase
b1 (LKB1) mutant lung adenocarcinoma. Bioinformatic data mining and
experimental verification revealed that FGL1 was highly expressed
in LKB1 mutant lung adenocarcinoma. Then, the functional role of
FGL1 in LKB1 mutant lung adenocarcinoma was further explored.
LKB1, also known as serine/threonine kinase 11
(STK11), is a gene encoding the serine/threonine kinase LKB1, which
was originally identified as the tumor suppressor gene for the
inherited cancer disorder Peutz-Jeghers syndrome (6). The inactivated mutation frequency of
LKB1 in NSCLC is ~20% (7). The
most common target of LKB1 is AMP-activated protein kinase (AMPK),
which is directly phosphorylated and activated by LKB1 under
conditions of low cellular ATP (8). LKB1 can activate AMPK-related family
kinases to regulate many aspects of cell metabolism, growth,
autophagy and polarity (8,9). LKB1 mutations can lead to tumor
initiation and confer invasive and metastatic behavior in
genetically engineered mouse models of cancer (10,11).
The present study focused on LKB1 mutant lung adenocarcinoma and
explored novel biomarkers to diagnose and treat this subcategory of
patients.
Fibrinogen-like protein 1 (FGL1), also termed
HRFEP-1 or hepassocin, is a predominantly liver-expressed protein
that functions as both a hepatoprotectant and a hepatocyte mitogen.
In 1993, Yamamoto et al (12) isolated FGL1 from a cDNA library
constructed from the mRNA of a hepatocellular carcinoma specimen
using subtractive and differential cDNA cloning and demonstrated
that this gene was important in the development of hepatocellular
carcinoma. Rijken et al (13) concluded that FGL1, a protein with
liver cell growth regulatory properties, was found in plasma and
was strongly associated with fibrin and possibly fibrinogen.
Nayeb-Hashemi et al (14)
reported that FGL1 was a tumor suppressor in hepatocellular
carcinoma, and its loss correlated with a poorly differentiated
phenotype. Although several studies have shown an association of
FGL1 with liver cancer, few studies have investigated the role of
FGL1 in lung cancer.
In the present study, data mining of The Cancer
Genome Atlas (TCGA) (15) and the
Gene Expression Omnibus (GEO) (16) databases revealed that FGL1
expression was significantly increased in LKB1 mutant lung
adenocarcinoma. The association between LKB1 and FGL1 was explored
via functional experiments and gene set enrichment analysis (GSEA);
the results confirmed that FGL1 regulated epithelial-mesenchymal
transition (EMT) and angiogenesis in LKB1 mutant lung
adenocarcinoma. The present study demonstrated that FGL1 may serve
as a potential novel biomarker for diagnosis and prognosis in
patients with LKB1 mutated lung adenocarcinoma.
Materials and methods
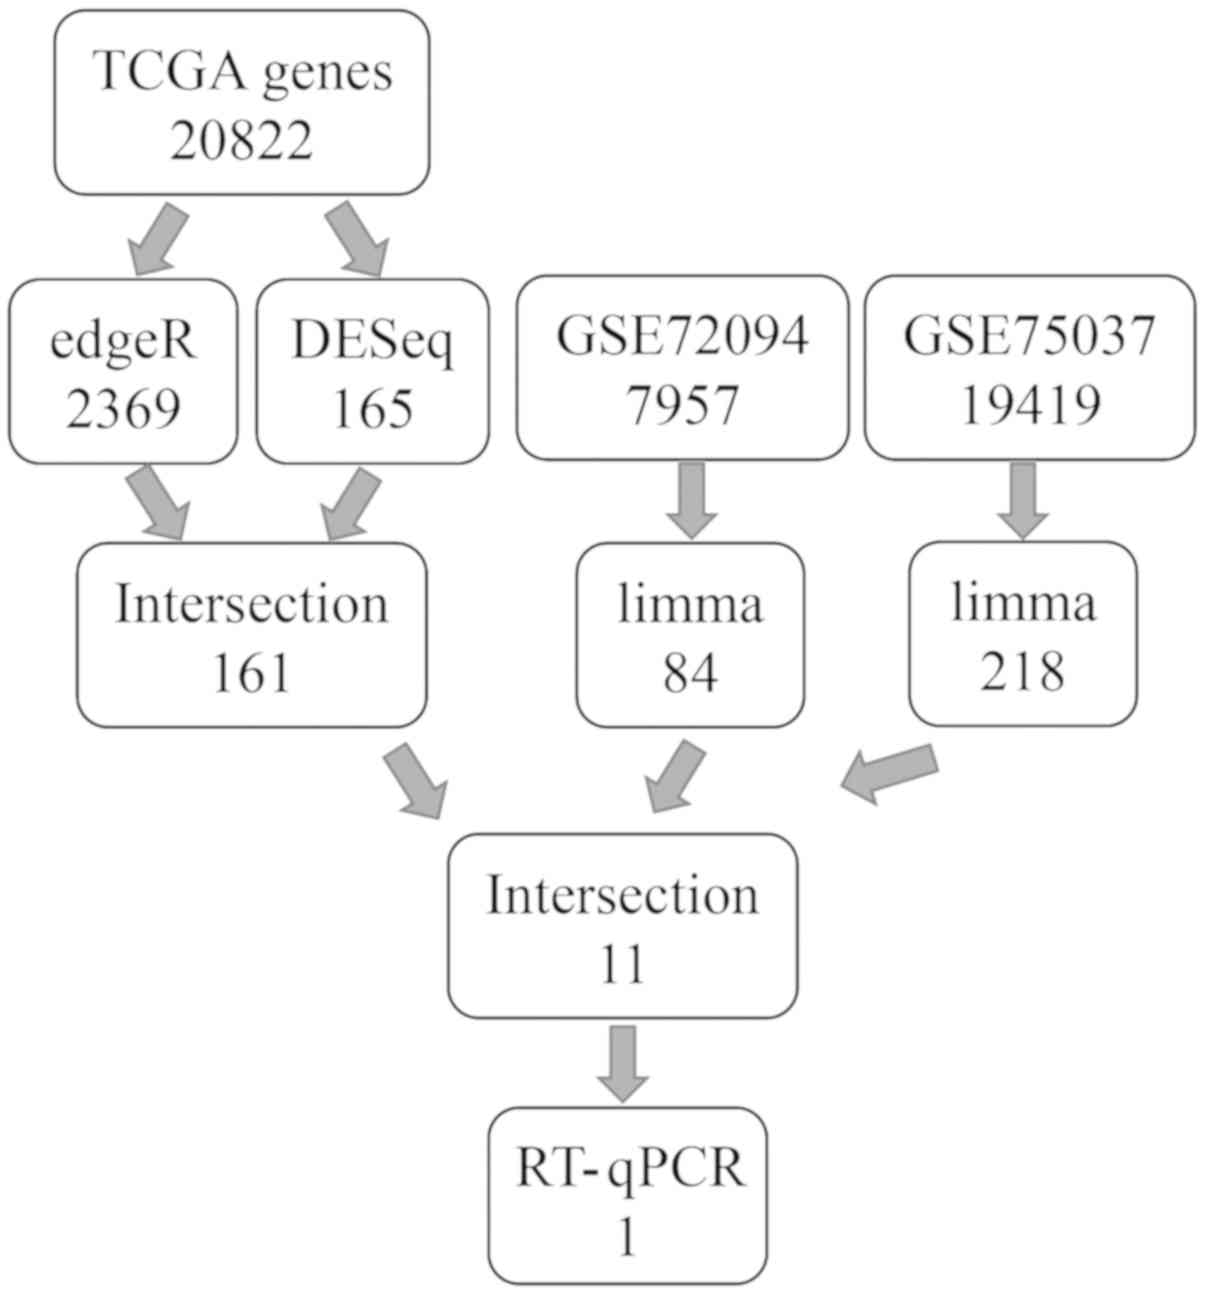
Database source and gene expression
Using the TCGA database, lung adenocarcinoma
information on 230 patients with LKB1 mutations were acquired
(7). Separate differential gene
expression analyses were conducted using the edgeR and DESeq
packages in R software (r-project.org/, R ×64 3.4.3), and the intersection of
the differentially expressed genes [|logFC|>1 and false
discovery rate (FDR) <0.05] from these two packages was
obtained. Two GEO databases (GSE72094 and GSE75037) (17,18)
were then used to validate these differentially expressed genes and
the intersected/validated genes from TCGA and the two GEO databases
were finally selected. Fig. 1
illustrates a flow-chart for the gene screening process.
Patient selection
Tissue samples from 30 patients (13 male, 17 female)
with lung adenocarcinoma who underwent surgery at Shandong
Provincial Hospital affiliated to Shandong University in 2018 were
enrolled in this study. Tumor tissue was collected from patients
that met the following inclusion criteria: The patient has only one
cancer, lung cancer; there is only one lesion and the pathological
diagnosis is simple lung adenocarcinoma; tumor size 2-4 cm; the
range of age is 40-60 years old; the specific surgery dates were
between October to December 2018. Patients that did not meet the
inclusion criteria were excluded. Informed consent was obtained
from all participants included in the study. All procedures
conformed to the ethical guidelines of the 1975 Declaration of
Helsinki and were in accordance with the ethical standards of the
Ethics Committee of Shandong Provincial Hospital Affiliated to
Shandong University. The Ethics Committee of Shandong Provincial
Hospital Affiliated to Shandong University approved all
experimental protocols.
Cell cultures and antibodies
The LKB1 mutant lung adenocarcinoma cell lines (A549
and H157), the LKB1 mutant large cell lung cancer cell line (H460)
and 293T cells were purchased from the American Type Culture
Collection. A549, H157 and H460 cells were cultured in RPMI-1640
medium and 293T cells were cultured in high glucose DMEM (both from
HyClone; GE Healthcare Life Sciences) supplemented with 10% (FBS;
Biological Industries). Cells were grown at 37°C in a humidified
atmosphere with 5% CO2. Mouse monoclonal antibody
against GAPDH (cat. no. sc-166545), mouse monoclonal antibody
against FGL1 (cat. no. sc-514057), mouse monoclonal antibody
against N-cadherin (CDH2; cat. no. sc-59987, for IHC), mouse
monoclonal antibody against vascular endothelial growth factor
(VEGF)A (cat.no. sc-152) and mouse monoclonal antibody against LKB1
(cat. no. sc-32245) were purchased from Santa Cruz Biotechnology,
Inc. Rabbit monoclonal antibodies against E-cadherin (CDH1; cat.
no. 3195s) and vimentin (VIM; cat. no. 5741P) were purchased from
Cell Signaling Technology, Inc. Rabbit monoclonal antibody against
CDH2 (cat. no. ab76011; used for western blotting) was purchased
from Abcam.
Construction of the LKB1 cell line
HEK293T cells were transfected with virus packaging
plasmid (psPAX2; Addgene, Inc.; cat. no. 12260; pMD2.G, Addgene,
Inc.; cat. no. 12259) and
pLenti-EF1a-mcherry-P2A-Puro-CMV-MCS-3Flag (control) or
pLenti-EF1a-mcherry-P2A-Puro-CMV-LKB1 [encoding the wild-type LKB1
protein; made by OBiO Technology (Shanghai) Corp., Ltd.] stable
plasmids using transfection reagent (jetPRIME® in
vitro DNA and siRNA transfection reagent;
Polyplus-transfection® SA). After the HEK293T cells were
transfected for 48 h, the supernatant was collected and added to
infect A549 cells for 24 h. A549 cells were then subjected to
puromycin selection (4 ng/μl) for 1 to 2 weeks, and
puromycin-resistant stable clones were collected. Expression of
LKB1 in the established stably transfected A549 cells was validated
via western blotting.
Small interfering RNA (siRNA)
Transfection was performed using transfection
reagent (jetPRIME® in vitro DNA and siRNA
transfection reagent; Polyplus-transfection® SA). Cells
in 6-well plates were grown to ~50% confluence, then the media was
replaced with fresh complete culture medium prior to transfection.
Cells were then transfected with four different FGL1-targeting
sequences (50 nM) (TranSheepBio), following the manufacturer's
instructions. The sequences of the siRNAs are as follows: Negative
Control, sense, 5′-UUCUCCGAACGUGUCACGUdTdT-3′ and antisense,
5′-ACGUGACACGUUCGGAGAAdTdT-3′; FGL1-1, sence,
5′-GAAGUCCAGUUCCUUGAUAdTdT-3′ and antisense,
5′-UAUCAAGGAACUGGACUUCdTdT-3′; FGL1-2, sense,
5′-GCCGUUAUGCACAAUAUAAdTdT-3′ and antisense,
5′-UUAUAUUGUGCAUAACGGCdTdT-3′; FGL1-3,
5′-CUAGUCACCAAAGAAUGAAdTdT-3′ and antisense,
5′-UUCAUUCUUUGGUGACUAGdTdT-3′; FGL1-4, sense,
5′-GGGCUAGUCACCAAAGAAUdTdT-3′ and antisense,
5′-AUUCUUUGGUGACUAGCCCdTdT-3′. The transfected cells were incubated
for 24 h, then the medium was replaced with complete medium. A 48 h
post-transfection, the cells were divided into two dishes, to avoid
overconfluency. At 72 h post-transfection, the efficiency of the
siRNAs was examined by reverse transcription-quantitative PCR
(RT-qPCR), and the most effective siRNAs were used for subsequent
functional experiments.
RT-qPCR
RNAiso Plus (Takara Bio, Inc.) was used to lyse the
cultured cells and extracted and amplified the RNA from the cells
using a cellular RNA extraction kit (PrimeScript™ RT reagent Kit
with gDNA Eraser). The genomic DNA removal reaction and the RNA RT
reaction were performed in accordance with the instruction of the
cellular RNA extraction kit. mRNA expression was examined via
RT-qPCR with the LightCycler 480 Real-time PCR System, using SYBR
Premix Dimer Eraser (Takara Bio, Inc.) reagent in a 20 μl
reaction volume. Cycling conditions for qPCR were as follows:
Denaturation, 95°C for 30 sec (1 cycle); PCR, 95°C for 5 sec, 55°C
for 30 sec, 72°C for 30 sec (40 cycles); melting, 95°C for 5 sec,
60°C for 1 min, 95°C (1 cycle); cooling, 50°C for 30 sec (1 cycle).
The qPCR primers were designed using Primer3 (primer3.ut.ee/).
Primer sequences are listed in Table
I. Each sample was repeated in triplicate and normalized to 18S
ribosomal RNA expression. The results were evaluated using the
comparative threshold cycle value method (2−ΔΔCq)
(19) for relative quantification
of gene expression.
 | Table IPrimers used for reverse
transcription-quantitative PCR analysis. |
Table I
Primers used for reverse
transcription-quantitative PCR analysis.
| Gene | Forward primer
(5′-3′) | Reverse primer
(5′-3′) |
|---|
| LKB1 |
TGATGGAGTACTGCGTGTGT |
GCTTGATGTCCTTGTGCACA |
| 18S rRNA |
AAACGGCTACCACATCCAAG |
CCTCCAATGGATCCTCGTTA |
| FGL1 |
GGGTCAAACAGCAACAGGTC |
CTCCTCCATCGGACATGTCA |
| CDH1 |
CGGACGATGATGTGAACACC |
TTGCTGTTGTGCTTAACCCC |
| CDH2 |
CGGTTTCATTTGAGGGCACA |
TTGGAGCCTGAGACACGATT |
| VIM |
TGCAGGCTCAGATTCAGGAA |
CTCCGGTACTCAGTGGACTC |
| TGF-β1 |
CTTTCCTGCTTCTCATGGCC |
TCCAGGCTCCAAATGTAGGG |
| VEGFA |
GACGGACAGACAGACAGACA |
CGAGAACAGCCCAGAAGTTG |
| VEGFB |
ATCCTCATGATCCGGTACCC |
AGTGGGATGGGTGATGTCAG |
| HIF-1A |
TCCAAGAAGCCCTAACGTGT |
TCCAAGAAGCCCTAACGTGT |
| IGF-1 |
ATCAGCAGTCTTCCAACCCA |
TGTCTCCACACACGAACTGA |
| EGFR |
AGGTGAAAACAGCTGCAAGG |
AGGTGATGTTCATGGCCTGA |
Colony formation assay
After transfecting cells with FGL1 siRNAs for 48 h,
the cells were suspended with pancreatin (0.25% Trypsin-EDTA 1X;
Gibco; Thermo Fisher Scientific, Inc.) and plated in 60 mm dishes
(1,000 cells/dish) containing 5 ml of culture medium. The dishes
were maintained at 37°C with 5% CO2 and saturated
humidity for 7-14 days. The cultivation was terminated when
macroscopic colonies appeared in the dishes. After removing the
supernatant, the colonies were carefully washed with
phosphate-buffered saline (PBS). The cells were then fixed with 4%
paraformaldehyde for 30 min (25°C) and stained with 0.1% crystal
violet for 30 min (25°C). Finally, the excess dye was washed with
running water, and the cells were observed using an optical
microscope (×40 and ×100; Leica Microsystems Gmbh). Images of the
clone formation were obtained by scanning the cell culture
dishes.
Wound healing assay
A wound healing assay was performed to investigate
the effect of FGL1 on A549 cell migration. Cell suspensions were
prepared and seeded into a 6-well plate with ~5×10⁵
cells/well. After culturing for 24 h, the wounds were induced with
a 100-μl micropipette tip. Then, the complete RPMI-1640/10%
FBS medium was changed to RPMI-1640 medium with 1% FBS. The wound
widths were photographed using an optical light microscope (Leica
Microsystems GmbH) at 0, 6, 12, 24, 36 and 48 h
post-scratching.
Immunofluorescence analysis
Cells were grown on slides for 24 h to 50%
confluence. The medium was aspirated and washed twice with PBS.
Cells were fixed in 4% formaldehyde for 10 min (25°C), then washed
two or three times with PBS. Permeabilization treatment with 0.5%
Triton X-100 was applied for 5 min, then cells were washed two or
three times with PBS. Tetramethylrhodamine (TRITC)-labeled
phalloidin was applied to the cells at room temperature for 30 min
in the dark, then washed three times with PBS. Nuclei were
counterstained with 200 μl of DAPI solution (100 nM), washed
and covered with PBS, and observed under a fluorescence
microscope.
Western blot analysis
Cells were lysed in lysis buffer and the protein
concentration was determined via the bicinchoninic acid protein
assay. Equal amounts of protein (15 μg protein per lane in
the gel) from each cell lysate were subjected to SDS-PAGE (upper
layer of gel 5% concentration; lower layer of gel 10%
concentration) and transferred onto polyvinylidene difluoride
membranes. The membranes were blocked in 5% bovine serum albumin
for 1 h at room temperature and then probed with primary antibodies
against LKB1 (dilution 1:2,000), GAPDH (dilution 1:1,500), CDH1
(dilution 1:1,000), CDH2 (dilution 1:5,000) or VIM (dilution
1:1,000) in Tris-buffered saline containing 0.2% Tween-20 and 5%
fat-free dry milk overnight at 4°C. After washing, the membrane was
incubated with horseradish peroxidase-conjugated secondary
antibodies (dilution 1:10,000; cat. no. ZB-2305 for goat
anti-mouse; cat. no. ZB-2301 for goat anti-rabbit) (both from
OriGene Technologies, Inc.) for 1 h at room temperature.
Immunoreactive bands were visualized using enhanced
chemiluminescence detection reagent (WesternBright™ ECL; cat. no.
180805-33; Advansta, Inc.), as per the manufacturer's
instructions.
Immunohistochemistry (IHC) staining
Tissue sections (4 μm thick) were cut from
formalin-fixed (10% formalin-fixed at 25°C for 24h) paraffin
blocks, and used for IHC staining. Anti-LKB1, anti-FGL1, anti-CDH2
and anti-VEGFA (all dilution 1:200; Santa Cruz Biotechnology, Inc.)
were used as the primary antibodies. Sections were dewaxed and
subjected to antigen retrieval (high pressure method for 3 min in
saline sodium citrate), then incubated with 3% H2O2 for 30 min at
25°C to quench endogenous peroxidase activity. Subsequently, 7%
goat serum (OriGene Technologies, Inc.; cat. no. SPN-9001 for goat
anti-rabbit kit; cat. no. SPN-9002 for goat anti-mouse kit) was
used to block cross-reactivity at 25°C for 30 min. Biotin-labelled
antibody (1:200; OriGene Technologies, Inc.; cat. no. SPN-9001 for
goat anti-rabbit kit; cat. no. SPN-9002 for goat anti-mouse kit),
streptavidin-biotin complex (OriGene Technologies, Inc.; cat. no.
SPN-9001 for goat anti-rabbit kit; cat. no. SPN-9002 for goat
anti-mouse kit) and diaminobenzidine (DAB) were added to the
samples after the primary antibodies and incubated at 4°C
overnight. The same steps were used for the control group, except
the primary antibody was substituted with PBS. After dyeing, two
observers selected five fields (×400) randomly and scored these
specimens according to the intensity of dyed color. The intensity
of staining was graded as: 0, no color; 1, light yellow; 2, light
brown; 3, deep brown. Each observer's scores of five view fields
were averaged, and the two observers' scores were also averaged.
Scores 0-1 were defined as low expression, and score ≥2 were
defined as high expression.
GSEA
GSEA was used to explore selected gene functions.
Using the TCGA database, lung adenocarcinoma information on 592
patients were acquired for GSEA analysis. GSEA software (20,21)
provides scores based on gene expression and acquired pathways
associated with gene function. The presents study used two gene set
databases, c5.all.v6.2.symbols. gmt (gene ontology gene sets) and
c2.cp.kegg.v6.2.symbols. gmt [curated gene sets, gene sets derived
from the Kyoto Encyclopedia of Genes and Genomes (KEGG) pathway
database], to analyze the target genes using GSEA 3.0.
Statistical analysis
Data were analyzed using GraphPad Prism 7 (GraphPad
Software, Inc.) and three independent experiments were performed.
The data are presented as the mean ± standard deviation. Comparison
between two sets of data was performed using unpaired Student's
t-test. One-way ANOVA, followed by Dunnett's multiple comparisons
test, was used for statistical analysis of >2 groups. All
P-values were two-sided and P<0.05 was considered to indicate a
statistically significant difference.
Results
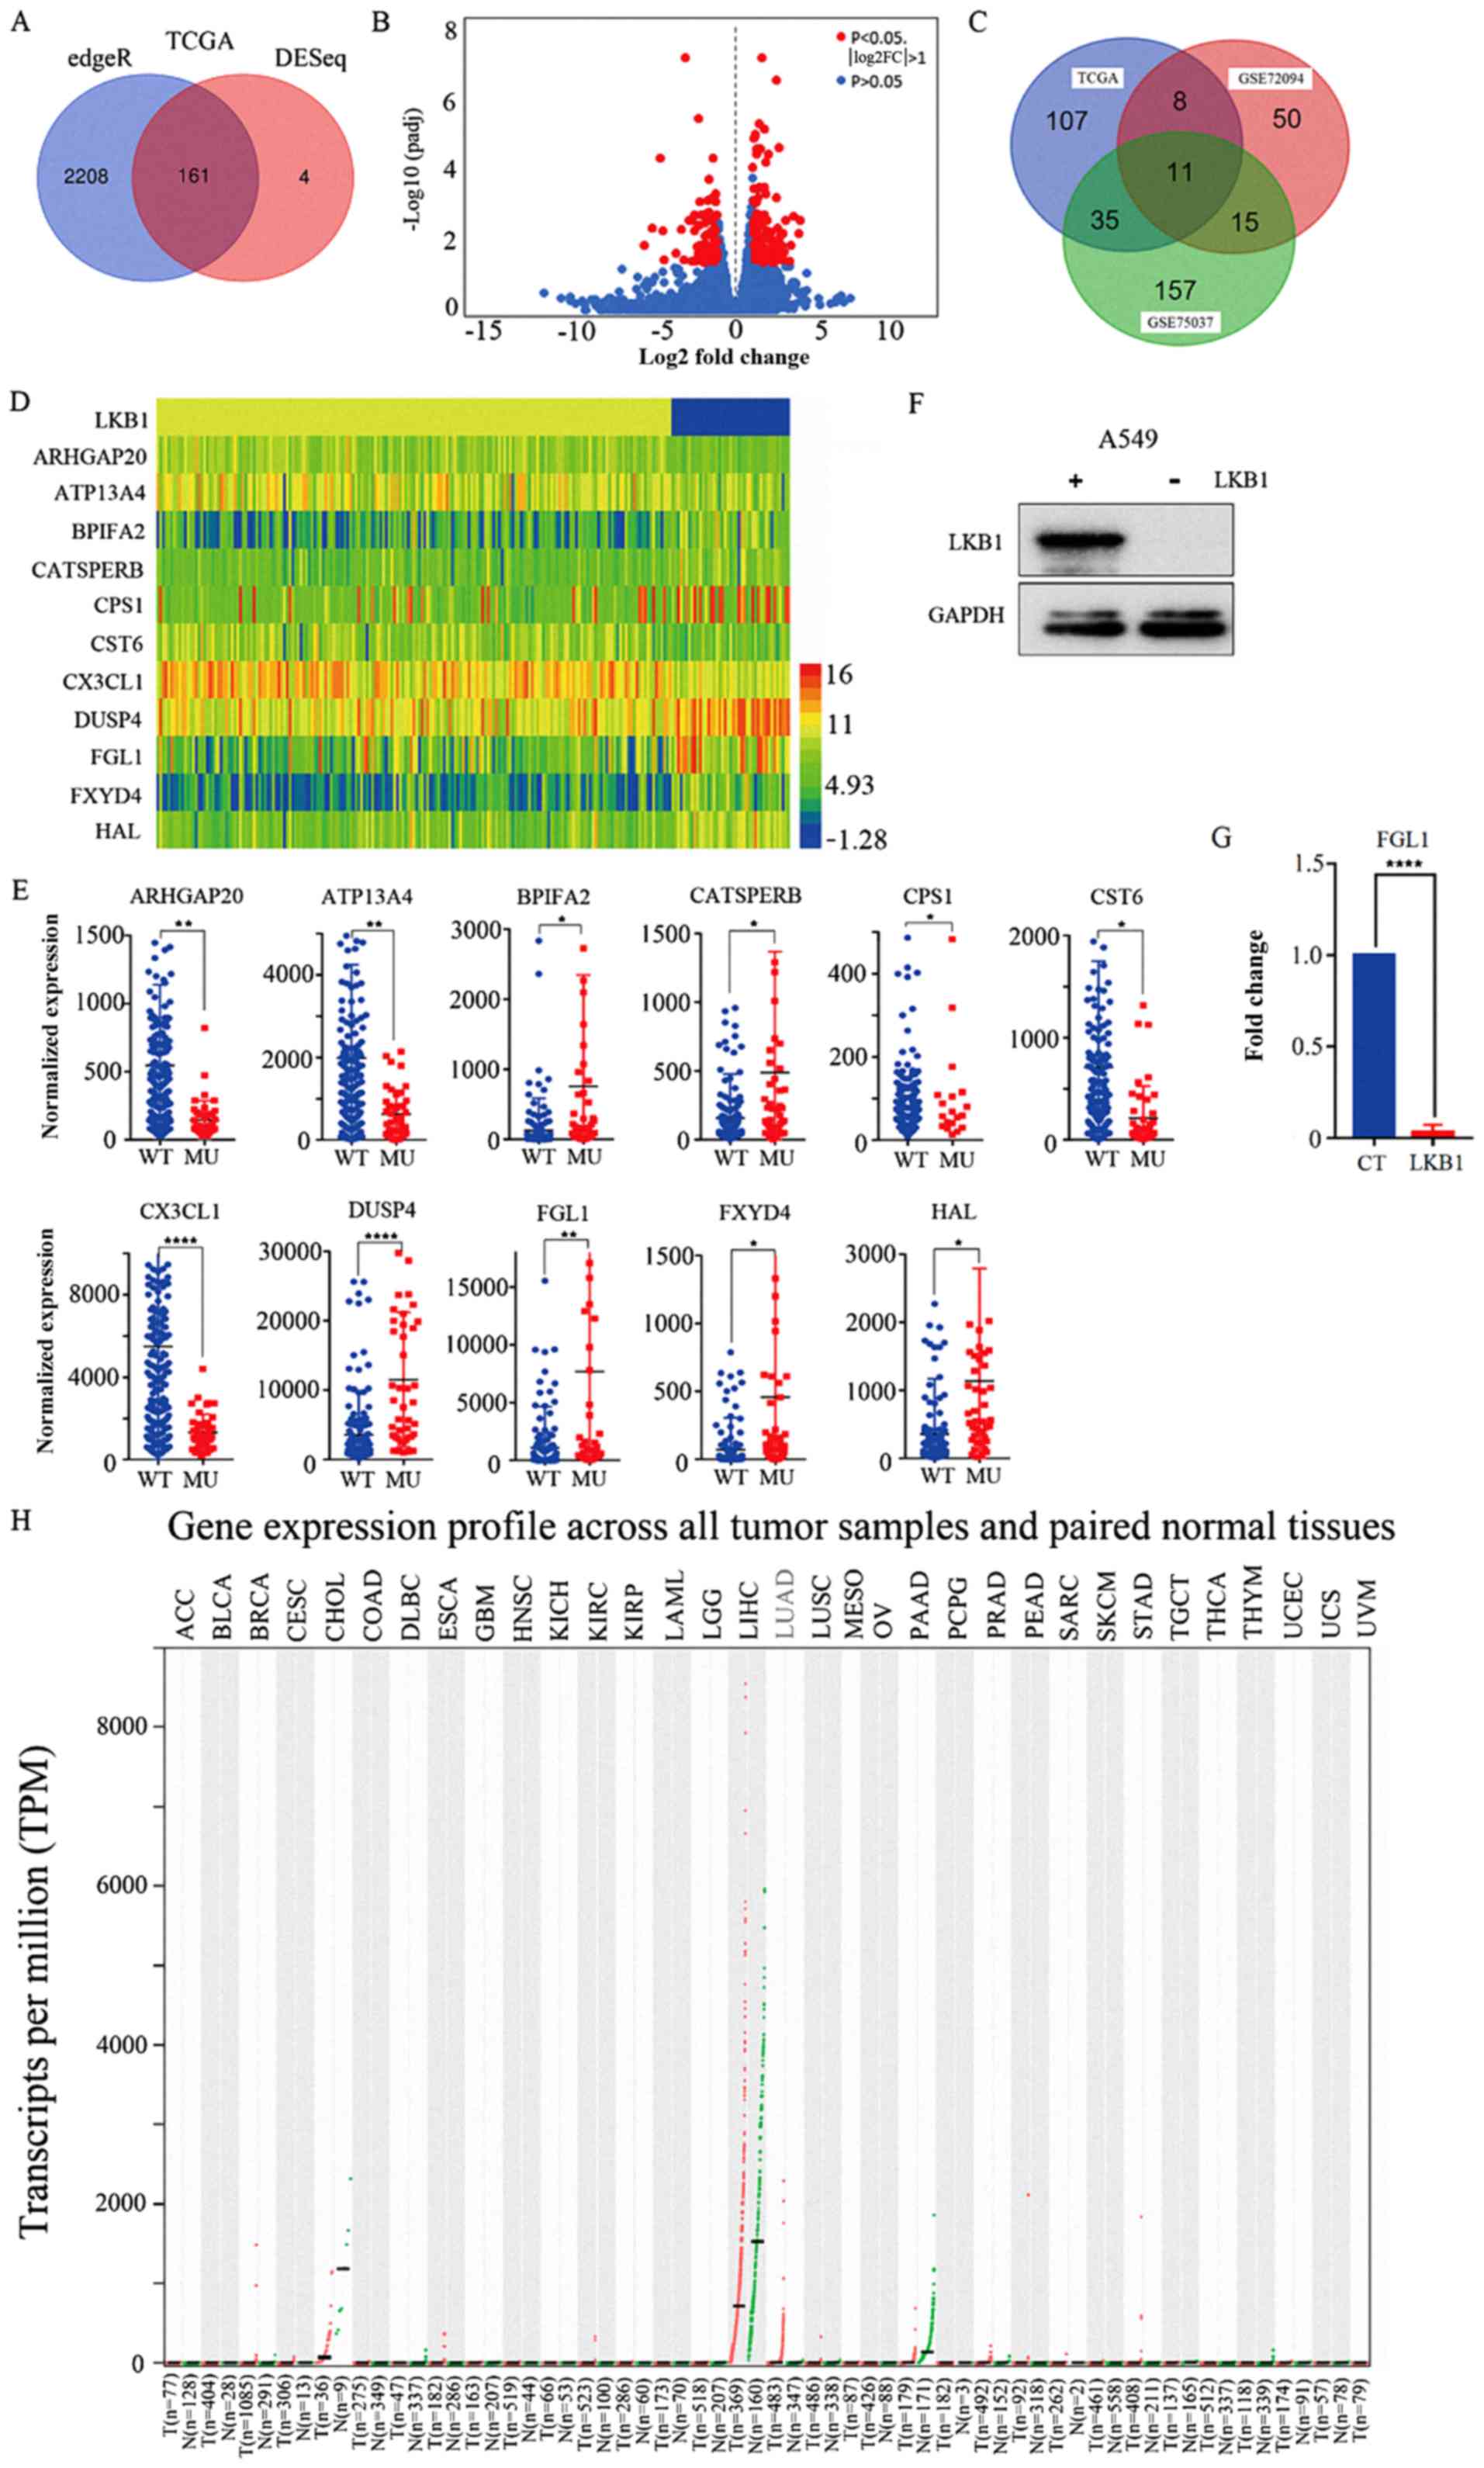
mRNA expression profiling
Gene expression information from 230 patients
(including 43 LKB1 mutant patients and 187 LKB1 wild-type patients)
with lung adenocarcinoma was obtained using TCGA. Next, a
differential gene expression analysis was conducted between the
LKB1 mutant and wild-type groups using R software. The results
revealed 2,369 and 165 differentially expressed genes using the
edgeR and DESeq packages, respectively. Of these, 161 genes were
intersected in both the edgeR and DESeq analyses (Fig. 2A). A volcano plot was constructed
using the gene information from the DESeq package (Fig. 2B). The red points indicate the
significantly differentially expressed genes, using the criteria of
|logFC|>1 and FDR<0.05. Next, two GEO databases (GSE72094 and
GSE75037) of patients with lung adenocarcinoma were used to further
validate the differentially expressed genes using the limma package
in R software. The results revealed 84 and 218 significantly
differentially expressed genes for the GSE72094 and GSE75037
databases, respectively. Finally, by comparing the TCGA and GEO
database results, 11 genes were identified to be significantly
differentially expressed in all the aforementioned analyses
(Fig. 2C). Fig. 1 illustrates the flow-chart for the
study design. Table II lists the
detailed gene expression information for these 11 genes. A heat map
was constructed using the expression information for these 11 genes
(Fig. 2D). To better analyze the
differential expression data for these genes, scatter plots were
created using GraphPad Prism 7 (Fig.
2E).
| Table IIDifferential expression analysis
results of 11 genes. |
Table II
Differential expression analysis
results of 11 genes.
| Gene | Fold change | log2
fold change | P-value | Adjusted
P-value |
|---|
| ARHGAP20 | 0.265571 | −1.91283 |
5.10×10⁻⁶ | 0.002083 |
| ATP13A4 | 0.315201 | −1.66565 |
4.13×10⁻⁶ | 0.001952 |
| BPIFA2 | 6.039897 | 2.594524 | 0.000373 | 0.035563 |
| CATSPERB | 3.083428 | 1.624535 | 0.000343 | 0.033385 |
| CPS1 | 5.195722 | 2.377324 | 0.00025 | 0.026791 |
| CST6 | 0.297055 | −1.7512 | 0.000207 | 0.024988 |
| CX3CL1 | 0.239601 | −2.0613 |
7.34×10⁻¹⁰ | 3.82×10⁻⁶ |
| DUSP4 | 3.228106 | 1.690688 | 5.55
×10−8 | 6.80×10⁻⁵ |
| FGL1 | 7.038152 | 2.815197 |
8.38×10⁻⁶ | 0.002908 |
| FXYD4 | 6.417125 | 2.681927 | 0.000434 | 0.039426 |
| HAL | 3.189729 | 1.673434 | 0.000135 | 0.018728 |
Gene expression validation
A stably transfected A549 cell line overexpressing
wild-type LKB1 was constructed and confirmed via western blot
analysis (Fig. 2F). The results
demonstrated that the A549 cells transfected with the wild-type
LKB1 plasmid had markedly higher wild-type LKB1 protein expression
levels compared with cells transfected with empty vector. Next, the
expression levels of the 11 significantly differentially expressed
genes were examined by RT-qPCR in A549 cells transfected with
wild-type LKB1 plasmid and cells transfected with empty vector.
FGL1 was selected as the research object for subsequent
experiments. RT-qPCR results indicated that FGL1 mRNA expression
levels were significantly decreased in A549 cells transfected with
LKB1 plasmid compared with cells transfected with empty vector
(P<0.0001; Fig. 2G). FGL1
expression was also verified in using Gene Expression Profiling
Interactive Analysis (gepia. cancer-pku.cn/index.html), which is a
visualization website for TCGA data that provides differential
expression analysis of genes between tumor and normal patients
(Fig. 2H). Lung adenocarcinoma
patients had high FGL1 expression (Fig. 2H; denoted in red).
Cell proliferation
The present study used four different FGL1-targeting
sequences to interfere with FGL1 expression in A549 cells, and
their efficiency was evaluated by RT-qPCR (Fig. 3A). The silencing efficiency of the
four siRNAs was very high. A549 cells transfected with the
FGL1-targeting siRNAs were used in the colony formation assay.
Following FGL1 silencing, the cell growth rate was significantly
increased (Fig. 3B and C).
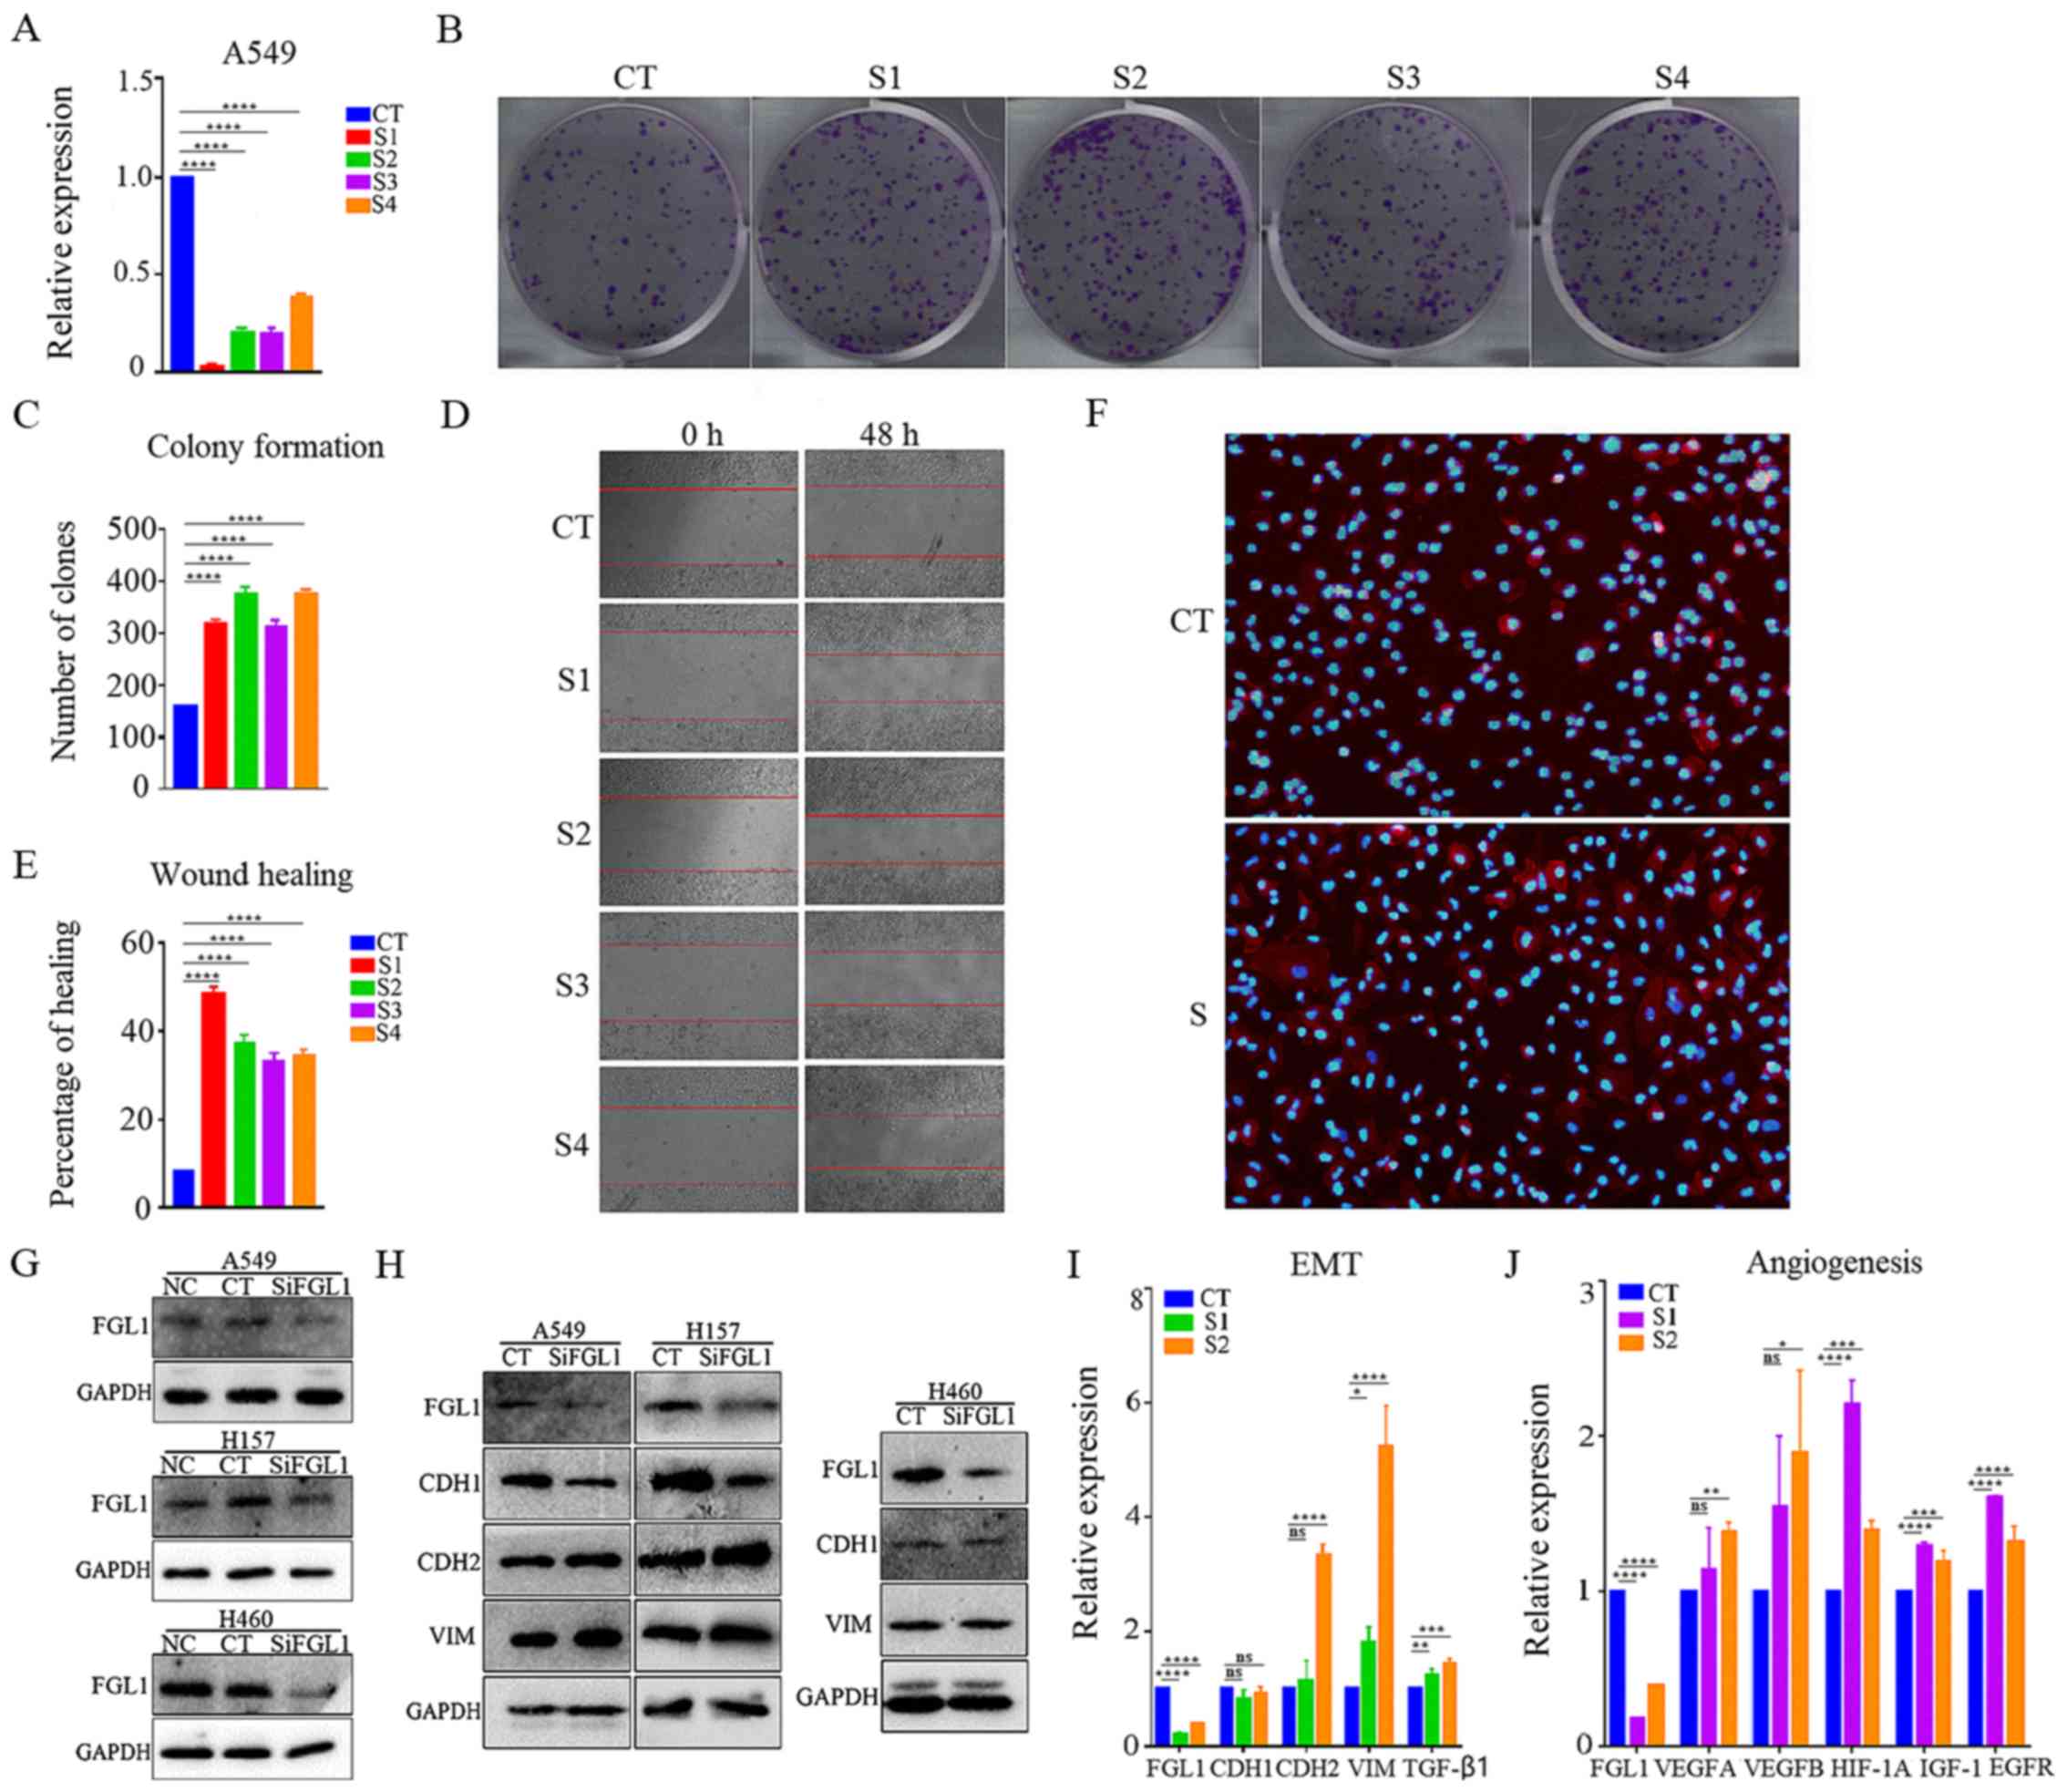 | Figure 3Effect of FGL1 in EMT and
angiogenesis-related gene expression in vitro. (A)
Verification of FGL1 silencing efficiency by RT-qPCR in A549 cells
following siRNA transfection. (B) Colony formation assay of A549
cells following FGL1 silencing. (C) Quantification of the colony
formation assay results. (D) Wound healing assay of A549 cells
following FGL1 silencing. (E) Quantification of the wound healing
assay results. (F) Immunofluorescence staining (×100 magnification)
of actin filaments with phalloidin (red) and of nuclei with DAPI
(blue). (G) Western blot analysis of FGL1 protein expression levels
in LKB1 mutant lung adenocarcinoma cells (A549 and H157) and
LKB1-mutant large cell lung cancer cells (H460) following FGL1
silencing. (H) Western blot analysis of EMT-associated markers in
LKB1 mutant lung adenocarcinoma cells (A549 and H157) and
LKB1-mutant large cell lung cancer cells (H460) following FGL1
silencing. (I) RT-qPCR analysis of EMT-associated markers in A549
cells following FGL1 silencing. (J) RT-qPCR analysis of
angiogenesis-associated markers in FGL1-silenced A549 cells. Three
independent experiments were performed. *P<0.05,
**P<0.01, ***P<0.001 and
****P<0.0001, with comparisons indicated by lines.
FGL1, fibrinogen-like 1; EMT, epithelial-mesenchymal transition;
RT-qPCR, reverse transcription-quantitative PCR; si, small
interfering; LKB1, liver kinase b1; CT, control; S,
siRNA-transfected; CDH1, E-cadherin; CDH2, N-cadherin; VIM,
vimentin; TGF, transforming growth factor; VEGF, vascular
endothelial growth factor; HIF, hypoxia-inducible factor; IGF,
insulin-like growth factor; EGFR, epidermal growth factor
receptor. |
EMT
The effect of FGL1 on cell migration was assessed
using a wound healing assay. The scratch area of the FGL1-silenced
A549 cells was significantly reduced compared with the control A549
cells 48 h post-scratching (Fig. 3D
and E), indicating that FGL1 inhibited cell migration.
Immunofluorescence staining of the actin filaments with phalloidin
was used to observe changes in cell morphology following FGL1
knockdown (Fig. 3F). The cells
became long and fusiform-shaped with more angular edges, indicating
that the cells had undergone EMT changes. The protein expression
levels of FGL1 were further confirmed via western blot analysis in
LKB1 mutant lung adenocarcinoma cells (A549 and H157) and LKB1
mutant large cell lung cancer cells (H460); the results
demonstrated that transfection with the control siRNA had no effect
on FGL1 protein levels, while transfection with the FGL1-targting
siRNA (FGL1-3) markedly reduced its protein expression levels
(Fig. 3G). The protein expression
levels of EMT-associated markers were then evaluated via western
blotting in LKB1 mutant lung adenocarcinoma cells (A549 and H157)
and LKB1 mutant large cell lung cancer cells (H460; Fig. 3H). CDH1 expression was lower, while
CDH2 and VIM expressions were higher following FGL1 silencing in
LKB1 mutant lung adenocarcinoma cells (Fig. 3H). However, CDH1 and VIM expression
did not noticeably differ following FGL1 silencing in LKB1 mutant
large cell lung cancer cells (Fig.
3H). RT-qPCR was also used to detect the mRNA expression levels
of EMT-associated markers in the LKB1 mutant lung adenocarcinoma
A549 cells and similar results to those of the western blot
analysis were observed (Fig. 3I).
These results indicated that FGL1 silencing promoted EMT, and that
intrinsic FGL1 expression may inhibit EMT occurrence in LKB1 mutant
lung adenocarcinoma.
Angiogenesis
RT-qPCR was used to detect expression changes in
angiogenesis-related markers in FGL1-silenced A549 cells. The
results revealed higher mRNA expression levels following FGL1
silencing for the angiogenesis-associated markers VEGFA, VEGFB,
hypoxia-inducible factor (HIF)1α, insulin-like growth factor-1
(IGF-1) and epidermal growth factor receptor (EGFR), compared with
A549 control cells (Fig. 3J).
These results suggested that FGL1 silencing promoted angiogenesis
in LKB1 mutant lung adenocarcinoma cells.
IHC analysis
Lung cancer tissue samples from 30 patients with
lung adenocarcinoma were used for IHC analysis for LKB1 expression
(Fig. 4A). Then, the patients that
exhibited low LKB1 expression in their lung cancer tissues were
selected and grouped by FGL1 expression levels (Fig. 4B). IHC was used to stain for the
EMT-associated indicator, CDH2, and the angiogenesis-related
indicator, VEGFA, separately in the low and high FGL1 expression
groups (Fig. 4B). CDH2 and VEGFA
were highly expressed in the low FGL1 expression group, indicating
that low FGL1 expression promoted EMT and angiogenesis in LKB1-low
lung adenocarcinoma tissue samples.
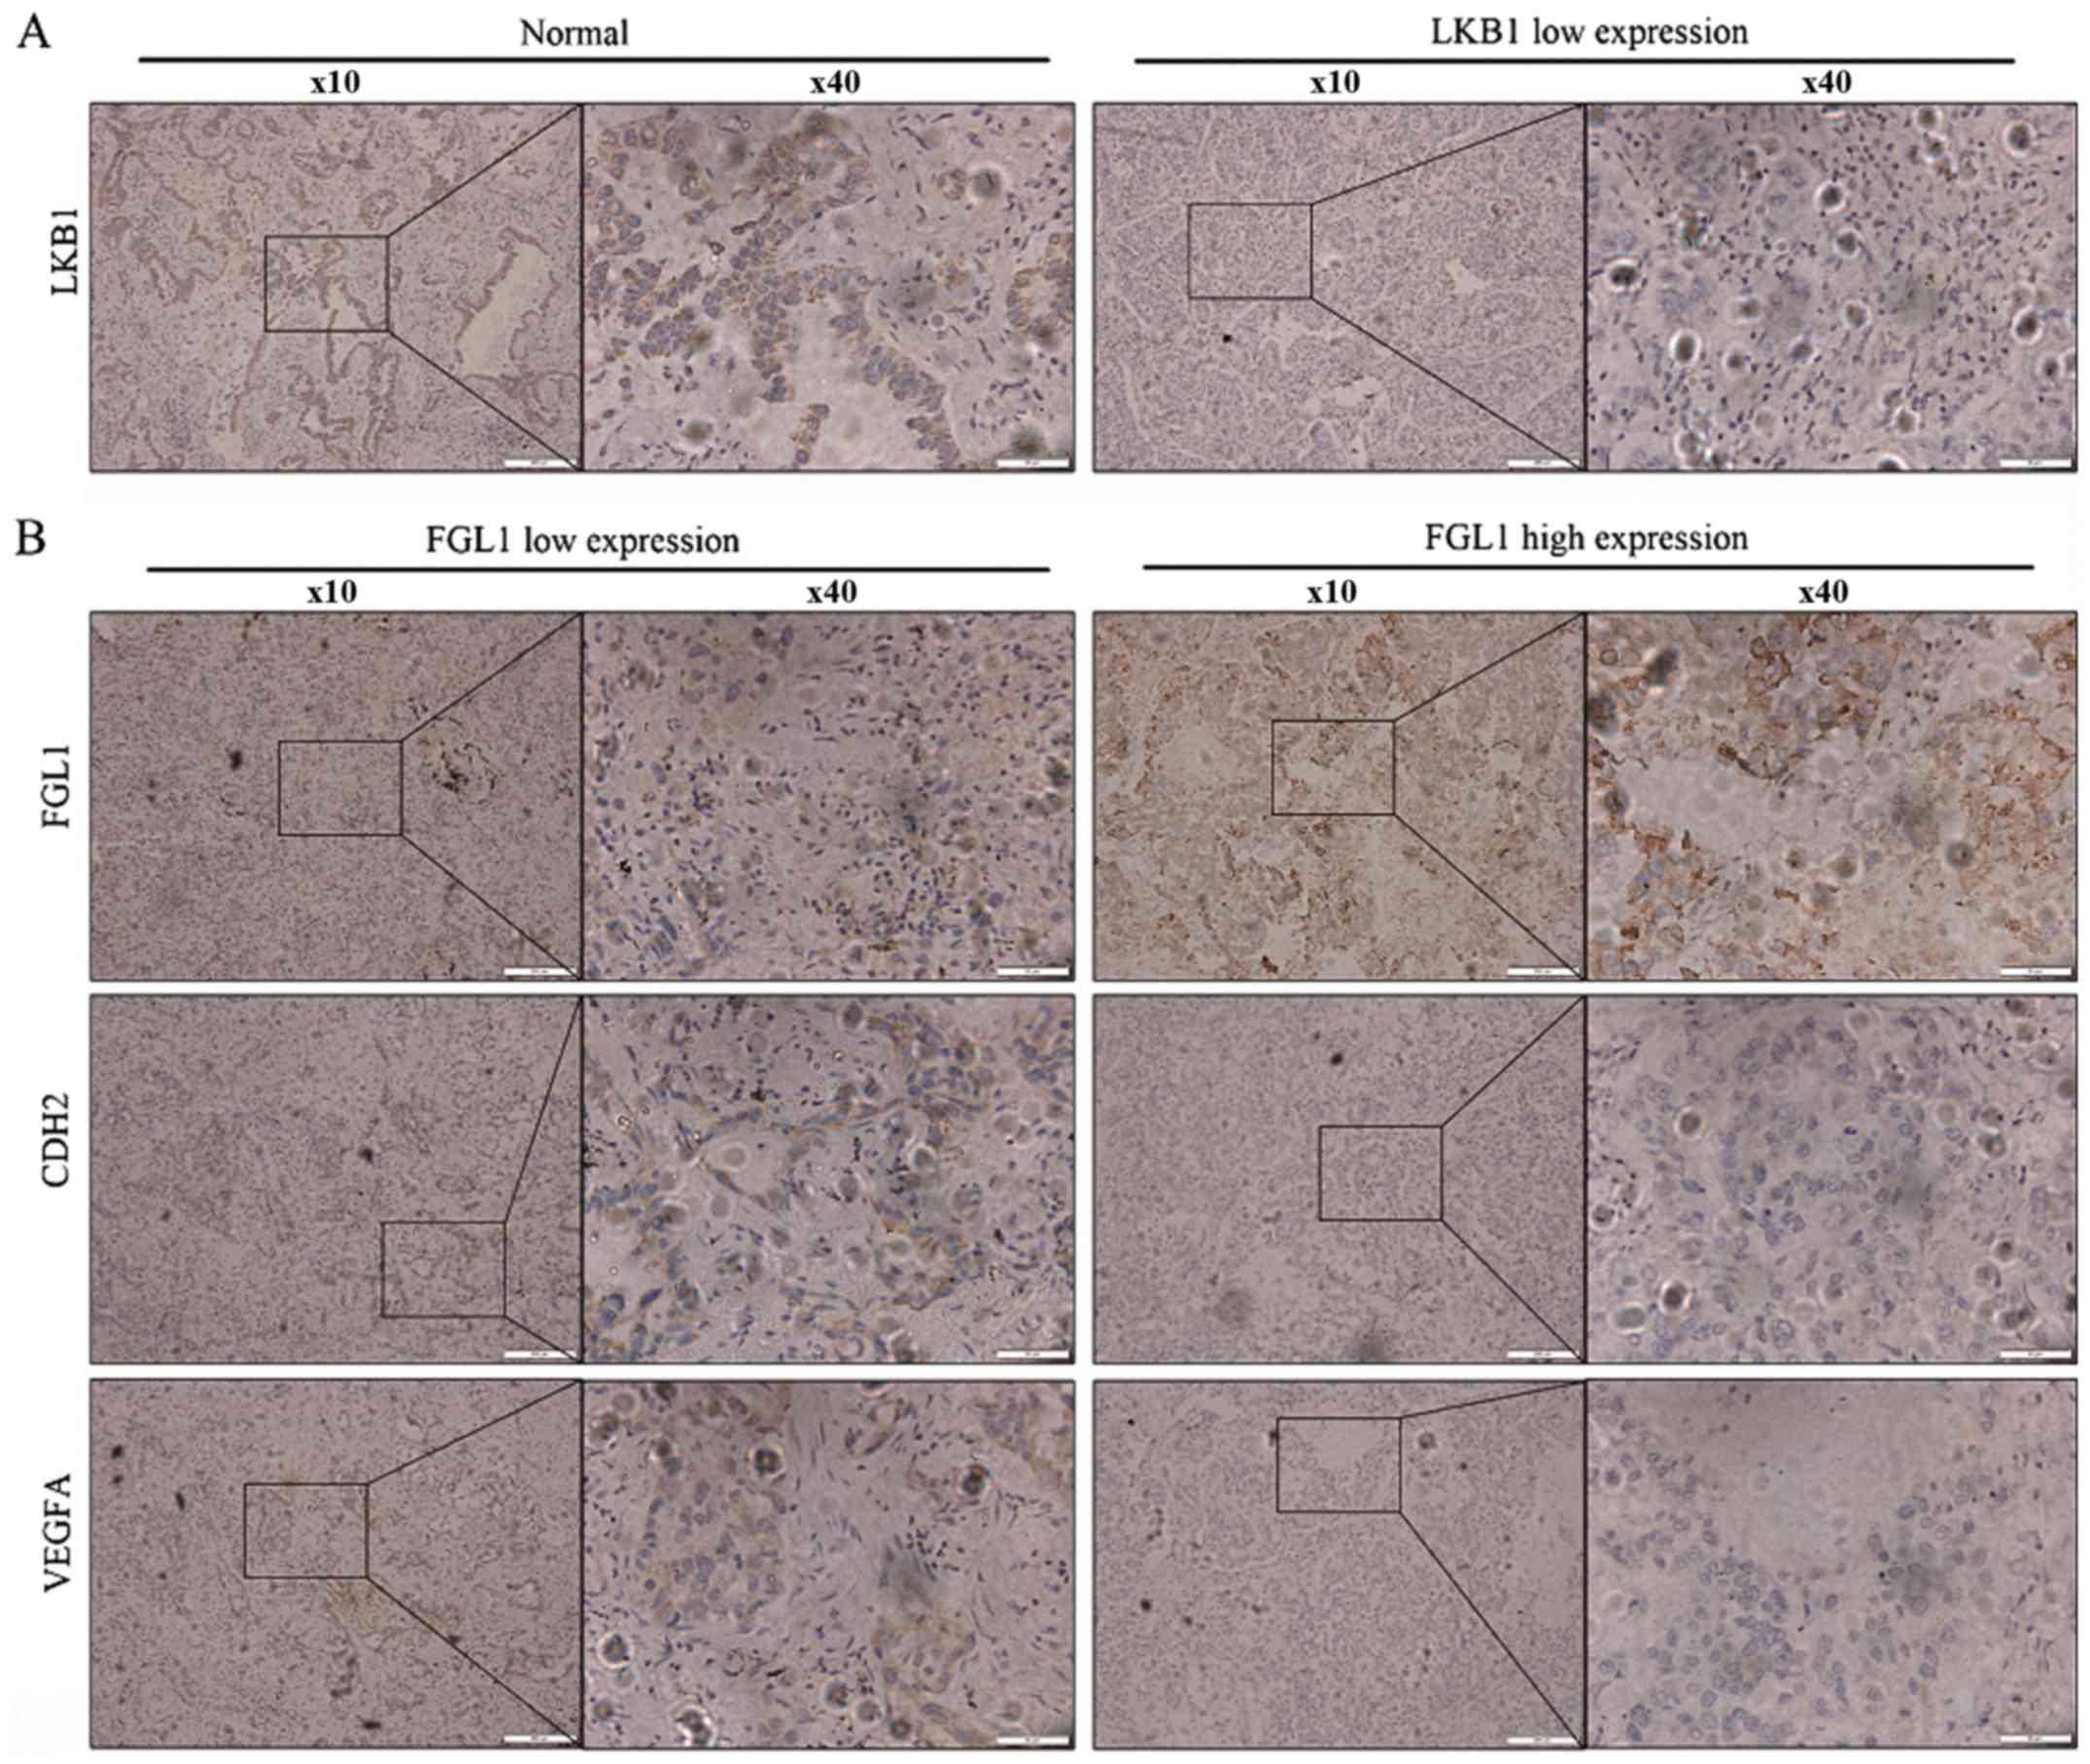 | Figure 4Association of FGL1 expression with
EMT and angiogenesis-related markers using IHC. (A) IHC was used to
stain for LKB1 in tumor sampled from 30 patients with lung
adenocarcinoma. Representative IHC pictures of the high and low
LKB1 expression groups are shown at ×10 and ×40 magnification
(scale bars, 200 and 50 μm, respectively). (B) IHC was used
to stain for CDH2 and VEGFA separately in the low and high FGL1
expression groups. Representative IHC pictures are shown at ×10 and
×40 magnification (scale bars, 200 and 50 μm, respectively).
FGL1, fibrinogen-like 1; EMT, epithelial-mesenchymal transition;
IHC, immunohistochemistry; LKB1, liver kinase b1; CDH2, N-cadherin;
VEGF, vascular endothelial growth factor. |
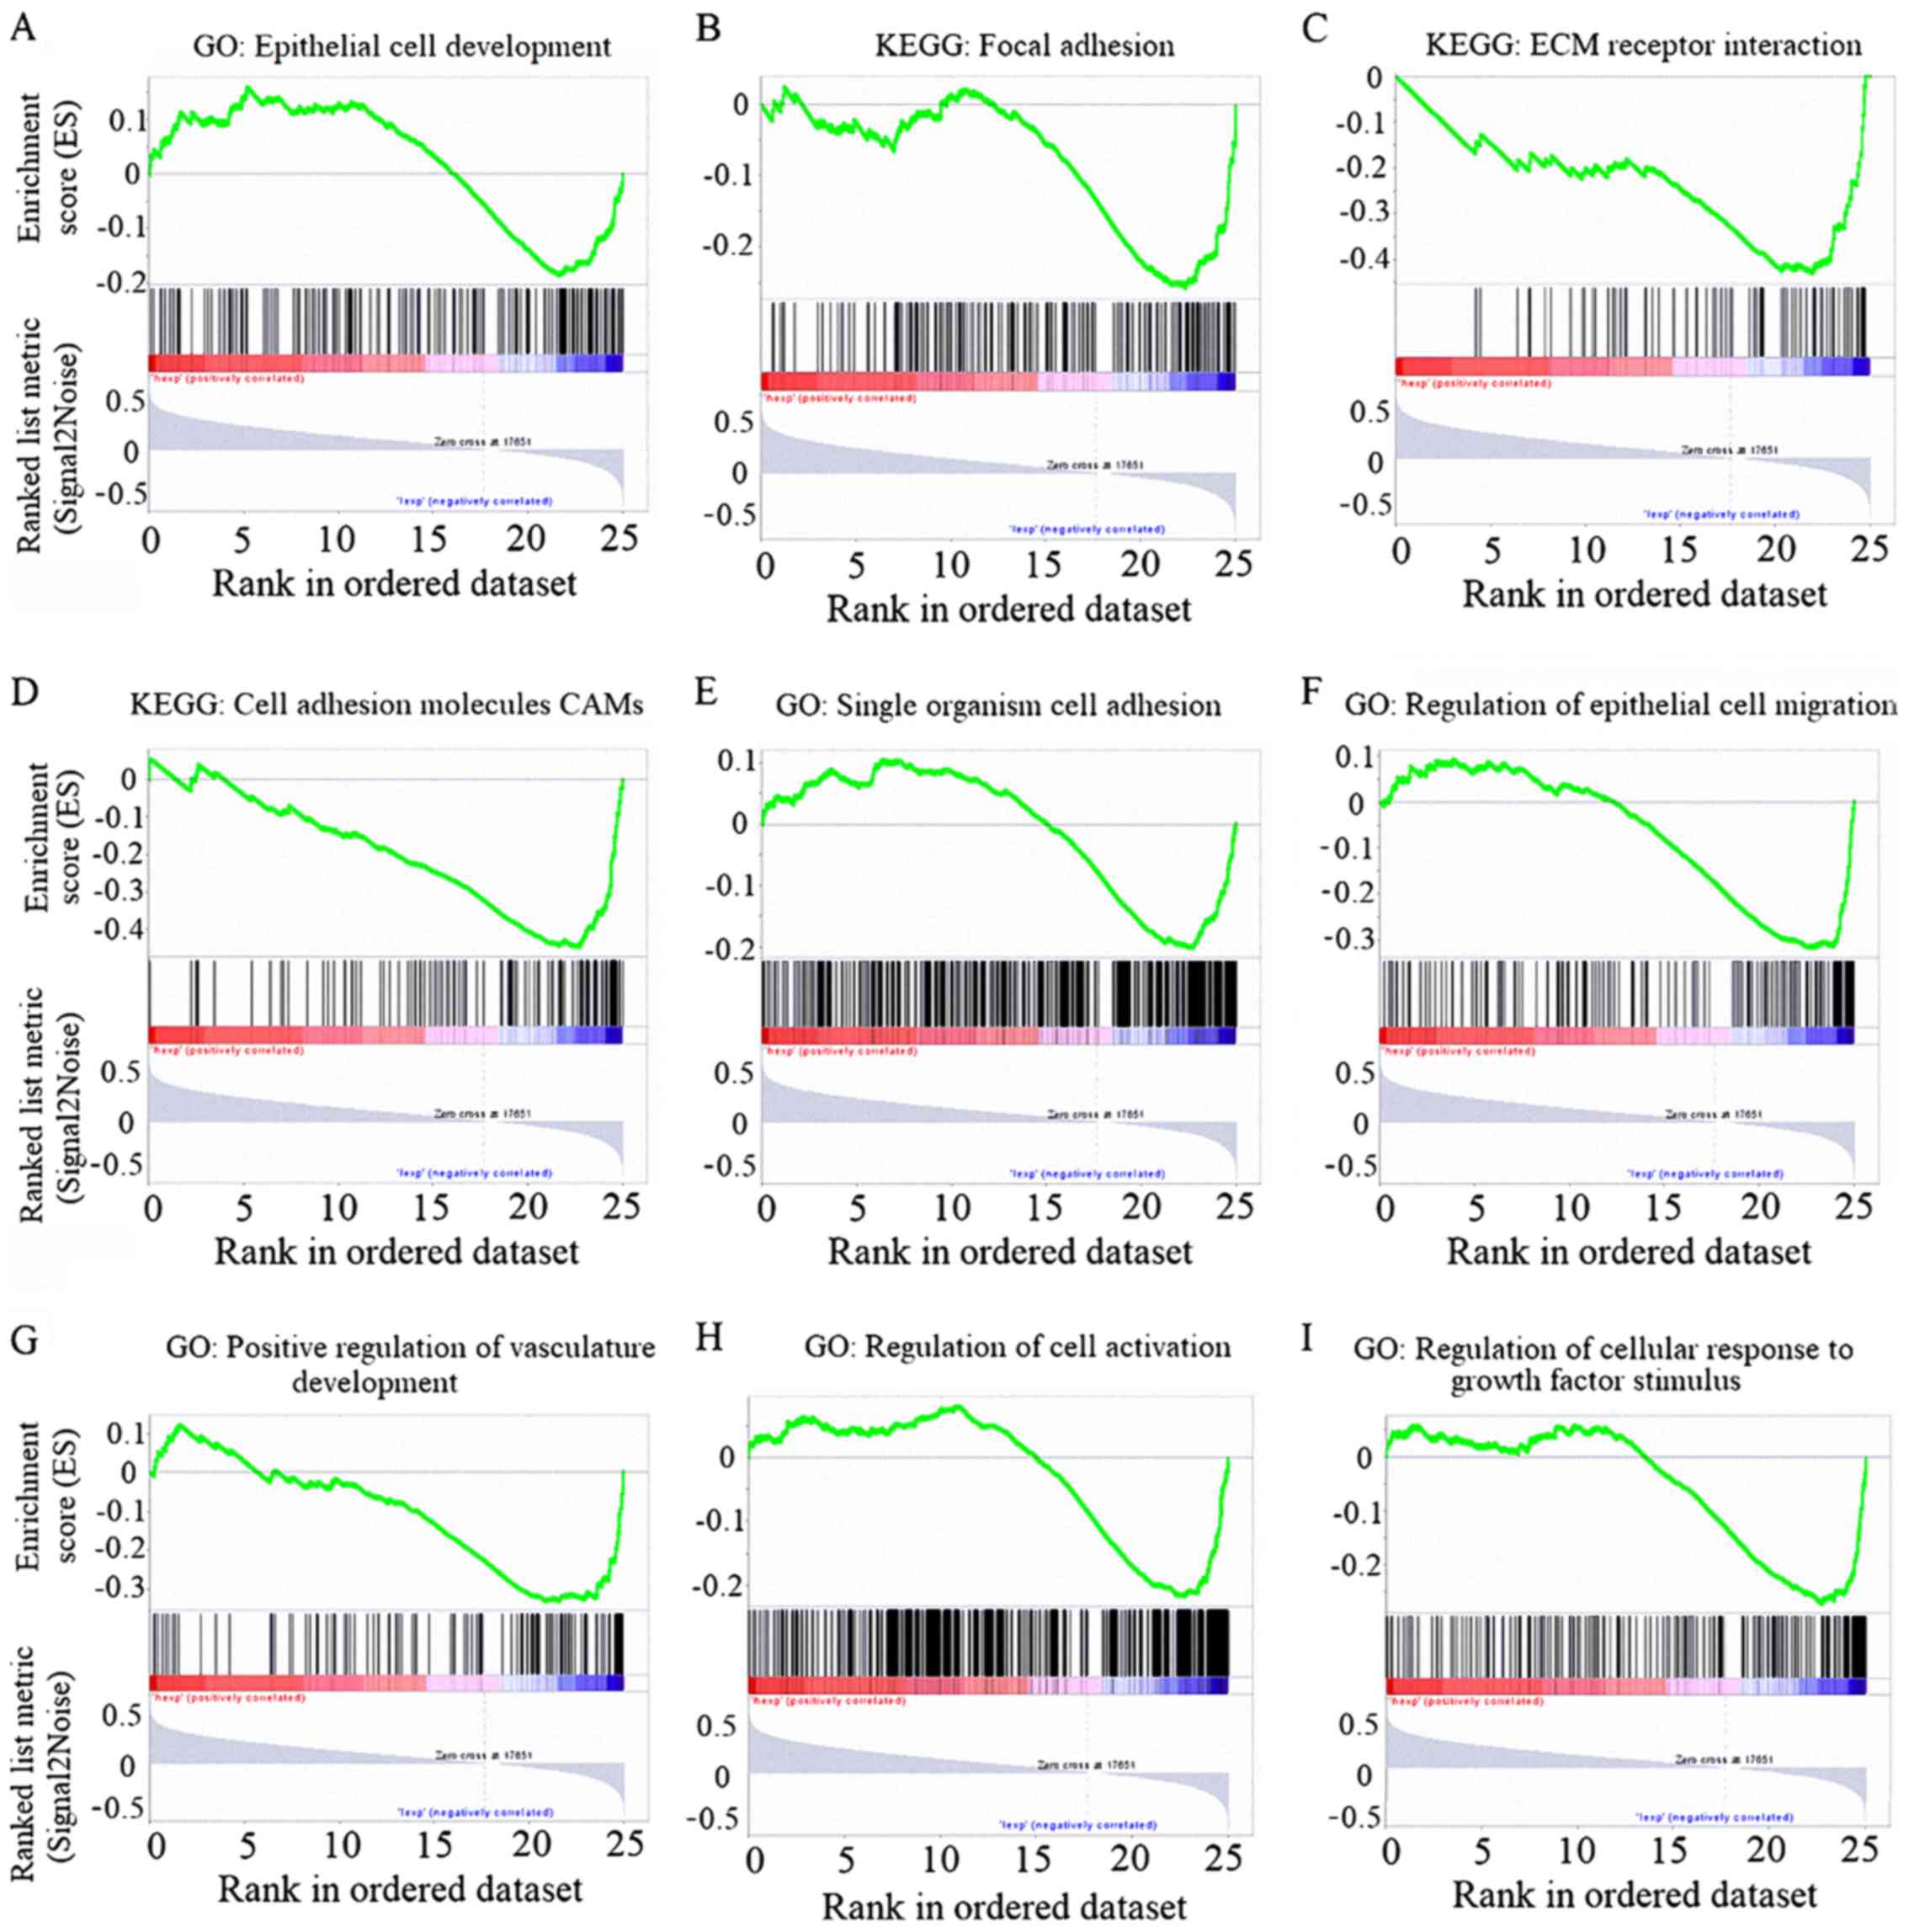
Gene function enrichment analysis
GSEA was used to further explore the gene function
of FGL1 (Fig. 5). Using the TCGA
database, lung adenocarcinoma information from 592 patients was
acquired. These patients were ranked according to the expression
level of FGL1, and the 200 patients with the lowest and highest
FGL1 expression were selected. Then these 200 patients were divided
into two groups according to FGL1 expression for GSEA analysis.
Signaling pathways, such as 'regulation of epithelial cell
migration', 'cell adhesion molecules' and 'epithelial cell
development', that are associated with EMT, were enriched in the
low FGL1 expression group based on the analysis results from both
GO and the KEGG (Fig. 5A-F); this
further suggested that low FGL1 expression promoted EMT in lung
adenocarcinoma patients. The angiogenesis-associated GO signaling
pathway 'positive regulation of vasculature development' was also
enriched in the low FGL1 expression group (Fig. 5G), indicating that low FGL1
expression promoted angiogenesis in lung adenocarcinoma patients.
Finally, two cell growth-associated GO signaling pathways were
enriched in the low FGL1 expression group (Fig. 5H and I), indicating that low FGL1
expression promoted cell growth.
Discussion
Although many treatment modalities exist for lung
adenocarcinoma, such as surgery (22), radiotherapy (23), chemotherapy (24) and targeted treatment (25), the 5-year survival rate is very low
due to late diagnoses and recurrence (26). Many studies are associated with
targeted gene treatment, and genes are continually being reported
as biomarkers for diagnosis, prognosis and treatment of lung cancer
patients (27-29). Zer et al (27) analyzed Kras mutations and concluded
that Kras mutant subtypes were not homogeneous in their prognostic
and predictive effects. Qiu et al (28) reported that microRNA-499 could be a
useful biomarker for predicting poor prognosis for patients with
lung cancer. Tang et al (29) conducted a large-scale meta-analysis
to evaluate published gene expression prognosis signatures for
biomarker-based clinical studies on lung cancer. However, few
biomarkers are associated with LKB1 mutant adenocarcinoma. The
present study focused on LKB1 mutant adenocarcinoma to discover
effective diagnostic, prognostic and therapeutic indicators for
these patients. Bioinformatics data mining and experimental
verification revealed that FGL1 was significantly highly expressed
in LKB1 mutant lung adenocarcinoma; thus, the functional role of
FGL1 in LKB1 mutant lung adenocarcinoma was explored.
LKB1 encodes a serine/threonine kinase that directly
activates AMPK to regulate lipid, cholesterol and glucose
metabolism (30). LKB1 has a high
mutation rate in lung adenocarcinoma (31,32),
and many studies have examined the role of LKB1 mutation in lung
adenocarcinoma. Calles et al (33) reported that loss of LKB1 was a
biomarker for more aggressive biology in Kras-mutant lung
adenocarcinoma. Gao et al (34) examined the occurrence of LKB1
mutation with EGFR and Kras mutation and demonstrated that Kras and
LKB1 had very high co-mutation frequencies. Shackelford et
al (35) verified an
association between LKB1 mutation and the therapeutic response to
the metabolic drug phenformin; phenformin may act as a cancer
metabolism-based therapeutic drug to selectively target
LKB1-deficient tumors. These previous studies indicated that LKB1
may have an important role in lung adenocarcinoma; therefore, the
present study focused on exploring differential gene expression
associated with the LKB1 mutation in lung adenocarcinoma and FGL1
was identified.
Gene expression information of patients with lung
adeno-carcinoma was downloaded from TCGA and GEO, analyzed and
validated by experimentation. FGL1 was significantly highly
expressed in LKB1 mutant lung adenocarcinoma; thus, it was
evaluated whether FGL1 may be closely associated with LKB1. FGL1 is
mainly expressed in the liver and is a secreted protein with
mitogenic activity on primary hepato-cytes. Demchev et al
(36) postulated that FGL1 might
have key roles in metabolism and liver regeneration. Zou et
al (37) indicated that bone
marrow-derived mesenchymal stem cells attenuated acute liver injury
by regulating FGL1 expression. Nayeb-Hashemi et al (14) demonstrated that loss of FGL1
accelerated hepatocellular carcinoma development. To the best of
our knowledge, the only study focusing on FGL1 in lung cancer was
conducted by Wang et al (38), who reported that FGL1 might be a
critical EMT effector involved in cellular adhesion and
communication. The present results further confirmed that loss of
FGL1 was closely associated with EMT in LKB1 mutant
adenocarcinoma.
The present study concluded that loss of FGL1
promoted cell growth, the EMT process and angiogenesis in LKB1
mutant lung adenocarcinoma by functional experiments and GSEA
analysis. Çeliktas et al (39) indicated that LKB1 mutation was
closely associated with cell growth, metabolism and prognosis in
lung adenocarcinoma. Okon et al (40) concluded that LKB1 inhibited
angiogenesis by promoting RAB7-mediated neuropilin-1 degradation.
Roy et al (41) verified
that LKB1 inactivation triggered EMT in lung cancer cells by
inducing zinc finger E box binding homeobox 1. These studies were
consistent with our findings and provided support for our
research.
The present study is the first to link LKB1 and FGL1
and to demonstrate that loss of FGL1 induced EMT and angiogenesis
in LKB1 mutant lung adenocarcinoma. Two databases, TCGA and GEO,
were used for data mining and FGL1 was identified by gene
expression analysis. We combined this information with functional
experiments in cell lines in vitro to validate our findings.
However, the present study had several limitations. First, our
verified experiments were not comprehensive and could not fully
explain our conclusion. Second, the present only used two lung
adenocarcinoma cell lines (A549 and H157) and one large cell lung
cancer cell line (H460) to conduct experiments in vitro and
no in vivo experiments were conducted. Furthermore, the
exact mechanism by which LKB1 overexpression represses FGL1
expression remains unclear. Overexpression of LKB1 can inhibit
anabolism through the AMPK signaling pathway, promotes catabolism,
and maintains energy homeostasis in high metabolic cells (such as
A549) (42). During this process,
since anabolism is inhibited, it may result in a decrease in FGL1
synthesis, resulting in a decrease in the FGL1 expression levels.
The exact mechanism needs further experimental verification.
Studies on FGL1 are rare, especially in lung cancer. Therefore, the
detailed functions of FGL1 require further study.
The present study aimed to explore novel biomarkers
in LKB1 mutant lung adenocarcinoma. By data mining of TCGA and GEO
databases and in vitro functional experiments, the current
results demonstrated that loss of FGL1 induced EMT and angiogenesis
in LKB1 mutant lung adenocarcinoma. FGL1 may therefore serve as a
new biomarker for indicating EMT and angiogenesis in patients with
LKB1 mutant lung adenocarcinoma.
Funding
This study was supported by the National Science
Foundation of China (grant nos. 81602009 and 81672288) and The
Joint Research Funds for Shandong University and Karolinska
Institute (grant no. SDU-KI-2019-16).
Availability of data and materials
The datasets used and analyzed during the current
study are available from the corresponding author on reasonable
request.
Authors' contributions
FB, GW and JD designed the experiments. FB, GW, XQ
and YW collected and processed the data. CH and YW wrote and
polished article. All of the authors read and approved the final
manuscript.
Ethics approval and consent to
participate
The Ethics Committee of Shandong Provincial Hospital
Affiliated to Shandong University approved all experimental
protocols involving the use of human tissues. Informed consent was
obtained from all participants included in the study.
Patient consent for publication
Not applicable.
Competing interests
The authors declare that they have no competing
interests.
Acknowledgments
Not applicable.
References
|
1
|
Siegel RL, Miller KD and Jemal A: Cancer
Statistics, 2017. CA Cancer J Clin. 67:7–30. 2017. View Article : Google Scholar : PubMed/NCBI
|
|
2
|
Molina JR, Yang P, Cassivi SD, Schild SE
and Adjei AA: Non-small cell lung cancer: Epidemiology, risk
factors, treatment, and survivorship. Mayo Clin Proc. 83:584–594.
2008. View Article : Google Scholar : PubMed/NCBI
|
|
3
|
Torre LA, Bray F, Siegel RL, Ferlay J,
Lortet-Tieulent J and Jemal A: Global cancer statistics, 2012. CA
Cancer J Clin. 65:87–108. 2015. View Article : Google Scholar : PubMed/NCBI
|
|
4
|
Soria JC, Ohe Y, Vansteenkiste J,
Reungwetwattana T, Chewaskulyong B, Lee KH, Dechaphunkul A, Imamura
F, Nogami N, Kurata T, et al: Osimertinib in untreated EGFR-mutated
advanced non-small-cell lung cancer. N Engl J Med. 378:113–125.
2018. View Article : Google Scholar
|
|
5
|
Dai C, Shen J, Ren Y, Zhong S, Zheng H, He
J, Xie D, Fei K, Liang W, Jiang G, et al: Choice of surgical
procedure for patients eith mon-dmall-vell lung vancer ≤1 cm or
>1 to 2 cm smong lobectomy, segmentectomy, and wedge resection:
A Population-based study. J Clin Oncol. 34:3175–3182. 2016.
View Article : Google Scholar : PubMed/NCBI
|
|
6
|
Hemminki A, Markie D, Tomlinson I,
Avizienyte E, Roth S, Loukola A, Bignell G, Warren W, Aminoff M,
Höglund P, et al: A serine/threonine kinase gene defective in
Peutz-Jeghers syndrome. Nature. 391:184–187. 1998. View Article : Google Scholar : PubMed/NCBI
|
|
7
|
Cancer Genome Atlas Research Network:
Comprehensive molecular profiling of lung adenocarcinoma. Nature.
511:543–550. 2014. View Article : Google Scholar : PubMed/NCBI
|
|
8
|
Mihaylova MM and Shaw RJ: The AMPK
signalling pathway coordinates cell growth, autophagy and
metabolism. Nat Cell Biol. 13:1016–1023. 2011. View Article : Google Scholar : PubMed/NCBI
|
|
9
|
Wodarz A and Näthke I: Cell polarity in
development and cancer. Nat Cell Biol. 9:1016–1024. 2007.
View Article : Google Scholar : PubMed/NCBI
|
|
10
|
Carretero J, Shimamura T, Rikova K,
Jackson AL, Wilkerson MD, Borgman CL, Buttarazzi MS, Sanofsky BA,
McNamara KL, Brandstetter KA, et al: Integrative genomic and
proteomic analyses identify targets for Lkb1-deficient metastatic
lung tumors. Cancer Cell. 17:547–559. 2010. View Article : Google Scholar : PubMed/NCBI
|
|
11
|
Contreras CM, Akbay EA, Gallardo TD,
Haynie JM, Sharma S, Tagao O, Bardeesy N, Takahashi M, Settleman J,
Wong KK, et al: Lkb1 inactivation is sufficient to drive
endometrial cancers that are aggressive yet highly responsive to
mTOR inhibitor mono-therapy. Dis Model Mech. 3:181–193. 2010.
View Article : Google Scholar : PubMed/NCBI
|
|
12
|
Yamamoto T, Gotoh M, Sasaki H, Terada M,
Kitajima M and Hirohashi S: Molecular cloning and initial
characterization of a novel fibrinogen-related gene, HFREP-1.
Biochem Biophys Res Commun. 193:681–687. 1993. View Article : Google Scholar : PubMed/NCBI
|
|
13
|
Rijken DC, Dirkx SP, Luider TM and Leebeek
FW: Hepatocyte-derived fibrinogen-related protein-1 is associated
with the fibrin matrix of a plasma clot. Biochem Biophys Res
Commun. 350:191–194. 2006. View Article : Google Scholar : PubMed/NCBI
|
|
14
|
Nayeb-Hashemi H, Desai A, Demchev V,
Bronson RT, Hornick JL, Cohen DE and Ukomadu C: Targeted disruption
of fibrinogen like protein-1 accelerates hepatocellular carcinoma
development. Biochem Biophys Res Commun. 465:167–173. 2015.
View Article : Google Scholar : PubMed/NCBI
|
|
15
|
Weinstein JN, Collisson EA, Mills GB, Shaw
KR, Ozenberger BA, Ellrott K, Shmulevich I, Sander C and Stuart JM;
Cancer Genome Atlas Research Network: The Cancer Genome Atlas
Pan-Cancer analysis project. Nat Genet. 45:1113–1120. 2013.
View Article : Google Scholar : PubMed/NCBI
|
|
16
|
Barrett T, Wilhite SE, Ledoux P,
Evangelista C, Kim IF, Tomashevsky M, Marshall KA, Phillippy KH,
Sherman PM, Holko M, et al: NCBI GEO: Archive for functional
genomics data sets - update. Nucleic Acids Res. 41:D991–D995. 2013.
View Article : Google Scholar
|
|
17
|
Schabath MB, Welsh EA, Fulp WJ, Chen L,
Teer JK, Thompson ZJ, Engel BE, Xie M, Berglund AE, Creelan BC, et
al: Differential association of STK11 and TP53 with KRAS
mutation-associated gene expression, proliferation and immune
surveillance in lung adenocarcinoma. Oncogene. 35:3209–3216. 2016.
View Article : Google Scholar :
|
|
18
|
Girard L, Rodriguez-Canales J, Behrens C,
Thompson DM, Botros IW, Tang H, Xie Y, Rekhtman N, Travis WD,
Wistuba II, et al: An expression signature as an aid to the
histologic classification of non-small cell lung cancer. Clin
Cancer Res. 22:4880–4889. 2016. View Article : Google Scholar : PubMed/NCBI
|
|
19
|
Livak KJ and Schmittgen TD: Analysis of
relative gene expression data using real-time quantitative PCR and
the 2(-Delta Delta C(T)) method. Methods. 25:402–408. 2001.
View Article : Google Scholar
|
|
20
|
Subramanian A, Tamayo P, Mootha VK,
Mukherjee S, Ebert BL, Gillette MA, Paulovich A, Pomeroy SL, Golub
TR, Lander ES, et al: Gene set enrichment analysis: A
knowledge-based approach for interpreting genome-wide expression
profiles. Proc Natl Acad Sci USA. 102:15545–15550. 2005. View Article : Google Scholar : PubMed/NCBI
|
|
21
|
Mootha VK, Lindgren CM, Eriksson KF,
Subramanian A, Sihag S, Lehar J, Puigserver P, Carlsson E,
Ridderstråle M, Laurila E, et al: PGC-1alpha-responsive genes
involved in oxidative phosphorylation are coordinately
downregulated in human diabetes. Nat Genet. 34:267–273. 2003.
View Article : Google Scholar : PubMed/NCBI
|
|
22
|
Yan TD, Black D, Bannon PG and McCaughan
BC: Systematic review and meta-analysis of randomized and
nonrandomized trials on safety and efficacy of video-assisted
thoracic surgery lobectomy for early-stage non-small-cell lung
cancer. J Clin Oncol. 27:2553–2562. 2009. View Article : Google Scholar : PubMed/NCBI
|
|
23
|
Na F, Wang J, Li C, Deng L, Xue J and Lu
Y: Primary tumor standardized uptake value measured on
F18-Fluorodeoxyglucose positron emission tomography is of
prediction value for survival and local control in non-small-cell
lung cancer receiving radiotherapy: meta-analysis. J Thorac Oncol.
9:834–842. 2014. View Article : Google Scholar : PubMed/NCBI
|
|
24
|
Rossi A, Chiodini P, Sun JM, O'Brien ME,
von Plessen C, Barata F, Park K, Popat S, Bergman B, Parente B, et
al: Six versus fewer planned cycles of first-line platinum-based
chemotherapy for non-small-cell lung cancer: A systematic review
and meta-analysis of individual patient data. Lancet Oncol.
15:1254–1262. 2014. View Article : Google Scholar : PubMed/NCBI
|
|
25
|
Blumenthal GM, Zhang L, Zhang H,
Kazandjian D, Khozin S, Tang S, Goldberg K, Sridhara R, Keegan P
and Pazdur R: Milestone analyses of immune checkpoint inhibitors,
targeted therapy, and conventional therapy in metastatic non-small
cell lung cancer trials: A Meta-analysis. JAMA Oncol.
3:e1710292017. View Article : Google Scholar : PubMed/NCBI
|
|
26
|
Kulkarni S, Vella E, Coakley N, Cheng S,
Gregg R, Ung Y and Ellis PM: The use of systemic treatment in the
maintenance of patients with non-small cell lung cancer: A
systematic review. J Thorac Oncol. 11:989–1002. 2016. View Article : Google Scholar : PubMed/NCBI
|
|
27
|
Zer A, Ding K, Lee S, Goss G, Seymour L,
Ellis P, Hackshaw A, Bradbury PA, Han L, O'Callaghan CJ, et al:
Pooled analysis of the prognostic and predictive value of KRAS
mutation status and mutation subtype in patients with non-small
cell lung cancer treated with epidermal growth factor receptor
tyrosine kinase inhibitors. J Thorac Oncol. 11:312–323. 2016.
View Article : Google Scholar : PubMed/NCBI
|
|
28
|
Qiu F, Yang L, Ling X, Yang R, Yang X,
Zhang L, Fang W, Xie C, Huang D, Zhou Y, et al: Sequence variation
in mature MicroRNA-499 confers unfavorable prognosis of lung cancer
patients treated with platinum-based chemotherapy. Clin Cancer Res.
21:1602–1613. 2015. View Article : Google Scholar : PubMed/NCBI
|
|
29
|
Tang H, Wang S, Xiao G, Schiller J,
Papadimitrakopoulou V, Minna J, Wistuba II and Xie Y: Comprehensive
evaluation of published gene expression prognostic signatures for
biomarker-based lung cancer clinical studies. Ann Oncol.
28:733–740. 2017. View Article : Google Scholar : PubMed/NCBI
|
|
30
|
Shackelford DB and Shaw RJ: The LKB1-AMPK
pathway: Metabolism and growth control in tumour suppression. Nat
Rev Cancer. 9:563–575. 2009. View Article : Google Scholar : PubMed/NCBI
|
|
31
|
Sanchez-Cespedes M, Parrella P, Esteller
M, Nomoto S, Trink B, Engles JM, Westra WH, Herman JG and Sidransky
D: Inactivation of LKB1/STK11 is a common event in adenocarcinomas
of the lung. Cancer Res. 62:3659–3662. 2002.PubMed/NCBI
|
|
32
|
Fang R, Zheng C, Sun Y, Han X, Gao B, Li
C, Liu H, Wong KK, Liu XY, Chen H, et al: Integrative genomic
analysis reveals a high frequency of LKB1 genetic alteration in
Chinese lung adenocarcinomas. J Thorac Oncol. 9:254–258. 2014.
View Article : Google Scholar : PubMed/NCBI
|
|
33
|
Calles A, Sholl LM, Rodig SJ, Pelton AK,
Hornick JL, Butaney M, Lydon C, Dahlberg SE, Oxnard GR, Jackman DM,
et al: Immunohistochemical loss of LKB1 is a biomarker for more
aggressive biology in KRAS-mutant lung adenocarcinoma. Clin Cancer
Res. 21:2851–2860. 2015. View Article : Google Scholar : PubMed/NCBI
|
|
34
|
Gao B, Sun Y, Zhang J, Ren Y, Fang R, Han
X, Shen L, Liu XY, Pao W, Chen H, et al: Spectrum of LKB1, EGFR,
and KRAS mutations in chinese lung adenocarcinomas. J Thorac Oncol.
5:1130–1135. 2010. View Article : Google Scholar : PubMed/NCBI
|
|
35
|
Shackelford DB, Abt E, Gerken L, Vasquez
DS, Seki A, Leblanc M, Wei L, Fishbein MC, Czernin J, Mischel PS,
et al: LKB1 inactivation dictates therapeutic response of non-small
cell lung cancer to the metabolism drug phenformin. Cancer Cell.
23:143–158. 2013. View Article : Google Scholar : PubMed/NCBI
|
|
36
|
Demchev V, Malana G, Vangala D, Stoll J,
Desai A, Kang HW, Li Y, Nayeb-Hashemi H, Niepel M, Cohen DE, et al:
Targeted deletion of fibrinogen like protein 1 reveals a novel role
in energy substrate utilization. PLoS One. 8:e580842013. View Article : Google Scholar : PubMed/NCBI
|
|
37
|
Zou Z, Cai Y and Chen Y, Chen S, Liu L,
Shen Z, Zhang S, Xu L and Chen Y: Bone marrow-derived mesenchymal
stem cells attenuate acute liver injury and regulate the expression
of fibrinogen-like-protein 1 and signal transducer and activator of
transcription 3. Mol Med Rep. 12:2089–2097. 2015. View Article : Google Scholar : PubMed/NCBI
|
|
38
|
Wang H, Meyer CA, Fei T, Wang G, Zhang F
and Liu XS: A systematic approach identifies FOXA1 as a key factor
in the loss of epithelial traits during the
epithelial-to-mesenchymal transition in lung cancer. BMC Genomics.
14:6802013. View Article : Google Scholar : PubMed/NCBI
|
|
39
|
Çeliktas M, Tanaka I, Tripathi SC,
Fahrmann JF, Aguilar-Bonavides C, Villalobos P, Delgado O, Dhillon
D, Dennison JB, Ostrin EJ, et al: Role of CPS1 in cell growth,
metabolism and prognosis in LKB1-inactivated lung adenocarcinoma. J
Natl Cancer Inst. 109:1–9. 2017. View Article : Google Scholar : PubMed/NCBI
|
|
40
|
Okon IS, Coughlan KA, Zhang C, Moriasi C,
Ding Y, Song P, Zhang W, Li G and Zou MH: Protein kinase LKB1
promotes RAB7-mediated neuropilin-1 degradation to inhibit
angiogenesis. J Clin Invest. 124:4590–4602. 2014. View Article : Google Scholar : PubMed/NCBI
|
|
41
|
Roy BC, Kohno T, Iwakawa R, Moriguchi T,
Kiyono T, Morishita K, Sanchez-Cespedes M, Akiyama T and Yokota J:
Involvement of LKB1 in epithelial-mesenchymal transition (EMT) of
human lung cancer cells. Lung Cancer. 70:136–145. 2010. View Article : Google Scholar : PubMed/NCBI
|
|
42
|
Shaw RJ, Kosmatka M, Bardeesy N, Hurley
RL, Witters LA, DePinho RA and Cantley LC: The tumor suppressor
LKB1 kinase directly activates AMP-activated kinase and regulates
apoptosis in response to energy stress. Proc Natl Acad Sci USA.
101:3329–3335. 2004. View Article : Google Scholar : PubMed/NCBI
|