Introduction
Cholangiocarcinoma (CC) is a malignant tumor
originating from epithelial cells lining the biliary tree (1,2).
Intrahepatic CC arises within the liver and extrahepatic CC in the
bile ducts along the hepatoduodenal ligament. CC is usually
clinically silent or associated with non-specific symptoms in the
early stages of the disease (3,4). CCs
are relatively rare, although their incidence is increasing
worldwide, being second most common primary liver tumor following
hepatocellular carcinoma (1,2,5).
Intrahepatic and extrahepatic CC are probably dissimilar tumors,
and this is supported by recent in vitro evidence, as these
neoplasms express diverse proteins, have different cell shapes,
doubling times, chromosome alterations and chemo-sensitivity
(6). The therapeutic options for
CC are limited due to late diagnosis and need to be adapted to each
case. Tumor resection is the only potential cure for CC. However, a
number of patients are not considered surgical candidates due to
comorbidities or an advanced age (7,8), and
the median survival of patients with unresectable tumors is 6-12
months (2,7,8).
Thus, nearly half of patients with CC are only candidates for
palliative treatments (2,4,9).
Therefore, the search for more effective therapeutic strategies for
CC is mandatory.
According to recent publications, a significant
number of CC cases expresses natrium-iodide symporter (NIS) at the
cell membrane, which may represent a key target for a novel
therapeutic approach based on metabolic radiotherapy using
iodine-131 (131I) (10-12).
NIS is a glycosylated integral membrane protein that mediates the
active transport of iodine into cells. Location at cell membrane
seems to be essential to iodine uptake (13-15).
It is known that thyroid follicular cells exhibit constitutive NIS
expression (13). Their ability to
accumulate iodine through NIS was the basis for the development of
diagnostic tools, but also for use in therapy with 131I
to destroy hyperfunctional thyroid tissue, such as tumor tissue and
metastases (15). Several
publications highlight NIS expression in non-thyroidal tissues,
reporting NIS immunostaining in >15 types of human tissues and
different types of tumors (10,16-20).
NIS expression in CC in human tissues was described for the first
time in 2007 (10). It was found
that NIS is expressed by cholangiocytes of the bile duct epithelium
of patients with CC. However, NIS expression found in normal bile
duct cells was very low in contrast to the higher expression by
proliferating cells, both in tumors and non-tumor areas adjacent to
CC samples from the patients included on that study (10). Recently, in 2012, Kim et al
demonstrated that in 60 cases of CCs examined, >98% of these
expressed NIS, although only 33.3% expressed this protein at the
cell membrane (11). Therefore,
NIS may be a target for the development of novel therapeutic tools
for CC, based on the acquisition and retention of iodine, such as
131I (10,11). Moreover, in extrahepatic CCs, to
date, there are no studies available concerning NIS expression, at
least to the best of our knowledge.
Metabolic radiotherapy using 131I is
already used in the treatment of thyroid disorders, namely for the
ablation of remaining thyroid tissue or for the treatment of
residual, recurrent or metastatic disease, being one of the most
successful anticancer therapies (21,22).
Thus, the aim of this study was to elucidate the role of NIS
receptor as a potential agent for use in the treatment of CC with
131I therapy.
Materials and methods
Cells and cell culture
Human cell lines of extrahepatic CC (TFK-1, Deutsche
Sammlung von Mikroorganismen und Zellkulturen) and intrahepatic CC
(HuCCT1, JCRB0425, JCRB Cell Bank) were used, together with the
human immortalized non-malignant intrahepatic cholangiocytes cell
line, H69 (23). CC cells were
cultured according to manufacturer's instructions, in RPMI-1640
(R4130 Sigma-Aldrich) supplemented with 5% fetal bovine serum
(F7524, Sigma-Aldrich), 1% antibiotic/antimycotic (15240, Gibco®)
and sodium pyruvate (11360, Gibco®; Thermo Fisher Scientific) at
400 mM, pH 7.4. H69 cells were cultured as previously described in
the study by Hohenester et al (24). The cells were maintained in a
humidified atmosphere, 37°C and 5% CO2 [Heraeus HeraCell
150 CO2 Incubator (BridgePath Scientific)]. Cells at
<15 passages were used.
Irradiation with I3II
Irradiation of the cells with 131I was
carried out according to a previously established protocol
(25). The cells were exposed to
internal radiation with 131I (IBA Molecular) for 5 min,
using different activities to achieve different radiation exposure
doses as summarized in Tables SI and
SII. Following exposure to 131I, the cells were
washed with phosphate-buffered saline (PBS). Doses were calculated
assuming the worst-case scenario, i.e., all the emitted energy in
the decay process was absorbed by the cells. The radiation exposure
dose was calculated using the following equation:
where 'D' represents the absorbed dose (Gy),
'A0' represents the initial activity of the radioactive
source (mCi), 'T1/2' represents the half-life
(sec), 't' represents the irradiation time (sec).
E¯ ' represents the average
energy per disintegration (eV) and 'M' represents the sample mass
subjected to irradiation (kg).
Determination of NIS protein
expression
NIS protein expression was evaluated by
immunofluorescence methods. Briefly, 1×10⁵ cells were
plated in 12 multi-well plates. After 24 h, the cells were
irradiated with 20 Gy of 131I. At 2 h post-irradiation,
the control and irradiated cells were incubated with anti-NIS
primary antibody [NIS (N-15), sc-48055, Santa Cruz Biotechnology]
and secondary antibody (Alexa Fluor® 488, rabbit anti-goat IgG,
A-11078, Life Technologies®; Thermo Fisher Scientific) according to
the manufacturer's instructions. The cells were then incubated with
Hoechst 33342 (B1153, Sigma Aldrich®). After processing, the slides
were observed under a fluorescence microscope (Leica DM 4000 B).
Images were analyzed using ImageJ version 1.52 g software to
quantify NIS expression (total and membrane).
131I uptake analyses
For uptake analyses, a suspension of CC cells at
2×10⁶ cells/ml was prepared in 25 cm2 flasks.
Subsequently, 131I was added at 9.25×10⁵
Bq/ml after achieving steady-state conditions. The samples were
removed to microtubes containing cold PBS for uptake determination
at 5, 30, 60, 90 and 120 min. During radiotracer uptake analyses,
for every sample, the cells were resuspended to ensure uniformity.
Cell suspensions were then centrifuged at 5,600 × g for 1 min, at
4°C. The radioactivity of the cell pellets and supernatants was
measured separately with a well-type gamma counter (Capintec, Inc.
CRC, 25W) to determine the 131I uptake percentage. Cell
viability was assessed by the trypan blue exclusion test at the
conclusion of the experiments, as previously described (26,27).
Briefly, a cell suspension was mixed with trypan blue (1:1 ratio).
Subsequently, the viable cells, which do not incorporate the trypan
blue dye, and dead cells, which are dyed blue, were counted to
calculate the percentage of cell viability, and thus, to ensure
that cell death did not occur during the experiment. Uptake curves
were obtained from modeling to 1st degree systems resulting in
exponential equations. The adjustment of these curves to
experimental data was performed by the Levenberg-Marquardt
optimization method, an algorithm that is an iterative technique
that locates the minimum of a function that is expressed as the sum
of squares of nonlinear functions (28,29)
and 95% confidence intervals were obtained in addition to
coefficients of adjustment. We determined maximal uptake and
half-time to each cell line. Matlab R2014a software was used.
Cell survival analysis
Cell survival was evaluated by clonogenic assay
(25). Briefly, 1.5×10⁶
cells were plated in 25 cm2 flasks and subsequently
irradiated with 131I (3.5, 20 and 60 Gy), apart from the
control cells. At 12 days post-irradiation, the cells were fixed
with methanol and stained with crystal violet for 5 min, at room
temperature. Colonies with >50 cells were counted and efficiency
plate (EP) and survival factor (SF) were determined.
Viability and cell death
The effects of 131I on cell viability and
types of induced cell death were determined by flow cytometry using
Annexin-V/propidium iodide (AnV-PI) (KIT Immunotech). Briefly,
cells were irradiated with 131I (10, 20 and 60 Gy).
After 48 h, the control and irradiated cells were double-labeled
with AnV conjugated with fluorescein isothiocyanate (AnV-FITC) and
PI as previously described (31).
Cell cycle analysis
For cell cycle analysis, the cells were previously
irradiated with 10, 20 and 60 Gy of 131I. After 48 h,
the control and irradiated cells were fixed and incubated as
previously described (31).
Analysis of NIS gene expression
Total RNA was extracted using TRIzol® reagent
(Ambion®) and quantified in a QUBIT 2.0 fluorometer according to
the manufacturer's instructions. First-strand cDNA was synthesized
using the High Capacity cDNA® kit (Applied Biosystems).
Transcription levels were normalized to the GAPDH and
fi-actin genes and the qPCR reaction was conducted using the
StepOne Plus™ Real Time-PCR® system (Applied Biosystems).
The samples were processed at 95°C for 10 min, followed by 40
cycles at 95°C for 15 sec and 60°C for 1 min. The oligonucleotide
primers were purchased from Thermo Fisher Scientific and were as
follows: NIS, Hs00166567_m1; GAPDH, Hs02786624_g1 and
Hs01060665_g1. NIS relative gene expression was determined by the
2−ΔΔCq comparative method, which relates the mean
expression of normalizing genes used as an endogenous control and
the mean expression of genes of interest (32). All samples were tested in
triplicate and expressed as the relative difference of n-times in
relation to calibrator (controls). Negative controls were included
for all reactions.
Karyotyping
Metaphase chromosomes from the TKF-1 and HuCCT1
cells without treatment and from cells irradiated with 1, 20 and 60
Gy of 131I were prepared and analyzed by GTG-banding
using standard protocols (33).
Briefly, the chromosomes of 32 metaphases were analyzed and then
metaphases were digitally imaged and karyotyped resorting to a
microscope (Eclipse-400, Nikon) and karyotyped using a Cytovision
software version 3.93.2 (Applied Imaging System).
DNA extraction
DNA from the CC cells treated with or without
irradiation and from the control cultured cells of gingival tissue
obtained from healthy patients undergoing surgical removal of
wisdom teeth was extracted using the High Pure PCR Template
Preparation kit (Roche GmbH), according to the manufacturer's
recommendations. The DNA concentration and purity were measured
using a NanoDrop1000 Spectrophotometer (Thermo Fisher
Scientific).
Array CGH
High-resolution whole genome analyses (aCGH) were
performed using Agilent SurePrint G3 Human Genome microarray 180 K
(Agilent Technologies), as previous described (34). DNA of both cell lines without
irradiation and those treated with 60 Gy were labeled with Cy5 by
random primer labeling. DNA from a male commercial control (Agilent
Technologies) was labeled with Cy3. The results were analyzed using
Agilent Genomic Workbench v6.5 software with the following
settings: ADM2 as aberration algorithm, threshold of 6.0, moving
average 2 Mb. The 3 are according to Human Genome build 19 and
include imbalances with at least three consecutive probes with
abnormal log2 ratios. The results are presented accordingly to
GRCh37/hg19.
Methylation-specific multiplex
ligation-dependent probe amplification (MS-MLPA)
MS-MLPA analyses were performed using ME002 probemix
(MRC-Holland), which can simultaneously detect copy number
alterations (CNAs) in 38 tumor suppressor genes and aberrant
methylation patterns in a subset of 25 of these genes as previously
described (33). All MS-MLPA
reactions were performed according to a previous study (35) using DNA from both cell lines and
all doses of irradiation.
Statistical analysis
Statistical analysis was performed using IBM SPSS
v.20 software (IBM Corp.). In descriptive analysis, measures of
central tendency (mean and median) and dispersion (standard
deviation and interquartile range) for quantitative variables were
determined. The normal distribution of these variables was assessed
using the Shapiro-Wilk test. For normal underlying distributions,
parametric tests were used and non-parametric tests in the opposite
case. Comparisons of quantitative variables between 2 groups were
performed using a Student's t-test (parametric) and the
Mann-Whitney U test (non-parametric). Comparisons of quantitative
variables between >2 groups were carried out using one-factor
ANOVA with post hoc analysis using Tukey's test (parametric tests)
and the Kruskal-Wallis test, with multiple comparisons performed
using the Mann-Whitney U test with the Bonferroni correction. To
analyze the results of clonogenic assay, data were adjusted to
linear quadratic model using OriginalLab v.8.0 software. A
significance level of 5% was considered and a value of P<0.05
was considered to indicate statistically significant
differences.
As described above, for uptake assays, the curves
were obtained from modeling to 1st degree systems resulting in
exponential equations. Following the adjustment of these curves to
experimental data, 95% confidence intervals were obtained in
addition to coefficients of adjustment. Significant differences are
considered when there was no overlap of the 95% confidence
intervals.
Results
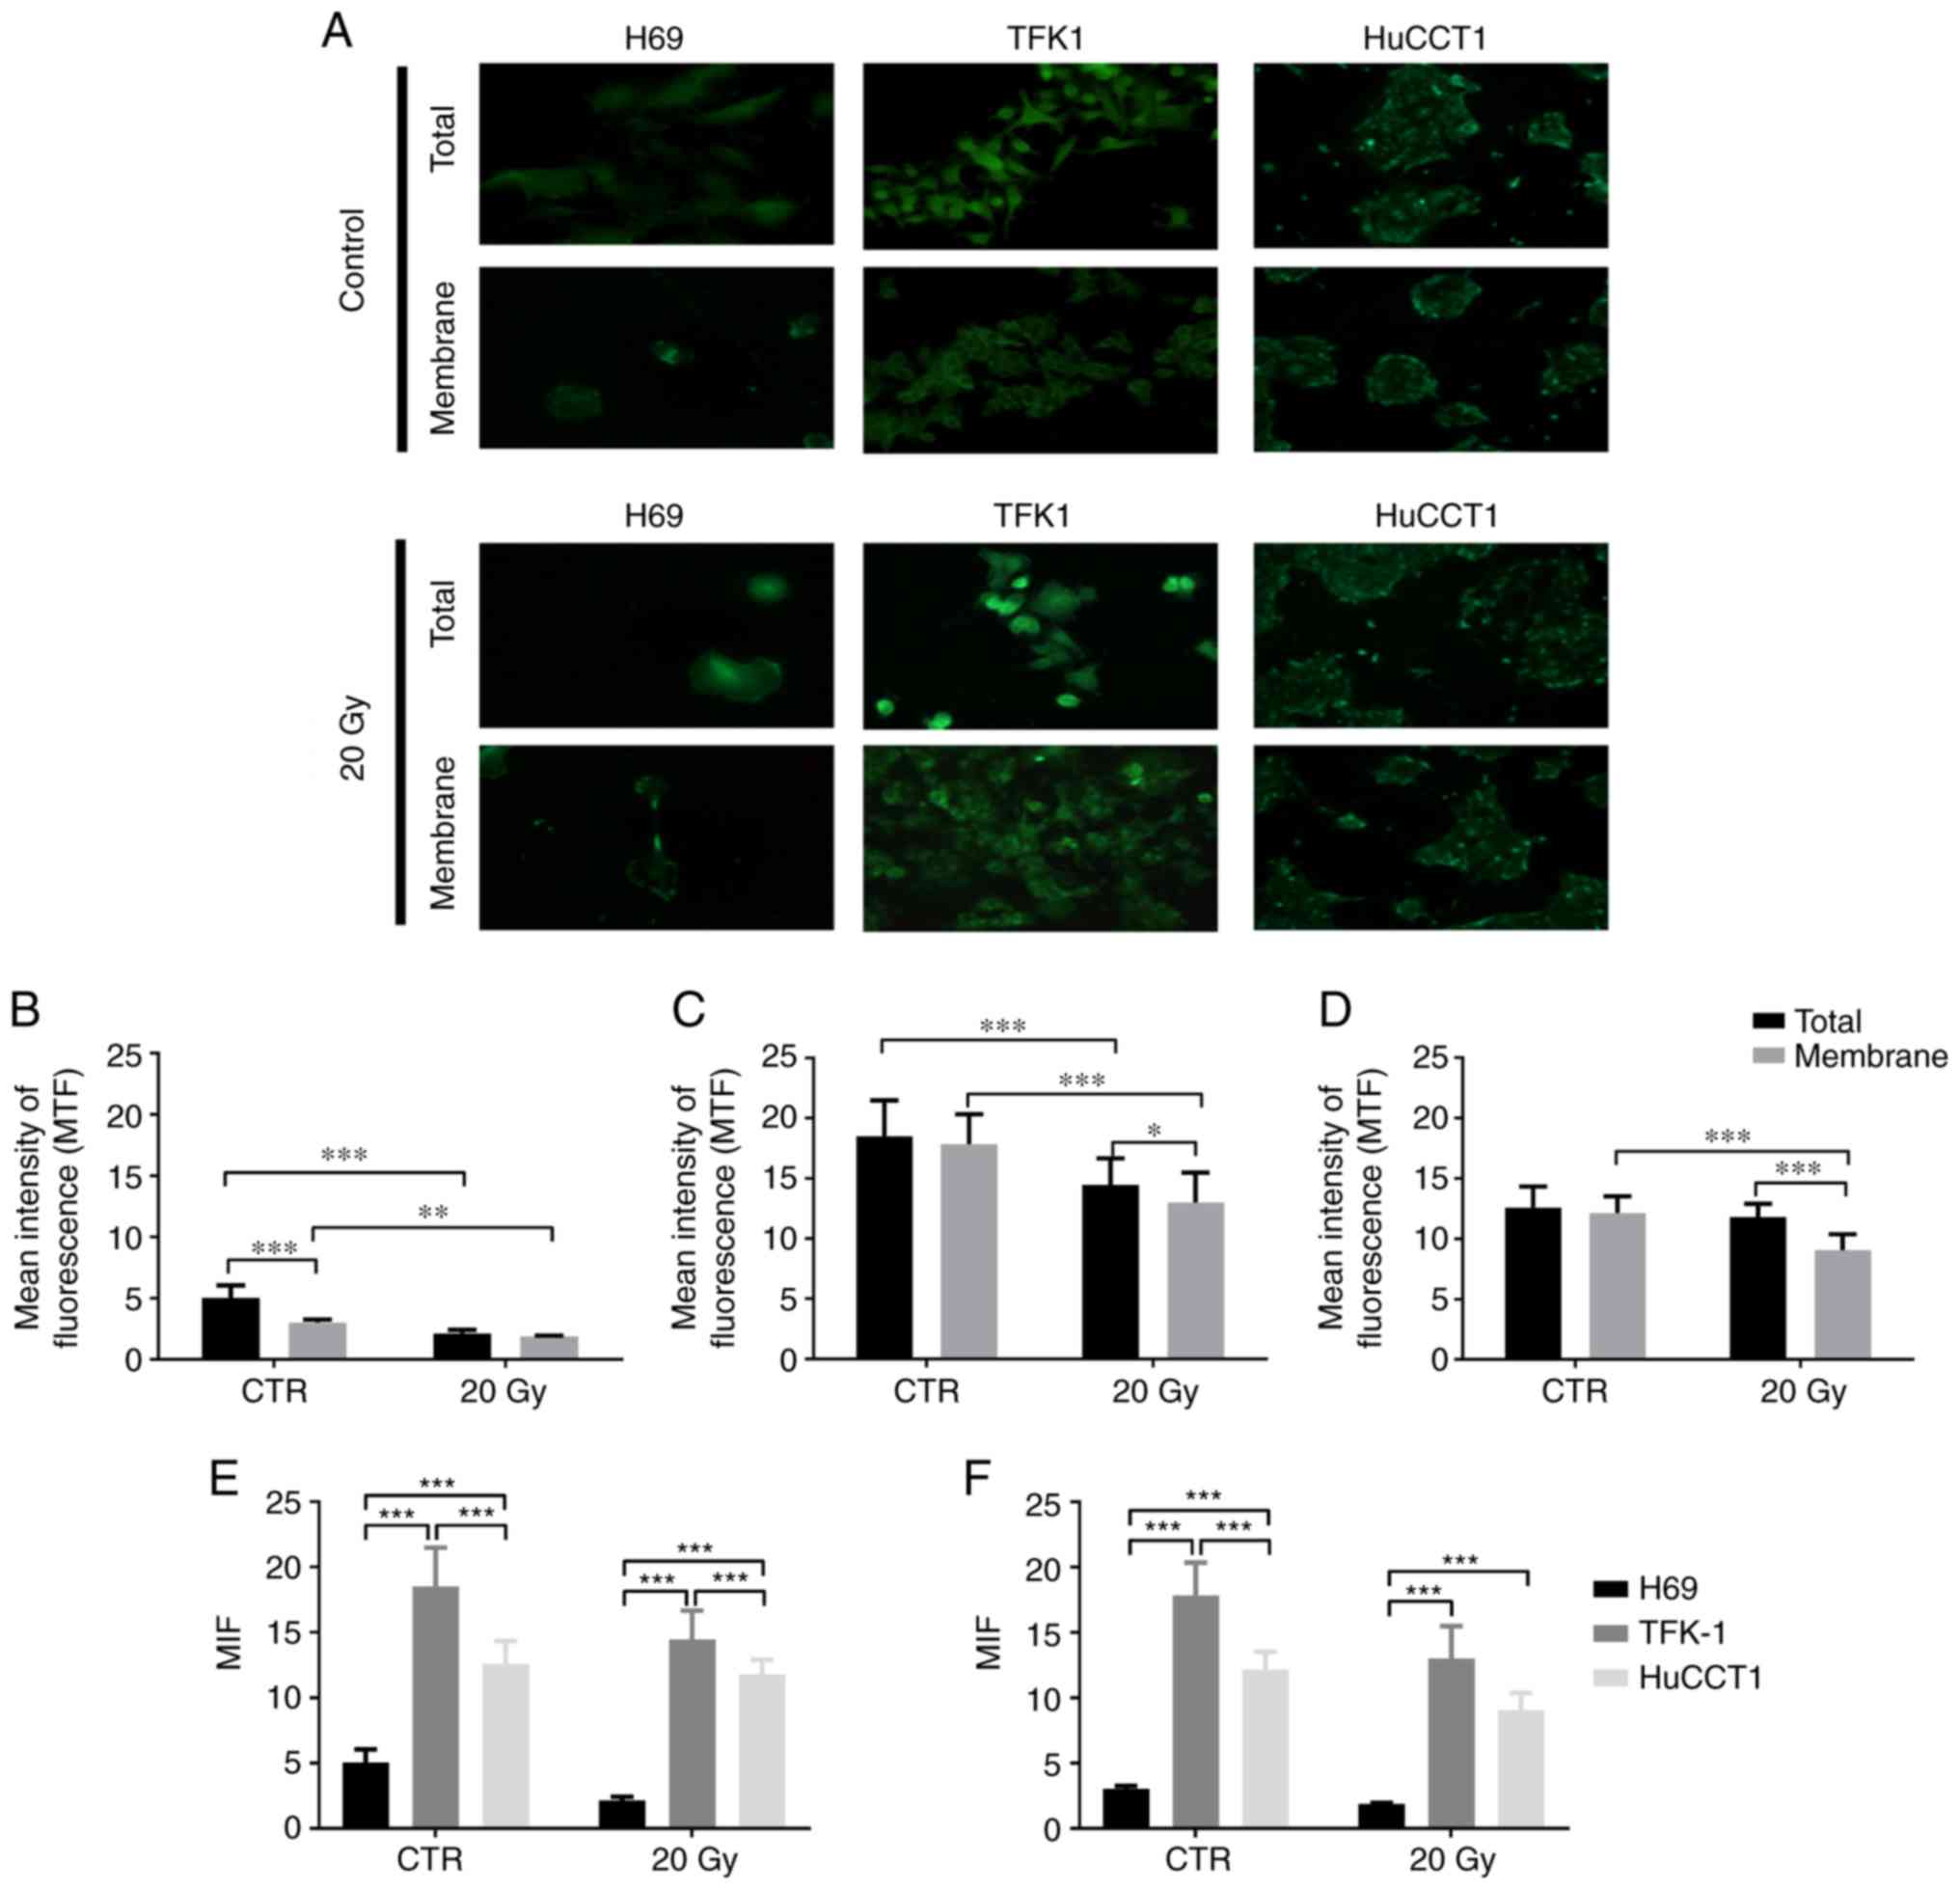
NIS protein expression
NIS protein expression in the CC and cholangiocytes
was assessed by immunofluorescence. Representative images of NIS
expression in the CC and cholangiocytes (membrane and total), the
controls and following irradiation (20 Gy), as well as
quantification as mean intensity of fluorescence (MIF) are
presented in Fig. 1.
As shown in Fig.
1A, the TFK-1 and HuCCTl CC cells exhibited a higher NIS
expression compared to the cholangiocytes. MIF quantification
revealed that NIS expression was cell line-dependent. In the
cholangiocytes (H69 cells, Fig.
1B), in the controls, total NIS expression was significantly
higher than membrane expression (5.05±0.99 vs. 3.03±0.24;
P<0.001). The total NIS expression in the controls was also
significantly higher than the total expression following exposure
to 20 Gy of 131I (2.13±0.30; P<0.001). Moreover, the
membrane expression in the control cells was significantly higher
compared to the membrane expression following exposure to
131I (1.88±0.06, P=0.002).
In the TFK-1 cells (Fig. 1C), in the controls, no significant
differences were observed between the NIS total and membrane
expression (18.50±2.99 vs. 17.85±2.49). NIS total expression was
significantly higher in the controls than following exposure to
131I (14.48±2.20; P<0.001). The membrane expression
in the control cells was also significantly higher than following
exposure to 131I (13.01±2.47; P<0.001). Additionally,
the NIS total expression following exposure to 131I was
significantly higher compared to membrane expression (P=0.029).
As regards the HuCCT1 cells (Fig. 1D), in the controls, no significant
differences were observed between NIS total and membrane expression
(12.60±1.75 vs. 12.16±1.38). No differences were also observed
between total NIS expression in the control cells and the
irradiated cells (11.79±1.11). Moreover, NIS membrane expression
was significantly higher in the control cells compared to the
irradiated cells (9.08±1.31; P<0.001). Following exposure to 20
Gy, the total NIS expression was significantly higher compared to
membrane expression (P<0.001).
The results of the comparison of NIS expression
between cell lines are described in Fig. 1E (total NIS expression) and
Fig. 1F (membrane NIS expression).
In the control cells, total NIS expression was significantly lower
in the H69 cells compared to the TFK-1 cells (P<0.001) and
HuCCT1 (P<0.001) cells. In the controls, the TFK-1 cells
exhibited a higher NIS total expression compared to the HuCCT1
cells (P<0.001). As regards NIS membrane expression, in the
control cells, the expression was significantly lower in the H69
compared to the TFK-1 (P<0.001) and HuCCT1 (P<0.001) cells.
The TFK-1 cells exhibited a higher NIS membrane expression in the
control cells, compared to the HuCCT1 cells (P<0.001) (Fig. 1E and F).
Following exposure to 131I, differences
in NIS expression were observed between the cholangiocytes and CC
cells. Thus, the H69 cholangiocytes presented a significantly lower
NIS total expression compared to the CC cells TFK-1 (P<0.001)
and HuCCT1 (P<0.001). The TFK-1 cells exhibited a higher NIS
expression compared to the HuCCT1 cells (P<0.001). As regards
NIS membrane expression following irradiation, the H69 cells
exhibited a significantly lower expression compared to the TFK-1
and HuCCT1 cells (P<0.001) (Fig. 1E
and F).
131I uptake
Following incubation of the cell lines with
131I, we determined the 131I profile. The
results (Table I) revealed a
significant increase in the maximal uptake value when comparing the
HuCCT1 (0.13%; 95% CI: 0.11-0.15%) with the TFK-1 cells (0.20%; 95%
CI: 0.19-0.21%). As regards the half-life time, the results
revealed no statistically significant differences between the two
cell lines.
 | Table I131I uptake by the CC cell
lines TFK-1 and HuCCT1. |
Table I
131I uptake by the CC cell
lines TFK-1 and HuCCT1.
| Cell line | Maximal uptake
| Half time
| r2 |
|---|
| Average (%) | 95% CI | Average (%) | 95% CI |
|---|
| TFK-1 | 0.20 | 0.19-0.21 | 3.30 | 2.56-4.04 | 0.94 |
| HuCCT1 | 0.13 | 0.11-0.15 | 1.58 | −0.27-3.44 | 0.64 |
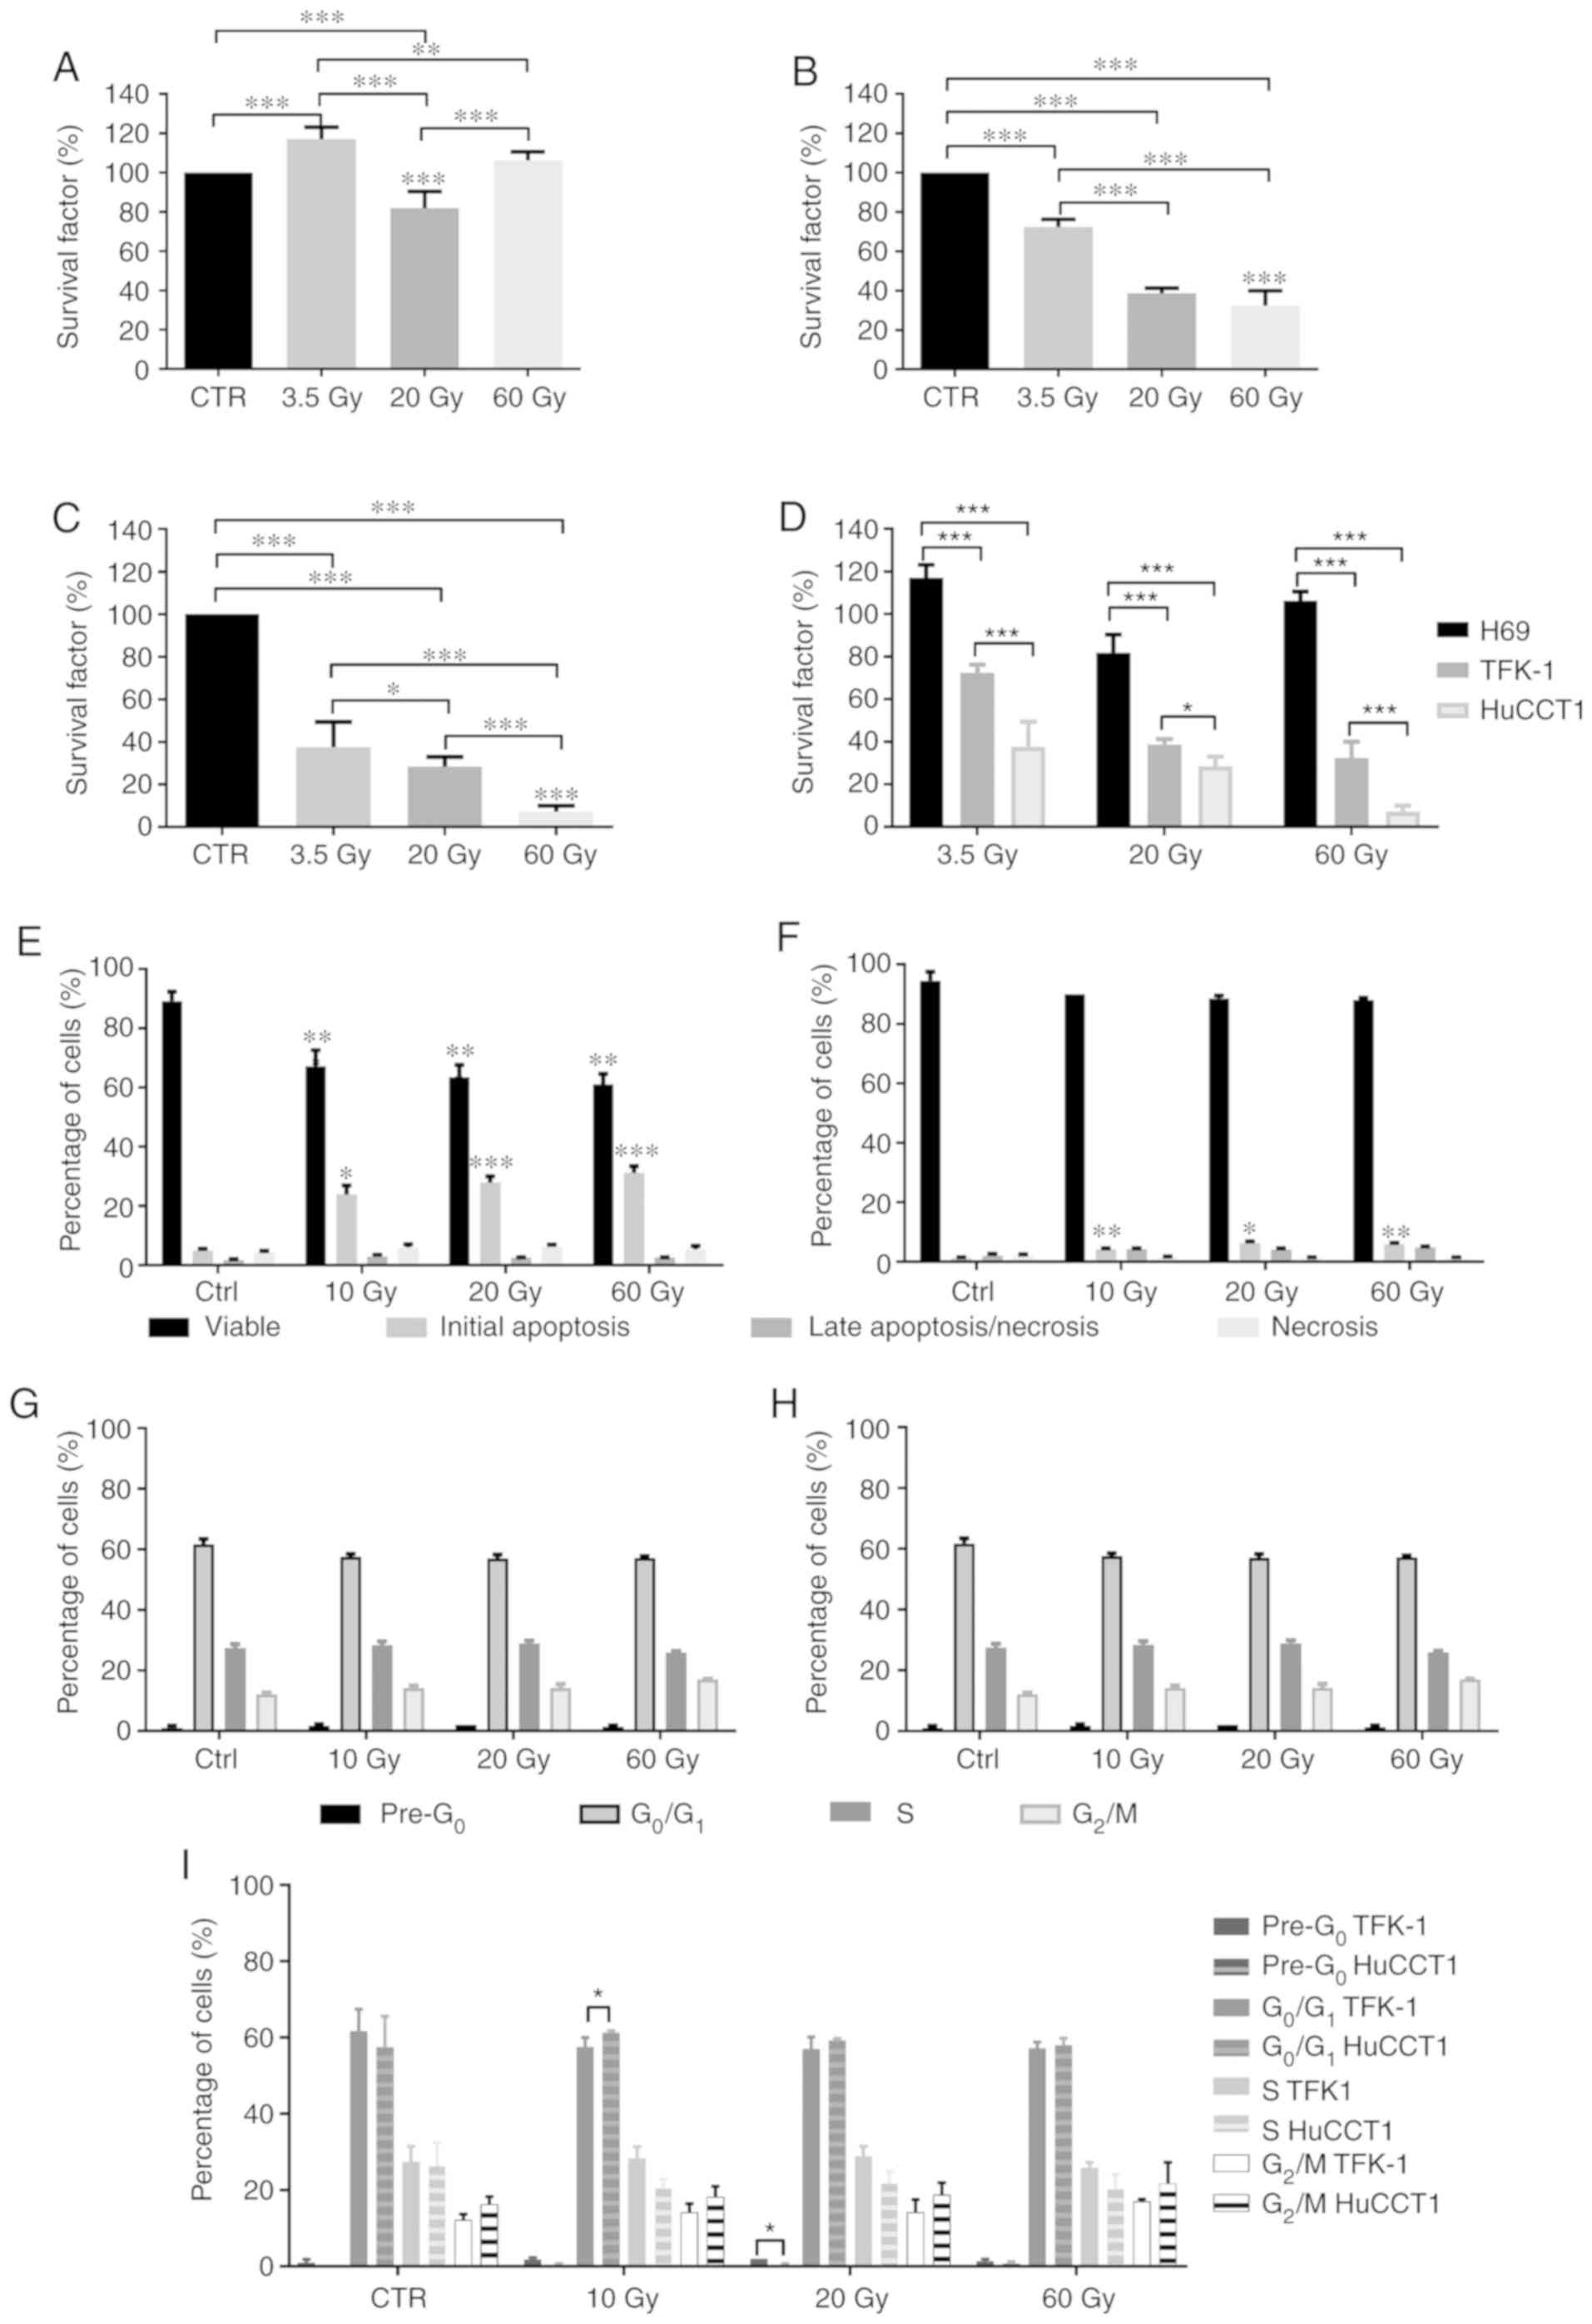
Cell survival
We evaluated effects of irradiation with
131I on the survival of cholangiocytes (Fig. 2A) and the TFK-1 (Fig. 2B) and HuccT1 (Fig. 2C) CC cells by clonogenic assay. In
the cholangiocytes, we observed a significant increase in cell
survival following exposure to 3.5 Gy (116.95±6.21%; P<0.001)
and a statistically significant decrease following exposure to 20
Gy (81.85±8.54%; P<0.001), with no statistically significant
difference observed at 60 Gy (106.21±4.37%), compared to the
controls. Cell survival following exposure to 3.5 Gy was
statistically significantly higher compared to that at 20 Gy
(P<0.001) and 60 Gy (P=0.004). Cell survival following exposure
to 20 Gy was significantly lower compared to that at 60 Gy
(P<0.001) (Fig. 2A).
In the TKF-1 cells, irradiation with 3.5 Gy
significantly decreased cell survival compared to the controls
(72.42±3.85%; P<0.001). Irradiation with 20 and 60 Gy induced a
significant decrease in cell survival compared to the controls,
(38.73±2.51%; P<0.001 for 20 Gy and 32.42±7.52%; P<0.001 for
60 Gy). Cell survival following irradiation with 3.5 Gy was
significantly higher compared to that at 20 Gy (P<0.001) and 60
Gy (P<0.001) (Fig. 2B).
The HuCCT1 cells exhibited a significant decrease in
cell survival following exposure to 3.5 Gy (37.48±11.96%%;
P<0.001), 20 Gy (28.43±4.50%%; P<0.001) and 60 Gy
(7.17±2.80%%; P<0.001), compared to the controls. Moreover, cell
survival decreased with the increasing radiation doses, as cell
survival was significantly lower following irradiation with 60 Gy
compared to that at 3.5 and 20 Gy (P<0.001) and cell survival
following irradiation with 20 Gy was significantly lower compared
to that at 3.5 Gy (P=0.034) (Fig.
2C).
Depending on the cell line, irradiation with
131I promoted varying effects on cell survival. In a
general, the survival of the CC cells decreased as the
131I irradiation dose increased. The intrahepatic HuCCT1
CC cells were more sensitive to irradiation with 131I.
We observed that the survival of the cholangiocytes was higher than
that of the TFK-1 and HuCCT1 cells (P<0.001) following exposure
to 131I for all doses (Fig.
2D). Considering these results, the analyses of the effects of
131I and cytogenetic analyses were only performed on the
CC cell lines.
Cell viability and cell death
We evaluated cell viability and the type of cell
death following irradiation with 131I by Annexin V-FITC
and propidium iodide double labeling. The results (Fig. 2E and F) revealed that cell
viability and the type of cell death were highly dependent on the
cell line and irradiation dose. In the TFK-1 cells (Fig. 2E), irradiation induced a
significant decrease in cell viability following irradiation with
10 Gy (67.17±5.42%; P<0.001), 20 Gy (63.50±4.09%; P<0.001)
and 60 Gy (61.00±3.63%; P<0.001), compared to the controls
(89.17±3.19%). The decreased cell viability was due to the
increased percentage of cells in initial apoptosis following
radiation with 10 Gy (23.83±7.57%; P=0.013), 20 Gy (27.83±5.31%;
P<0.001) and 60 Gy (31.17±5.56%; P<0.001), compared to the
controls (4.83±1.83%). No significant alterations in cells
undergoing cell death by late apoptosis/necrosis and necrosis were
observed following irradiation, compared to the controls.
The irradiated HuCCTl cells (Fig. 2F) exhibited no significant
alterations in cell viability compared to the control cells.
However, we observed a statistically significant increase in the
number of cells undergoing cell death by apoptosis following
irradiation with 10 Gy (4.25±0.50%; P=0.002), 20 Gy (6.25±1.26%;
P=0.015) and 60 Gy (6.00±0.82%; P=0.002), compared to the controls
(1.25±0.50%). Irradiation with 131I did not
significantly alter the number of cells undergoing late
apoptosis/necrosis and necrosis.
Cell cycle alterations
Exposure of the CC cells to 131I led to
cell cycle arrest in the different phases. In the TFK-1 cells
(Fig. 2G), no marked changes were
observed in the pre-apoptotic peak following irradiation with 10 Gy
(1.75±1.50%), 20 Gy (2.00±0.00%) and 60 Gy (1.33±0.58%), compared
to the controls (1.00±0.82%). As regards cells in the
G0/G1 phase, no statistically significant
differences were observed following irradiation with 10 Gy
(57.50±2.51%), 20 Gy (57.00±3.16%) and 60 Gy (57.17±1.60%),
compared to the controls (61.72±5.71%). Similarly, there were no
significant alterations in the percentage of TFK-1 cells blocked in
the S phase following irradiation with 10 Gy (28.33±3.08%), 20 Gy
(28.83±2.64%) and 60 Gy (25.83±1.47%), compared to the control
cells (27.20±4.16%). As regards the G2/M phase, we
observed a tendency towards a higher number of cells blocked in
this phase following irradiation with 10 Gy (14.12±2.23%), 20 Gy
(14.17±3.31%) and 60 Gy (17.00±063%), compared to the controls
(12.13±1.55%).
In the HuCCT1 cells (Fig. 2H), there were no statistically
significant alterations observed in the cells at the apoptotic peak
(pre-G0) following irradiation with 10 Gy (0.25±0.50%), 20 Gy
(0.25±0.50%) and 60 Gy (0.75±0.50%), compared to the controls
(0.00±0.00%). However, a tendency towards an increased number of
cells in the pre-G0 phase was observed. As regards the
G0/Gj phase, no statistically significant differences
were observed following irradiation with 10 Gy (61.25±0.50%), 20 Gy
(59.25±0.50%) and 60 Gy (58.00±1.83%), compared to the controls
(57.50±8.10%). Irradiation with 131I did not alter the
percentage of cells arrested in the S phase even following
irradiation with 10 Gy (20.50±2.38%), 20 Gy (21.75±3.20%) and 60 Gy
(20.25±3.86), compared to the controls (26.25±6.08%). No
statistically significant differences were observed in the cells in
the G2/M phase following irradiation with 10 Gy
(18.25±2.75%), 20 Gy (18.75±3.20%) and 60 Gy (21.75±5.56%),
compared to the controls (16.25±2.06%).
As for the differences between the CC cells, we
observed a significantly higher percentage of TFK-1 cells in the
pre-apoptotic peak following irradiation with 20 Gy compared with
the HuCCT1 cells (P=0.037). We also observed a statistically
significant higher percentage of TFK-1 cells blocked in the S phase
following irradiation with 10 Gy compared to the HuCCT1 cells
(P=0.026) (Fig. 2I).
mRNA NIS expression
NIS mRNA expression was evaluated in the TFK-1 and
HuCCT1 CC cells. The results (Table
II) are expressed relative to the control cells, at 2, 48 h and
12 days following irradiation with 1, 20 and 60 Gy.
| Table IImRNA expression of NIS. |
Table II
mRNA expression of NIS.
| Dose (Gy) | Time of evaluation
following 131I exposure
|
|---|
2 h
| 48 h
| 12 days
|
|---|
| TFK 1 | HuCCT1 | TFK 1 | HuCCT1 | TFK 1 | HuCCT1 |
|---|
| 1 | 3.477±0.195 |
0.000132±0.000028 |
5.087±0.103
P=0.049a |
3.736±0.086
P=0.003a |
11.718±0.183
P=0.049a |
7.407±0.390
P=0.003a |
| 20 |
0.748±0.160
P=0.003d | 0.0189±0.0002 |
9.205±0.327
P=0.002b
P=0.03e |
4.059±0.403
P=0.003b |
5.759±0.103
P=0.002b
P=0.02f |
7.006±0.593
P=0.003b |
| 60 |
2.473±0.143
P=0.003d |
0.0215±0.0008
P=0.049d |
4.688±0.490
P=0.003c
P=0.03e |
0.964±0.037
P=0.003c
P=0.049e |
5.426±0.289
P=0.003c
P=0.02f |
0.000050±0.000004
P=0.003c |
In the TFK-1 cells, irradiation with 1 Gy induced a
significant increase in NIS mRNA expression over time (2 h,
3.477±0.195; 48 h, 5.087±0.103; and 12 days, 11.718±0.183;
P=0.049). Following irradiation with 20 Gy, NIS mRNA expression
increased at 48 h (9.205±0.327), compared to 2 h (0.748±0.160;
P=0.002). A significant decrease was then observed after 12 days,
compared to 48 h following irradiation (5.759±0.103; P=0.002).
Following irradiation with 60 Gy, we observed an increase in NIS
mRNA expression over time (2 h, 2.473±0.143; 48 h, 4.688±0.490; and
12 days, 5.426±0.289; P=0.003). The results at 2 h following
irradiation revealed a higher NIS gene expression (P=0.03)
following irradiation with 1 Gy, compared to that at 20 and 60 Gy
(P=0.03). Moreover, at 48 h following irradiation, we observed
differences in mRNA NIS expression dependent on the dose of
exposure. There was a significant increase in NIS gene expression
following irradiation with 20 Gy compared with 1 Gy (P=0.03). On
the other hand, exposure to 60 Gy induced a decreased mRNA NIS
expression, compared to exposure to 20 Gy (P=0.03). The NIS gene
expression levels decreased with the increasing doses from 1 to 20
Gy and 60 Gy, at 12 days following irradiation, with differences
observed between 1 and 20 Gy and between 1 and 60 Gy (P=0.02).
In the HuCCT1 cells, following irradiation with 1
Gy, we observed a significant increase in NIS mRNA expression with
the increasing time following exposure (2 h, 0.000132±0.000028; 48
h, 3.736±0.086, P=0.003; and 12 days, 7.407±0.390, P=0.003).
Moreover, we observed an increase in NIS mRNA expression over time
following irradiation with 20 Gy (2 h, 0.0189±0.0002; 48 h,
4.059±0.403, P=0.003 and 12 days: 7.006±0.593, P=0.003). The
results revealed an increase in NIS mRNA expression following
irradiation with 60 Gy after 48 h (0.964±0.037) compared to 2 h
(0.0215±0.0008, P=0.003), followed by a significant decrease after
12 days (0.000050±0.000004, P=0.003).
At 2 h of evaluation, NIS gene expression gradually
increased with the increasing doses, as we observed a significant
increase at the dose of 60 Gy, compared to 1 Gy (P=0.049). The
results obtained at 48 h following irradiation revealed an
increased NIS gene expression between doses of 1 and 20 Gy, with a
subsequent significant decrease in 60 Gy (P=0.049). At 12 days
following irradiation, the NIS gene expression levels were very
similar between 1 and 20 Gy. However, a tendency towards decreased
levels between the above-mentioned doses and 60 Gy was
observed.
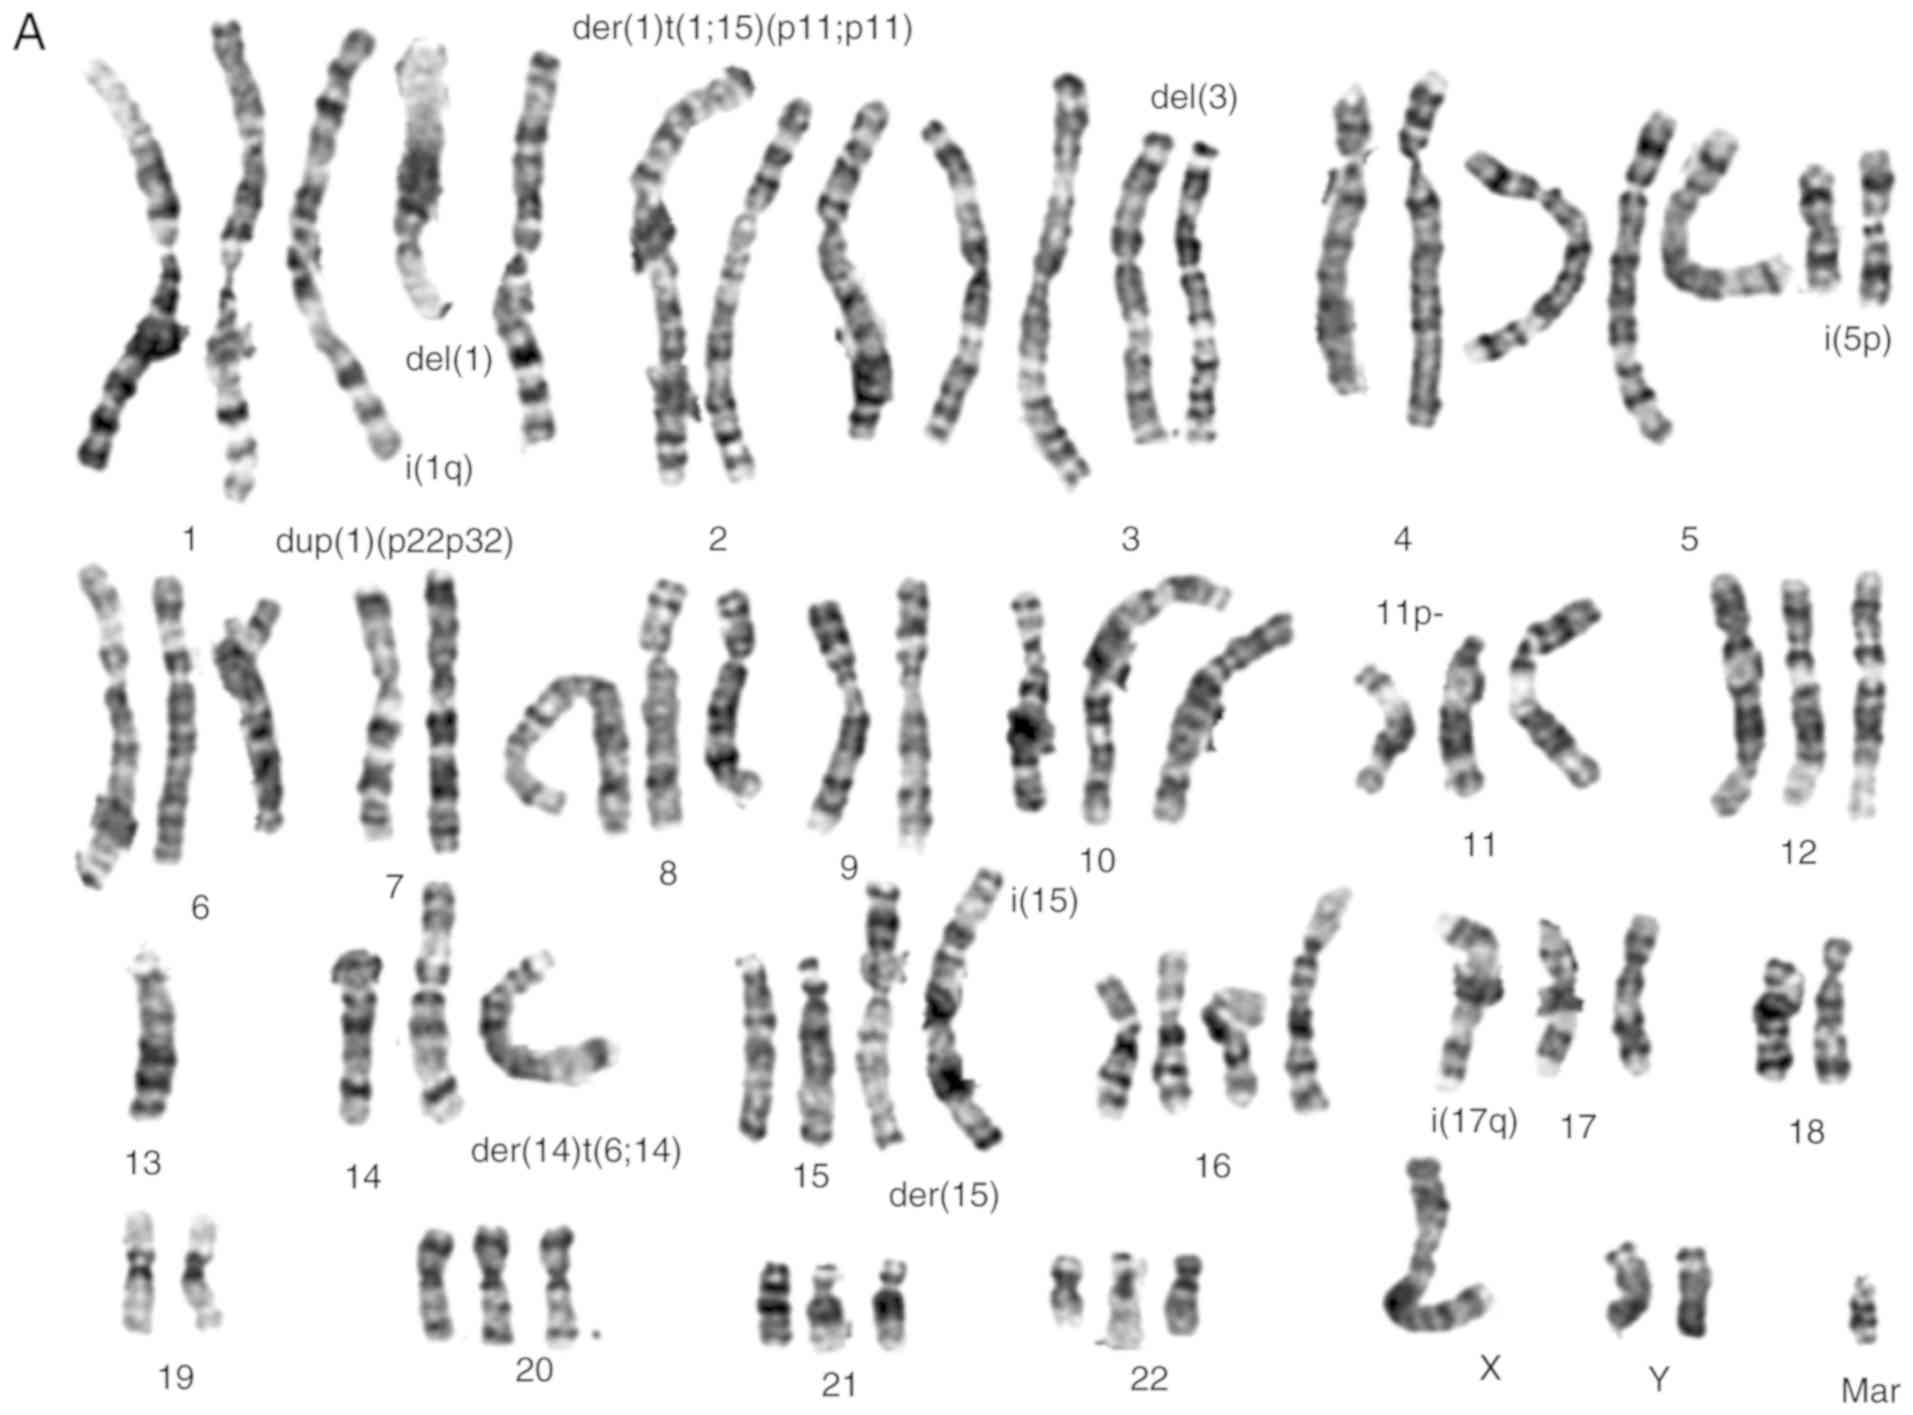
Cytogenetic analysis
Numerical and structural chromosomal abnormalities
(Fig. 3A and B) were found in both
cell lines, that are near-triploid with an average number of 70
chromosomes. Shared numeric alterations in both cell lines were
observed, namely extra chromosomes 1 and 5. Chromosomes 13 and 18
were lost in both cell lines. Structural chromosome alterations
were frequently found, such as gains of material, particularly in
chromosomes 1, 5, 11, 14 and 20 (Table III). Other structural
rearrangements were found in several chromosomes, particularly in
chromosomes 1, 2, 3, 5, 11, 14, 15 and 17 in the TFK-1 cells and in
chromosomes 1, 3, 4, 10, 11 and 14 in the HuCCT1 cells (Fig. 3A and B, respectively). Although
some common rearrangements were observed in both cell lines, as far
as the deletion of short arm of chromosome 3 and the presence of
isochromosome of the short arm of chromosome 5 was concerned, they
also presented differences, namely the presence of isochromosomes
was more frequently found in the TFK-1 cells. There were no major
differences between the cell lines following irradiation, although,
by a microscopic inspection, the mitotic index seems to be
decreased (data not shown). Table
III, presents a summary of the results obtained by karyotyping,
aCGH and MS-MLPA for both cholangiocarcinoma cell lines.
| Table IIIComparisons among the results
obtained by the 3 techniques used in this study for the TFK-1 and
HuCCT1 cell lines. |
Table III
Comparisons among the results
obtained by the 3 techniques used in this study for the TFK-1 and
HuCCT1 cell lines.
| Chr | TFK-1 control
| TFK-1 60 Gy
|
|---|
| Karyotype
alteration | aCGH
| MS-MLPA
| Karyotype
alteration | aCGH
| MS-MLPA
|
|---|
| Gains | CN | Losses | CN | Gains | Losses | Gains | CN | Losses | CN | Gains | Losses |
|---|
| 1 | 1 normal
1 dup(1)(p22p32)
1 i(1)(q11.1)
1 der(1)t(1;15)
(p11;p11)
1 del(1)(q12) | p36.33
p34.1 p12
q21.1 q44 | 4
4
5 | p36.33 p34.1 | 2 | | | 1 normal;
1 dup(1)(p22p32);
1 i(1)(q11.1);
1 der(1)t(1;15)
(p11;p11);
1 del(1)(q12) | p36.33
p34.1 p12
q21.1 q44 | 4
4
5 | p36.33 p34.1 | 2 | | |
| 2 | 2~3
normal
1 del(2)(q21) | p25.3 p14
p11.11
q37.3 | 4
4
4 | q22.1 q31.1 | 2.5
2 | | | 2~3
normal;
1 del(2)(q21) | p25.3-p14
p11.11
q37.3 | 4
4
4 | p22.1
q22.1
q31.1
q33.3 | 2.5
2.5
2
2 | | |
| 3 | 2 nomal
2 del(3)(p14p21) |
p26.3-p21.31
p14.2-p11.1
q11.1-q29 | 4
4
4 | q22.2
p21.31-p14.2 | 2
2 | VHL
(3p25.3) | | 2 nomal;
2 del(3)(p14p21) |
p26.3-p21.31
p14.2-p11.1
q11.1-q29 | 4
4
4 | q22.2
p21.31-p14.2 | 2
2 | VHL
(3p25.3) | |
| 4 | 2 normal | | | p15.2
q11-q33.2 | 2.5
2.5 | | | 2 normal | p16.3
p16.2
p16.1
q25
q35.2 | 4
5
4.5
4
5 | p15.2
p16.3
q11-q33.2 | 2.5
2
2.5 | CASR
(3q13.33 q21.1) | |
| 5 | 1 normal
2 i(5)(p11.1)
1 del(5)(p15) | p15.33
p15.31-p11 | 7
7 |
p15.33-p15.31
p13.2
q34 | 2
1.5
1 | | | 1 normal
2 i(5)(p11.1)
1 del(5)(p15) | p15.33
p15.31-p11 | 7
7 |
p15.33-p15.31
p13.2
q34 | 2
1.5
1 | | |
| 6 | 2 normal
1 del(6)(p25) | | | p25.3
q12-q25.3 | 2
2 | | ESR1
(6q25.1) | 2 normal
1 del(6)(p25) | q23.2 | 4 | p25.3 | 2 | | ESR1
(6q25.1) |
| 7 | 3 normal | p22.3 | 6 | q36.3 | 2 | | | 3 normal | p22.3
q11.1-q11.21
q21.3 | 6
4
4 | q36.3
q21.3 | 2
2 | | |
| 8 | 2 ~ 3 normal |
p23.3-p23.2
q11.1 | 4
4 | p23.1
p11.23
q21.2
q21.3 | 2
2
2
2 | | | 2 ~ 3 normal |
p23.3-p23.2
p11.1
q11.1
q24 | 4
5
4
4 | p23.1
p11.23
q21.2
q21.3 | 2
2
2
2 | | |
| 9 | 2 normal
|
p24.3-p11.2
p21.3
q21.11-q33.2 | 2
0
2 | | | | CDKN2A
(9p21.3) | 2 normal
| | |
p24.3-p11.2
p21.3
q21.11-q33.2 | 2
0
2 | | CDKN2A
(9p21.3) |
| 10 | 3 normal | q11.22
q23.31
q24.32 | 2
2
1.5 | | | | KLLN
(10q23.31) | 3 normal | | | q11.22
q23.31
q24.32 | 2
2
1.5 | | KLLN
(10q23.31) |
| 11 | 1 normal
2 del(11)(p11) | p11.2-p11.12 | 4 | p15.5-p11.2 | 2 | | PAX6
(11p13)
CD44
(11p13)
ATM
(11q22.3)
CADM1
(11q23.3) | 1 normal
2 del(11)(p11) | p11.2-p11.12 | 4 | p15.5-p11.2 | 2 | | PAX6
(11p13)
CD44
(11p13)
ATM
(11q22.3)
CADM1
(11q23.3) |
| 12 | 2 ~3 normal | | | p13.31 | 1 | | | 2 ~3 normal | | | p13.31 | 1 | | |
| 13 | 1 normal | | | q12.11-q34 | 2 | | BRCA2
(13q13.1)
RB1
(13q14.2) | 1 normal | | | q12.11-q34 | 2 | | BRCA2
(13q13.1)
RB1
(13q14.2) |
| 14 | 2 normal
1 der(14)t(6;14)
(p11;q11)
| q12
q13.3-q21.1
q32.33 | 4
4
6 | q11.2-q12 | 2.5 | | | 2 normal
1der(14)t(6;14)
(p11;q11) | q12
q13.3-q21.1
q32.2
q32.33 | 4
4
4
6 | q11.2-q12 | 2.5 | | |
| 15 | 2 normal
1 der(15)t(15;?)(q11;?)
1 i(15)(p11) | q11.2-q26.3 | 6 | | | | | 2 normal
1 der(15)t(15;?)(q11;?)
1 i(15)(p11) | q11.2-q26.3 | 6 | | | | |
| 16 | 3 ~4
normal
|
p13.3-p11.1
q11.2-q24.2 | 4
4 | p13.11
q23.3
q24.2 | 2
2
2 | CDH13
(16q23.3) | | 3 ~4
normal
q11.2-q24.2
| p13.3-p11.1 | 4
4 | p13.11
q23.3
q24.2 | 2
2
2 | CDH13
(16q23.3) | |
| 17 | 2 normal
1
i(17)(q11.1) | q11.1-q25.3 | 4 |
p13.3-p11.2
q11.2 | 2
2 | TP53
(17p12)
PMP22
(17p12) | | 2 normal
1 i(17)(q11.1) | q11.1-q25.3 | 4 |
p13.3-p11.2
q11.2 | 2
2 | TP53
(17p12)
PMP22
(17p12) | |
| 18 | 2 normal | | |
p11.32-p11.21
q11.1-q23 | 2
2 | | | 2 normal | | |
p11.32-p11.21
q11.1-q23 | 2
2 | | |
| 19 | 2~ 3 normal | q11-q13.12 | 4 | p13.3-p12 | 2 | | STK11
(19p13.3) | 2~ 3 normal | q11-q13.12 | 4 | p13.3-p12 | 2 | | STK11
(19p13.3) |
| 20 | 3 normal | q11.21-q13.33 | 4 | p12.1 | 1 | GATA5
(20q13.33) | | 2~ 3 normal | q11.21-q13.33 | 4 | p12.1 | 1 | GATA5
(20q13.33) | |
| 21 | 2 ~3 normal | | | q11.2-q22.3 | 2 | | | 2 normal | | | q11.2-q22.3 | 2 | | |
| 22 | 3 normal | | | q13.2 | 1 | | | 2~ 3 normal | | | q13.2 | 1 | | |
| X | 1 normal | q26.3 | 2 | | | | | 1 normal |
p22.33-p11.1
q11.1-q28 | 1
1 | | | | |
| Y | ~1 normal | | | q11.223-q11.23 | 1 | | | 1 normal | p11.32 | 2 | | | | |
| 1 | 3 normal
1der(1)t(1;6)
(q11.1;p11.1) | q21.1-q44 | 4 | | | | | 2 a 3
normal
1 der(1)t(6;14) | p36,33
p36.13
p33
p31.1
q21.1 q44 | 4
4
4
2
4 | p36.21
q32.1
q32.2 | 2
2
2.5 | | |
| 2 | 3 normal | p11.1
q14.1
q31.1 | 4
4
4 |
q11.2-q12.1
q22.1
q24.2 | 2
2
2 | | MSH6
(2p16.3) | 3 normal | p21
p16.3
p12 p11.2
p11.1
q14.2
q14.3
q14.1
q31.1
q23.3 q24.1 | 4
4
4
4
4
4
4
4
4 | p22.1
q11.2-q12.1
q24.2
q31.1 | 2
2
2
2 | | MSH6
(2p16.3) |
| 3 | 2 normal
1
del(3) | p26.3
p12.3
q11.1-q29 | 4
4
4 | p14.2-p11.1 | 2 | | | 1~2
normal
1~2 del(3) |
p26.3-p25.2
p12.3
q11.1-q29 | 3.5
4
4 | p14.2-p11.1 | 2 | | |
| 4 | 2 normal
1 der(4)t(4;?)
(p16;?) | q25
q34.1
q35.2 | 3.5
5
3.5 |
p16.3-p16.1
q13.2
q34.3 | 2
1
1 | | | 2 normal
1~2 der(4)t(4;?)
(p16;?) | p16.3
p16.2
p16.1
p12
q22.3-q23
q25
q34.1
q35.2 | 4
4
4
4
4
3.5
5
3.5 |
p16.3-p16.1
q13.2
q34.3 | 2
1
1 | | |
| 5 | 4 normal
1 i(5p) |
p15.33-p11
q11.1-q35.3 | 4.5
4 | | | | | 4 normal
1 i(5p) |
p15.33-p11
q11.1-q35.3 | 4.5
4 | | | | |
| 6 | 2 normal | q12 | 4 | p25.3
p21.32
q12-q27 | 2
1
2 | | ESR1
(6q25.1) | 2 normal | p21.1
q11.1-q12
q25.3 | 4
4
4 | p25.3
p21.32
q12-q27 | 2
1
2 | | ESR1
(6q25.1) |
| 7 | 3 normal
1 der(7)t(7;?) |
p22.3-p11.2
q11.21
q21.11-q21.3 | 4
6
5 | | | | | 2~3
normal
1 der(7)t(7?) |
p22.3-p11.2
q11.2-q11.23
q11.21
q21.11-q21.3
q32.3
q36.2 | 4
4
6
5
4
4 | q11.23
q31.2 | 2
2 | | |
| 8 | 3 normal |
p11.23-p11.1
q11.1-q24.3 | 3.5
4 | p23.3-p11.23 | 2.5 | | | 2~3 normal |
p11.23-p11.1
q11.1-q24.3 | 3.5
4 | p23.3-p11.23 | 2.5 | | |
| 9 | 3 normal | p23
p21.3-p21.2 | 4
3.5 | | | PAX5
(9p13.2)
CDKN2A
(9q21.3) | | 2~3 normal |
p24.3-p13.1
q21.31-q21.32
q34.3 | 4
4
3.5 | q34.11 | 2 | PAX5
(9p13.2)
CDKN2A
(9q21.3) | |
| 10 | 2 normal | q21.1
q23.1
q26.11 | 4
4
4 |
p15.3-p11.23
q23.1 | 2
2 | MGMT
(10q26.3) | | 2~3
normal
1~2 del(10)
(p11.2) |
p11.21-p11.1
q11.21-q26.3 | 4
4 |
p15.3-p11.23
q23.1 | 2
2 | MGMT
(10q26.3) | |
| 11 | 3 normal;
2 der(11)t(11;14)
(p14;q22) |
p14.1-p11.12
q11-q25 | 5
5 | q11 | | PAX6
(11p13)
WT1
(11p13)
CD44
(11p13)
CADM1
(11q23.3) | | 2 normal
2der(11)t(11;14)
(p14;q22) |
p14.1-p11.12
p15.5-q11 q25 | 5
4
5 | p15.4
q11 | 2
1 | PAX6
(11p13)
WT1
(11p13)
CD44
(11p13)
CADM1
(11q23.3) | |
| 12 | 3 normal | p13.33-p11.1 | 5 | p13.31 | 1.5 | | | 3 normal |
p13.33-p11.1
q12-q13.12
q14.1
q21.1 | 5
4
4
4 | p13.31 | 1.5 | | |
| 13 | 2 normal | | | q12.11-q34 | 2 | | RB1
(13q14.2) | 1~2 normal | | | q12.11-q34 | 2 | | |
| 14 | 2 normal
1 14p+
1der(14)t(14;7)
(q11.1;q11.1) | q13.1
q22.1-q32.33 | 4
5 | q11.2-q21.1 | 2 | | | 2 normal
1 14p+ 1der(14)t(14;7)
(q11.1;q11.1) | q13.1
q21.1-q21.3
q22.1-q32.33 | 4
4
5 | q11.2-q21.1 | 2 | | |
| 15 | 3 normal
1 der(15) | | | | | | THBS1
(15q14) | 3 normal | | | q26.3 | 4 | | THBS1
(15q14) |
| 16 | 3 normal | | |
p13.3-p11.2
q11.2-q24.3 | 2
2 | | PYCARD
(16p11.2)
CDH13
(16q23.3) | 2 normal | | |
p13.3-p11.2
q11.2-q24.3 | 2
2 | | PYCARD
(16p11.2)
CDH13)
(16q23.3 |
| 17 | 2 normal
1 der(17) |
p11.2-p11.1
q11.1-q25.3 | 4
4 | | | BRCA1
(17q21.31) | TP53
(17p12) | 3 normal |
p11.2-p11.1
p13.1
q11.1-q25.3 | 4
4
4 | p13.12
q22
q23.1 | 2
0.5
2 | BRCA1
(17q21.31) | TP53
(17p12) |
| 18 | 2 normal | | |
p11.32-p11.21
q11.1-q23 | 2
2 | | | 2 normal | q23.3-q24.1 | 4 | p11.32
p11.21
q11.1-q23 | 2
2 | | |
| 19 | 2 normal | p13.11-p12 | 4 | | | | STK11
(19p13.3) | 3 normal |
p13.11-p12
q11
q13.12-q13.13
q13.41-q13.43 | 4
4
4
4 | | | | STK11
(19p13.3) |
| 20 | 3 normal | p13-p11.1
q11.21-q13.33 | 4
4 | GATA5
(20q13.33) | 3 normal | p13-p11.1
q11.21-q13.33 | 4
4 | q11.23 | 2.5 | GATA5
(20q13.33) | | | | |
| 21 | 1 normal | | | | | 2~3 normal | | | | | | | | |
| 22 | 1 normal
2 der(22)t(9;22)
(p21?;q11.1) | | | | | 1 normal
2 der(22)t(9;22)
(p21?;q11.1) | | q11.22-q11.23 | 2.5 | | | | | |
| X | 2 normal |
p22.33-p11.1
q11.1-q25 | 2
2 | | | 2 normal | | p11.23
p22.33-p11.1
q11.1-q28 | 2
2
2.5 | | | | | |
| Y | 1 normal | p11.32-p11
31
p11.2
q11.1-11.21 | 1.5
1.5
1.5 | | | 1~2 normal | | q11.23
p11.32-p11 31
p11.2
q11.1-11.21 | 1.5
1.5
1.5
1.5 | | | | | |
Copy number alterations detected by
aCGH
The whole genomic approach helped establishing
breakpoints, as well as copy number gains and losses in both cell
lines (Table III and Fig. 3C). The loss of entire chromosome
18, 6q and 13q, and the gain of 5p, 1q, 3q, 17q and 20q was
observed in both cell lines (Fig.
3C). Of note, these two cell lines presented some opposite
results, namely the loss of entire chromosome 16 in the HuCCT1
cells and the gain of this chromosome in the TFK-1 cells. Moreover,
the X chromosome presented a loss in the TFK-1 cells and a gain in
the HuCCT1 cells. TFK-1 cells presented specifically loss of entire
4q, 9p, 21q and most of 9q, 11p, 17p and 19p and gain of 15q and
partial gain of 1p, 2p and 3p. The HuCCT1 cells exhibited a loss of
4p, 8p and 10p, and a gain of 5q, 7p, 8q, 11q, 12p, 14q and 20p,
and almost a total gain of the Y chromosome. In both cell lines,
major differences were not observed considering the genomic results
obtained at 60 Gy comparatively to the non-irradiated cells
(Table III). Array-CGH and
cytogenetic analysis results are congruent as described (Table III).
Copy number alterations and methylation
signature based in MS-MLPA
We analyzed 25 genes for methylation signature,
where the ESR1, PAX5, WT1 and CDH13 genes were
methylated in both cell lines without and following irradiation
with 131I (Fig. 3D and
E). TP73 and MGMT gene promoter methylation was
only observed in the TFK-1 cells (Fig.
3D). Following irradiation with 1, 30 and 60 Gy, the TFK-1
cells presented MSH6 gene promoter methylation. The HuCCT1
cells presented MSH6, PAX6, CADM1 and GATA5 gene methylation
without and after all doses of 131I (Fig. 3E).
We observed several copy number alterations in both
cell lines for the 38 genes analyzed. The TFK-1 cells exhibited
less copy number gains than the HuCCT1 cells in these genes
(Fig. 3F and G). In both cell
lines, we did not observe any variation in the copy numbers for
these genes following irradiation. Both cell lines presented copy
number gains in GATA5 (20q) and copy number losses in
ESR1 (6q), RB1 (13q) and TP53 (17p) (Fig. 3F and G). Additionally, the TFK-1
cells exhibited copy number gains in VHL (3p) and
CDH13 (16q). Copy number losses were identified in
KLLN (10q), PAX6 and CD44 (11p), ATM
and CADM1 (11q) and BRCA2 (13q). Homozygous deletion
in CDKN2A (9p) and STK11 (19p) was also found in the
TFK-1 cells (Fig. 3F).
Copy number gains in all doses analyzed in the
HuCCT1 cells were observed in CDKN2A (9p), PAX5 (9p),
MGMT (10q), PAX6, WT1 and CD44 (11p),
CADM1 (11q) and BRCA1 (17q). Copy number losses were
identified in THBS1 (15q), PYCARD (16p), CDH13
(16q) and STK11 (19p) (Fig.
3G).
Considering simultaneous copy number alterations
and methylation status, we verified, in the TFK-1 cells, that
ESR1 gene presented both methylation and copy number loss.
Likewise, CDH13 presented both methylation and copy number
gain. In the HuCCT1 cells, ESR1 and CDH13 presented
both methylation and copy number loss. PAX5, PAX6, WT1,
CADM1 and GATA5 presented both methylation and copy
number gain.
Discussion
CC are epithelial neoplasms that originate from
cholangiocytes and can occur at any region of the biliary system
(1,36). The incidence of CC is increasing
worldwide, being the second most common primary liver malignancy
(1,2,8,36).
Surgical resection is the only potential cure for
CC (8). Only a few patients are
candidates for surgery and the median survival of those with
unresectable disease is only 6-12 months (8). Moreover, radiotherapy and
chemotherapy can be used only as palliative treatments in these
patients (2).
Increasing incidence and the high mortality rate
associated wiht CC leads to urgent investigation and the
development of novel diagnostic and treatment options. Studies have
revealed that human histological samples of CC express NIS at the
membrane (10,37). Liu et al (10) demonstrated that histological
samples obtained from 20 patients with CC exhibited a strong NIS
expression in both the tumor and adjacent non-tumor areas (10). Within bile duct tumor cells, NIS
was located at the plasma membrane in 9 patients, and was likely to
be functional (10). Additionally,
Kim et al (11)
demonstrated that only 1 in 60 samples of intrahepatic CC did not
express NIS, although this transporter was present at membrane
level in only one third of the cases (11). Thus, NIS expression may represent a
therapeutic target for CC, since it allows for hte uptake of iodine
and its isotopes (10,11), allowing the use of metabolic
radiotherapy with 131I, frequently used with success for
thyroid tumors (38,39). In this study, we aimed to evaluate
the potential benefits of metabolic radiotherapy with
131I in extrahepatic (TFK-1) and intrahepatic (HuCCT1)
CC cells, using cholangiocytes as controls.
Ionizing radiation (IR) is an effective and common
therapeutic approach for cancer (25,31,40).
Cancer patients can be treated with radiotherapy alone or in
combination with other treatments approaches, such as surgery or
chemotherapy. Radiotherapy with IR has direct effects, which
targets nuclear DNA, causing damage by direct DNA ionization, and
Indirect effects, which include DNA damage by reactive oxygen
species (ROS) production, mainly through water radiolysis.
131I presents radioactive physical decay half-life of
about 8 days, 81% abundance of 364 keV gamma rays and 89% abundance
beta emission of 606 keV, rendering it suitable for metabolic
radiotherapy. After the CC cells and cholangiocytes were exposed to
131I, we examined how it can potentially be used to
treat CC. A clonogenic assay revealed that the CC cells were more
sensitive to 131I, compared with the cholangiocytes.
According to the Bergonie and Tribondeau law (41), highly proliferative tissues with
high growth rates and metabolic activity are more sensitive to
radiation. Thus, cancer cells are more sensitive to 131I
compared to cholangiocytes. As a metabolic radiotherapy agent,
I31I is uptaken by cells after administration.
Therefore, NIS at the cell membrane can be targeted;
131I may be a metabolic radiotherapy agent for the
treatment of CC. Some studies have suggested the use of
131I in intrahepatic CC, as human samples of this type
of tumor hihly expressed NIS. However, to the best of our knowledge
there are no data available concerning extrahepatic CC human
samples (10). The results of this
study revealed an increasing NIS expression in both the intra- and
extrahepatic cancer cells compared to the cholangiocytes. This fact
demonstrates that 131I may be a modality with a type of
selectivity, leading to a lower NIS expression when comparing the
H69 with the CC cells (Fig. 1).
This suggests great potential for 131I, since NIS
expression is upregulated in various types of cancer, including
liver cancer (12,37). Moreover, NIS can participate in
cell migration and invasion during carcinogenesis (42-46).
As regards gene expression, there was a higher NIS expression in
the TFK-1 cells compared with the HuCCT1 cells. This expression
decreases with increasing doses and increases with time following
exposure. Studies have reported different molecules that influence
NIS expression, such as pregnancy-associated hormones, among others
(47,48). These molecules, when suppressed,
such as the MAP kinase and PI3K/Akt pathways, and HDAC, can induce
an increase in NIS expression. Considering the effects of IR, the
results of clonogenic assay demonstrated that 131I
decreased cell survival. Thus, this assay provides indirect
information about proliferation, differentiation and cell cycle
progression, as PI3K/Akt signaling affects cell growth, survival,
differentiation and proliferation (49).
The findings of this study demonstrated that the CC
cells could uptake 131I. Our results revealed that both
cancer cell lines could uptake 131I, which was higher in
the TFK-1 cells, associated with the existence of NIS expression,
data corroborated by the study of Liu et al (42).
As regards NIS expression, a selectivity for
131I is another explanation for the higher survival rate
of cholangiocytes, compared to the CC cells. The results confirmed
that 131I affected all cell lines, with a higher
expression in the cancer cells. The results obtained by clonogenic
assay corroborated those stated by the Bergonie and Tribondeau law
(41). Cell viability analyses
demonstrated a significant decrease in TFK-1 cell viability, with a
significant increase in the apoptotic cells. As regards the HuCCt1
cells, there were no alterations in cell viability, apart from a
slightly increase in initial cell apoptosis. Cell cycle analysis
revealed that there were no alterations compared with the control,
with most of the cells presenting in the
G0/G1 phase, a quiescent phase.
The molecular mechanisms responsible for
carcinogenesis and tumor progression are poorly characterized in
intrahepatic CC. The management and treatment of this type of
cancer remains a challenge, due to the late diagnosis and lack of
effective treatments, and a lack of promising novel therapeutic
approaches. This can be due to existing data indicating that
intrahepatic CC is a heterogeneous tumor (50). This heterogeneity is sustained on
alterations of inflammatory pathways as the continuous production
of inflammatory cytokines, oxidative stress by the induction of
inducible nitric oxide synthase (iNOS) that leads to oxidative and
nitrosative DNA damage, as well as an increased cell turnover and
inhibition of DNA repair. This type of tumor can be characterized
as a stepwise cancer model, where the accumulation of
inflammatory-mediated genetic and epigenetic alterations can
explain dysplastic lesions that can lead to cancer (51). In this study, cytogenetic, genomic
and methylation approaches revealed several numerical and
structural chromosomal abnormalities and methylated genes in the CC
cells. The TFK-1 cells presented more structural alterations, such
as isochromosomes and specifically exhibited the loss of 4q, 9p,
9q, 11p, 17p, 19p and 21q, and the gain of 1p, 2p, 3p and 15q. The
HuCCT1 cells exhibited the loss of 4p, 8p and 10p, and the gain of
5q, 7p, 8q, 11q, 12p, 14q and 20p, and almost a total gain of the Y
chromosome. This comprehensive characterization of CC cells may
contribute to enriching the resources available for CC research.
However, it is important to continue to describe the possible
effects induced by 131I on cholangiocarcinoma, namely
its influence on oxidative stress, genotoxicity. Moreover, the
influence of NIS gene expression manipulation on the effects of
31I on CC cells, as well as the effects of
131I therapy on animal models remains unclear, and
future studies are warranted to address these issues.
In conclusion, the results of this study revealed
the great significance of NIS expression in the therapeutic
response to 131I. We demonstrated that NIS expression
was higher following the irradiation of the CC cells compared to
cholangiocytes, which indicates that NIS may be a specific
therapeutic target for CC. We demonstrated that 131I
decreased CC cell viability and survival in a cell type- and
dose-dependent manner. The different cellular responses to
treatment may be due to differences in gene expression and
methylation profiles. Thus, it was demonstrated that NIS in may be
crucial for the efficacy of 131I-based therapy.
Supplementary Data
Funding
This study was supported by the Foundation for
Science and Technology (FCT), Portugal (Strategic Projects
UID/NEU/04539/2013 and UID/NEU/04539/2019) and COMPETE-FEDER
(P0CI-01-0145-FEDER-007440), a PhD grant from FCT to RT
(SFRH/BD/116794/2016), a research fellowship 'Bolsa Dr Rocha Alves'
from Liga Portuguesa Contra o Cancro to Ricardo Martins, and a
grant from 'Conselho Nacional de Desenvolvimento Cientffico e
Tecnologico (CNPq, Brazil)' to IB (400988/2016-0).
Availability of data and materials
The datasets used and/or analyzed during the
current study are available from the corresponding author on
reasonable request.
Authors' contributions
The authors AFB, AMA, JBM, IMC, DMJ, JGT and MFB
contributed to the conception, design and follow-up of the work, as
well as to the writing, drafting, revising, editing and reviewing
of the manuscript. The authors ASP, ACR, AF, ML, FC and RM
contributed to the acquisition, analysis, and interpretation of
data for the study related to NIS protein expression, uptake
assays, clonogenic assays, as well as to the writing, drafting,
revising, editing and reviewing of the manuscript. The authors RT,
TP and FC contributed to the acquisition, analysis, and
interpretation of data for the study related to NIS protein
expression, uptake assays, as well as to the writing, drafting,
revising, editing and reviewing of the manuscript. The authors JR
and IPR contributed to the acquisition, analysis and interpretation
of data for the study related to the karyotyping, array CGH and
MS-MLPA assays, as well as to the writing, drafting, revising,
editing and reviewing of the manuscript. ACG and ABSR contributed
to the acquisition, analysis and interpretation of data for the
study related to the flow cytometry assays, as well as to the
writing, drafting, revising, editing and reviewing of the
manuscript. IB, DS and RFF contributed to the acquisition, analysis
and interpretation of data for the study related to mRNA NIS
expression experiment, as well as to the writing, drafting,
revising, editing and reviewing of the manuscript. The authors RT,
ASP and FC also contributed to the statistical analysis of the
results. All the authors approved the final version of the
manuscript to be published and agree to be accountable for all
aspects of this work in ensuring that questions related to the
accuracy or integrity of any part of this work are appropriately
investigated and resolved.
Ethics approval and consent to
participate
The present study was approved by the Ethics in
Research Committee of the Faculty of Medicine of the University of
Coimbra (ref: 033-CE-2015) and written informed consent from the
patients was obtained. All the experiments were performed according
to the regulations of Helsinki Declaration.
Patient consent for publication
Not applicable.
Competing interests
The authors declare that they have no competing
interests.
Abbreviations:
|
NIS
|
natrium-iodide symporter
|
|
131I
|
iodine-131
|
Acknowledgments
Not applicable.
References
|
1
|
Olnes MJ and Erlich R: A review and update
on cholangiocarcinoma. Oncology. 66:167–179. 2004. View Article : Google Scholar : PubMed/NCBI
|
|
2
|
Brito AF, Abrantes AM, Encarnaçâo JC,
Tralhâo JG and Botelho MF: Cholangiocarcinoma: From molecular
biology to treatment. Med Oncol. 32:2452015. View Article : Google Scholar : PubMed/NCBI
|
|
3
|
DeOliveira ML, Cunningham SC, Cameron JL,
Kamangar F, Winter JM, Lillemoe KD, Choti MA, Yeo CJ and Schulick
RD: Cholangiocarcinoma: Thirty-one-year experience with 564
patients at a single institution. Ann Surg. 245:755–762. 2007.
View Article : Google Scholar : PubMed/NCBI
|
|
4
|
Nakeeb A, Pitt HA, Sohn TA, Coleman J,
Abrams RA, Piantadosi S, Hruban RH, Lillemoe KD, Yeo CJ and Cameron
JL: Cholangiocarcinoma: A spectrum of intrahepatic, perihilar, and
distal tumors. Ann Surg. 224:463–475. 1996. View Article : Google Scholar
|
|
5
|
Shaib Y and El-Serag HB: The epidemiology
of cholangiocarcinoma. Semin Liver Dis. 24:115–125. 2004.
View Article : Google Scholar : PubMed/NCBI
|
|
6
|
He XR and Wu XP: Difference in biological
characteristics and sensitivity to chemotherapy and radiotherapy
between intrahepatic and extrahepatic cholangiocarcinoma cells in
vitro. Chin Med Sci J. 23:54–59. 2008. View Article : Google Scholar : PubMed/NCBI
|
|
7
|
Carriaga MT and Henson DE: Liver,
gallbladder, extrahepatic bile ducts, and pancreas. Cancer. 75(1
Suppl): S171–S190. 1995. View Article : Google Scholar
|
|
8
|
Aljiffry M, Walsh MJ and Molinari M:
Advances in diagnosis, treatment and palliation of
cholangiocarcinoma: 1990-2009. World J Gastroenterol. 15:4240–4262.
2009. View Article : Google Scholar : PubMed/NCBI
|
|
9
|
Nathan H, Aloia TA, Vauthey JN, Abdalla
EK, Zhu AX, Schulick RD, Choti MA and Pawlik TM: A proposed staging
system for intrahepatic cholangiocarcinoma. Ann Surg Oncol.
16:14–22. 2009. View Article : Google Scholar
|
|
10
|
Liu B, Hervé J, Bioulac-Sage P, Valogne Y,
Roux J, Yilmaz F, Boisgard R, Guettier C, Calès P, Tavitian B, et
al: Sodium iodide symporter is expressed at the preneoplastic
stages of liver carcinogenesis and in human cholangiocarcinoma.
Gastroenterology. 132:1495–1503. 2007. View Article : Google Scholar : PubMed/NCBI
|
|
11
|
Kim JH, Han SY, Lee SW, Baek YH, Kim HY,
Kim JH, Jeong JS, Roh YH, Kim YH, Park BH, et al: Sodium iodide
symporter and phosphatase and tensin homolog deleted on chromosome
ten expression in cholangiocarcinoma analysis with
clinicopathological parameters. Gut Liver. 6:374–380. 2012.
View Article : Google Scholar : PubMed/NCBI
|
|
12
|
Guerrieri F, Piconese S, Lacoste C,
Schinzari V, Testoni B, Valogne Y, Gerbal-Chaloin S, Samuel D,
Bréchot C, Faivre J and Levrero M: The sodium/iodide symporter NIS
is a transcriptional target of the p53-family members in liver
cancer cells. Cell Death Dis. 4:e8072013. View Article : Google Scholar : PubMed/NCBI
|
|
13
|
Riesco-Eizaguirre G and Santisteban P: A
perspective view of sodium iodide symporter research and its
clinical implications. Eur J Endocrinol. 155:495–512. 2006.
View Article : Google Scholar : PubMed/NCBI
|
|
14
|
Kogai T and Brent GA: The sodium iodide
symporter (NIS): Regulation and approaches to targeting for cancer
therapeutics. Pharmacol Ther. 135:355–370. 2012. View Article : Google Scholar : PubMed/NCBI
|
|
15
|
Dohán O, De la Vieja A, Paroder V, Riedel
C, Artani M, Reed M, Ginter CS and Carrasco N: The sodium/iodide
symporter (NIS): Characterization, regulation, and medical
significance. Endocr Rev. 24:48–77. 2003. View Article : Google Scholar : PubMed/NCBI
|
|
16
|
Lacroix L, Mian C, Caillou B, Talbot M,
Filetti S, Schlumberger M and Bidart JM: Na(+)/I(-) symporter and
Pendred syndrome gene and protein expressions in human
extra-thyroidal tissues. Eur J Endocrinol. 144:297–302. 2001.
View Article : Google Scholar : PubMed/NCBI
|
|
17
|
Spitzweg C, Dutton CM, Castro MR, Bergert
ER, Goellner JR, Heufelder AE and Morris JC: Expression of the
sodium iodide symporter in human kidney. Kidney Int. 59:1013–1023.
2001. View Article : Google Scholar : PubMed/NCBI
|
|
18
|
Wapnir IL, van de Rijn M, Nowels K, Amenta
PS, Walton K, Montgomery K, Greco RS, Dohan O and Carrasco N:
Immunohistochemical profile of the sodium/iodide symporter in
thyroid, breast, and other carcinomas using high density tissue
microarrays and conventional sections. J Clin Endocrinol Metab.
88:1880–1888. 2003. View Article : Google Scholar : PubMed/NCBI
|
|
19
|
Altorjay A, Dohan O, Szilagyi A, Paroder
M, Wapnir IL and Carrasco N: Expression of the Na+/I- symporter
(NIS) is markedly decreased or absent in gastric cancer and
intestinal metaplastic mucosa of Barrett esophagus. BMC Cancer.
7:52007. View Article : Google Scholar : PubMed/NCBI
|
|
20
|
Gaertner FC, Rohde F, Mueller J, Blechert
B, Janssen KP and Essler M: Endogenous expression of the sodium
iodide symporter mediates uptake of iodide in murine models of
colorectal carcinoma. Int J Cancer. 125:2783–2791. 2009. View Article : Google Scholar : PubMed/NCBI
|
|
21
|
Parthasarathy KL and Crawford ES:
Treatment of thyroid carcinoma: Emphasis on high-dose 131 I
outpatient therapy. J Nucl Med Technol. 30:165–175. 2002.
|
|
22
|
Mansi L, Moncayo R, Cuccurullo V,
Dottorini ME and Rambaldi PF: Nuclear medicine in diagnosis,
staging and follow-up of thyroid cancer. Q J Nucl Med Mol Imaging.
48:82–95. 2004.PubMed/NCBI
|
|
23
|
Grubman S, Perrone RD, Lee DW, Murray SL,
Rogers LC, Wolkoff LI, Mulberg AE, Cherington V and Jefferson DM:
Regulation of intracellular pH by immortalized human intrahepatic
biliary epithelial cell lines. Am J Physiol. 266:G1060–G1070.
1994.PubMed/NCBI
|
|
24
|
Hohenester S, Maillette de Buy Wenniger L,
Jefferson DM, Oude Elferink RP and Beuers U: Biliary bicarbonate
secretion constitutes a protective mechanism against bile
acid-induced injury in man. Dig Dis. 29:62–65. 2011. View Article : Google Scholar : PubMed/NCBI
|
|
25
|
Gomes AR, Abrantes AM, Brito AF, Laranjo
M, Casalta-Lopes JE, Gonçalves AC, Sarmento-Ribeiro AB, Botelho MF
and Tralhäo JG: Influence of P53 on the radiotherapy response of
hepatocellular carcinoma. Clin Mol Hepatol. 21:257–267. 2015.
View Article : Google Scholar : PubMed/NCBI
|
|
26
|
Abrantes AM, Serra ME, Gonçalves AC, Rio
J, Oliveiros B, Laranjo M, Rocha-Gonsalves AM, Sarmento-Ribeiro AB
and Botelho MF: Hypoxia-induced redox alterations and their
correlation with 99mTc-MIBI and 99mTc-HL-91 uptake in colon cancer
cells. Nucl Med Biol. 37:125–132. 2010. View Article : Google Scholar : PubMed/NCBI
|
|
27
|
Brito AF, Abrantes AM, Ribeiro M, Oliveira
R, Casalta-Lopes J, Gonçalves AC, Sarmento-Ribeiro AB, Tralhäo JG
and Botelho MF: Fluorine-18 fluorodeoxyglucose uptake in
hepatocellular carcinoma: Correlation with glucose transporters and
p53 expression. J Clin Exp Hepatol. 5:183–189. 2015. View Article : Google Scholar : PubMed/NCBI
|
|
28
|
Levenberg K: A method for the solution of
certain non-linear problems in least squares. Quartly of Applied
Mathematics. 2:164–168. 1944. View Article : Google Scholar
|
|
29
|
Marquardt DW: An algorithm for
least-squares estimation of non-linear parameters. J Soc Industrial
Appl Mathematics. 11:431–441. 1963. View Article : Google Scholar
|
|
30
|
Kuchar M, Oliveira MC, Gano L, Santos I
and Kniess T: Radioiodinated sunitinib as a potential radiotracer
for imaging angiogenesis-radiosynthesis and first
radiopharmacological evaluation of 5-[125I]Iodo-sunitinib. Bioorg
Med Chem Lett. 22:2850–2855. 2012. View Article : Google Scholar : PubMed/NCBI
|
|
31
|
Mendes F, Sales T, Domingues C, Schugk S,
Abrantes AM, Gonçalves AC, Teixo R, Silva R, Casalta-Lopes J, Rocha
C, et al: Effects of X-radiation on lung cancer cells: The
interplay between oxidative stress and P53 levels. Med Oncol.
32:2662015. View Article : Google Scholar : PubMed/NCBI
|
|
32
|
Schmittgen TD and Livak KJ: Analyzing
real-time PCR data by the comparative CT method. Nat Protoc.
3:1101–1108. 2008. View Article : Google Scholar
|
|
33
|
Ribeiro IP, Rodrigues JM, Mascarenhas A,
Kosyakova N, Caramelo F, Liehr T, Melo JB and Carreira IM:
Cytogenetic, genomic, and epigenetic characterization of the HSC-3
tongue cell line with lymph node metastasis. J Oral Sci. 60:70–81.
2018. View Article : Google Scholar : PubMed/NCBI
|
|
34
|
Ribeiro IP, Caramelo F, Esteves L, Menoita
J, Marques F, Barroso L, Miguéis J, Melo JB and Carreira IM:
Genomic predictive model for recurrence and metastasis development
in head and neck squamous cell carcinoma patients. Sci Rep.
7:138972017. View Article : Google Scholar : PubMed/NCBI
|
|
35
|
Ribeiro IP, Caramelo F, Marques F,
Domingues A, Mesquita M, Barroso L, Prazeres H, Juliäo MJ, Baptista
IP, Ferreira A, et al: WT1, MSH6, GATA5 and PAX5 as epigenetic oral
squamous cell carcinoma biomarkers-a short report. Cell Oncol
(Dordr). 39:575–582. 2016.
|
|
36
|
Malhi H and Gores GJ: Review article: The
modern diagnosis and therapy of cholangiocarcinoma. Aliment
Pharmacol Ther. 23:1287–1296. 2006. View Article : Google Scholar : PubMed/NCBI
|
|
37
|
Micali S, Bulotta S, Puppin C, Territo A,
Navarra M, Bianchi G, Damante G, Filetti S and Russo D: Sodium
iodide symporter (NIS) in extrathyroidal malignancies: Focus on
breast and urological cancer. BMC Cancer. 14:3302014. View Article : Google Scholar
|
|
38
|
Chen L, Altmann A, Mier W, Eskerski H,
Leotta K, Guo L, Zhu R and Haberkorn U: Radioiodine therapy of
hepatoma using targeted transfer of the human sodium/iodide
symporter gene. J Nucl Med. 47:854–862. 2006.PubMed/NCBI
|
|
39
|
Verburg FA, Brans B and Mottaghy FM:
Molecular nuclear therapies for thyroid carcinoma. Methods.
55:230–237. 2011. View Article : Google Scholar : PubMed/NCBI
|
|
40
|
Marques IA, Neves AR, Abrantes AM, Pires
AS, Tavares-da-Silva E, Figueiredo A and Botelho MF: Targeted alpha
therapy using Radium-223: From physics to biological effects.
Cancer Treat Rev. 68:47–54. 2018. View Article : Google Scholar : PubMed/NCBI
|
|
41
|
Haber AH and Rothstein BE:
Radiosensitivity and rate of cell division: 'Law of bergonié and
tribondeau'. Science. 163:1338–1339. 1969. View Article : Google Scholar : PubMed/NCBI
|
|
42
|
Liu L, Li D, Chen Z, Yang J, Ma Y, Cai H,
Shan C, Lv Z and Zhang X: Wild-Type P53 induces sodium/iodide
symporter expression allowing radioiodide therapy in anaplastic
thyroid cancer. Cell Physiol Biochem. 43:905–914. 2017. View Article : Google Scholar : PubMed/NCBI
|
|
43
|
Moon DH, Lee SJ, Park KY, Park KK, Ahn SH,
Pai MS, Chang H, Lee HK and Ahn IM: Correlation between
99mTc-pertechnetate uptakes and expressions of human sodium iodide
symporter gene in breast tumor tissues. Nucl Med Biol. 28:829–834.
2001. View Article : Google Scholar : PubMed/NCBI
|
|
44
|
Cianfarani F, Baldini E, Cavalli A,
Marchioni E, Lembo L, Teson M, Persechino S, Zambruno G, Ulisse S,
Odorisio T and D'Armiento M: TSH receptor and thyroid-specific gene
expression in human skin. J Invest Dermatol. 130:93–101. 2010.
View Article : Google Scholar
|
|
45
|
Damle AA, Narkar AA and Badwe RA:
Radioiodide uptake and sodium iodide symporter expression in breast
carcinoma. Indian J Exp Biol. 49:416–422. 2011.PubMed/NCBI
|
|
46
|
Lacoste C, Hervé J, Bou Nader M, Dos
Santos A, Moniaux N, Valogne Y, Montjean R, Dorseuil O, Samuel D,
Cassio D, et al: Iodide transporter NIS regulates cancer cell
motility and invasiveness by interacting with the rho guanine
nucleotide exchange factor LARG. Cancer Res. 72:5505–5515. 2012.
View Article : Google Scholar : PubMed/NCBI
|
|
47
|
Alotaibi H, Tuzlakoglu-Oztürk M and
Tazebay UH: The thyroid Na+/I− symporter: Molecular
characterization and genomic regulation. Mol Imaging Radionucl
Ther. 26(Suppl 1): S92–S101. 2017. View Article : Google Scholar
|
|
48
|
Lindenthal S, Lecat-Guillet N, Ondo-Mendez
A, Ambroise Y, Rousseau B and Pourcher T: Characterization of
small-molecule inhibitors of the sodium iodide symporter. J
Endocrinol. 200:357–365. 2009. View Article : Google Scholar
|
|
49
|
Khan KH, Yap TA, Yan L and Cunningham D:
Targeting the PI3K-AKT-mTOR signaling network in cancer. Chin J
Cancer. 32:253–265. 2013. View Article : Google Scholar : PubMed/NCBI
|
|
50
|
Liau JY, Tsai JH, Yuan RH, Chang CN, Lee
HJ and Jeng YM: Morphological subclassification of intrahepatic
cholangiocarcinoma: Etiological, clinicopathological and molecular
features. Mod Pathol. 27:1163–1173. 2014. View Article : Google Scholar : PubMed/NCBI
|
|
51
|
Kumar M, Zhao X and Wang XW: Molecular
carcinogenesis of hepatocellular carcinoma and intrahepatic
cholangiocarcinoma: One step closer to personalized medicine? Cell
Biosci. 1:52011. View Article : Google Scholar : PubMed/NCBI
|