Introduction
Previous studies focusing on mouse tumor models and
cancer patients have revealed that tumor cells are able through
various mechanisms to enhance the growth of myeloids and thus the
development of leukocytosis, which is a sign of tumor formation, as
well as inhibit the differentiation of myeloids and induce the
natural change of these cells and the accumulation of immature
myeloids (1,2). This finding demonstrated the
long-recognized correlation between tumors and leukocytosis. The
neoplastic proliferation of myeloids is an indication of tumor
formation; however, the increased immature myeloids may induce the
development of the host’s anti-tumor immune suppression and the
growth of tumor blood vessels (3).
Thus, tumor-related myeloid proliferation suggests a new treatment
target is required in tumor therapy. The identification of immature
granulocytes (IG) provides a more sensitive indicator for the
tumor-related myeloid proliferation compared with white blood cell
counting, the increase of granulocytes, the increase of monocytes
or the decrease of lymphopenias and it realizes the early detection
of tumor-related myeloid proliferation. Although not every cancer
patient has an increased IG level, the IG parameter values in the
diagnosis of tumors demonstrated that the most common routine blood
examinations are fully utilized for the screening of tumor patients
at the early stage or the preliminary and auxiliary discriminant
stage of benign and malignant tumors.
The results obtained by the two methods were
compared and the reliability of IG measurement using the hematology
analyzer was assessed. Additionally, IG parameters of 120 venous
blood specimens collected from cancer patients who received
chemotherapy were measured by cell counting using a hematology
analyzer and stained blood smears were observed under a
microscope.
Materials and methods
Samples
Blood specimens were obtained for routine blood
examination from chemotherapy patients presenting at the Cancer
Hospital, Chinese Academy of Medical Sciences and Peking Union
Medical College. Blood was collected (2 ml) in vials under vacuum,
EDTA K3 was added to the vials and then they were gently agitated
to prevent clotting. In total, 35 venous blood specimens from
healthy subjects were used as the control group.
Measurement methods
The specimens were measured using the Celltac Es
hematology analyzer (Nihon Kohden Corp, Tokyo, Japan) and the
amounts of specimens to be measured were determined depending on
the identified IG values. After the smears were prepared and
stained using the Wright-Giemsa dye, they were observed under a
microscope. The specimens were treated within 4 h. Two treated
smears were provided to two qualified laboratory physicians to
classify the cells manually, in which 200 cells were observed under
a high-power microscope and the percentage of white blood cells in
different development stages was recorded. The classification
procedure was single-blinded, and the average amount of cells in
each different development stage between the two physicians were
considered as the final results. Positive cut-off criteria by
microscopy observation for the late promyelocytic stage or earlier
were: blasts >1%, the variant LY>5% and nucleated red blood
cells (NRBC) >1% in white blood cell counting. If the
observation showed that the primitive cells, early and middle
promyelocytic cells, or late promyelocytic cells were ≥1%,
respectively, a positive result was noted.
At the same time, the IG percentage was determined
in accordance with the server parameters provided by the hematology
analyzer.
Scoring
If the result was negative in both the hematology
analyzer measurement and the microscopic observation, it was
considered ‘true negative’; if the result was positive using the
two methods, it was considered ‘true positive’; if the result
obtained from the hematology analyzer measurement was negative but
positive in the microscopic observation, it was ‘false negative’.
The true-positive rate was calculated using the formula: ‘true
positive’/(‘true positive’ + ‘false negative’) × 100%.
Statistical analysis
The correlation of results obtained from the
hematology analyzer and the microscopic observation were analyzed
using the Spearman test and any difference between the two methods
was observed using the signed-rank test.
Results
The quality control groups at the three
concentration levels were repeatedly determined within 20 days to
observe the within-run precision (Table I). The detection sensitivity of the
automated instrumentation was 95%, the specificity was 78%, the
positive predictive value was 76.1% and the negative predictive
value was 99%. For the microscopic observation method, IG as a
percentage was calculated as: early promyelocytic rate + middle
promyelocytic rate + late promyelocytic rate. The total counting
results of each channel were presented as the server parameters of
IMI TOTAL and DIFF TOTAL. Thus, the ratio of the two results may
reflect the IG percentage. The true-positive rate was identified as
76.1% (67/88) in solid tumor, that of leukemia was 87.5% (28/32),
while the false-positive rate in inpatients as compared to
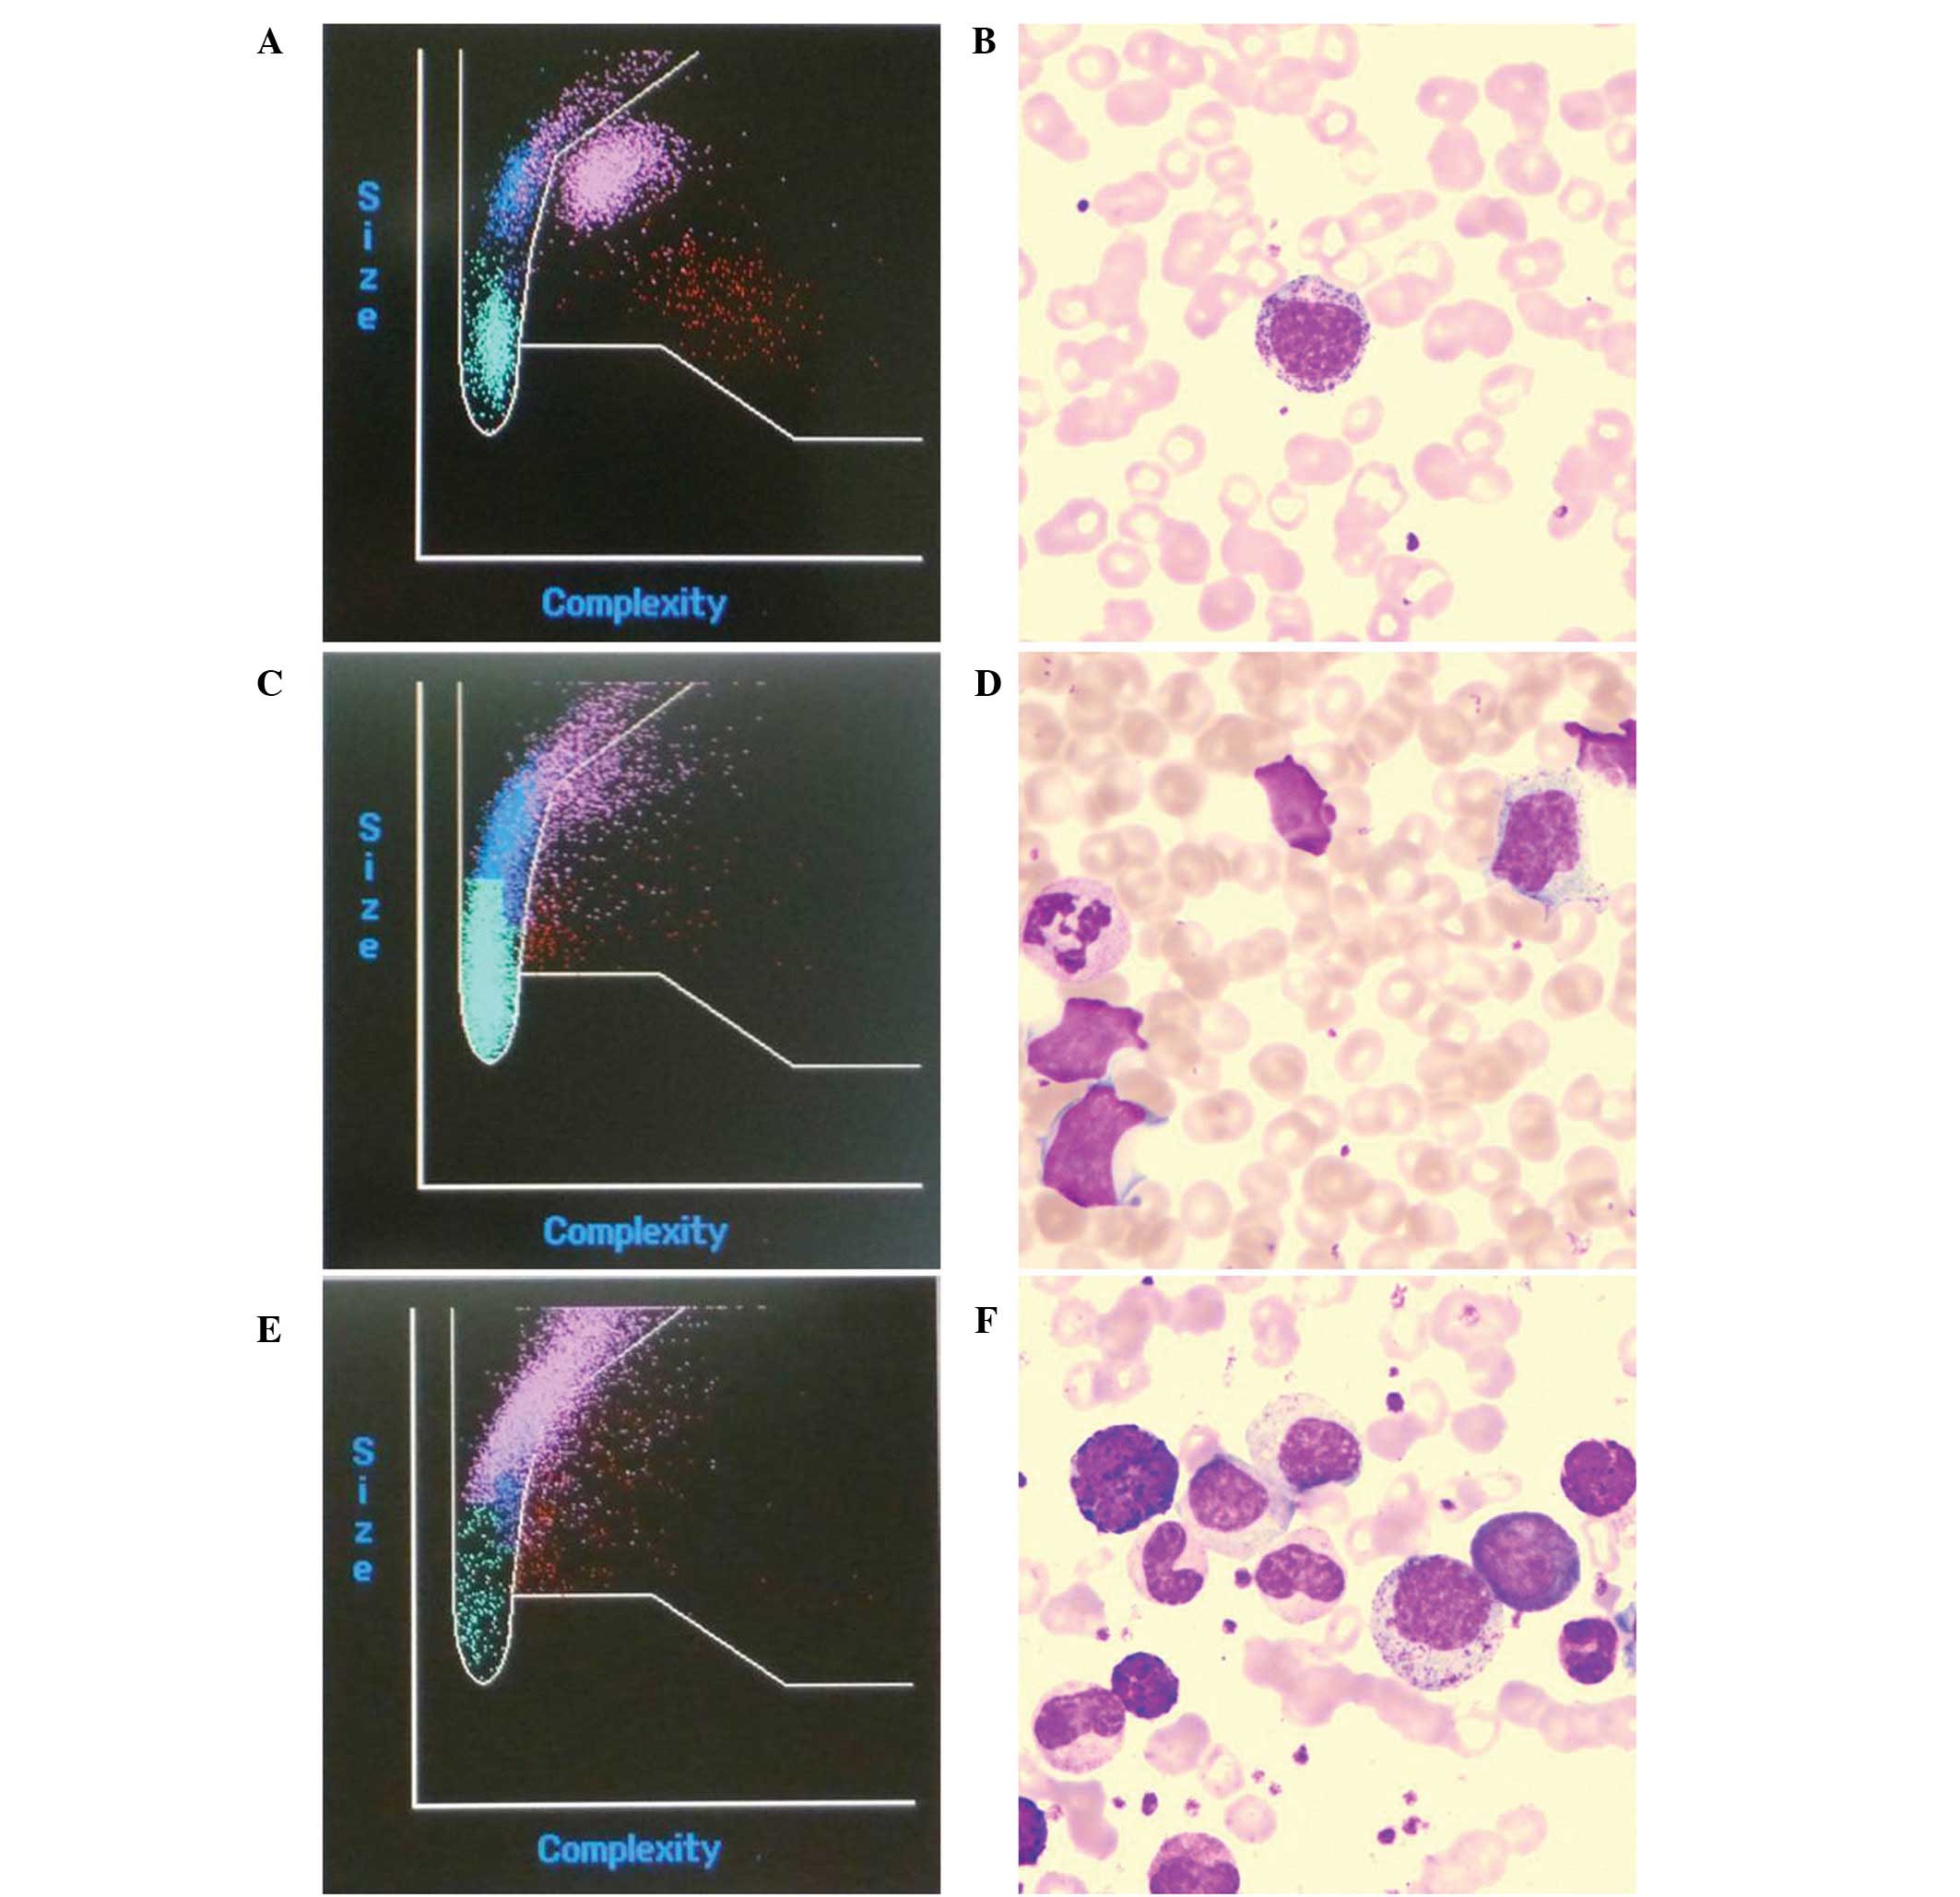
outpatients in solid tumor was 14.7 vs. 9.1%. The majority of IGs
in the IMI scatter plot coincided with microscopic examination of
blood smears (Fig. 1A and B). The
results showed that the instrument was inadequate to identify the
myeloblasts and atypical lymphocytes (Fig. 1C and D), while the IG parameter of
chronic myelogenous leukemia cells was closely associated with the
positive rate in the microscopic examinations (Fig. 1E and F).
 | Table IWithin-run precision. |
Table I
Within-run precision.
| Variables | High level | Middle level | Low level |
|---|
| WBC (G/l) | 20.60±0.16 | 7.69±0.06 | 1.89±0.03 |
| RBC (T/l) | 5.69±0.02 | 4.58±0.04 | 2.29±0.01 |
| HGB (g/l) | 185.70±0.82 | 137.10±0.88 | 59.10±0.32 |
| HCT (l/l) | 55.13±0.25 | 40.57±0.39 | 17.82±0.11 |
| MCV (fl) | 96.89±0.41 | 88.65±0.23 | 77.89±0.26 |
| MCH (pg) | 32.64±0.13 | 29.96±0.35 | 25.85±0.16 |
| MCHC (g/l) | 336.90±1.79 | 338.00±4.06 | 331.50±2.22 |
| PLT (G/l) | 500.10±12.61 | 251.30±7.79 | 66.20±2.49 |
The IG percentage was (6.981±11.1853) vs.
(9.36±20.710)% in the hematology analyzer measurement and the
microscopic observation, respectively. The correlation analysis
revealed that there was an excellent correlation between the two
methods with r=0.1364 and P=0.012 (Fig. 2). A significant difference between
the two methods was observed using the signed-rank test (z=−3.236,
P=0.001) and the results obtained from the hematology analyzer were
higher than those obtained from the microscopic observation.
The IG results obtained from the hematology analyzer
of 94 specimens were divided into 3 groups: Group A, IG≤1.00%;
group B, 1.00%<IG≤10.00%; group C, IG>10.00%. In the
microscopic observation, IG>0.5% was considered a positive
result. The results showed that a false-positive result was
obtained in the hematology analyzer measurement (Table II). There was an increase of
neutrophils in 54.90% of false-positive specimens, atypical
lymphocytes in 23.59%, monocytes in 11.77%, and eosinophils and
basophils in 9.80%, respectively.
| Table IIPositive results of microscopic
observation corresponding to each group of immature
granulocytes.a |
Table II
Positive results of microscopic
observation corresponding to each group of immature
granulocytes.a
| Group | Positive % in smear
(n; %) |
|---|
| A (n=26) | 3 (11.5) |
| B (n=78) | 51 (65.4) |
| C (n=20) | 19 (95.0) |
Discussion
The performance verification and quality control of
the IG parameters were carried out by comparing the results
obtained from the microscopic observation and the automated
instrumentation. Previously, it was shown that the most common
causes for individuals >10 years were hematologic malignancies,
chemotherapy and severe infections (4). The detection sensitivity of the
automated instrumentation was 95%, the specificity was 78%, the
positive predictive value was 76.1% and the negative predictive
value was 99%. The number of IG and the immature myeloid
information were significantly elevated in neonates with
early-onset sepsis compared to controls. IG and immature myeloid
information are considered useful adjunctive methods in the
diagnosis of neonatal early-onset sepsis (5). IG, which may be used for screening
for bacteremia, with higher values of IGC>0.3 amd IG (%) >3
exhibiting a specificity of >90% (6). Thus, an IG parameter at its normal
level is a reliable indicator for excluding abnormal myeloids.
However, for a false-positive IG parameter, the microscopic
observation is required to exclude or confirm the result.
Results of the present study have demonstrated that
the percentage required to obtain a false-positive result in NRBC
was relatively increased, and it may have been caused by the
influence of cell debris, platelet aggregation and small
lymphocytes. The coincidence rate for the alarm of blasts between
the automated instrumentation method and the manual microscopic
observation method was as high as 62%, which specifically reflects
the existence of blasts in the peripheral blood of patients.
Thirty-five specimens, not alarmed in the automated
instrumentation, were re-examined by microscopy and none of these
specimens were reported to be positive. Of the 21 patients whose
blood specimens were alarmed with blasts and reported to be
positive in the microscopic examination, 10 cases were undergoing
chemotherapy treatment and their illnesses were being partly or
completely relieved with WBC<1.0×10⁹/l. In this case,
the microscopic examination was prone to miss the positive result,
however, the automated measurement was able to examine >10,000
cells. Thus, the hematology analyzer is more sensitive than the
manual detection in the identification of blasts.
Of the 49 patients whose blood specimen examination
yielded an IG alarm, 18 cases were leukemia patients who were
administered with G-CSF subsequent to chemotherapy treatment. These
patients were suffering from myelofibrosis with a WBC level
>10.0×10⁹/l and a neutrophil level >80%. Toxic
changes and degenerative changes were observed in the granulocytes
of these patients, which may be a significant reason for the
false-positive results in the automated measurement. Blood counts
and peripheral smear findings may provide insight into the
likelihood of a clonal etiology (7).
In general, if no alarm is utilized in the
examination using a CelltacES hematology analyzer and there is no
special clinical requirement, there is no need for manual
detection. If there is an abnormal alarm or the clinical physician
requires one, a manual microscopic examination is a requirement.
The reason for a higher false-positive rate in inpatients over
outpatients may be explained by the fact that the drugs affect the
morphology and structure of the leukocytes yielding incorrect
results by the instrument. For cancer patients undergoing
radiotherapy or chemotherapy, the false alarm is more significant
in their routine blood examination. The alarm signal administered
to the leukemia patients was identical to the manual microscopic
observation results, which proved that the CelltacEs has a relative
higher reliability in the screening of leukemia. However, in the
case of the negative results of the IG alarm, the possibility of IG
should not be excluded. The experiment showed that the instrument
was inadequate to identify the myeloblasts in Fig. 1D, while the IG parameter of chronic
myelogenous leukemia cells was closely connected with the positive
rate in the microscopic examinations (Fig. 1F).
Quantitative IG analysis of peripheral blood is one
of the directions in the development of the blood cell analyzer,
and it is an effective solution in overcoming the time-consuming
and laborious shortcomings of smear microscopy. IG measurement has
been suggested as a more readily available indicator of the
presence of granulocyte precursors (left shift) (8). However, due to the constant
alterations in the morphology of blood cells, the hematology
analyzer cannot replace the morphological observation of the
smears. It is recommended by the International Society for
Laboratory Hematology (ISLH). The ISLH has been instrumental in
standards and guidelines development in laboratory hematology and
has also expanded its repertoire of disciplines to cater for the
growing needs of laboratory hematologists by an international
group. ISLH has stipulated that the advantages of both the
microscopic examination and instrument measurement should be
combined and the number of smears for microscopic observation
should be reduced as much as possible based on the premise of
ensuring the quality of results of the instrumental analysis. The
IG percentage is primarily known through instrument analysis and a
targeted smear observation helps to improve the reliability of the
results obtained in the blood assay.
In conclusion, the information provided by the
original instrument detection parameters can be used to determine
the IG percentage primarily and provide a basis for additional
examination. If there is a false-positive result, the microscopic
examination should not be omitted. For clinically suspicious
specimens particularly those of IG≥1%, the microscopic examination
should be actively performed to prevent misdiagnosis.
Acknowledgements
Supported by a grant from the National Natural
Science Foundation of China (81000977).
References
|
1
|
Mantovani A, Allavena P, Sica A and
Balkwill F: Cancer-related inflammation. Nature. 454:436–444. 2008.
View Article : Google Scholar
|
|
2
|
Nozawa H, Chiu C and Hanahan D:
Infiltrating neutrophils mediate the initial angiogenic switch in a
mouse model of multistage carcinogenesis. Proc Natl Acad Sci USA.
103:12493–12498. 2006. View Article : Google Scholar : PubMed/NCBI
|
|
3
|
Wilcox RA: Cancer-associated
myeloproliferation: old association, new therapeutic target. Mayo
Clin Proc. 85:656–663. 2010. View Article : Google Scholar : PubMed/NCBI
|
|
4
|
Roehrl MH, Lantz D, Sylvester C and Wang
JY: Age-dependent reference ranges for automated assessment of
immature granulocytes and clinical significance in an outpatient
setting. Arch Pathol Lab Med. 135:471–477. 2011.PubMed/NCBI
|
|
5
|
Cimenti C, Erwa W, Herkner KR, Kasper DC,
Müller W and Resch B: The predictive value of immature granulocyte
count and immature myeloid information in the diagnosis of neonatal
sepsis. Clin Chem Lab Med. 50:1429–1432. 2012. View Article : Google Scholar : PubMed/NCBI
|
|
6
|
Senthilnayagam B, Kumar T, Sukumaran J, MJ
and Rao KR: Automated measurement of immature granulocytes:
performance characteristics and utility in routine clinical
practice. Pathol Res Int. 2012:4836702012. View Article : Google Scholar : PubMed/NCBI
|
|
7
|
Devitt KA, Lunde JH and Lewis MR: New
onset pancytopenia in adults: a review of underlying pathologies
and their associated clinical and laboratory findings. Leuk
Lymphoma. Aug 20–2013.(Epub ahead of print).
|
|
8
|
Bernstein LH and Rucinski J: Measurement
of granulocyte maturation may improve the early diagnosis of the
septic state. Clin Chem Lab Med. 49:2089–2095. 2011. View Article : Google Scholar : PubMed/NCBI
|