Introduction
Primary central nervous system lymphoma (PCNSL) is
an aggressive form of non-Hodgkin lymphoma and its incidence has
significantly increased among immunocompetent patients over the
last few years (1). It was
previously reported that positron emission tomography (PET) with
either [18F] 2-fluoro-2-deoxy-D-glucose (FDG) (2,3) or
L-(methyl-11C)-methionine (MET) (4) commonly reveals a significant
accumulation of tracers in PCNSL tissues and may be useful for the
diagnosis and assessment of therapeutic response in PCNSL cases.
However, the mechanisms underlying the uptake of these tracers in
PCNSL have not been clearly determined. Warburg demonstrated that
cancer cells exhibit higher rates of glycolysis compared to normal
cells, which has been applied to FDG-PET imaging (5). Significantly elevated glucose
transporter (GLUT)1 and GLUT3 expression levels are considered to
be responsible for the accumulation of FDG in malignant tumors
(6–9). Furthermore, hexokinases are involved
in glucose metabolism and the expression of these proteins may be
correlated with FDG uptake and is useful for PET scanning. System L
is a major transport system involed in the cellular uptake of
neutral amino acids. Among system L transporters, L-type amino acid
transporter 1 (LAT1) is a cancer cell-type transporter, which is
highly upregulated in malignant tumors and its expression is
associated with a poor prognosis (10,11).
The present study aimed to investigate the mRNA levels of GLUT1,
GLUT3 and LAT1 in resected PCNSL specimens, in order to identify
whether these transporters are associated with the increased uptake
of FDG and MET observed in PET studies.
Patients and methods
Patients
Between December, 2008 and December, 2012, 13
patients were newly diagnosed with PCNSL (diffuse large B-cell
type) at the Hokuto Hospital (Obihiro, Japan). Among these, 7
patients (5 men and 2 women) whose resected tumor samples were
adequate for RNA extraction were included in this retrospective
study (Table I). The laboratory
examinations were negative for acquired immunodeficiency syndromes
in all the patients. FDG-PET and MET-PET were performed on the same
day prior to resection. None of the patients received steroid
therapy prior to resection.
 | Table ICharacteristics of patients with
primary central nervous system lymphoma. |
Table I
Characteristics of patients with
primary central nervous system lymphoma.
| Cases | Age, years | Gender | MET SUVmax | FDG SUVmax | Volume, ml | Survival, months |
|---|
| 1 | 60 | Male | 2.2 | 13.9 | 6.3 | 48 (Alive) |
| 2 | 79 | Male | 2.5 | 13.0 | 7.9 | 9 (Deceased) |
| 3 | 70 | Female | 2.7 | 12.4 | 1.5 | 2 (Deceased) |
| 4 | 80 | Male | 5.5 | 19.9 | 21.8 | 24 (Alive) |
| 5 | 78 | Female | 6.9 | 22.4 | 6.5 | 3 (Deceased) |
| 6 | 83 | Male | 6.6 | 17.0 | 6.1 | 9 (Alive) |
| 7 | 78 | Male | 4.9 | 13.7 | 13.7 | 1 (Deceased) |
Methods
PET imaging
PET was performed using the Discovery ST Elite (GE
Healthcare Japan Co. Ltd., Tokyo, Japan). This imaging system
enabled simultaneous acquisition of 47 transverse slices per field
of view (FOV), with an intersection spacing of 3.27 mm, for a total
axial FOV of 15.7 cm. The in-plane (transverse) reconstruction
resolution was 5.2 mm full-width at half-maximum in the brain FOV.
Each patient received an intravenous injection of FDG (mean dose,
84.7±5 MBq; range, 172–200 MBq) and MET (mean dose, 416±25 MBq;
range, 375–459 MBq). The serum glucose levels were measured prior
to the injection and were found to be within normal limits. The
patients remained in the supine position in a resting room with low
ambient light and room noise and were instructed not to move or
speak. After 45–60 min of FDG-PET or 20 min of MET-PET, the
transmission images of the brain underwent computed tomography (CT)
attenuation correction (120 kV, 30 mA, 0.8-sec scan) and regional
emission images were then obtained for 7 min. All the images were
acquired with the patients in the supine position, resting, with
their eyes closed. The uptake of FDG and MET into brain lesions was
semiquantitatively assessed by determining the standardized uptake
value (SUV; activity concentration/injected dose/body weight). A
region of interest was set manually by an observer around the
hottest area of each lesion or its center located by magnetic
resonance imaging (MRI). The maximal value of SUV (SUVmax) was
considered to be the representative value for each tumor.
RNA extraction, reverse
transcription-polymerase chain reaction (PCR) and quantitative
(q)PCR
Formalin-fixed paraffin-embedded sections were
deparaffinized. For the preparation of total RNA from tumors, the
MasterPure™ RNA Purification kit (Epicentre, Madison, WI, USA) was
used according to the manufacturer’s instructions. cDNA was
synthesized from total RNA using the High Capacity cDNA Reverse
Transcription kit (Applied Biosystems, Foster City, CA, USA). The
cDNA (50–60 ng) was used for qPCR analyses via TaqMan Gene
Expression assays for GLUT1 (Hs00892681_m1), GLUT3 (Hs00359840_m1)
and LAT1 (Hs00185826_m1). The PCRs were conducted using the Applied
Biosystems 7900HT Fast Real-Time PCR system. Ribosomal RNA
(Hs99999901_s1) served as the reference gene. The relative
quantification (RQ) method was applied to determine gene expression
levels. Values of RQ within the range (RQ±2SD) of the corresponding
reference group were accepted as normal. Threshold cycle
(Ct) values were automatically calculated for each
replicate and used to determine the expression of the gene of
interest relative to that of the reference gene for treated and
untreated samples using the 2−ΔΔCt method.
Immunohistochemistry for CD34 and
evaluation of microvessel density (MVD)
The formalin-fixed paraffin-embedded tissue samples
were serially sliced into 3-μm sections. Antigen epitopes were
heat-retrieved in ImmunoSaver™ (Nissin EM Ltd., Tokyo, Japan) at
90°C for 45 min. The samples were then incubated with CD34
monoclonal antibody (dilution, 1:100; Nichirei Bioscience Inc.,
Tokyo, Japan) for 1 h at room temperature. The primary antibody was
diluted using 0.05% Tween-TBS. Incubation with the
peroxidase-conjugated anti-mouse IgG secondary antibody was
performed for 1 h at room temperature using Histofine®
Simple Stain MAX PO (Nissin EM Ltd.). The peroxidase activity was
visualized using a Histofine DAB substrate kit (Nichirei Bioscience
Inc.). The sections were counterstained with Mayer’s hematoxylin,
then dehydrated and mounted onto slides.
MVD was determined using a modification of the
method described by Zhen et al (12). Individual microvessels were counted
in areas exhibiting the most intense neovascularization marked by
CD34 expression in the vascular endothelium (magnification, ×400).
MVD was expressed as the absolute number of microvessels per field
(magnification, ×400) for each case.
Evaluation of cell density (CD)
To determine CD, hematoxylin and eosin-stained
specimens were viewed under a light microscope model Olympus BX52
(Olympus, Japan, Tokyo) at a magnification of ×1,000. Three FOVs
from each specimen were selected and the cells within these FOVs
were counted. The mean of the 3 middle densities was then
calculated.
Volumetric analysis of tumor size
Tumor size was evaluated by volumetric assessment
using SuperPACS™ architecture (Carestream, Rochester, NY, USA). The
enhanced area of the tumor in each slice image was measured by
manual tracing of the tumor boundaries and the sum of the enhanced
areas was then multiplied by the slice interval of the MRI
series.
Statistical analysis
The correlation between two parameters was analyzed
using Pearson’s correlation test. P<0.05 was considered to
indicate a statistically significant difference. All the
statistical analyses were performed using StatView 5.0 software
(SAS Institute Inc., Cary, NC, USA).
Results
Correlation of FDG SUVmax with GLUT1 and
GLUT3 mRNA expression
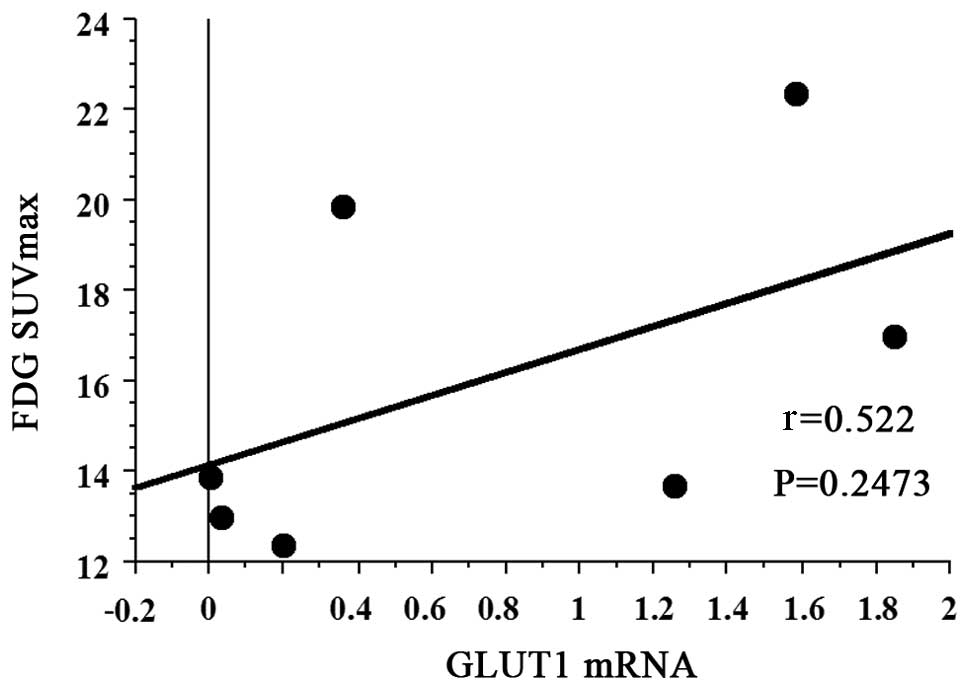
The mean FDG SUVmax of all 7 patients with PCNSL was
16.043 (95% CI: 12.485–19.601). The FDG SUVmax did not exhibit a
statistically significant association with GLUT1 mRNA expression
(r=0.522, P=0.2473) (Fig. 1).
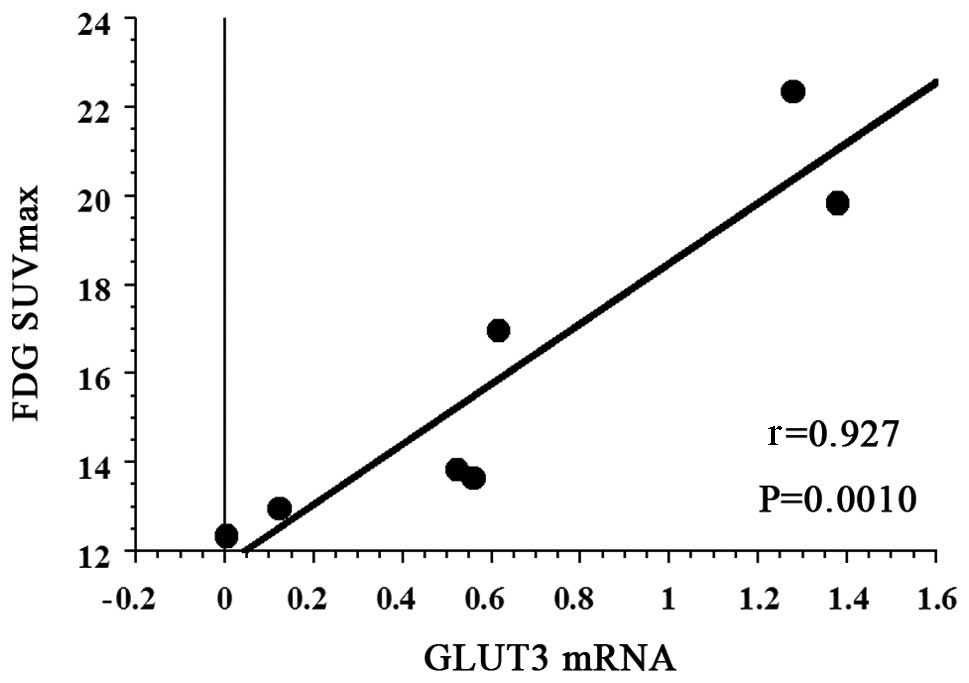
However, there was a strong positive correlation between FDG SUVmax
and GLUT3 mRNA expression (r=0.927, P=0.0010) (Fig. 2).
Correlation between MET SUVmax and LAT1
mRNA expression
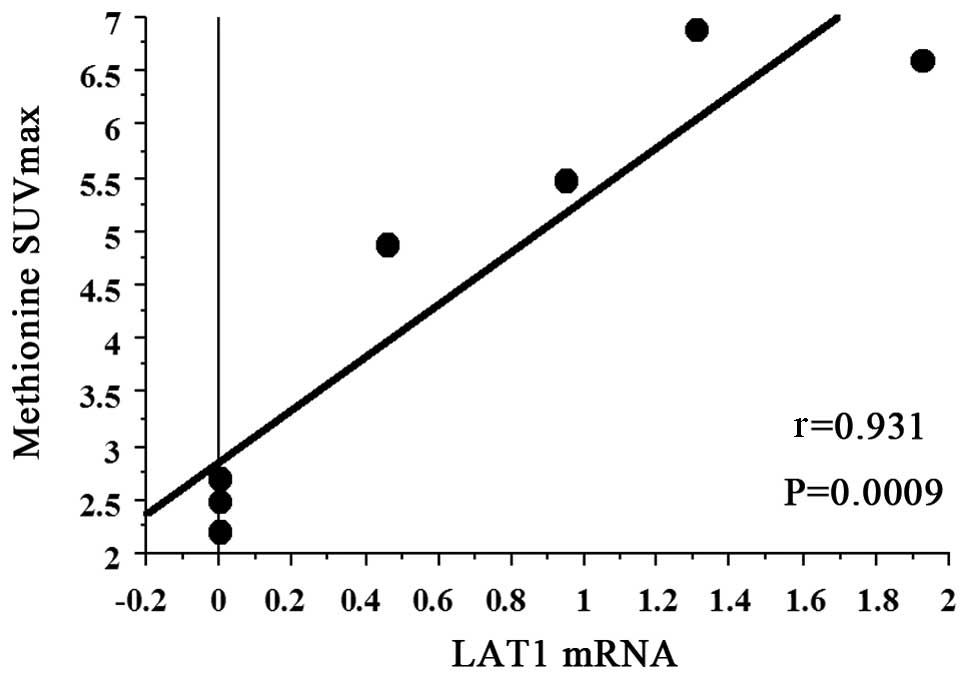
The mean MET SUVmax of all 7 patients with PCNSL was
4.471 (95% CI: 2.627–6.315). A strong positive correlation was
observed between MET SUVmax and LAT1 mRNA expression (r=0.931,
P=0.0009) (Fig. 3).
Correlation of PET SUVmax with MVD and
CD
The FDG SUVmax did not exhibit a statistically
significant association with MVD (r=−0.061, P=0.9028). In addition,
the MET SUVmax was not significantly correlated with MVD (r=−0.026,
P=0.9583). Furthermore, FDG SUVmax and MET SUVmax were not
statistically significantly associated with CD (r=−0.410, P=0.3833;
and r=−0.472, P=0.3050, respectively) (data not shown).
Correlation of PET SUVmax with tumor
volume
Neither FDG SUVmax nor MET SUVmax exhibited a
statistically significant association with tumor volume (r=0.366,
P=0.6049; and r=0.308, P=0.7050, respectively) (data not
shown).
Discussion
To the best of our knowledge, this is the first
retrospective study to investigate the correlation between GLUT1
and GLUT3 mRNA expression and FDG uptake in PCNSL. A positive
correlation between LAT1 mRNA expression and MET uptake in PCNSL
tissues was demonstrated.
Malignant tumor cells require a steady and
sufficient glucose and amino acid supply in order to maintain the
high levels of energy metabolism and protein synthesis required for
rapid growth and continuous proliferation. This supply is supported
by the upregulation of transporters specialized for these nutrients
(13).
Energy-independent glucose uptake into malignant and
non-malignant cells is regulated via the expression of GLUT
proteins (6–9). GLUT1 and GLUT3, which are members of
the SLC2A group, have a high affinity for glucose (14). There are several published reports
on the association of GLUT1 and GLUT3 expression with FDG-PET SUV
in other types of tumors (15,16);
however, the expression of these markers and their association with
FDG uptake in PCNSL have not been clearly determined. Therefore, we
quantified GLUT1 and GLUT3 mRNA expression in PCNSL specimens.
Tumor metabolism imaging with PET has become an established
technique for the diagnostic and therapeutic assessment of PCNSL.
FDG-PET commonly identifies hypermetabolic lesions through
increased uptake of FDG in PCNSL (2,3).
Furthermore, FDG-PET was found to be suitable for evaluating
therapeutic response (17). Our
results suggested that FDG uptake was dependent upon GLUT3 rather
than GLUT1 in PCNSL. However, the lack of significance may be due
to the small patient sample. Therefore, future studies should
include a larger sample size. The addition of high-dose
methotrexate (MTX) to radiation therapy (RT) was found to improve
the overall survival of patients with PCNSL to 30–40 months,
compared to the 12–18 months reported with RT alone (18,19).
However, over half of the patients eventually relapse and
uncontrolled PCNSL remains the primary cause of death. Kawai et
al (20) reported that the
overall survival time of patients with PCNSL with low-to-moderate
FDG uptake was significantly longer compared to that of patients
with a high FDG uptake. Accordingly, GLUT3 may be a molecular
target for PCNSL treatment in future studies.
Transporters for essential amino acids are
particularly important, as they are indispensable for the protein
synthesis required to maintain cell integrity and cell cycle
progression. Among several amino acid transporters, LAT1 is a
Na+ ion-independent neutral amino acid transport agent,
which is essential for the transport of large neutral amino acids
through the plasma membrane (21).
LAT1 was cloned from rat glioma C6 cells (21) and exhibits a high affinity for
several essential amino acids, including methionine. MET-PET
revealed high uptakes in PCNSL (4)
at sites corresponding to the enhanced portion of the tumor on
CT/MRI and the area of increased uptake is often larger than the
enhanced lesions (3). This larger
area of MET uptake reflects tumor infiltration beyond the enhanced
portion observed on MRI and CT (3). The size and degree of MET
accumulation in the tumor tissue were decreased following RT
(3). Thus, MET-PET may provide a
more accurate delineation of tumor volume for evaluating the
effects of RT, as well as for the detection of residual or
recurrent tumors following treatment (3). A previous study demonstrated a
significant correlation between tumor grade and MET uptake in
gliomas (22). Although an
increased rate of protein synthesis was hypothesized to be the
mechanism underlying increased MET uptake in gliomas, transport
mechanisms play a major role in this uptake process. There are
currently no reports investigating the LAT1 expression in PCNSL.
Therefore, we investigated LAT1 mRNA expression in PCNSL and our
results indicated that MET uptake is dependent on LAT1.
The uptake of FDG and MET was found to be dependent
on proliferative activity, as well as on other factors, such as MVD
(23,24) and CD (25). In oligodendrocytic tumors, abundant
microvessels and/or high CD may occasionally cause increased uptake
of FDG and MET (23). We next
investigated MVD and CD in our tumor samples. FDG SUVmax did not
exhibit a statistically significant association with MVD. MET
SUVmax was not found to be significantly correlated with MVD. In
addition, FDG SUVmax and MET SUVmax were not significantly
correlated with CD. Thus, in PCNSL, FDG and MET uptake depends
mainly on transport systems, rather than MVD or CD. Similarly,
tumor volume did not affect FDG or MET uptake in PCNSL. Our results
indicated that FDG and MET uptake may be dependent on the
transporters investigated in this study.
In conclusion, GLUT3 and LAT1 mRNA expression is
significantly correlated with FDG and MET uptake, respectively, in
PCNSL. Furthermore, FDG and MET uptake were not found to be
correlated with increased MVD or CD. Although high-dose MTX
chemotherapy followed by RT was shown to improve overall survival
in patients with PCNSL, the survival duration remains
unsatisfactory. Although additional studies are required to draw
definitive conclusions, GLUT3 and LAT1 may represent potential
novel therapeutic targets for PCNSL.
References
|
1
|
Corn BW, Marcus SM, Topham A, Hauck W and
Curran WJ Jr: Will primary central nervous system lymphoma be the
most frequent brain tumor diagnosed in the year 2000? Cancer.
79:2409–2413. 1997.
|
|
2
|
Kawai N, Nishiyama Y, Miyake K, Tamiya T
and Nagao S: Evaluation of tumor FDG transport and metabolism in
primary central nervous system lymphoma using
[18F]fluorodeoxyglucose (FDG) positron emission
tomography (PET) kinetic analysis. Ann Nucl Med. 19:685–690.
2005.PubMed/NCBI
|
|
3
|
Nishiyama Y, Yamamoto Y, Monden T,
Sasakawa Y, Kawai N, Satoh K and Ohkawa M: Diagnostic value of
kinetic analysis using dynamic FDG PET in immunocompetent patients
with primary CNS lymphoma. Eur J Nucl Med Mol Imaging. 34:78–86.
2007. View Article : Google Scholar : PubMed/NCBI
|
|
4
|
Ogawa T, Kanno I, Hatazawa J, et al:
Methionine PET for follow-up of radiation therapy of primary
lymphoma of the brain. Radiographics. 14:101–110. 1994. View Article : Google Scholar : PubMed/NCBI
|
|
5
|
Warburg O: On the origin of cancer cells.
Science. 123:309–314. 1956. View Article : Google Scholar : PubMed/NCBI
|
|
6
|
Reske SN, Grillenberger KG, Glatting G,
Port M, Hildebrandt M, Gansauge F and Beger HG: Overexpression of
glucose transporter 1 and increased FDG uptake in pancreatic
carcinoma. J Nucl Med. 38:1344–1348. 1997.PubMed/NCBI
|
|
7
|
Brown RS and Wahl RL: Overexpression of
Glut-1 glucose transporter in human breast cancer. An
immunohistochemical study. Cancer. 72:2979–2985. 1993. View Article : Google Scholar : PubMed/NCBI
|
|
8
|
Younes M, Brown RW, Stephenson M, Gondo M
and Cagle PT: Overexpression of Glut1 and Glut3 in stage I nonsmall
cell lung carcinoma is associated with poor survival. Cancer.
80:1046–1051. 1997. View Article : Google Scholar : PubMed/NCBI
|
|
9
|
Suzuki T, Iwazaki A, Katagiri H, Oka Y,
Redpath JL, Stanbridge EJ and Kitagawa T: Enhanced expression of
glucose transporter GLUT3 in tumorigenic HeLa cell hybrids
associated with tumor suppressor dysfunction. Eur J Biochem.
262:534–540. 1999. View Article : Google Scholar : PubMed/NCBI
|
|
10
|
Kaira K, Oriuchi N, Shimizu K, Imai H,
Tominaga H, Yanagitani N, Sunaga N, Hisada T, Ishizuka T, Kanai Y,
et al: Comparison of L-type amino acid transporter 1 expression and
L-[3–18F]-α-methyl tyrosine uptake in outcome of
non-small cell lung cancer. Nucl Med Biol. 37:911–916. 2010.
|
|
11
|
Sakata T, Ferdous G, Tsuruta T, Satoh T,
Baba S, Muto T, Ueno A, Kanai Y, Endou H and Okayasu I: L-type
amino-acid transporter 1 as a novel biomarker for high-grade
malignancy in prostate cancer. Pathol Int. 59:7–18. 2009.
View Article : Google Scholar : PubMed/NCBI
|
|
12
|
Zhen HN, Zhang X, Hu PZ, Yang TT, Fei Z,
Zhang JN, Fu LA, He XS, Ma FC and Wang XL: Surviving expression and
its relation with proliferation, apoptosis, and angiogenesis in
brain gliomas. Cancer. 104:2775–2783. 2005. View Article : Google Scholar : PubMed/NCBI
|
|
13
|
Ganapathy V, Thangaraju M and Prasad PD:
Nutrient transporters in cancer: relevance to Warburg hypothesis
and beyond. Pharmacol Ther. 121:29–40. 2009. View Article : Google Scholar : PubMed/NCBI
|
|
14
|
Uldry M and Thorens B: The SLC2 family of
facilitated hexose and polyol transporters. Pflugers Arch.
447:480–489. 2004. View Article : Google Scholar : PubMed/NCBI
|
|
15
|
Watanabe Y, Suefuji H, Hirose Y, et al:
18F-FDG uptake in primary gastric malignant lymphoma
correlates with glucose transporter 1 expression and histologic
malignant potential. Int J Hematol. 97:43–49. 2013. View Article : Google Scholar
|
|
16
|
Khandani AH, Dunphy CH, Meteesatien P,
Dufault DL, Ivanovic M and Shea TC: Glut1 and Glut3 expression in
lymphoma and their association with tumor intensity on
18F-fluorodeoxyglucose positron emission tomography.
Nucl Med Commun. 30:594–601. 2009. View Article : Google Scholar : PubMed/NCBI
|
|
17
|
Palmedo H, Urbach H, Bender H, Schlegel U,
Schmidt-Wolf IG, Matthies A, Linnebank M, Joe A, Bucerius J,
Biersack HJ and Pels H: FDG-PET in immunocompetent patients with
primary central nervous system lymphoma: correlation with MRI and
clinical follow-up. Eur J Nucl Med Mol Imaging. 33:164–168. 2006.
View Article : Google Scholar : PubMed/NCBI
|
|
18
|
Glass J, Gluber ML, Cher L and Hochberg
FH: Preirradiation methotrexate chemotherapy of primary central
nervous system lymphoma: long-term outcome. J Neurosurg.
81:188–195. 1994. View Article : Google Scholar : PubMed/NCBI
|
|
19
|
Abrey LE, DeAngelis LM and Yahalom J:
Long-term survival in primary CNS lymphoma. J Clin Oncol.
16:859–863. 1998.PubMed/NCBI
|
|
20
|
Kawai N, Zhen HN, Miyake K, Yamamaoto Y,
Nishiyama Y and Tamiya T: Prognostic value of pretreatment 18F-FDG
PET in patients with primary central nervous system lymphoma:
SUV-based assessment. J Neurooncol. 100:225–232. 2010. View Article : Google Scholar : PubMed/NCBI
|
|
21
|
Kanai Y, Segawa H, Miyamoto Ki, Uchino H,
Takeda E and Endou H: Expression cloning and characterization of a
transporter for large neutral amino acids activated by the heavy
chain of 4F2 antigen (CD98). J Biol Chem. 273:23629–23632. 1998.
View Article : Google Scholar : PubMed/NCBI
|
|
22
|
Okubo S, Zhen HN, Kawai N, Nishiyama Y,
Haba R and Tamiya T: Correlation of
L-methyl-11C-methionine (MET) uptake with L-type amino
acid transporter 1 in human gliomas. J Neurooncol. 99:217–225.
2010.
|
|
23
|
Nojiri T, Nariai T, Aoyagi M, Senda M,
Ishii K, Ishiwata K and Ohno K: Contributions of biological tumor
parameters to the incorporation rate of L-[methyl-11C]
methionine into astrocytomas and oligodendrogliomas. J Neurooncol.
93:233–241. 2009.
|
|
24
|
Kracht LW, Friese M, Herholz K, Schroeder
R, Bauer B, Jacobs A and Heiss WD:
Methyl-[11C]-l-methionine uptake as measured by positron
emission tomography correlates to microvessel density in patients
with glioma. Eur J Nucl Med Mol Imaging. 30:868–873. 2003.
|
|
25
|
Okita Y, Kinoshita M, Goto T, Kagawa N,
Kishima H, Shimosegawa E, Hatazawa J, Hashimoto N and Yoshimine T:
11C-methionine uptake correlates with tumor cell density
rather than with microvessel density in glioma: A stereotactic
image-histology comparison. Neuroimage. 49:2977–2982. 2010.
View Article : Google Scholar
|