Introduction
18F-fluorodeoxyglucose-positron emission
tomography/computed tomography (18F-FDG-PET/CT) is
widely used to make qualitative diagnoses. When treating lung
cancers, for example, it is used to determine the malignancy of
lesions in the lungs and lymph nodes. However, PET images generally
have poorer resolution than CT images and scans of lung tissue are
particularly affected by respiratory rhythms. These factors are
considered to limit PET's usefulness in diagnosing small-diameter
lesions such as ground-glass nodules (GGNs (1–3).
However, few publications have examined PET/CT's utility when
examining GGNs alone (4,5). Moreover, it has not been established
definitively whether this imaging modality is useful for certain
kinds of GGNs and how such data should be evaluated.
Well-differentiated adenocarcinomas are among the types of GGN
lesions identifiable on CT. However, their small diameter makes it
difficult to collect pathological specimens in many cases (for
example, by means of bronchoscopy or CT-guided needle lung biopsy).
This raises an important question regarding the utility of PET/CT
for determining the benignity or malignancy of GGNs. In this study,
we examined PET/CT's clinical utility for the diagnosis of GGN
lesions by comparing preoperative CT and PET/CT findings of
patients who underwent surgery at Japanese Red Cross Okayama
Hospital and who were diagnosed with lung cancer based on
histological findings.
Patients and methods
Records of patients diagnosed with lung cancer
following pulmonary resection at Japanese Red Cross Okayama
Hospital between January 2010 and December 2014 were reviewed
retrospectively. Only patients who underwent PET/CT and whose
preoperative CT findings indicated GGNs were analyzed.
All patients were imaged using an Aquilion 64 CT
scanner at Japanese Red Cross Okayama Hospital (Toshiba Medical
Systems, Otawara, Japan). The scan settings were as follows: slice
dimensions = 512×512 pixels, slice thickness = 1.0 mm, scanning
interval = 0.8 mm, tube voltage =120 mA (with automatic tube
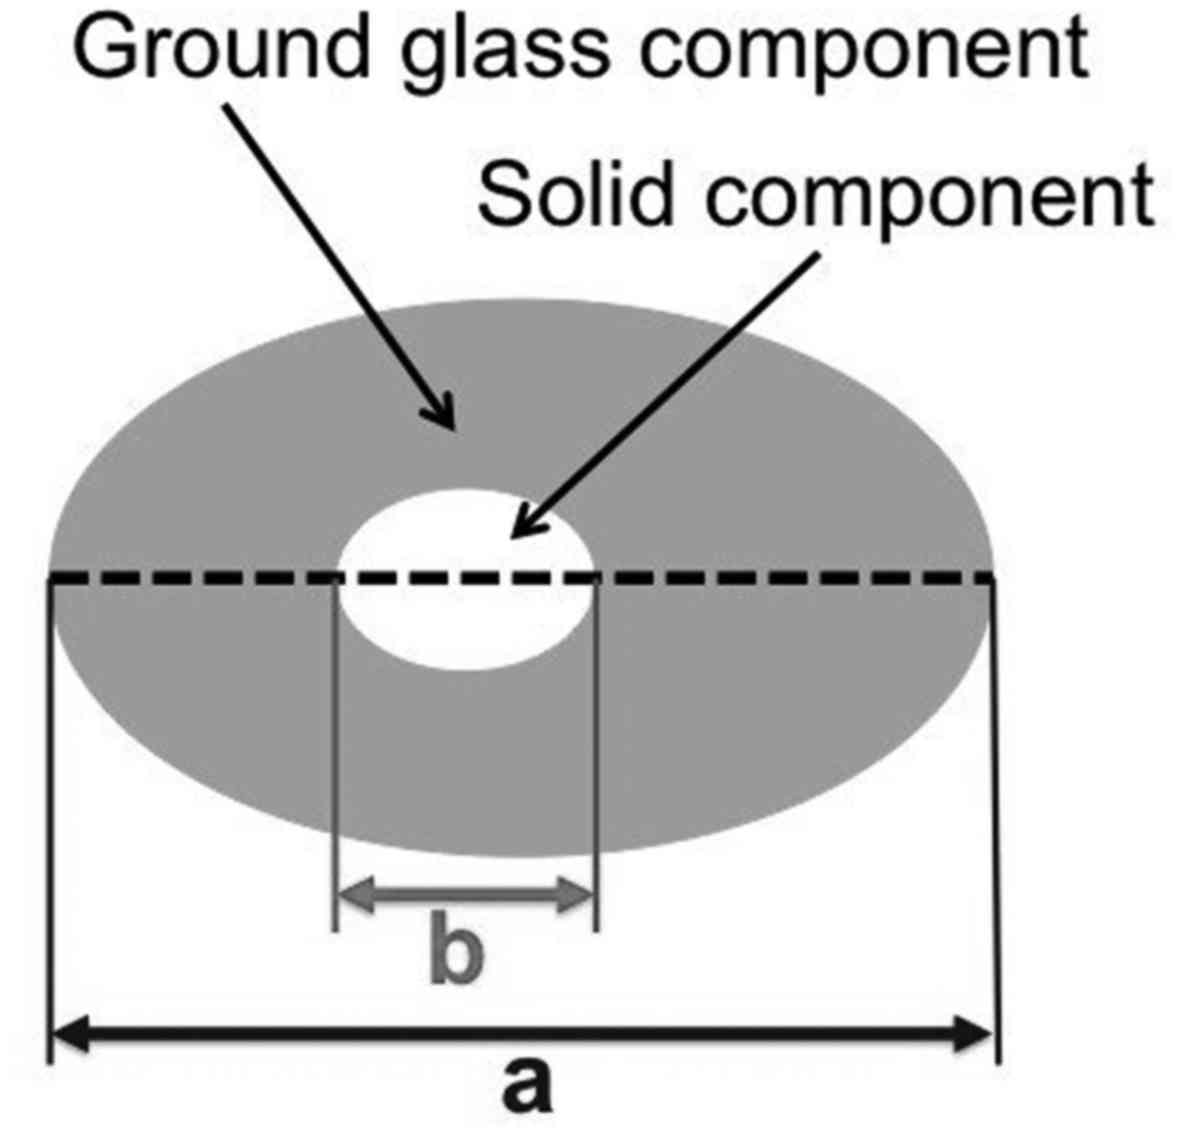
voltage modulation), and pitch factor = 0.844. GGNs were evaluated
on horizontal chest CT images in terms of total diameter (the long
axis of the lesion), solid-part diameter (the long axis of the
hyperechoic, low-contrast part, as determined visually), and
solid-part ratio (the solid-part diameter/total diameter) (Fig. 1). If multiple GGNs were observed
simultaneously in a slice, only the lesion with the largest total
diameter was analyzed.
PET/CT scanning was performed at Okayama Diagnostic
Imaging Center and Okayama Kyokuto Hospital. At the former,
patients were scanned using a lutetium oxyorthosilicate (LSO)-based
Biograph Sensation 16 PET/CT scanner with manufacturer-recommended
settings (Siemens, Munchen, Germany). FDG (3.7 MBq/kg) was
administered intravenously after the patient had fasted for ≥5 h;
scanning began 90 min thereafter. At the latter, patients were
scanned using a Discovery LS PET/CT system with
manufacturer-recommended settings (General Electric Company,
Boston, MA, USA). FDG (6 MBq/kg) was administered intravenously
after the patient had fasted for ≥4 h; scanning began 50 and 120
min thereafter for early- and delayed-phase images, respectively.
Only early-phase images were used in the analysis. Both facilities
conduct daily inspections for PET/CT quality control. Various
studies have been published on the evaluation of PET findings. This
study employed the maximum standardized uptake value
(SUVmax), a commonly used metric in Japan at present.
Pulmonary nodules were judged to have clinically important FDG
uptake when the SUVmax was ≥2.5 (2,6).
The statistical analysis was performed using EZR
software version 1.36 (Saitama Medical Center, Jichi Medical
University, Saitama, Japan) (7). In
the statistical analysis, an SUVmax too low to evaluate
was treated as SUVmax=0.0. p≤0.05 was considered to
indicate a statistically significant difference in two-group
comparisons. Correlations were evaluated using the Pearson
product-moment correlation coefficient; r≥0.4 was considered to
indicate a moderate correlation. Fischer's exact test was used to
analyze frequency distributions. The t-test was used to determine
whether differences in the means of two sets of samples were
significant.
All lung cancer diagnoses were corroborated by the
pathological histology of the biopsied specimens. Original
histology-based diagnoses were based on the General Rules for the
Clinical and Pathological Classification of Lung Cancer of the
Japan Lung Cancer Society (8th edition) and the TNM staging system
of the International Association for the Study of Lung Cancer (8th
edition) (8). The same tissue
specimens were re-examined and classified in the present study
using the World Health Organization Classification of Tumors of the
Lung, Pleura, Thymus, and Heart (4th edition) (9).
Patients' clinical characteristics, CT findings
(total diameter, solid-part diameter, and solid-part ratio),
pathological diagnosis, and their relationships with the
SUVmax were analyzed statistically. This study was
conducted with the approval of the Ethics Committee of Japanese Red
Cross Okayama Hospital.
Results
In total, 66 patients who were diagnosed with lung
cancer following pulmonary resection at Japanese Red Cross Okayama
Hospital between January 2010 and December 2014 were analyzed. All
had undergone PET/CT and had preoperative CT findings indicating
GGNs. The subjects ranged in age from 47-86 years (median, 69
years) and consisted of 28 men and 38 women. All were diagnosed
with lung adenocarcinoma; lymph node/distant metastasis was not
observed in any case. The pathologic tumor (pT) factors were 1a,
1b, 1c, 2a, and 2b in 5, 30, 21, 9, and 1 case(s), respectively;
the pathologic stage (pStage) classifications were IA1, IA2, IA3,
IB, and IIA in 5, 30, 21, 9, and 1 case(s), respectively. Visceral
pleural infiltration beyond the elastic layer was observed in one
case but did not reach the visceral pleural membrane (i.e., stage
pl1). The total diameters of the GGNs according to CT findings
ranged from 7.0-41.13 mm (median, 19.43 mm); the solid-part
diameters ranged from 0.0-23.23 mm (median, 4.55 mm), and the
solid-part ratios ranged from 0-77% (median, 20%). A total of 22
lesions were diagnosed as pure GGNs. The SUVmax ranged
from a value too low to be evaluated to a maximum of 3.9 (median,
1.0). The SUVmax ranged from 1.00-1.49 in 34 patients
(51.5%), 1.50-1.99 in 19 (28.8%), 2.00-2.49 in 11, (16.7%), and
≥2.5 in 6 (9.1%). The histopathological classifications of the
adenocarcinoma subtype were adenocarcinoma in situ (AIS) in
17 patients, minimally invasive adenocarcinoma (MIA) in 15,
lepidic-predominant adenocarcinoma (LPA) in 32, and
papillary-predominant adenocarcinoma (PPA) in 2 (10) (Table
I). The SUVmax correlated with each CT metric as
follows: r=0.513 for the total diameter (p<0.0001), r=0.461 for
the solid-part diameter, and r=0.307 for the solid-part ratio
(p<0.0001). Patients with total GGN diameters ≥20 mm were
significantly more likely to have an SUVmax≥2.5 than
were patients with smaller lesions (p<0.0001). No pure GGN or
lesion with a solid-part diameter <4.55 mm exhibited an
SUVmax≥2.5. Eight tumors with an
SUVmax<2.5 were classified as pure GGNs (AIS, 3; MIA,
4; and LPA, 2). There was no significant difference in the
frequency of SUVmax≥2.5 in the AIS-MIA group and the
LPA-PPA group (p=0.198) (Table II).
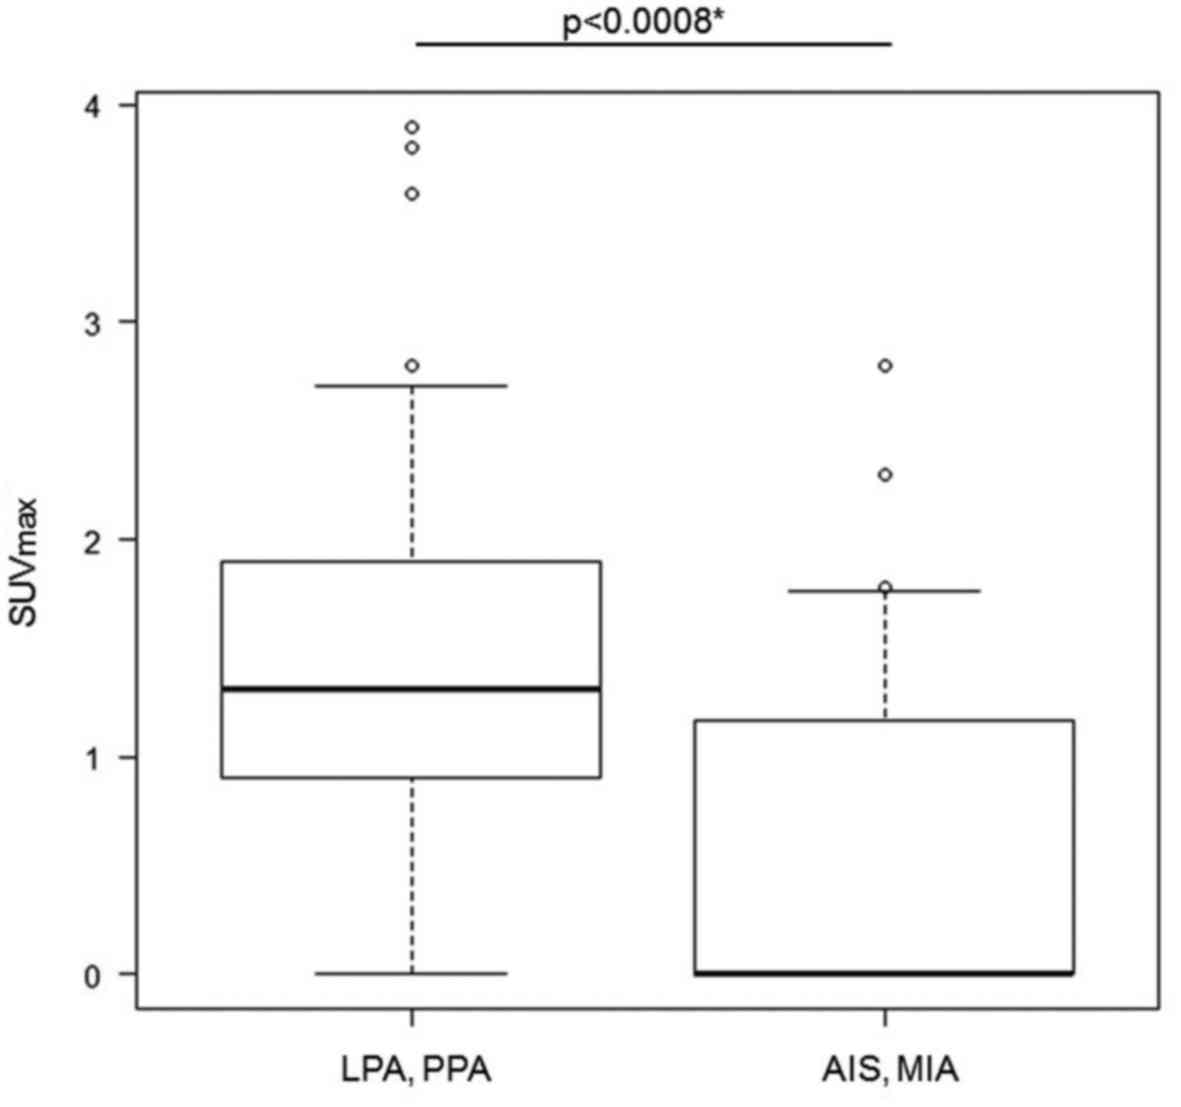
All had an SUVmax≥1.0 and comprised 38.1% of all pure
GGNs observed. The AIS-MIA group showed a significantly lower
SUVmax than the LPA-PPA group (p=0.0008). The average
value of SUVmax in each group was 0.61 (95% confidence
interval 0.309-0.919) in the AIS-MIA group and 1.43 (95% confidence
interval 1.07-1.789) in the LPA-PPA group (Fig. 2).
 | Table I.Patient characteristics (n=66). |
Table I.
Patient characteristics (n=66).
| Features | No. |
|---|
| Median age, year
(range) | 69 (47-86) |
| Sex
(female/male) | 38/28 |
| Histology
(AIS/MIA/LPA/PPA) | 17/15/32/2 |
| pT stage
(1a/1b/1c/2a/2b) | 30/5/21/9/1 |
| Mean total diameter,
mm (range) | 19.43
(7.0-41.13) |
| Mean solid-part
diameter, mm (range) | 4.55 (0-23.23) |
| Mean
SUVmax, (range) | 1.0 (insignificant –
3.9) |
| Table II.SUV-max distributions by
adenocarcinoma classification (n=66). |
Table II.
SUV-max distributions by
adenocarcinoma classification (n=66).
|
SUVmax | <1.0 | 1.0-1.4 | 1.5-1.9 | 2.0-2.4 | ≥2.5 | ≥2.5 (%)a |
|---|
| AIS | 10 | 4 | 1 | 1 | 1 | 5.8 |
| MIA | 10 | 3 | 1 | 1 |
| 0 |
| LPA | 11 | 8 | 5 | 3 | 5 | 15.6 |
| PPA | 1 |
| 1 |
|
| 0 |
Discussion
Our investigation observed a moderate correlation
between the major-axis diameter and SUVmax of GGNs. The
potential of using the SUVmax as a reference value was
demonstrated by the fact that it was better correlated with the
solid-part diameter than the total diameter. However, it is
important to note that the correlation was low for pure GGNs and
small-diameter lesions. Moreover, in some cases, imaging findings
diverged from pathological findings; for example, one case was
classified as AIS by postoperative histopathology despite the
lesion having a solid part that had been observed before surgery.
We did not use high-resolution CT (HR-CT) scanners, but the
resolution of our CT images was typical for clinical scanning
procedures. Nonetheless, perhaps this divergence would have been
less had our scans been performed with greater precision using such
equipment.
In this study, we also examined the relationship
between AIS, MIA, LPA, PPA and SUVmax. There was a
significant difference in the mean value of SUVmax in
the AIS-MIA group and the LPA-PPA group, but the clear cut-off
value is still unknown. Although the possibility of
SUVmax 1.0 being a point dividing the two groups was
shown in this study, and care should be taken for GGNs with
SUVmax higher than that, further investigation is
necessary in the future.
Normal lung tissue has an SUVmax of 0.6
(range, 0.2-1.8) and many past studies have used the criterion of
an SUVmax>2.5 to diagnose a finding as malignant when
performing PET/CT examinations of pulmonary nodules (11). Since we did not analyze noncancerous
lesions in this study, the sensitivity in detecting cancer of
SUVmax≥2.5 is unknown. However, in this study, even in
the LAP-PPA group, the mean value of SUVmax is <2.5;
thus, at least for GGN lesions, it is not an indicator for a
non-carcinoma. The SUV is a semi-quantitative value that is
affected by factors such as body type, blood sugar levels, and
scanning time, and can further vary between different devices or
image reconstruction software packages. Because of its simplicity
and intuitiveness, it is widely used in clinical procedures to
complement visual assessments such as the maximum intensity
projection. Even though we analyzed PET/CT scans that were
performed at two hospitals, we decided that since the
SUVmax was measured at both locations, it could be used
as a major assessment measure with a certain level of objectivity.
However, we cannot deny the possibility that using scanning data
from multiple institutions could have influenced our assessment.
The SUV tends to be low in cells with low glucose metabolism on PET
images, for example, highly differentiated lung adenocarcinomas and
hepatocellular, renal, prostate, and gastric cancers. Past
investigations have found that pure GGNs exhibit median SUV values
of around 1.0 (4,12); our SUVmax data were not
greatly divergent from these values. In addition, PET has low
spatial resolution (7-8 mm), making it difficult to assess nodules
less than 10 mm in diameter, generally speaking (2,13,14).
Moreover, one study found that the SUVmax of lung
carcinomas showing localized ground-glass opacities was not
significantly different from the SUVmax observed from
inflammatory lesions (5). Therefore,
we advise caution when using the SUVmax to determine the
benignity or malignancy of lung cancers.
PET/CT-based research is becoming more diverse and
is utilized in conjunction with a variety of different objectives
and use cases. For example, one recent study found that the
preoperative SUV could serve as a prognostic factor in c-stage IA
lung adenocarcinomas (15).
Technological advances are helping to increase the diagnostic
accuracy of PET/CT; recent efforts have focused on developing image
reconstruction techniques, improving spatial resolution by means of
time-of-flight methods, and reducing partial-volume effects
(16,17). While the clinical value of PET/CT in
evaluating GGNs is still limited at present, it could increase in
the future, and thus its evolution must be monitored carefully
going forward.
This study is novel in that SUVmax was
analyzed based on currently used pathological classifications of
lung adenocarcinoma, suggesting the possibility of
SUVmax value in lesions with higher malignancy, even in
GGN lesions. In order to scientifically confirm the relationship
between pathological findings and SUVmax values, future
larger-scale prospective observational research with a focus on
similar imaging conditions is necessary.
This study was presented at the 2015 World
Conference on Lung Cancer (Denver, CO, USA).
Acknowledgements
Not applicable.
Funding
No funding was received.
Availability of data and materials
The datasets generated during and/or analyzed during
the current study are not publicly available to protect the
patients' personal information but are available from the
corresponding author for reasonable requests.
Authors' contributions
KN, AB, NF, YO, SH, MS and MK conceived of and
designed the research. KN and AB analyzed and interpreted the data.
KN and AB wrote and revised the manuscript. All authors read and
approved the final manuscript.
Ethics approval and consent to
participate
This study was conducted with the approval of the
Ethics Committee of Japanese Red Cross Okayama Hospital. The
requirement for informed consent was waived by the ethics committee
because of the study's retrospective nature; however, patients
could opt out of sharing their information.
Patient consent for publication
Not applicable.
Competing interests
The authors declare that they have no competing
interests.
Glossary
Abbreviations
Abbreviations:
|
AIS
|
adenocarcinoma in situ
|
|
18F-FDG-PET/CT
|
18F-fluorodeoxyglucose
positron-emission tomography/computed tomography
|
|
GGN
|
ground-glass nodule
|
|
MIA
|
minimally invasive adenocarcinoma
|
|
LPA
|
lepidic-predominant adenocarcinoma
|
|
LSO
|
lutetium oxyorthosilicate
|
|
PPA
|
papillary-predominant
adenocarcinoma
|
|
SUVmax
|
maximum standardized uptake value
|
References
|
1
|
Naidich DP, Bankier AA, MacMahon H,
Schaefer-Prokop CM, Pistolesi M, Goo JM, Macchiarini P, Crapo JD,
Herold CJ, Austin JH, et al: Recommendations for the management of
subsolid pulmonary nodules detected at CT: a statement from the
Fleischner Society. Radiology. 266:304–317. 2013. View Article : Google Scholar : PubMed/NCBI
|
|
2
|
Gould MK, Maclean CC, Kuschner WG, Rydzak
CE and Owens DK: Accuracy of positron emission tomography for
diagnosis of pulmonary nodules and mass lesions: a meta-analysis.
JAMA. 285:914–924. 2001. View Article : Google Scholar : PubMed/NCBI
|
|
3
|
Nomori H, Watanabe K, Ohtsuka T, Naruke T,
Suemasu K and Uno K: Evaluation of F-18 fluorodeoxyglucose (FDG)
PET scanning for pulmonary nodules less than 3 cm in diameter, with
special reference to the CT images. Lung Cancer. 45:19–27. 2004.
View Article : Google Scholar : PubMed/NCBI
|
|
4
|
Kim TJ, Park CM, Goo JM and Lee KW: Is
there a role for FDG PET in the management of lung cancer
manifesting predominantly as ground-glass opacity? AJR Am J
Roentgenol. 198:83–88. 2012. View Article : Google Scholar : PubMed/NCBI
|
|
5
|
Chun EJ, Lee HJ, Kang WJ, Kim KG, Goo JM,
Park CM and Lee CH: Differentiation between malignancy and
inflammation in pulmonary ground-glass nodules: the feasibility of
integrated 18F-FDG PET/CT. Lung Cancer. 65:180–186.
2009. View Article : Google Scholar : PubMed/NCBI
|
|
6
|
Vansteenkiste J and Dooms C: Positron
emission tomography in nonsmall cell lung cancer. Curr Opin Oncol.
19:78–83. 2007. View Article : Google Scholar : PubMed/NCBI
|
|
7
|
Kanda Y: Investigation of the freely
available easy-to-use software ‘EZR’ for medical statistics. Bone
Marrow Transplant. 48:452–458. 2013. View Article : Google Scholar : PubMed/NCBI
|
|
8
|
Goldstraw P, Chansky K, Crowley J,
Rami-Porta R, Asamura H, Eberhardt WE, Nicholson AG, Groome P,
Mitchell A, Bolejack V, et al: The IASLC Lung Cancer Staging
Project: proposals for revision of the TNM stage groupings in the
forthcoming (Eighth) edition of the TNM Classification for Lung
Cancer. J Thorac Oncol. 11:39–51. 2016. View Article : Google Scholar : PubMed/NCBI
|
|
9
|
Travis WD, Brambilla E, Nicholson AG,
Yatabe Y, Austin JHM, Beasley MB, Chirieac LR, Dacic S, Duhig E,
Flieder DB, et al: The 2015 World Health Organization
Classification of Lung Tumors: Impact of Genetic, Clinical and
Radiologic Advances Since the 2004 Classification. J Thorac Oncol.
10:1243–1260. 2015. View Article : Google Scholar : PubMed/NCBI
|
|
10
|
Travis WD, Brambilla E, Noguchi M,
Nicholson AG, Geisinger KR, Yatabe Y, Beer DG, Powell CA, Riely GJ,
Van Schil PE, et al: International Association for the Study of
Lung Cancer/American Thoracic Society/European Respiratory Society
international multidisciplinary classification of lung
adenocarcinoma. J Thorac Oncol. 6:244–285. 2011. View Article : Google Scholar : PubMed/NCBI
|
|
11
|
Patz EF Jr, Lowe VJ, Hoffman JM, Paine SS,
Burrowes P, Coleman RE and Goodman PC: Focal pulmonary
abnormalities: evaluation with F-18 fluorodeoxyglucose PET
scanning. Radiology. 188:487–490. 1993. View Article : Google Scholar : PubMed/NCBI
|
|
12
|
Wu HB, Wang L, Wang QS, Han YJ, Li HS,
Zhou WL and Tian Y: Adenocarcinoma with BAC features presented as
the nonsolid nodule is prone to be false-negative on 18F-FDG
PET/CT. Biomed Res Int. 2015:2436812015.PubMed/NCBI
|
|
13
|
Lindell RM, Hartman TE, Swensen SJ, Jett
JR, Midthun DE, Nathan MA and Lowe VJ: Lung cancer screening
experience: a retrospective review of PET in 22 non-small cell lung
carcinomas detected on screening chest CT in a high-risk
population. AJR Am J Roentgenol. 185:126–131. 2005. View Article : Google Scholar : PubMed/NCBI
|
|
14
|
Cronin P, Dwamena BA, Kelly AM and Carlos
RC: Solitary pulmonary nodules: meta-analytic comparison of
cross-sectional imaging modalities for diagnosis of malignancy.
Radiology. 246:772–782. 2008. View Article : Google Scholar : PubMed/NCBI
|
|
15
|
Hattori A, Suzuki K, Matsunaga T, Fukui M,
Tsushima Y, Takamochi K and Oh S: Tumour standardized uptake value
on positron emission tomography is a novel predictor of
adenocarcinoma in situ for c-Stage IA lung cancer patients with a
part-solid nodule on thin-section computed tomography scan.
Interact Cardiovasc Thorac Surg. 18:329–334. 2014. View Article : Google Scholar : PubMed/NCBI
|
|
16
|
Suljic A, Tomse P, Jensterle L and Skrk D:
The impact of reconstruction algorithms and time of flight
information on PET/CT image quality. Radiol Oncol. 49:227–233.
2015. View Article : Google Scholar : PubMed/NCBI
|
|
17
|
Akamatsu G, Ishikawa K, Mitsumoto K,
Taniguchi T, Ohya N, Baba S, Abe K and Sasaki M: Improvement in
PET/CT image quality with a combination of point-spread function
and time-of-flight in relation to reconstruction parameters. J Nucl
Med. 53:1716–1722. 2012. View Article : Google Scholar : PubMed/NCBI
|