Introduction
Pathological scar is the pathological product formed
during the process of wound healing. As typical fiber hyperplastic
disease, its pathological changes are mainly characterized by
massive proliferation of fibroblasts and excessive deposition of
extracellular matrix dominated by collagen (1). Since the pathogenesis of pathological
scar is intricate and complex, it has yet to be elucidated.
However, the excessive proliferation of fibroblasts and its
increasing activity play a critical role during its formation. The
proliferation and activation of pathological scar fibroblasts are
regulated and controlled by various cytokines, among which
transforming growth factor-β1 (TGF-β1) is the cytokine recognized
to have the closest relationship with the formation of scars at
present (2). The transduction
process of cell signals is inseparable to the development of
biological activity of TGF-β1. An increasing number of studies have
been focused on the typical TGF-β1/Smads signal pathway. However,
the underlying mechanism of the proliferation of pathological scar
fibroblasts remains to be determined.
In recent years, it was shown that various
independent Smad pathways, in addition to the typical Smad pathway,
have been involved in the transduction process of TGF-β1 signals.
Additionally, some of these pathways were directly or indirectly
involved tumor formation and were closely related to the
proliferation, invasion and transfer of tumor (3). Pathologically, pathological scar
belongs to benign solid tumor. Keloid can invasively grow to
surrounding normal tissues and its pathological characteristics are
similar to that of tumor, with tumor-like characteristics (4). Therefore, it is of great significance
to implement studies on pathological scar from signal pathway
closely associated with tumor.
Previous findings have shown that mammalian target
of rapamycin (mTOR) was closely related to excessive cell
proliferation and the occurrence of tumor and significantly
strengthened its expression in various tumor tissues (5). The mTOR pathway plays an important
role in the process of TGF-β1-mediated epithelial-mesenchymal
transition (EMT) (6). Therefore,
the TGF-β1/mTOR signal pathway also plays an important role during
the process of the proliferation of pathological scar fibroblasts.
To examine this hypothesis, the present study applied
immunofluorescence, reverse transcription-polymerase chain reaction
(RT-PCR), western blotting and other technologies to detect the
expression of the key molecules of TGF-β1/mTOR pathway in
pathological scar fibroblasts to clarify the mechanism related to
the proliferation of pathological scar fibroblasts.
Materials and methods
Specimen source
The specimens were pathological scar tissue after
surgical resection for treatment at the Department of Dermatology
of Xuzhou Hospital of Traditional Chinese Medicine (Jiangsu,
China), and normal skin tissue was resected from patients with
redundant prepuce at the Department of Urology Surgery of Xuzhou
Hospital of Traditional Chinese Medicine.
Main reagents
D-Hank's liquid (Shanghai Kang Lang Biological
Technology Co., Ltd., Shanghai, China), 0.25% trypsin (Shanghai
Bioleaf Biotech Co., Ltd., Shanghai, China), fetal bovine serum
(Shanghai Bioleaf Biotech Co., Ltd.), Triton X-100 (Shanghai
Lianshuo Biological Technology Co., Ltd., Shanghai, China), reverse
transcription kit superscript III (Invitrogen, Carlsbad, CA, USA),
SDS-PAGE gel preparation kit (Shanghai Solarbio Bioscience &
Technology Co., Ltd., Shanghai, China), rabbit anti-human TGF-β1
monoclonal antibody (Wuhan Boster Biological Technology Co., Ltd.,
Wuhan, China), rabbit anti-human monoclonal antibody (Wuhan Boster
Biological Technology Co., Ltd.), rabbit anti-human protein kinase
B (Akt) monoclonal antibody (Wuhan Boster Biological Technology
Co., Ltd.); rabbit anti-human mTOR monoclonal antibody (Wuhan
Boster Biological Technology Co., Ltd.), and goat anti-rabbit
secondary antibody (Jackson ImmunoResearch Inc., West Grove, PA,
USA) labeled by fluorescein isothiocyanate were used in the
study.
Main instruments
Instruments used included: Optical microscope
(Olympus Corp., Tokyo, Japan), CO2 incubator (Binder
GmbH, Tuttlingen, Germany), laser confocal microscope with high
sensitivity (Carl Zeiss, Inc., Oberkochen, Germany), PCR instrument
(Thermo Fisher Scientific, Waltham, MA, USA), centrifuge with low
temperature and high speed (Thermo Fisher Scientific), Image
Pro-Plus image analysis system (Media Cybernetics, Inc., Rockville,
MD, USA), infrared fluorescence imaging instrument (LI-COR
Biosciences, Lincoln, NE, USA).
In vitro culture of fibroblasts
Under aseptic conditions, pathological scar tissue
and normal skin tissue specimens were respectively cut. Ophthalmic
scissors was applied to carefully remove epithelial and
subcutaneous tissues and the specimens were washed three times with
D-Hank's liquid. The specimens were cut into 1 mm3
tissue block, placed into a sterile bottle, filtered after
digestion into floccules by 0.25% trypsin EDTA, centrifuged at 650
× g for 5 min, well mixed and precipitated with 5 ml of DMEM liquid
containing 20% fetal bovine serum, and placed in a 25 ml culture
flask to culture in an incubator of 5% CO2 at 37°C. DMEM
liquid (20%) containing 20% fetal bovine serum was used to change
liquid once every 3–4 days. The cell growth was observed under
microscope (Olympus Corp.). When the cells were close to
overgrowing, passage was conducted according to the proportion of
1:3 and the 5th generation cells were taken to implement the
experimental study.
Immunofluorence test
The 5th generation fibroblasts were taken, 4%
paraformaldehyde was added, fixed at 25°C for 30 min, washed three
times with phosphate buffer solution (PBS), incubated at 0.1%
Triton X-100 37°C for 20 min, washed with PBS, and sealed with
non-immune goat serum for 1 h. Primary antibody was added after the
complete suction of serum, and they were incubated overnight at
4°C. Rabbit anti-human TGF-β1 monoclonal antibody (dilution: 1:500;
catalog no. 5154LC) and rabbit anti-human PI3K monoclonal antibody
(dilution: 1:500; catalog no. 9655T), rabbit anti-human protein
kinase B (Akt) monoclonal antibody (dilution: 1:500; catalog nos.
9474S) and rabbit anti-human mTOR monoclonal antibody (dilution:
1:500; catalog no. 8665T) were from Cell Signaling Technology
(Danvers, MA, USA). The following day, after they were washed with
PBS, secondary antibody (dilution: 1:200; catalog no. 4412S; Cell
Signaling Technology) was added, incubated at 37°C for 60 min,
washed with PBS, re-dyed with DAPI in the dark, and observed under
fluorescence microscope (Olympus Corp.) after 10 min.
Expression of mRNA detected by
RT-PCR
After the 5th generation fibroblasts were incubated
for 48 h under standard environment, a TRIzol reagent total RNA
extraction kit was applied to conduct total RNA extraction and the
operating steps were implemented according to the manufacturer's
instruction. Electrophoresis was applied to identify the integrity
of RNA extraction. By measuring, the
A260/A280 of all the samples (the ratio of
light absorption value at 260 nm/280 nm) was >1.8, which
indicated high sample purity without obvious protein pollution.
Total RNA purity was uniformly adjusted to be 0.5 g/l and the
specimens were stored at 70°C.
RNA (6 µl) was taken as a reverse transcription
template. Reverse transcription reaction system was 20 µl, with the
reaction condition of 37°C for 1 h and 95°C for 3 min. Standard
curve quantitation method was used to prepare standard substance of
cDNA template and it was diluted by 10-time step dilution
successively to prepare five gradients of standard substances of
cDNA template. The mRNA sequence of target genes was obtained in
the GenBank database and specific primers were designed in CDS area
by applying Primer Express version 2.0 software (Thermo Fisher
Scientific, Inc., Beijing, China). Table I shows the sequence of specific
primers. Each sample was amplified by genes to be detected and
reference genes. The amplification system was established according
to the following system: cDNA 2 µl, qPCR mix 10 µl, primer F 1 µl,
primer R 1 µl and ddH2O 6 µl. The reaction was conducted
on ABI 7900 qPCR instrument according to the following conditions:
Pre-degeneration at 95°C for 2 min, degeneration at 94°C for 20
sec, annealing at 65°C for 20 sec, extending at 72°C for 30 sec and
40 cycles. Quantity-one gel imaging analysis system was used to
analyze gray values of all bands and the relative quantity (RQ) of
mRNA was shown by the ratio of the gray values of target genes and
reference gene β-actin. Gene quantity was RQ=2−ΔΔCq. A
higher RQ value was considered higher gene quantity.
 | Table I.PI3K, Akt, mTOR gene primer sequences
and amplification fragment length of the product. |
Table I.
PI3K, Akt, mTOR gene primer sequences
and amplification fragment length of the product.
| Genes | Sequence (5′→3′) | Product size
(bp) |
|---|
| TGF-β1 | U:
GCCCTGGACACCAACTATTG | 1,724 |
|
| D:
CGTGTCCAGGCTCCAAATG |
|
| PI3K | U:
GATTCTCAGCAGCCAGCTCTGAT | 863 |
|
| D:
GCAGGCTGTCGTTCATTCCAT |
|
| Akt | U:
GACAACCGCCATCCAGAC | 851 |
|
| D:
CCAGGGACACCTCCATCTC |
|
| mTOR | U:
ACTCGCTTCTATGACCAACTGA | 494 |
|
| D:
TTTCCATGACAACTGGGTCATTG |
|
The calculation method of ΔΔCq was: ΔΔCq = (Ct mean
of target gene of the sample to be detected - Ct mean of the
housekeeping gene of the sample to be detected) - (Ct mean of
target gene of teh control sample - Ct mean of the housekeeping
gene of the control sample).
Expression of western blot detection
protein
Cultured fibroblasts were collected and washed with
pre-cooling PBS twice. Cell lysis buffer was added, and the
cultured fibroblasts implemented were placed on ice for 10–20 min.
After the homogenate was scrapped by cell scraper, the cells were
centrifuged at 8,400 × g at 4°C for 10 min and the supernatant was
taken. Lowry was applied to conduct protein quantification for
supernatant. Protein sample (50 µg) was loaded to 15%
SDS-polyacrylamide gel electrophoresis. After bromophenol blue
entered the bottom of the gel, protein was reimprinted on the
nitrocellulose membrane. Primary antibody was added into
fibroblasts which were incubated overnight at 4°C. Corresponding
secondary antibody marked with horseradish peroxidase was added.
Following incubation at room temperature for 1 h, the membranes
were washed, and Odyssey infrared fluorescence imager was used to
scan membranes and conduct imaging. Images were analyzed by
applying Image Pro-Plus image analysis system.
Statistical analysis
Experimental data were expressed as mean ± standard
deviation. SPSS 18.0 software (SPSS, Inc., Chicago, IL, USA) was
used for data analysis. Homogeneity of variance was tested using
the t-test, and non-parametric was used to test whether homogeneity
of variance was not met. P<0.05 was considered to indicate a
statistically significant difference.
Results
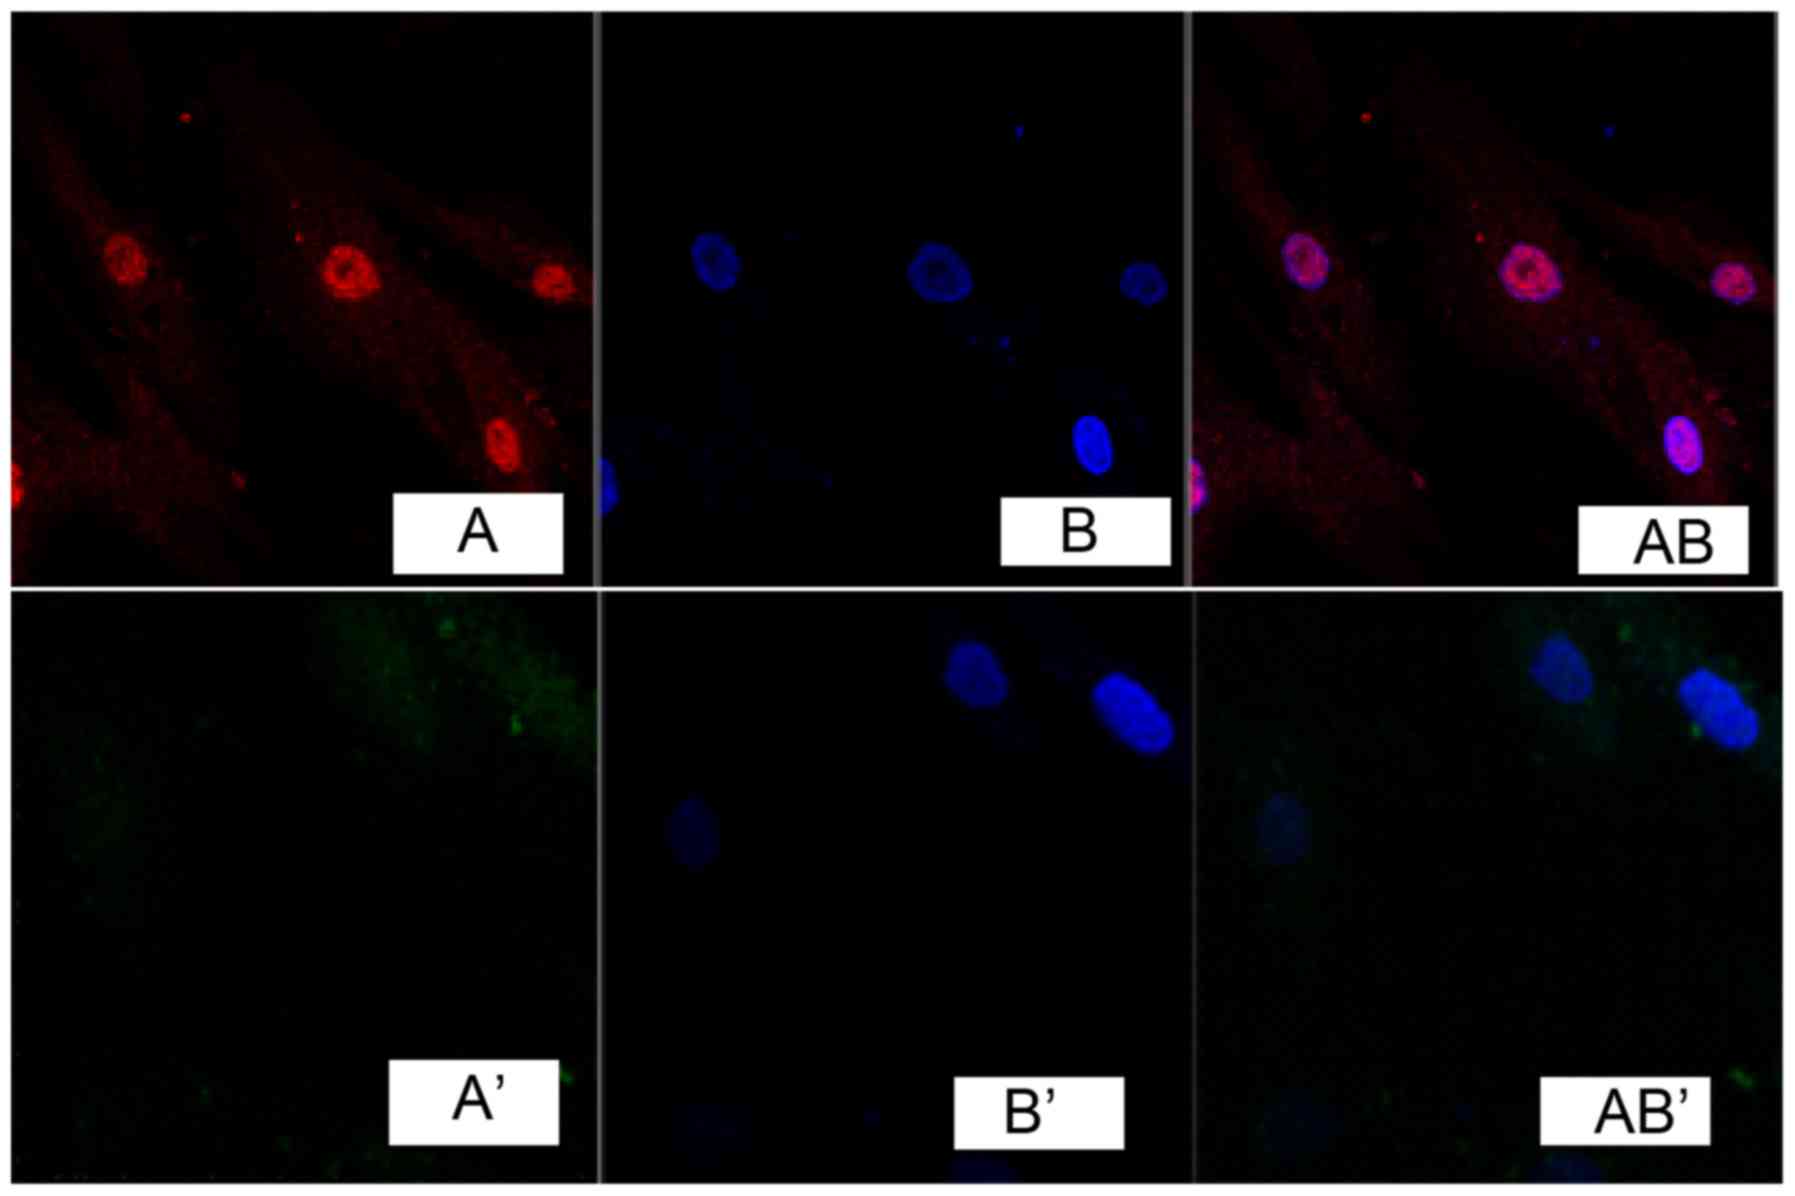
Immunofluorescence detection
Immunofluorescence detection results of cells showed
that, TGF-β1 was marked in red (Fig.
1A). DAPI marked nucleus indicated blue fluorescence (Fig. 1B). Fig. 1A and B overlapped when merging,
indicating that TGF-β1 was expressed in the cell nucleus, while no
obvious expression was found in fibroblasts of the normal skin
tissue (Fig. 1A', B' and AB').
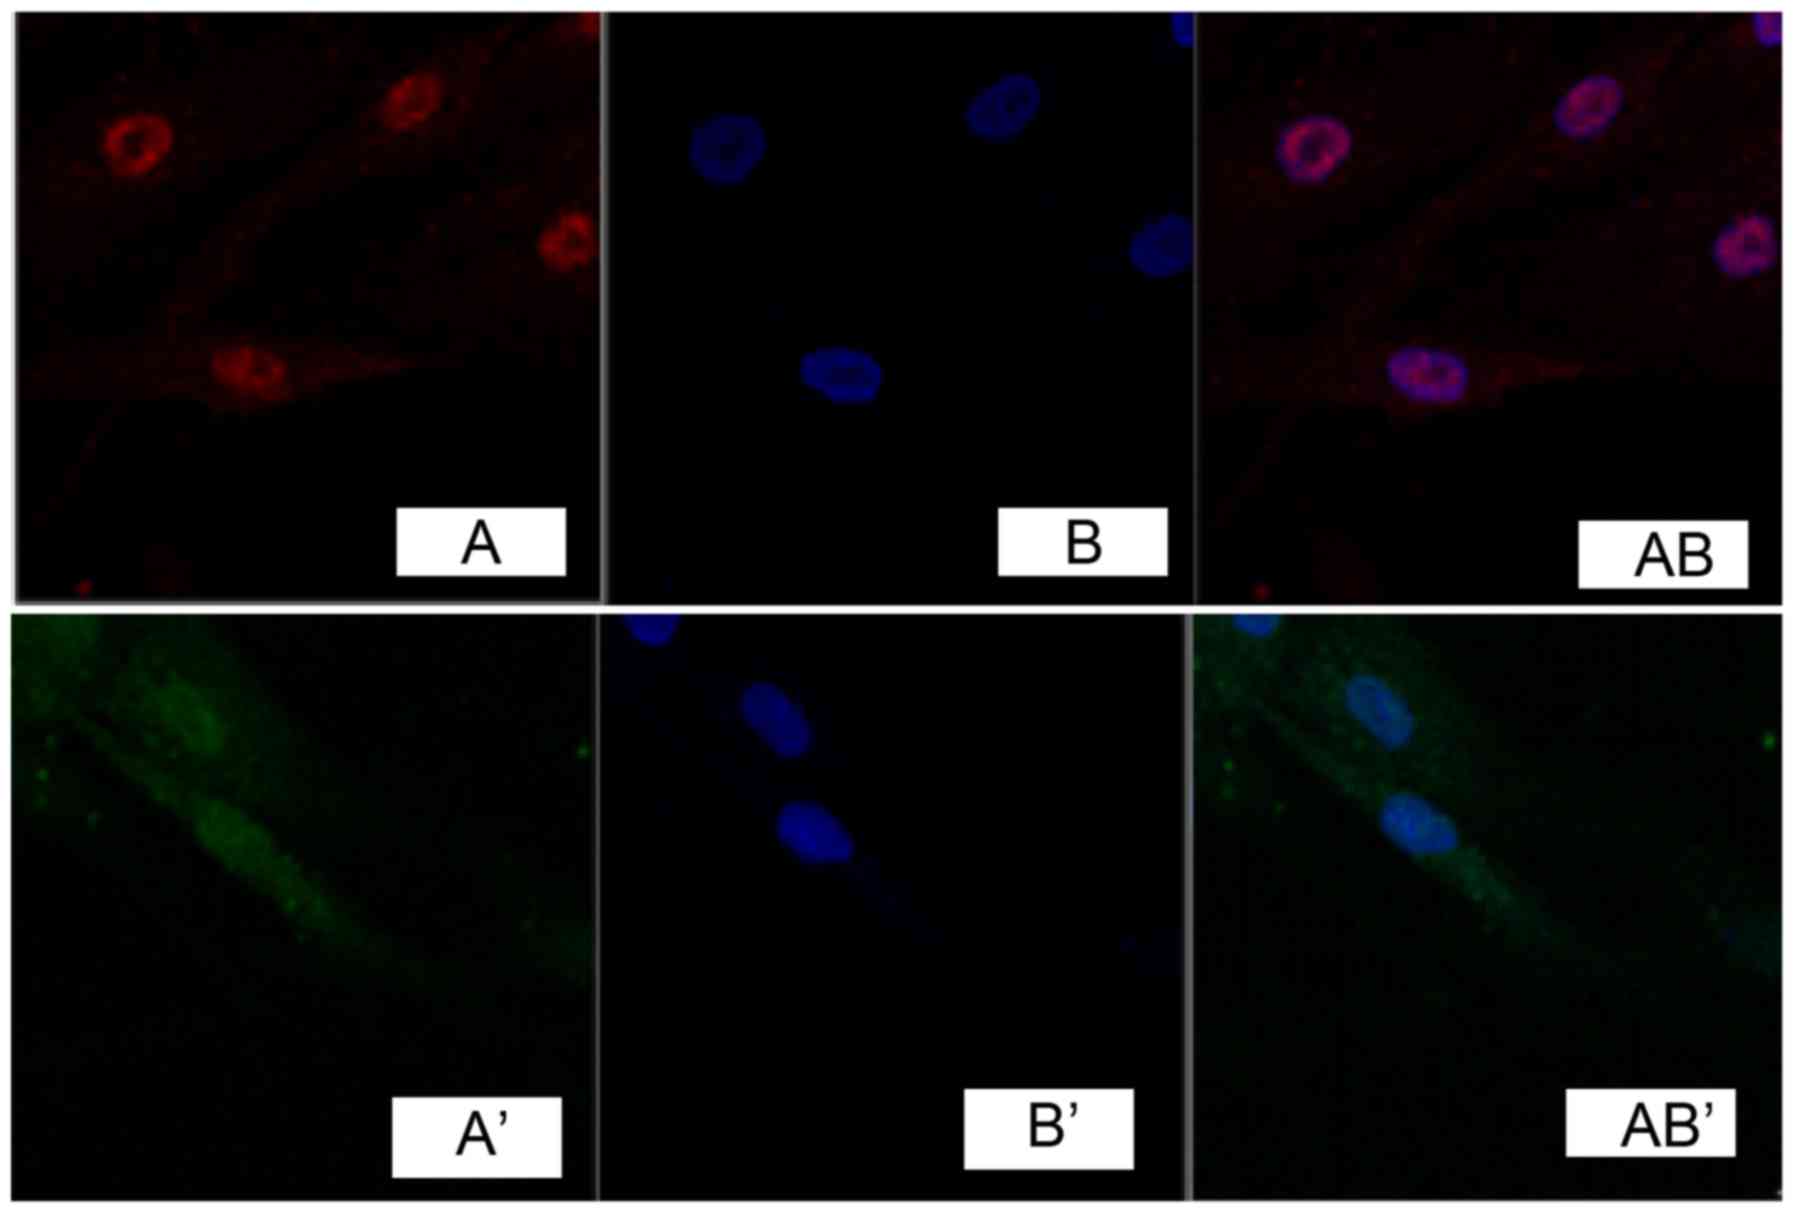
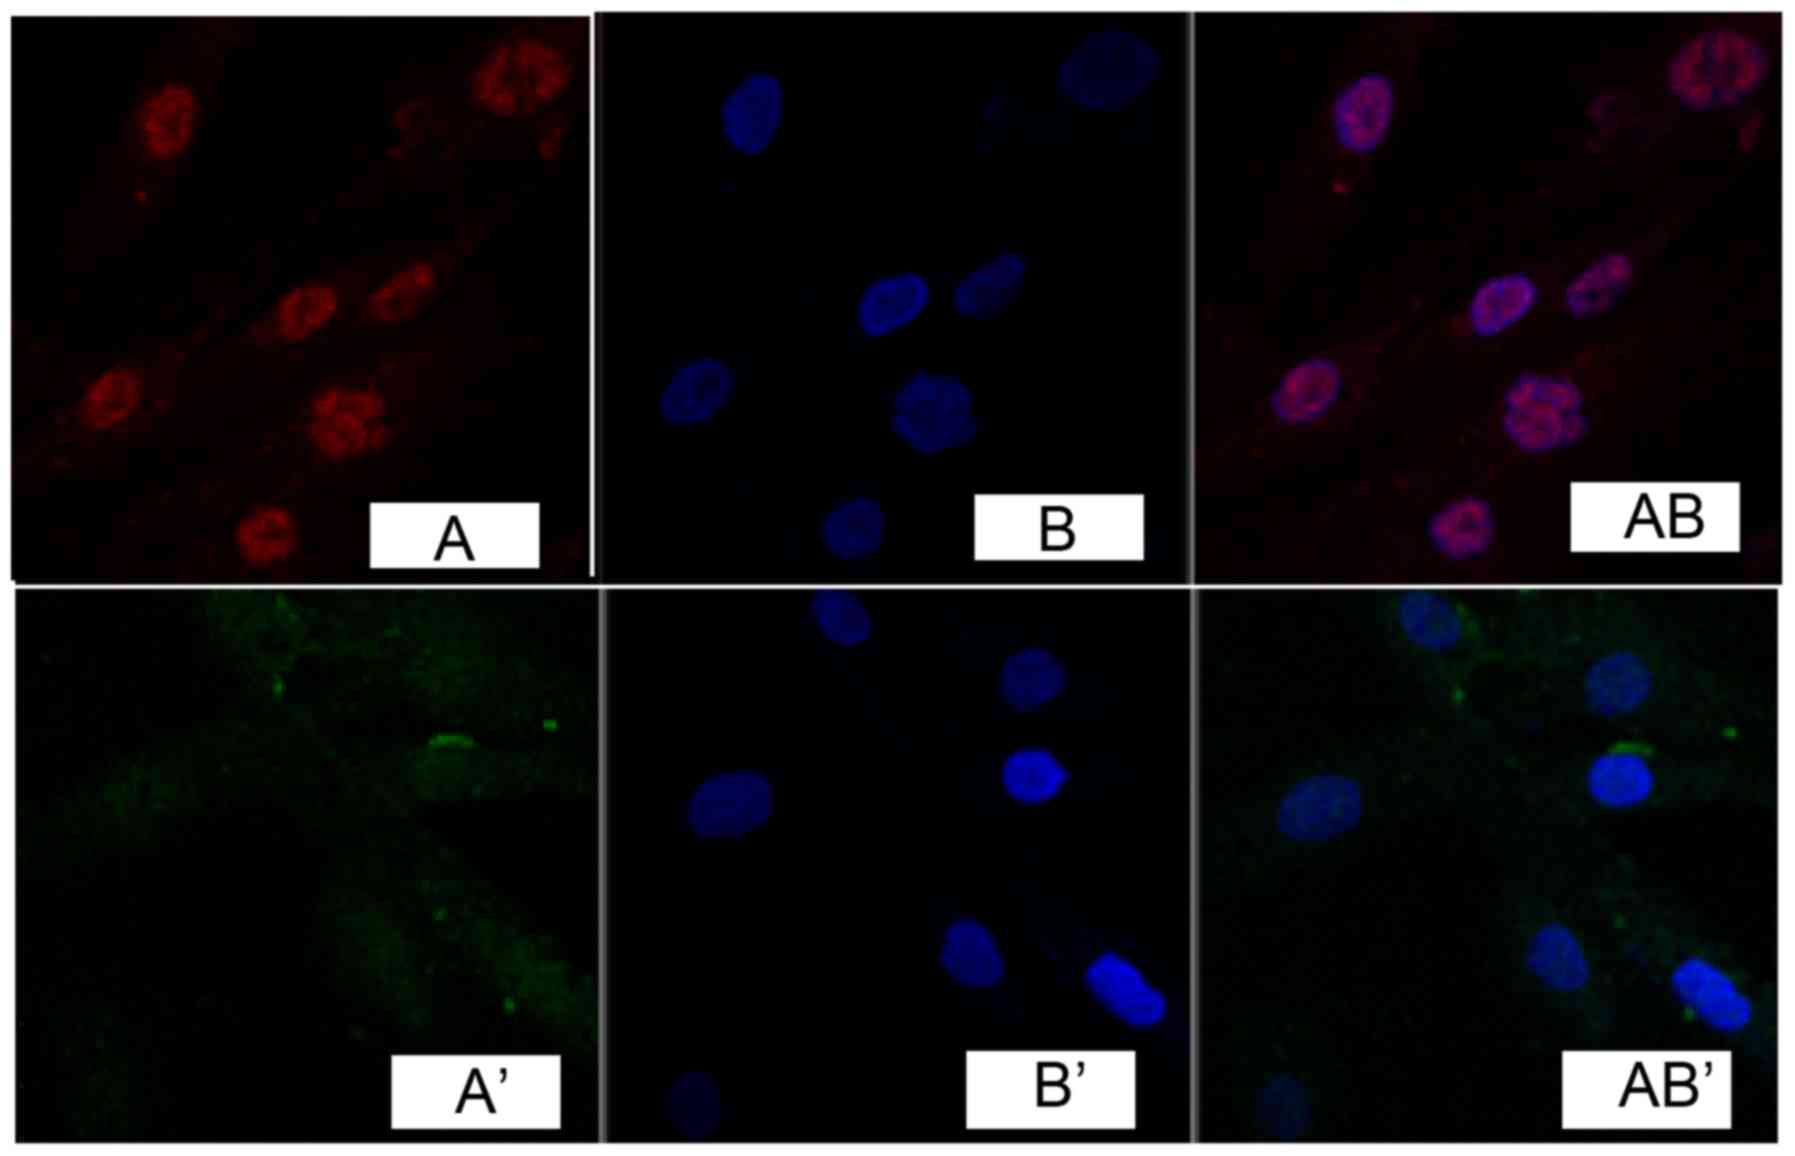
Immunocytochemistry detection showed that, phosphatidylinositol
3-kinase (PI3K) and Akt were expressed in the cell nucleus in
pathological scar fibroblasts (Figs.
2 and 3), while no obvious
expression was found in normal skin tissue (Figs. 2 and 3).
RT-PRC result
Relative quantities of the expression of TGF-β1,
PI3K, ATK and mTOR mRNA in pathological scar fibroblasts were
significantly higher (P<0.05) than those observed in normal skin
tissue (Table II).
| Table II.mRNA relative expression quantities of
TGF-β1, PI3K, Akt, and mTOR in the two groups. |
Table II.
mRNA relative expression quantities of
TGF-β1, PI3K, Akt, and mTOR in the two groups.
| Groups | TGF-β1 | PI3K | Akt | mTOR |
|---|
| Normal skin | 1.014±0.203 | 1.005±0.121 | 1.014±0.197 | 1.002±0.047 |
| Pathological
scar |
3.563±0.349a |
4.598±0.558b |
3.136±0.219c |
5.799±0.227d |
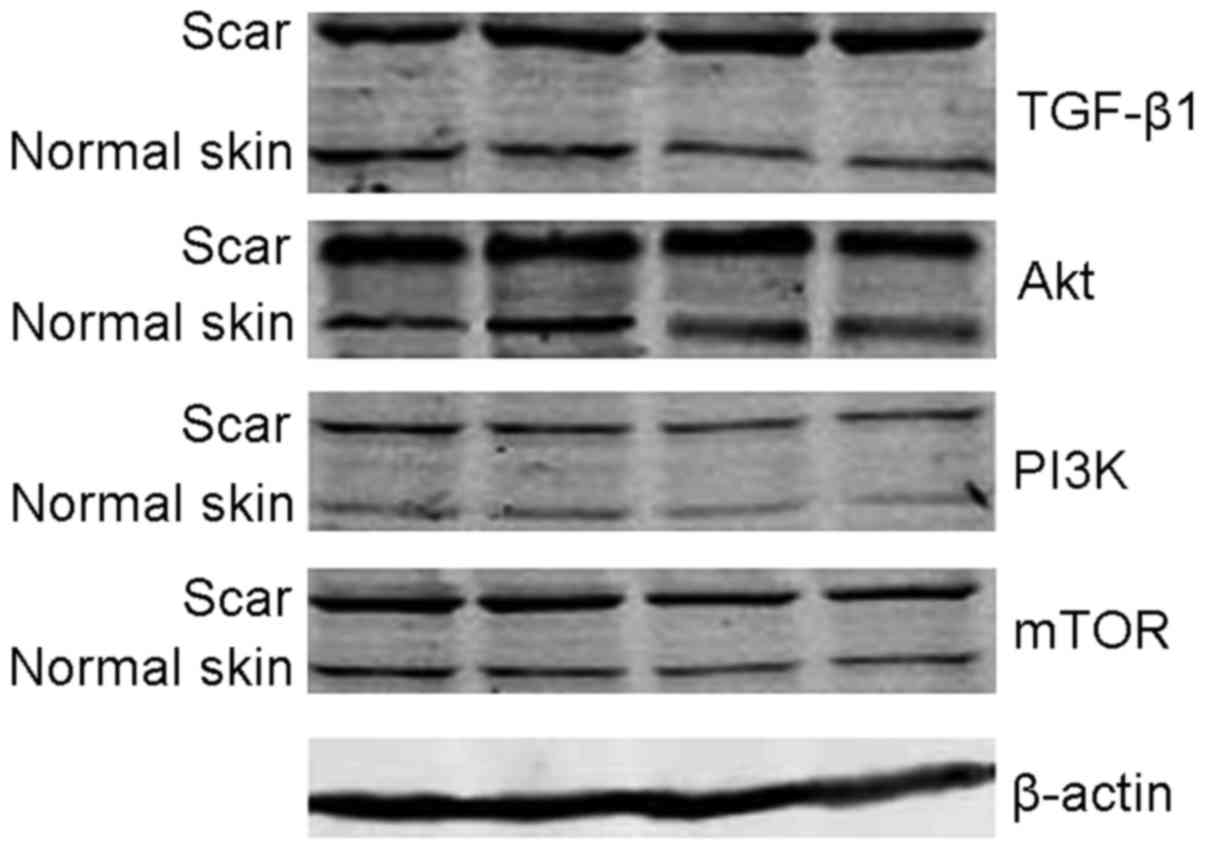
Western blot analysis
The analysis of Image Pro-Plus imaging analysis
system revealed that, relative expression quantities of TGF-β1,
PI2K, Akt and mTOR protein in pathological scar fibroblasts were
higher than those in normal skin tissue, and there were significant
differences between two groups (P<0.05) (Table III and Fig. 4).
| Table III.The protein relative expression
quantities of TGF-β1, PI3K, Akt, and mTOR in the two groups. |
Table III.
The protein relative expression
quantities of TGF-β1, PI3K, Akt, and mTOR in the two groups.
| Groups | TGF-β1 | PI3K | Akt | mTOR |
|---|
| Normal skin | 0.717±0.074 | 0.636±0.064 | 0.552±0.054 | 0.895±0.102 |
| Pathological
scar |
1.439±0.047a |
1.380±0.052b |
1.879±0.063c |
1.695±0.069d |
Discussion
The excessive proliferation of fibroblast and its
increasing activity played a critical role in the formation process
of pathological scar. After the occurrence of trauma, the
fibroblast at injured sites proliferates in a large number. Its
synthesis and the number of extracellular matrix, including
collagen secretion, began to increase 5–6 days after injuries. The
proliferation and activation of pathological scar fibroblasts were
regulated and controlled by various cytokines, including (TGF-β1),
connective tissue growth factor, hyaluronic acid stimulating
factor, interleukin (7),
insulin-like growth factor (8) and
tumor necrosis factor. Under certain circumstances, these cytokines
led to the proliferation of fibroblasts through several links and
the increased collagen synthesis with decreased decomposition,
which led to massive deposit of collagen and the formation of
pathological scar (9). TGF-β1 is
the cytokine most closely related to scars and is a strong
chemotactic factor of fibroblasts. It can act on cells in a direct
or indirect manner, and exerts independent or synergistic effects
of paracrine and autocrine to generate three types of important
biological effects, i.e., chemotactic migration, proliferation and
differentiation as well as synthesis and secretion.
Life process is a biochemical reaction process on
the basis of cell signal transduction, as are wound healing and
scar formation. Therefore, during the process of the formation of
pathological scar, excessive proliferation of fibroblasts was the
result of integrated response of cells to the stimulation of
various extracellular signals (including TGF-β1). Since this
integrated response was completed in cells, it inevitably involved
the process of cell signal transduction. The process of cell signal
transduction was inseparable for the biological activity of TGF-β1.
At present, more studies focused on typical TGF-β1/Smads signal
pathway; however, this did not fully reveal the specific mechanism
of the formation of keloid fibroblasts as the formation of keloid
involved multiple genes and multiple signal pathways is a very
complicated process. In recent years, an increasing number of
studies have shown that independent Smad pathway, in addition to
the typical Smad pathway, are involved in the transduction process
of TGF-β1 signals. Some of the pathways were involved directly or
indirectly during tumor formation and were closely related to the
proliferation, invasion and transfer of tumor (3).
Tumor-related genes are involved in the process of
formation of keloid (10,11). Some methods and drugs for treating
tumor were also effective for keloid (12). These indicated great significance
for studying pathological scar. The mTOR signaling pathway is
considered important in the process of TGF-β1 signal transduction.
For instance, the level of mTOR mRNA and protein expression
increased during the process of TGF-β1-induced EMT related to
tumorigenesis as well as migration and invasion. As the main
signaling pathway that regulates and controls protein synthesis,
the mTOR signaling pathway was involved in cell regulation such as
proliferation and differentiation, was identified in previous
studies, and gradually became a research hotspot, especially in
studies on tumor. The mTOR signal pathway includes upstream PI3K,
protein kinase B (PKB, also known as Akt), phosphatase and tensin
homolog (PTEN) deleted on chromosome 10 and tuberous sclerosis
complex 1/2 (TSC 1/2) (13), of
which PTEN is a negative feedback regulating factor; downstream
ribosomal protein S6 kinase (S6K), eukaryotic cell interpretation
initiation factor 4E binding protein (4EBP) (14) and both of them are key regulatory
factors of protein translation. After extracellular signal combines
with transmembrane tyrosine kinase receptor, receptor tyrosine
residues were phosphorylated to be activated. Thus, combined with
regulatory subunit p85 of PI3K leads to PI3K activation. The
stimulated PI3K can activate downstream Akt (15). Activated Akt can directly stimulate
mTOR or mTOR signal by inhibiting the formation of TSC 1/2. mTOR is
the regulator key for protein synthesis and stimulated mTOR acts on
two main downstream target proteins, i.e., S6K and 4EBP. Recent
studies proved that mTOR gene was closely related to abnormal cell
proliferation and its expression in the occurrence of many tumors,
including glioma, esophageal cancer and colorectal cancer (5), markedly increased. Pathologically,
pathological scar belongs to benign solid tumor. Keloid can
invasively grow to surrounding normal tissues and its pathological
characteristics are very similar to that of tumor, with tumor-like
characteristics. This is an indication suggesting that the mTOR
signaling pathway may be important in the process of the
proliferation of pathological scar fibroblasts. To prove the
hypothesis, this study group implemented some explorations on the
subject.
The present study applied cellular
immunofluorescence to detect the expression of key molecules of
TGF-β1/mTOR signaling pathway, and found the obviously strengthened
expression of TGF-β1, PI3K and Akt in pathological scar
fibroblasts, mainly in cell nucleus, without obvious expression in
fibroblasts of normal skin tissue. The results of RT-PCR and
western blot detection showed that the quantity of expression of
TGF-β1, PI3K, Akt, and mTOR mRNA and protein in pathological scar
fibroblasts was obviously higher than that of fibroblasts of normal
skin tissue, with statistically significant differences
(P<0.05). Additionally, there was abnormally activated
TGF-β1/mTOR signal pathway in pathological scar fibroblasts, which
may be the important mechanism in the formation of pathological
scar and may achieve some breakthroughs to prevent and successfully
treat pathological scar by taking the key molecules of this signal
pathway as target spots. However, it is unclear which approach
could be used by abnormally activated TGF-β1/mTOR signaling pathway
promoting excessive proliferation and activation of pathological
scar fibroblasts that require implementation of further
explorations.
References
|
1
|
van der Veer WM, Bloemen MC, Ulrich MM,
Molema G, Van Zuijlen PP, Middelkoop E and Niessen FB: Potential
cellular and molecular causes of hypertrophic scar formation.
Burns. 35:15–29. 2009. View Article : Google Scholar : PubMed/NCBI
|
|
2
|
Rhett JM, Ghatnekar GS, Palatinus JA,
O'Quinn M, Yost MJ and Gourdie RG: Novel therapies for scar
reduction and regenerative healing of skin wounds. Trends
Biotechnol. 26:173–180. 2008. View Article : Google Scholar : PubMed/NCBI
|
|
3
|
Sun Q, Guo S, Wang CC, Sun X, Wang D, Xu
N, Jin SF and Li KZ: Cross-talk between TGF-β/Smad pathway and
Wnt/β-catenin pathway in pathological scar formation. Int J Clin
Exp Pathol. 8:7631–7639. 2015.PubMed/NCBI
|
|
4
|
Huang LP, Mao Z, Zhang L, Liu XX, Huang C
and Jia ZS: Screening of differentially expressed genes in
pathological scar tissues using expression microarray. Genet Mol
Res. 14:10743–10751. 2015. View Article : Google Scholar : PubMed/NCBI
|
|
5
|
Steelman LS, Chappell WH, Abrams SL, Kempf
RC, Long J, Laidler P, Mijatovic S, Maksimovic-Ivanic D, Stivala F,
Mazzarino MC, et al: Roles of the Raf/MEK/ERK and
PI3K/PTEN/Akt/mTOR pathways in controlling growth and sensitivity
to therapy-implications for cancer and aging. Aging (Albany NY).
3:192–222. 2011. View Article : Google Scholar : PubMed/NCBI
|
|
6
|
Lamouille S, Connolly E, Smyth JW, Akhurst
RJ and Derynck R: TGF-β-induced activation of mTOR complex 2 drives
epithelial-mesenchymal transition and cell invasion. J Cell Sci.
125:1259–1273. 2012. View Article : Google Scholar : PubMed/NCBI
|
|
7
|
Ghazizadeh M, Tosa M, Shimizu H, Hyakusoku
H and Kawanami O: Functional implications of the IL-6 signaling
pathway in keloid pathogenesis. J Invest Dermatol. 127:98–105.
2007. View Article : Google Scholar : PubMed/NCBI
|
|
8
|
Ishihara H, Yoshimoto H, Fujioka M,
Murakami R, Hirano A, Fujii T, Ohtsuru A, Namba H and Yamashita S:
Keloid fibroblasts resist ceramide-induced apoptosis by
overexpression of insulin-like growth factor I receptor. J Invest
Dermatol. 115:1065–1071. 2000. View Article : Google Scholar : PubMed/NCBI
|
|
9
|
van den Bogaerdt AJ, van der Veen VC, Van
Zuijlen PP, Reijnen L, Verkerk M, Bank RA, Middelkoop E and Ulrich
MM: Collagen cross-linking by adipose-derived mesenchymal stromal
cells and scar-derived mesenchymal cells: Are mesenchymal stromal
cells involved in scar formation? Wound Repair Regen. 17:548–558.
2009. View Article : Google Scholar : PubMed/NCBI
|
|
10
|
Chen W, Fu X, Sun T, Sun X, Zhao Z and
Sheng Z: Change of gene expression of transforming growth
factor-beta1, Smad 2 and Smad 3 in hypertrophic scars skins.
Zhonghua Wai Ke Za Zhi. 40:17–19. 2002.(In Chinese). PubMed/NCBI
|
|
11
|
Teofoli P, Barduagni S, Ribuffo M,
Campanella A, De Pita' O and Puddu P: Expression of Bcl-2, p53,
c-jun and c-fos protooncogenes in keloids and hypertrophic scars. J
Dermatol Sci. 22:31–37. 1999. View Article : Google Scholar : PubMed/NCBI
|
|
12
|
Kleinerman R, Kilmer SL and Chotzen VA:
Mitomycin C in the treatment of keloids: A case and review. J Drugs
Dermatol. 12:701–703. 2013.PubMed/NCBI
|
|
13
|
Matsuoka T and Yashiro M: The role of
PI3K/Akt/mTOR signaling in gastric carcinoma. Cancers (Basel).
6:1441–1463. 2014. View Article : Google Scholar : PubMed/NCBI
|
|
14
|
Gomez-Pinillos A and Ferrari AC: mTOR
signaling pathway and mTOR inhibitors in cancer therapy. Hematol
Oncol Clin North Am. 26:483–505. 2012. View Article : Google Scholar : PubMed/NCBI
|
|
15
|
Xavier S, Niranjan T, Krick S, Zhang T, Ju
W, Shaw AS, Schiffer M and Böttinger EP: TbetaRI independently
activates Smad- and CD2AP-dependent pathways in podocytes. J Am Soc
Nephrol. 20:2127–2137. 2009. View Article : Google Scholar : PubMed/NCBI
|