Introduction
Osteoporotic fracture is a common event in the
elderly, resulting in substantial mortality, and the mortality rate
of hip fracture for 6 months is ~10–20% (1). The prevalence of osteoporotic
fractures, hip fractures in particular, is increasing in many
regions of the world (2). Current
therapies focus on the prevention and treatment of osteoporotic
fractures; however, this may easily lead to complications, thus it
remains a worldwide public health concern. Therefore, a greater
understanding of the underlying molecular mechanisms of fracture
healing in the osteoporotic bone is required, as well as
identifying candidate biomarkers for osteoporotic fracture
therapies.
Over the past few years, a number of remarkable
achievements have been made in the genetic study of fracture
healing in osteoporosis. One such study demonstrated that
transgenesis of bone morphogenetic protein-2 promotes fracture
healing in osteoporosis by inducing increased callus density and a
larger cross-sectional callus area (3). During remodeling of fractured bone,
parathyroid hormone (PTH) promotes the formation of osteoclasts to
restore the mechanical strength and structure of bones, and
polymorphisms in genes encoding PTH influence the genetic
regulation of bone mineral density (4). Low density lipoprotein
receptor-related protein 5 (LRP5) serves a significant
functional role in skeletal homeostasis, and mutations in
LRP5 induce a variety of bone density-associated diseases
(5). Lrp5 deficiency
results in decreased osteoblast proliferation and function, which
induces a low bone mass phenotype (6). Kringle containing transmembrane
protein 2 (KREMEN2), also known as KRM2, is a
high-affinity transmembrane receptor of dickkopf homolog 1, and is
thought to be a regulator of bone remodeling (7). It has been demonstrated that
Krm2−/− mice develop a high bone mass phenotype
and overexpression of Krm2 in type I collagen
(Col1a1)-Krm2 transgenic mice induces severe osteoporosis
with decreased levels of osteoblasts and elevated osteoclast
differentiation (8). Using a model
of fracture healing in Col1a1-Krm2 transgenic mice and
Lrp5−/− mice, a previous study revealed that
fracture healing is greatly damaged in Col1a1-Krm2
transgenic mice and Lrp5−/− mice; however, the
Col1a1-Krm2 mice were more severely impaired than
Lrp5−/− mice (9). In addition, this previous study
identified a set of differentially expressed genes (DEGs) in the
two mouse models using microarray analysis (9). However, DEG interactions and
functions require further investigation in order to provide a more
comprehensive understanding of the effect of osteoporosis on
fracture healing.
In order to investigate the interactions and
functions of DEGs in Col1a1-Krm2 transgenic mice and
Lrp5−/− mice further, the microarray data
obtained by Liedert et al (9) were analyzed in the present study.
Following identification of DEGs, enrichment analysis was
performed. In addition, protein-protein interactions (PPIs) of DEGs
and hub genes in the PPI network were analyzed. Furthermore,
coexpression associations between hub genes and additional DEGs
were examined. These results may contribute to a greater
understanding of the effect of osteoporosis on fracture healing,
and provide novel information that facilitates the development of
future clinical therapies for osteoporotic fractures.
Materials and methods
Affymetrix microarray data
The raw gene expression profile dataset GSE51686
(9) was obtained from the Gene
Expression Omnibus (GEO) database (http://www.ncbi.nlm.nih.gov/geo/). The data was
generated by the (Mouse430_2) Affymetrix Mouse Genome 430 2.0 Array
platform (GEO accession, GPL1261; Affymetrix, Inc., Santa Clara,
CA, USA). This dataset contained 9 fracture callus tissue samples
obtained from the femora at 10 days following osteotomy in the
wild-type (WT) mice (n=3), Col1a1-Krm2 transgenic mice with
severe osteoporosis (n=3), and Lrp5−/− mice with
low bone mass (n=3), respectively. All mice were female and 26
weeks of age.
The CEL and probe annotation files for this dataset
were downloaded. The raw expression data were preprocessed by
background correction, quantile normalization and probe
summarization using the robust microarray analysis algorithm in the
affy package (version 3.3.2) (10)
of Bioconductor (version 3.4; http://www.bioconductor.org/). Subsequently, the
org.Hs.eg.db (version 3.4.0) (11)
and illuminaHumanv3.db (version 1.26.0) (12) packages of Bioconductor were used to
translate probe identifications (IDs) to gene symbols. If one gene
symbol was matched by multiple probe IDs, the mean expression value
was selected as the expression level of this gene.
Identification of DEGs
DEGs in Col1a1-Krm2 mice and
Lrp5−/− mice compared with the WT controls were
identified using the linear models for microarray data (LIMMA)
package (version 3.30.3; http://www.bioconductor.org/packages/release/bioc/html/limma.html)
(13), which is a commonly used
tool for the identification of DEGs. The P-value for each gene was
calculated using the unpaired t-test in LIMMA, which was then
adjusted for the false discovery rate (FDR) using the
Benjamini-Hochberg method (14).
Only the genes with FDR values <0.05 and log2 fold
change values ≥0.5 were selected as DEGs.
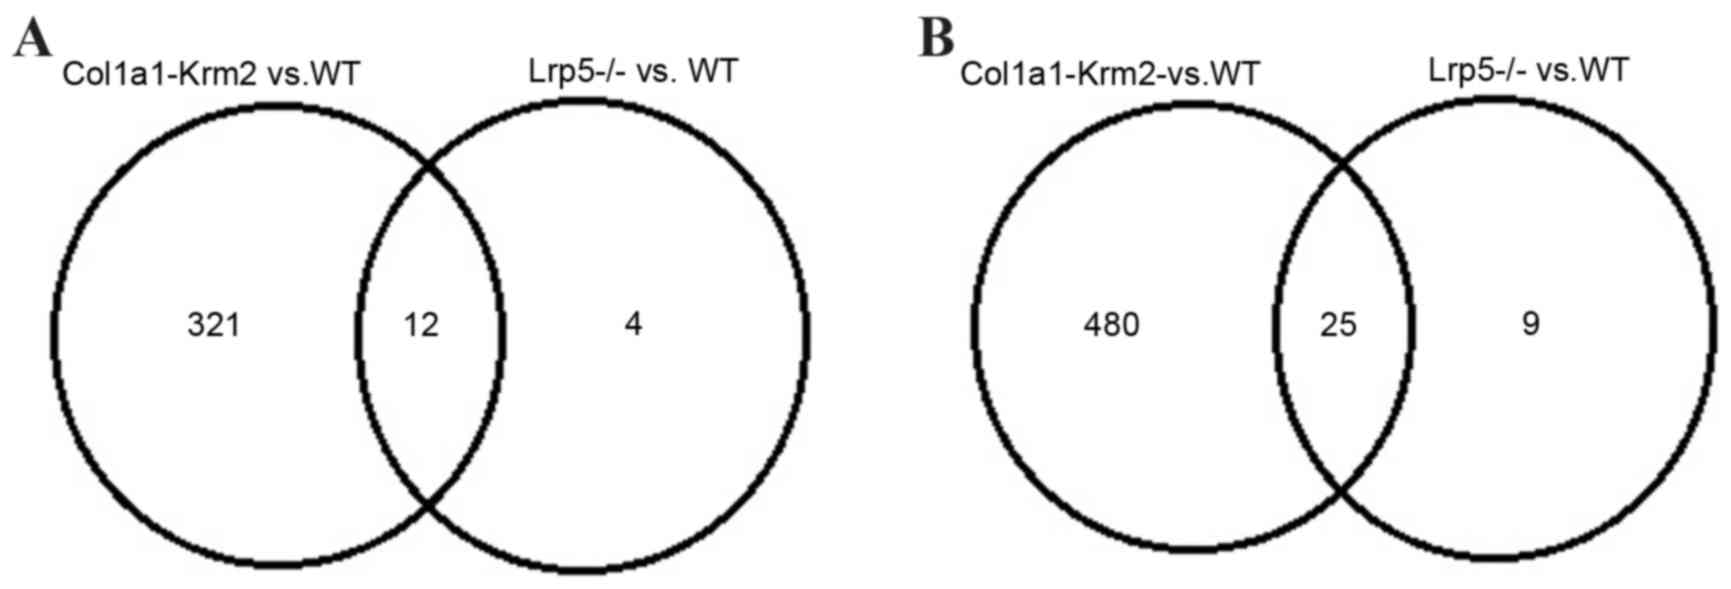
The Venny online tool (version 2.0; http://bioinfogp.cnb.csic.es/tools/venny/index.html)
(15) was utilized to construct
Venn diagrams for the upregulated and downregulated genes
identified between the Col1a1-Krm2 vs. WT and
Lrp5−/− vs. WT groups.
Enrichment analysis of DEGs
Functional Gene Ontology (GO) and Kyoto Encyclopedia
of Genes and Genomes (KEGG) pathway enrichment analyses of
upregulated and downregulated genes were performed using the
Database for Annotation Visualization and Integrated Discovery
(version 6.8; http://david.abcc.ncifcrf.gov/) database (16). The P-value was calculated using the
modified Fishers exact test, and P<0.05 was considered to
indicate a statistically significant difference. A gene count in
each term ≥2 was set as the cut-off criteria. Additional parameters
were set to the default values.
Construction of PPI networks
PPIs of DEGs were obtained from the Search Tool for
the Retrieval of Interacting Genes database (version 10.0;
http://string-db.org/), which integrates a
variety of known and predicted protein associations (17). The combined score for each PPI was
calculated, and a score of >0.4 was set as the cut-off
criterion. Additional parameters were set to the default values.
The PPI network was visualized using the Cytoscape software
(version 3.4.0; http://cytoscape.org/), which is an
open access software for visualizing biomolecular networks
(18). In the network, ‘node’
represents a gene or protein, and ‘line’ represents an interaction
between the two nodes. The degree of each node (number of
interactions with other proteins) is equal to the number of nodes
that interacted with this node.
Analysis of hub genes in the PPI
network
Hub genes refer to the relatively key genes in the
network. Hub genes were identified using three centricity methods
in the PPI network, including the degree centrality (19), betweenness centrality (20) and subgraph centrality methods
(21). The scores obtained from
the degree, betweenness and subgraph methods were calculated using
the CytoNCA plug-in (version 2.1.6) (22) in Cytoscape. High scores for the
degree, betweenness and subgraph methods indicated that the nodes
were more significant in the network. Hierarchical clustering of
hub genes with higher scores was performed using the pvclust R
package (version 1.3–2) (23).
Coexpression associations of hub genes
with DEGs
The Pearsons correlation coefficient (PCC) method
(24) was used to identify the
coexpression associations of hub genes with other DEGs. Only
coexpression associations with PCC values of >0.9 were selected
for analysis. A PCC value of >0 indicated that the two genes
were positively correlated, and a PCC value of <0 indicated that
the two genes were negatively correlated.
Results
Statistical analysis
Based on the cut-off criteria, a total of 841 DEGs
(335 upregulated and 506 downregulated) and 50 DEGs (16 upregulated
and 34 downregulated) were identified in the Col1a1-Krm2 and
Lrp5−/− mice when compared with WT mice,
respectively. When compared with WT mice, 12 of these genes were
upregulated and 25 were downregulated in the Col1a1-Krm2 and
Lrp5−/− mice (Fig.
1).
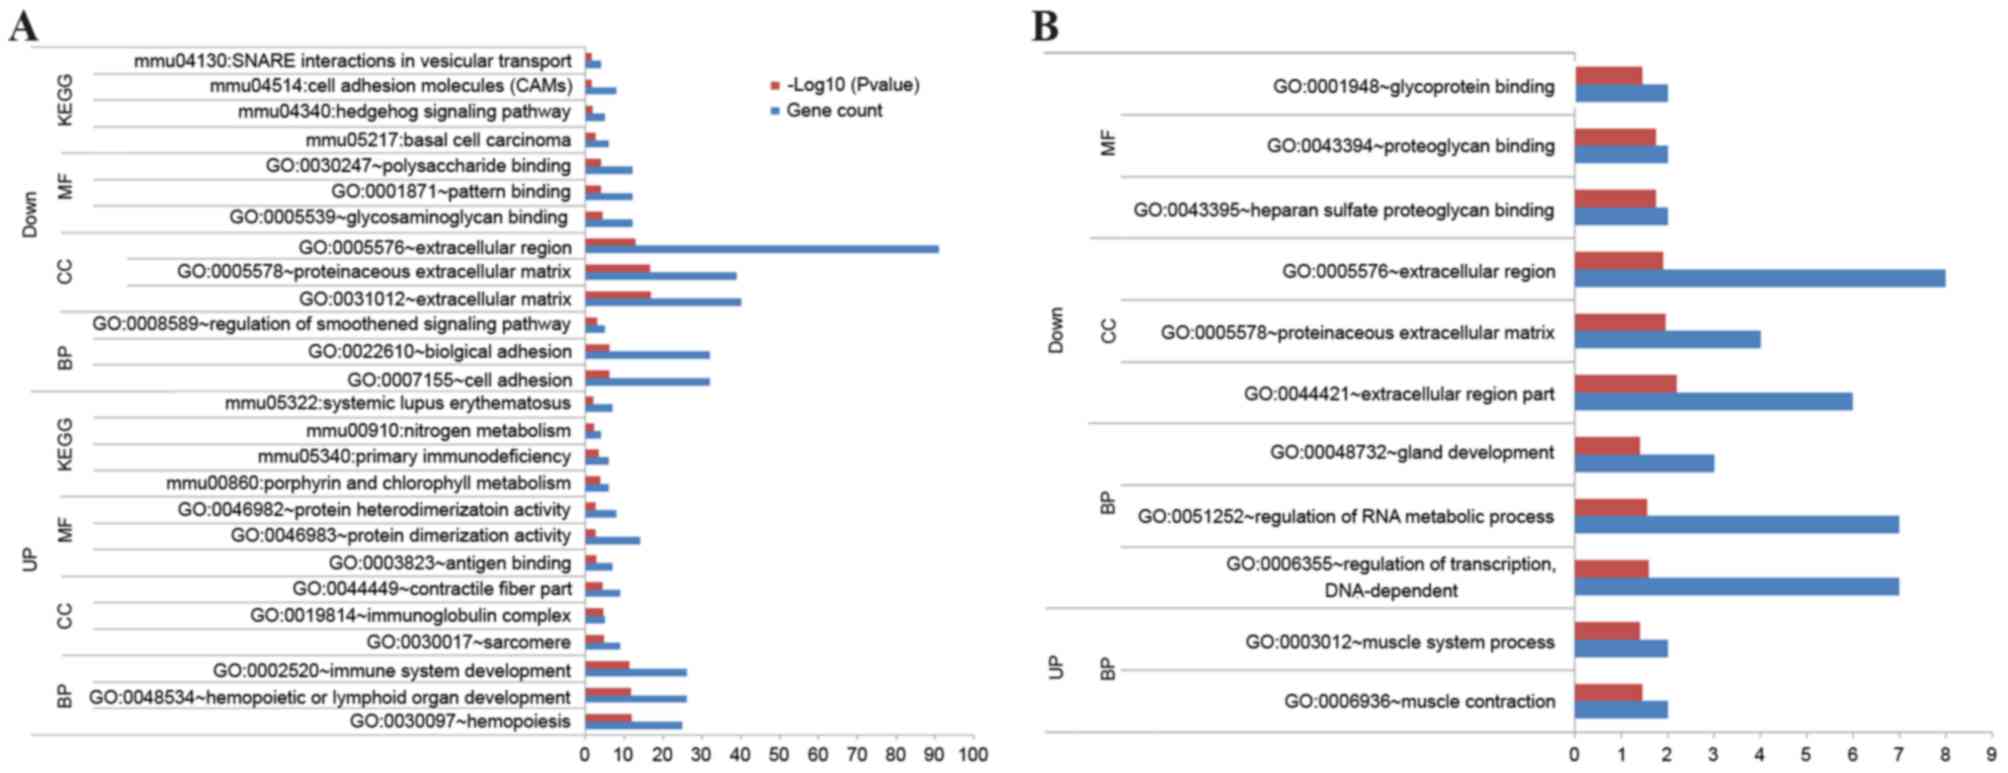
DEG function
To further reveal gene function in the two groups,
GO and KEGG pathway enrichment analyses were performed. In the
Col1a1-Krm2 vs. WT group, the upregulated genes were
primarily associated with hemopoiesis (GO: 0030097), hemopoietic or
lymphoid organ (GO: 0048534) and immune system development (GO:
0002520), as well as pathways associated with primary
immunodeficiency (mmu05340) and nitrogen metabolism (mmu00910)
(Fig. 2A). The downregulated genes
were significantly associated with cell adhesion (GO: 0007155) and
regulation of the smoothened signaling pathway, as well as the
hedgehog signaling pathway (mmu04340) and cell adhesion molecules
(mmu04514) (Fig. 2A).
In the Lrp5−/− vs. WT group, the
upregulated genes were implicated in muscle contraction (GO:
0006936) and muscle system process (GO: 0003012) (Fig. 2B). The downregulated genes were
markedly associated with the regulation of transcription (GO:
0006355) and RNA metabolic processes (GO: 0051252) (Fig. 2B). No significant pathways were
enriched by the upregulated genes.
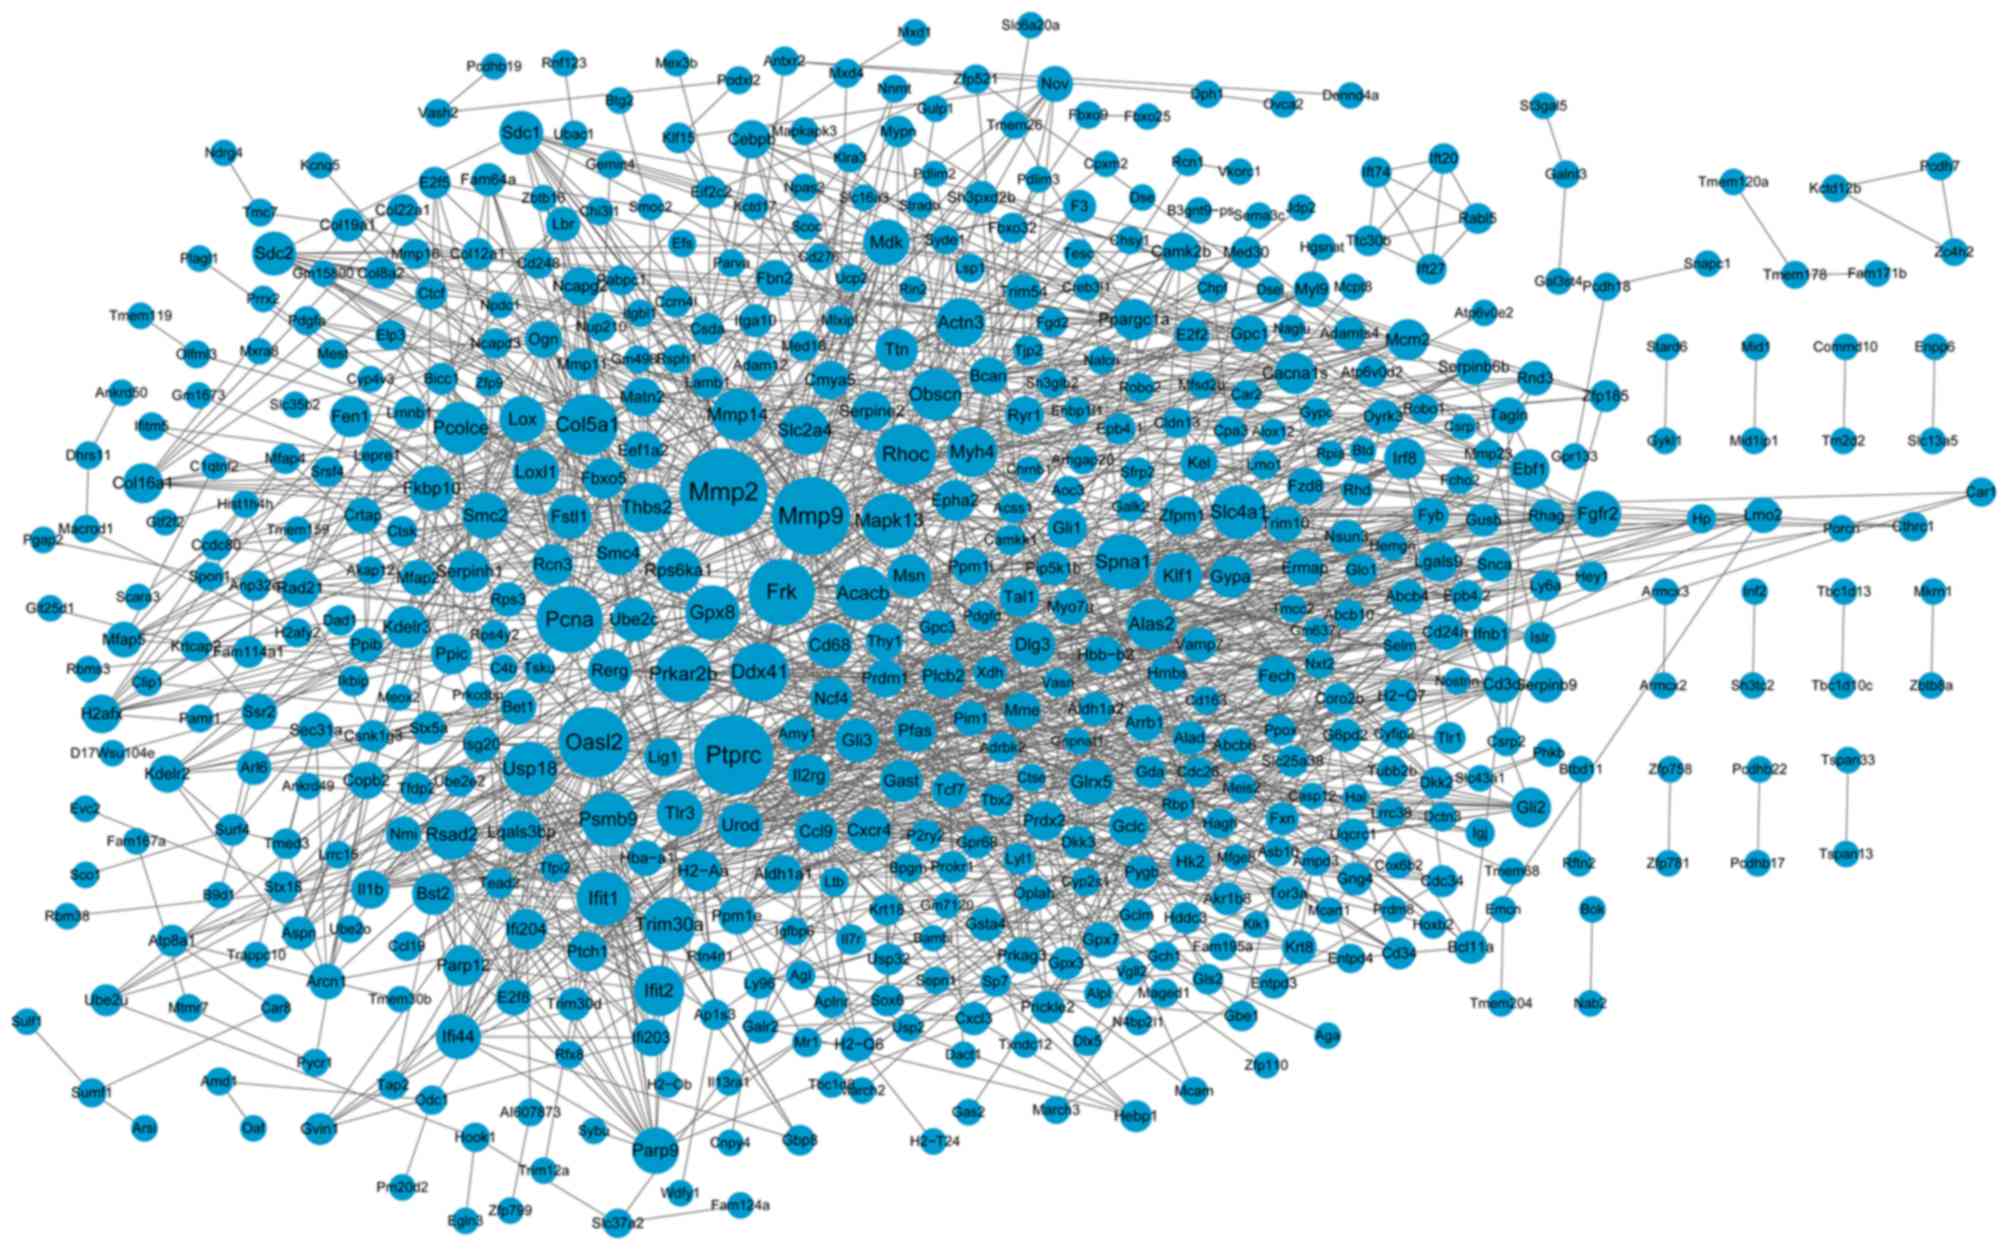
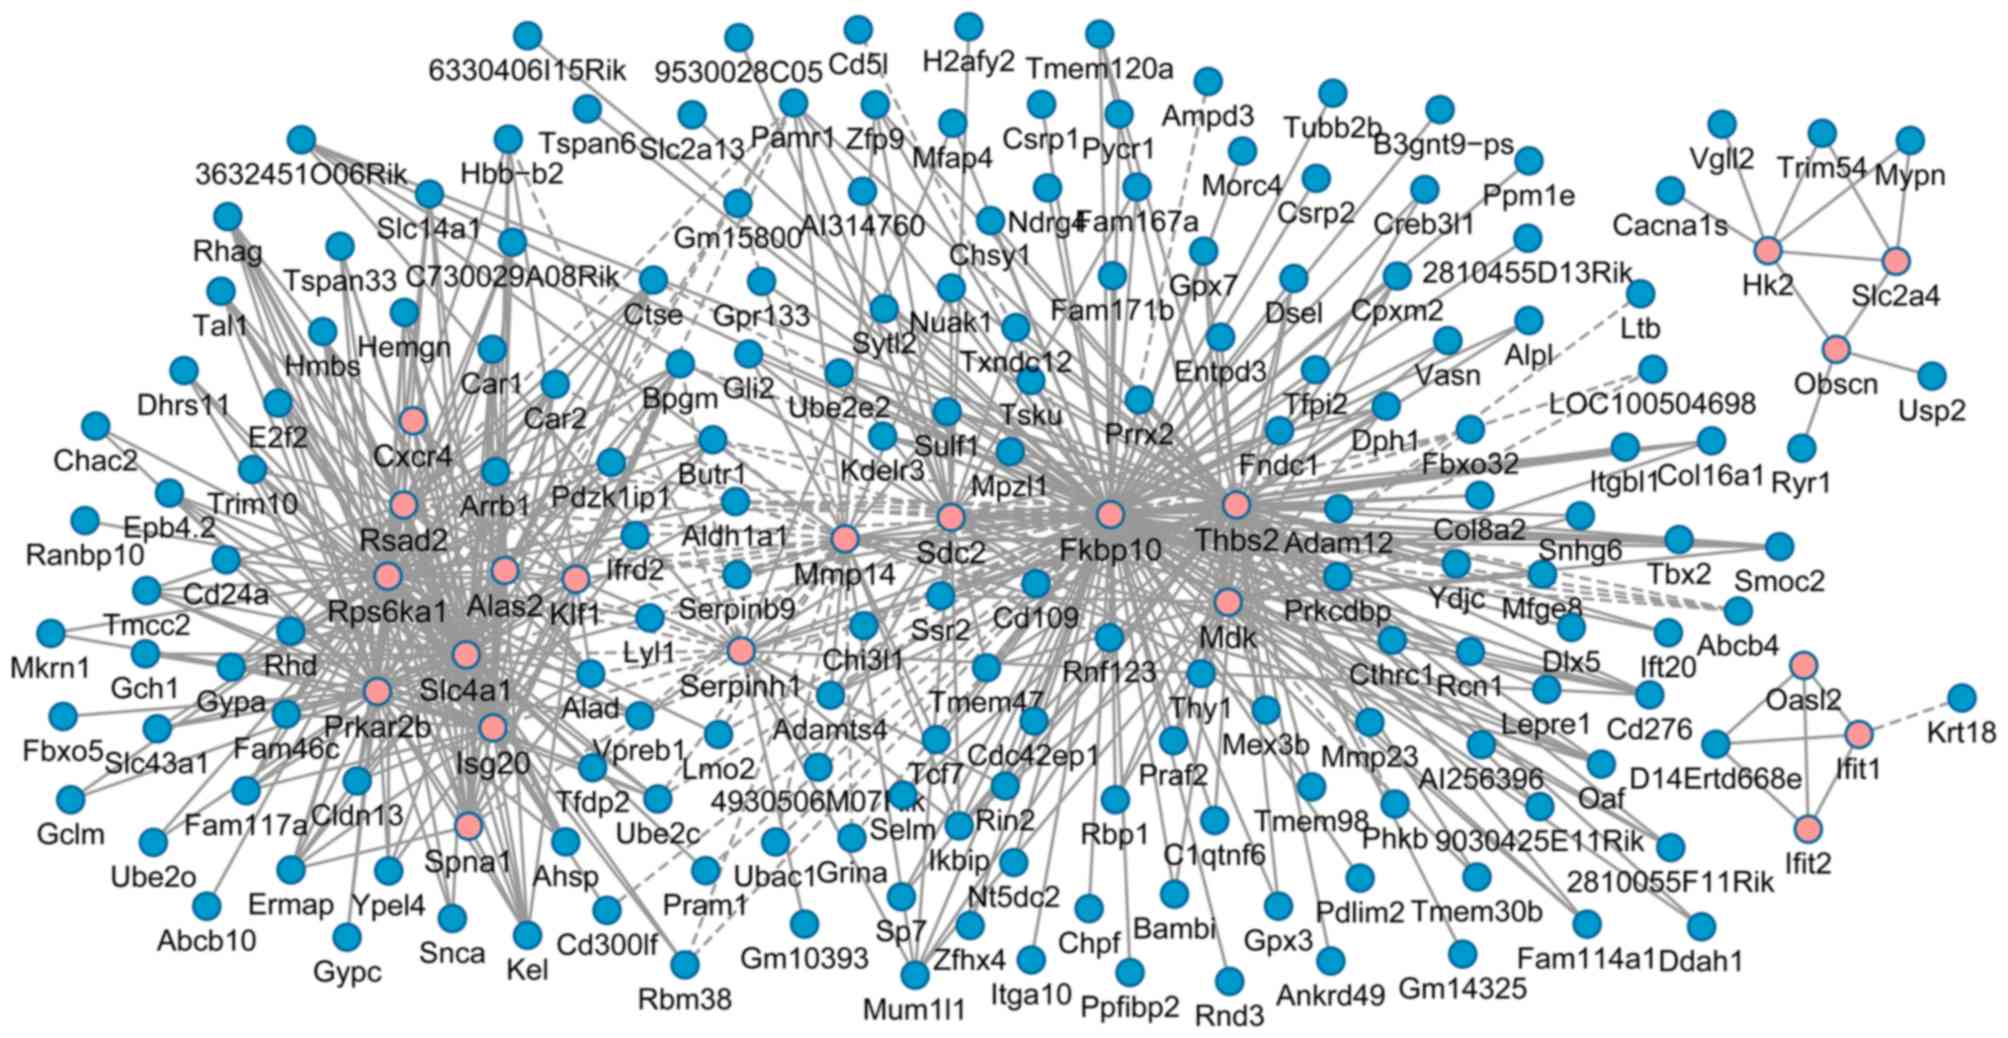
Analysis of PPI network
In order to determine interactions between DEGs, a
PPI network was constructed. The network was composed of 551 nodes
and 1,608 PPIs (Fig. 3). Based on
the centricity methods, the top 40 nodes with the highest scores in
the PPI network were selected as hub genes for further analysis,
including 2–5-oligoadneylate synthase-like protein 2
(Oasl2), thrombospondin 2 (Thbs2), syndecan 2
(Sdc2), FK506 binding protein 10 (Fkbp10), interferon
induced protein with tetratricopeptide repeats (Ifit) 1 and
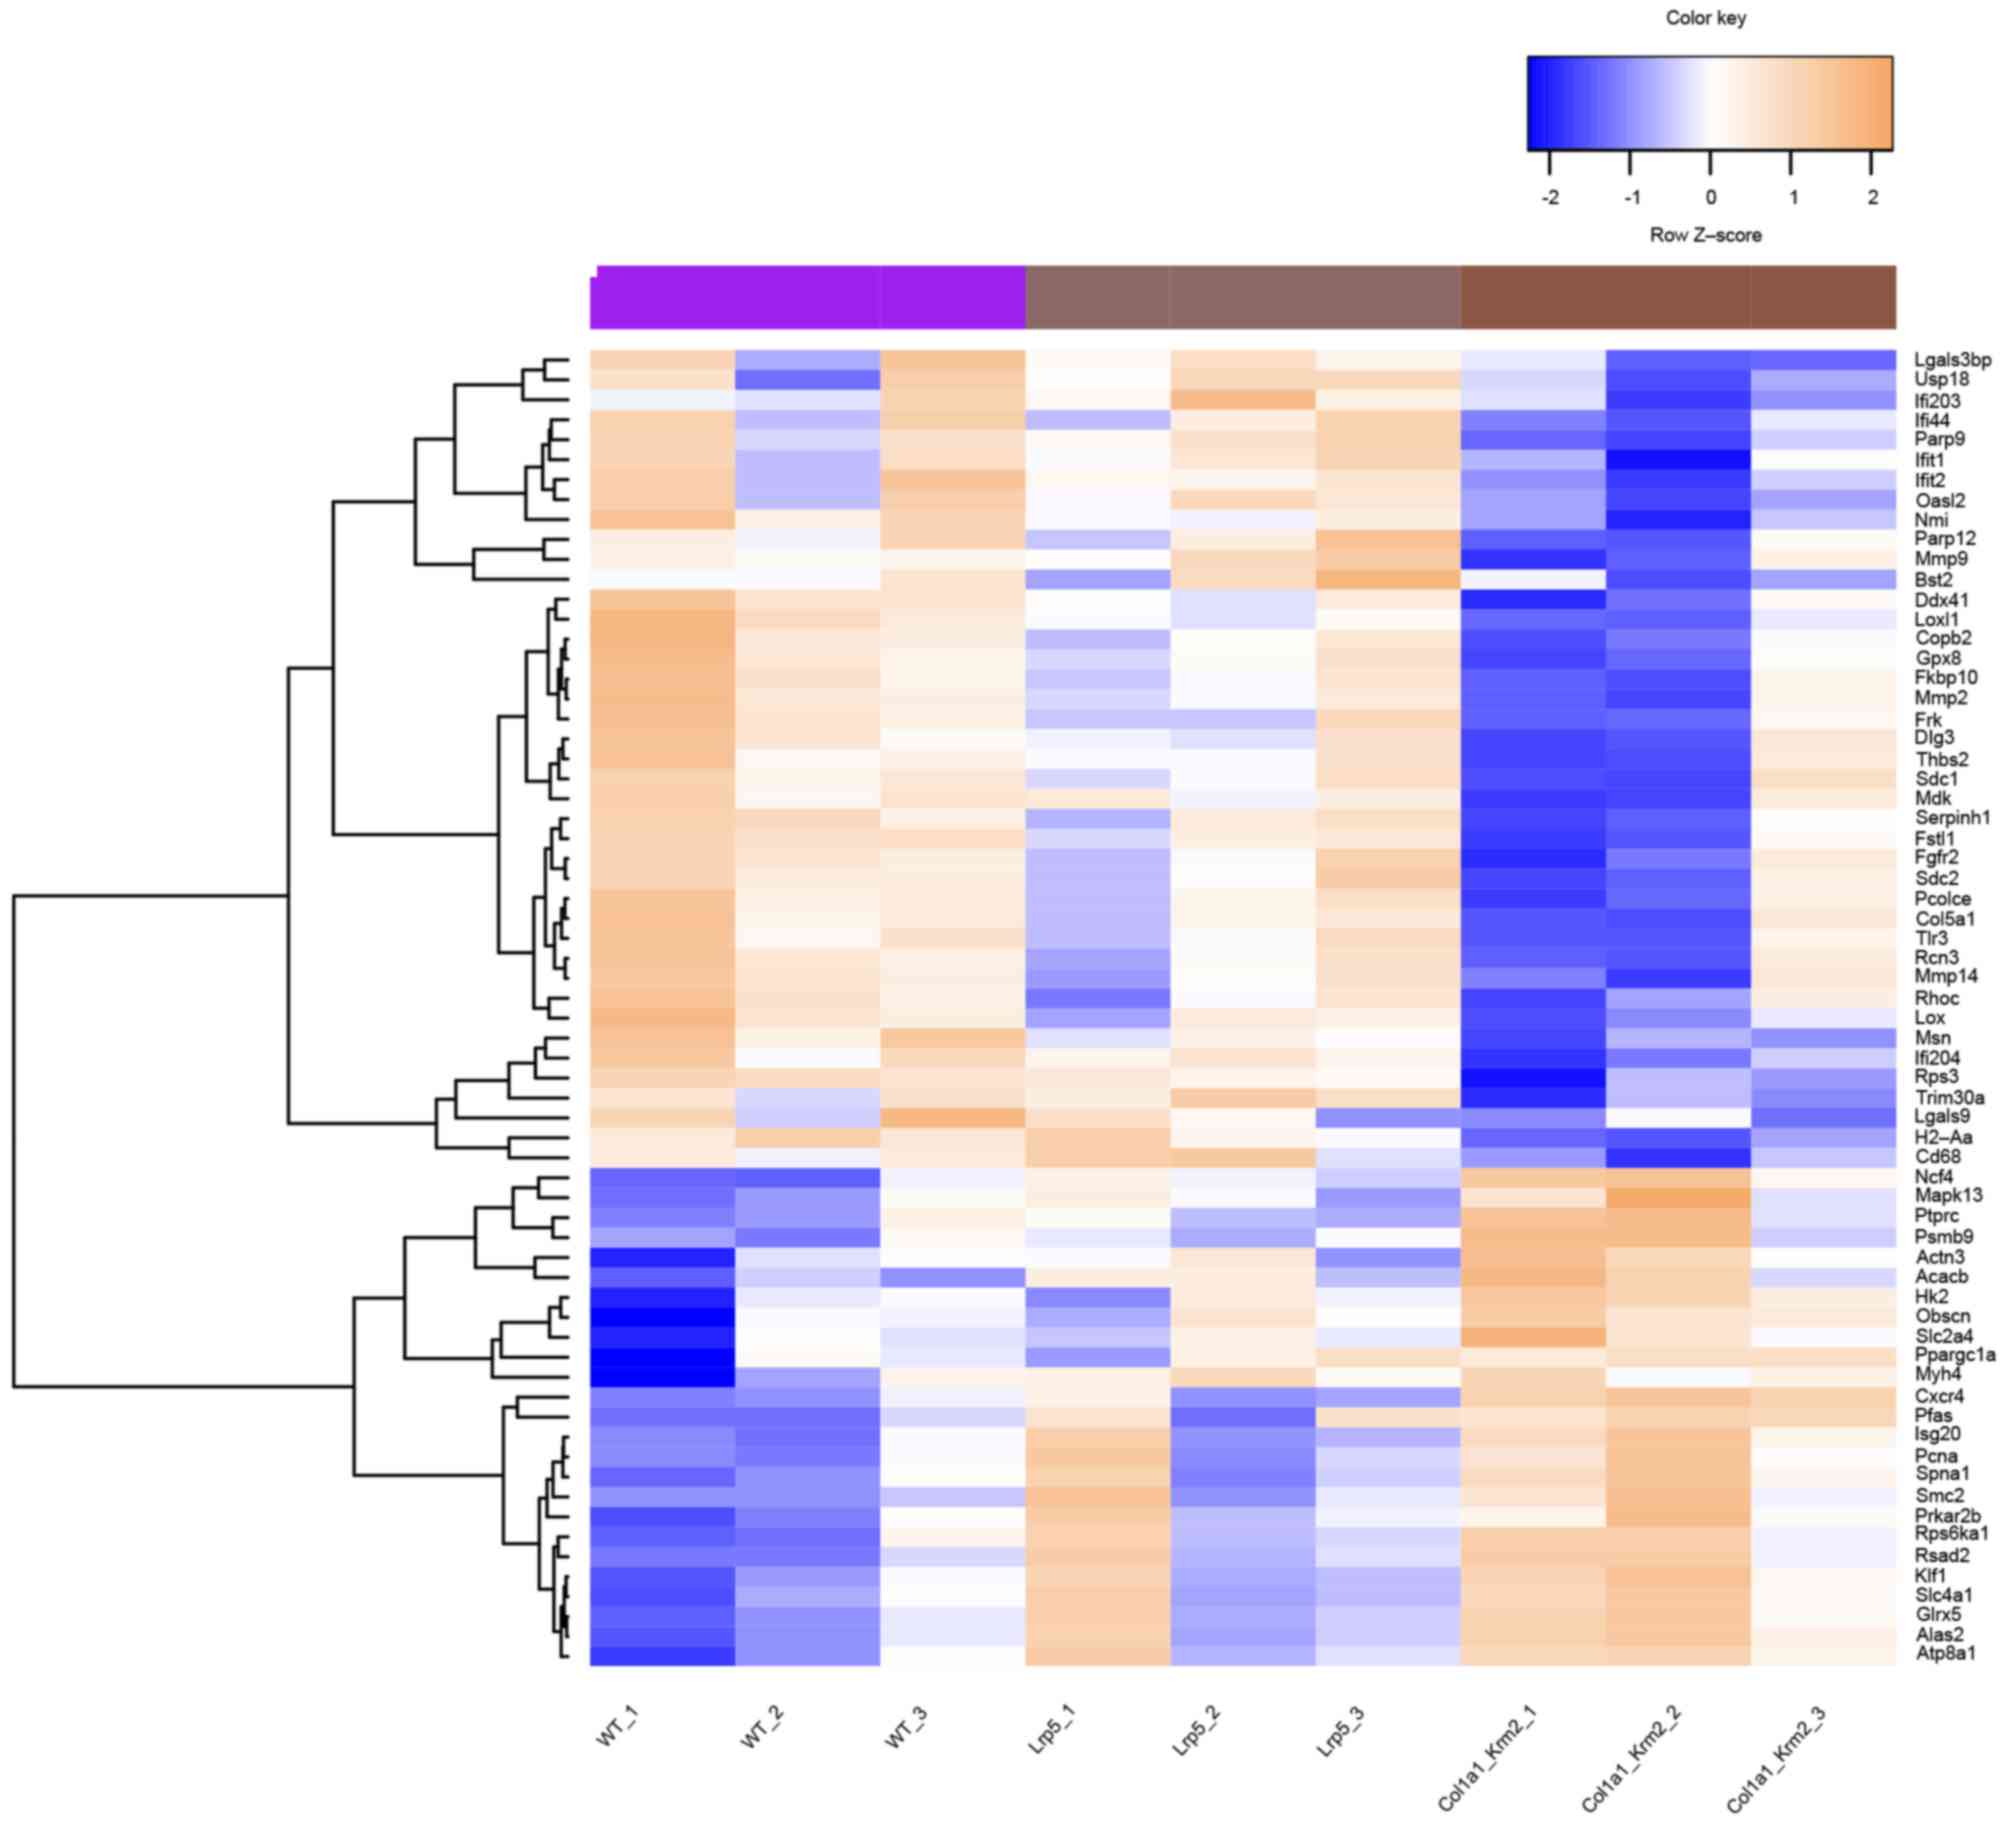
Ifit2 (Table I). Following
the removal of duplicates in Table
I, a total of 66 genes remained, which were clustered into two
groups and used to distinguish the WT, Col1a1-Krm2 and
Lrp5−/− samples in a heat map (Fig. 4).
 | Table I.Top 40 nodes with a high score in the
protein-protein interaction network. |
Table I.
Top 40 nodes with a high score in the
protein-protein interaction network.
| A, Subgraph |
|---|
|
|---|
| Node | Score |
|---|
| Mmp2 | 132118.94 |
| Oasl2 | 115994.88 |
| Ifit1 | 95969.49 |
| Trim30a | 92368.98 |
| Mmp9 | 89980.91 |
| Usp18 | 87137.86 |
| Ifit2 | 83711.57 |
| Rsad2 | 78389.78 |
| Parp9 | 65845.10 |
| Psmb9 | 62329.73 |
| Ifi44 | 61890.17 |
| Ptprc | 60581.35 |
| Bst2 | 52788.61 |
| Lgals3bp | 52307.49 |
| Parp12 | 50636.56 |
| Col5a1 | 42741.73 |
| Ifi204 | 32780.95 |
| Thbs2 | 32724.00 |
| Tlr3 | 32063.93 |
| Lgals9 | 30456.22 |
| Pcolce | 27954.06 |
| Mmp14 | 27788.79 |
| Ifi203 | 27352.81 |
| Pcna | 26264.86 |
| Nmi | 25586.03 |
| Frk | 25365.84 |
| Loxl1 | 24301.15 |
| Lox | 23572.33 |
| Isg20 | 21952.91 |
| Rhoc | 20744.50 |
| Mdk | 20643.03 |
| Fstl1 | 20386.14 |
| Ddx41 | 19990.48 |
| Sdc1 | 18627.42 |
| Serpinh1 | 17851.99 |
| Gpx8 | 17771.15 |
| Rcn3 | 17400.74 |
| Cd68 | 17032.79 |
| Sdc2 | 14213.72 |
| Fkbp10 | 14067.95 |
|
| B, Degree |
|
| Mmp2 | 47.00 |
| Ptprc | 41.00 |
| Mmp9 | 40.00 |
| Oasl2 | 34.00 |
| Pcna | 31.00 |
| Frk | 31.00 |
| Col5a1 | 27.00 |
| Rhoc | 27.00 |
| Ddx41 | 25.00 |
| Prkar2b | 24.00 |
| Spna1 | 23.00 |
| Mapk13 | 23.00 |
| Ifit1 | 22.00 |
| Usp18 | 22.00 |
| Psmb9 | 22.00 |
| Gpx8 | 22.00 |
| Acacb | 22.00 |
| Slc4a1 | 22.00 |
| Trim30a | 21.00 |
| Pcolce | 21.00 |
| Mmp14 | 20.00 |
| Obscn | 20.00 |
| Ifit2 | 19.00 |
| Rsad2 | 19.00 |
| Thbs2 | 19.00 |
| Myh4 | 19.00 |
| Alas2 | 19.00 |
| Slc2a4 | 18.00 |
| Actn3 | 18.00 |
| Klf1 | 17.00 |
| Parp9 | 16.00 |
| Tlr3 | 16.00 |
| Loxl1 | 16.00 |
| Lox | 16.00 |
| Mdk | 16.00 |
| Fgfr2 | 16.00 |
| Smc2 | 16.00 |
| Ifi44 | 15.00 |
| Cd68 | 15.00 |
| Fkbp10 | 15.00 |
|
| C, Betweenness |
|
| Ptprc | 30306.94 |
| Mmp2 | 30018.82 |
| Pcna | 26498.73 |
| Oasl2 | 24770.62 |
| Frk | 20782.62 |
| Rhoc | 17367.36 |
| Acacb | 16584.40 |
| Mmp9 | 16291.33 |
| Spna1 | 13323.41 |
| Mapk13 | 13268.12 |
| Prkar2b | 11615.84 |
| Gpx8 | 11494.19 |
| Slc2a4 | 11248.73 |
| Ddx41 | 10606.64 |
| Obscn | 10462.83 |
| Pfas | 9557.37 |
| Psmb9 | 9042.65 |
| Col5a1 | 8806.07 |
| Rps6ka1 | 8625.42 |
| Pcolce | 7343.19 |
| Mmp14 | 6612.19 |
| Actn3 | 6597.27 |
| Dlg3 | 6507.87 |
| Msn | 6370.79 |
| Myh4 | 6325.04 |
| Alas2 | 6084.76 |
| Fgfr2 | 5320.19 |
| Glrx5 | 5243.41 |
| Mdk | 5180.35 |
| Slc4a1 | 5082.71 |
| Atp8a1 | 5063.36 |
| Copb2 | 5019.16 |
| Ppargc1a | 4905.46 |
| Cd68 | 4728.94 |
| H2-Aa | 4708.25 |
| Cxcr4 | 4565.29 |
| Ncf4 | 4559.99 |
| Rps3 | 4274.92 |
| Hk2 | 4171.70 |
| Thbs2 | 3997.35 |
The 66 hub genes were significantly associated to
the five signaling pathways (Table
II). Matrix metalloproteinase (Mmp) 2 and Mmp9 were associated
with the leukocyte transendothelial migration pathway, whereas
Thbs2 and Sdc2 were associated with the extracellular
matrix (ECM)-receptor interaction pathway. The protein tyrosine
phosphatase receptor type C and Sdc2 were implicated in the
cell adhesion molecule pathway (Table
II).
| Table II.Pathways enriched by the hub genes in
the protein-protein interaction network. |
Table II.
Pathways enriched by the hub genes in
the protein-protein interaction network.
| KEGG entry term:
pathway | P-value | Gene count | Genes |
|---|
| mmu04670: Leukocyte
transendothelial migration |
1.82×10⁻⁵ | 7 | Mapk13, Cxcr4,
Mmp9, Ncf4, Msn, Actn3, Mmp2 |
| mmu04910: Insulin
signaling pathway | 0.00420 | 5 | Prkar2B, Slc2A4,
Hk2, Acacb, Ppargc1A |
| mmu04512:
ECM-receptor interaction | 0.00740 | 4 | Sdc1, Thbs2,
Col5A1, Sdc2 |
| mmu04514: Cell
adhesion molecules | 0.03803 | 4 | Ptprc, Sdc1, H2-Aa,
Sdc2 |
| mmu04920:
Adipocytokine signaling pathway | 0.04178 | 3 | Slc2A4, Acacb,
Ppargc1A |
Analysis of the coexpression
network
In order to investigate the coexpression
associations between the selected hub genes and additional DEGs, a
coexpression network was constructed. A total of 21 hub genes were
determined to coexpress with additional DEGs (Fig. 5). A set of hub genes were observed
to coexpress with each other, including Thbs2, Sdc2
and Fkbp10, as well as Oasl2, Ifit1 and
Ifit2 (Fig. 5).
Discussion
In the present study, a set of 841 DEGs (335
upregulated and 506 downregulated) and 50 DEGs (16 upregulated and
34 downregulated) were identified in the Col1a1-Krm2 vs. WT
and Lrp5−/− vs. WT groups, respectively. A number
of DEGs demonstrated a high score in the PPI network, and were
coexpressed in the coexpression network. These genes included
Thbs2, Sdc2 and Fkbp10, as well as
Oasl2, Ifit1 and Ifit2. Thbs2 and
Sdc2 were associated with the ECM-receptor interaction
pathway.
Thbs2 is a part of the thrombospondin family
and mediates cell-to-cell and cell-to-matrix interactions (25). A previous review reported that
disrupted Thbs2 expression increases cortical bone density,
accelerates fracture healing, induces resistance to
ovariectomy-induced bone loss and alters the pattern of
load-induced bone formation (26).
In Thbs2-null mice, marrow-derived osteoprogenitor cells are
increased, and endosteal bone formation is promoted, indicating
that Thbs2 modulates the proliferation of osteoprogenitor
cells and bone remodeling (27,28).
Sdc2 functions as an integral membrane protein and mediates
cell-to-matrix interactions via its ECM protein receptor (29). Sdc2 is a crucial determinant
of chemosensitivity in osteoblasts, and it stimulates the mitogenic
activity of granulocyte-macrophage colony-stimulating factor
(30). Fkbp10 is a part of
the FKBP-type peptidyl-prolyl cis/trans isomerase family and
interacts with collagens (31). A
homozygous splicing mutation in Fkbp10 leads to osteogenesis
imperfecta with a mineralization defect via a reduction in bone
collagen content (32,33). There is no direct evidence to
implicate Sdc2 and Fkbp10 in osteoporotic fracture
healing, however, they are thought to coexpress with Thbs2.
Therefore, Sdc2 and Fkbp10, as well as Thbs2
may serve key roles during the fracture healing process in
osteoporosis, via their coexpression associations with each
other.
In the present study, Oasl2, Ifit1 and
Ifit2 demonstrated high scores in the PPI network and
coexpressed with each other. Ifit1 and Ifit2 were
interferon-induced proteins containing tetratricopeptide repeats
(34). Ifit1 is known to be
an important innate immune bottleneck (35). During the response of osteoblasts
to immune cytokine interferon-β, the expression of Ifit1 is
induced (36). Ifit2 and
Oasl2 are involved in innate immunity (37,38).
Only a limited number of studies have investigated the association
between the Ifit1, Ifit2 and Oasl2 genes and fracture
repair; however they present potential novel candidates for
osteoporotic fracture repair therapies.
In the present study, the number of identified DEGs
in the Col1a1-Krm2 vs. WT group was markedly higher than
that observed in the Lrp5−/− vs. WT group, which
was consistent with previous findings (9). According to the DEGs enrichment
analysis, the DEGs in the Col1a1-Krm2 vs. WT group were
primarily associated with immunity and cell adhesion. By contrast,
the DEGs in the Lrp5−/− vs. WT group were
significantly associated with muscle system processes (GO: 0003012)
and the regulation of transcription (GO: 0006355). These results
suggest that during the fracture repair process in osteoporosis,
the DEGs induced by Krm2 overexpression or Lrp5
deficiency, and their functions, may be distinctly different.
Compared with the findings presented by Liedert
et al (9), the present
study identified the interactions and coexpression patterns among a
set of genes, which was not determined previously. However, these
predictions require validation in further studies. In a future
study, the DEGs and their interactions will be determined in
patients.
In conclusion, a series of DEGs, including
Thbs2, Sdc2 and Fkbp10, as well as
Oasl2, Ifit1 and Ifit2, demonstrated a
significant role in the PPI network and were observed to form
co-expression patterns. The results suggest that these genes may
serve crucial roles during the fracture repair process in
osteoporosis. Sdc2, Fkbp10, Oasl2,
Ifit1 and Ifit2 were demonstrated to be novel genes
associated with osteoporotic fracture healing.
Glossary
Abbreviations
Abbreviations:
|
DEGs
|
differentially expressed genes
|
|
PPIs
|
protein-protein interactions
|
|
BMP-2
|
bone morphogenetic protein-2
|
|
PTH
|
parathyroid hormone
|
|
LRP5
|
lipoprotein receptor-related protein
5
|
|
KREMEN2
|
kringle containing transmembrane
protein 2
|
|
DKK1
|
dickkopf homolog 1
|
|
GEO
|
Gene Expression Omnibus database
|
|
RMA
|
robust microarray analysis
|
|
FDR
|
false discovery rate
|
|
GO
|
Gene Ontology
|
|
KEGG
|
Kyoto Encyclopedia of Genes and
Genomes
|
|
DAVID
|
Database for Annotation, Visualization
and Integrated Discovery
|
|
STRING
|
Search Tool for the Retrieval of
Interacting Genes
|
|
PCC
|
pearson correlation coefficient
|
|
CAMs
|
cell adhesion molecules
|
|
Thbs2
|
thrombospondin 2
|
|
Sdc2
|
syndecan 2
|
|
Fkbp10
|
FK506 Binding Protein 10
|
References
|
1
|
Namkung-Matthai H, Appleyard R, Jansen J,
Hao Lin J, Maastricht S, Swain M, Mason RS, Murrell GA, Diwan AD
and Diamond T: Osteoporosis influences the early period of fracture
healing in a rat osteoporotic model. Bone. 28:80–86. 2001.
View Article : Google Scholar
|
|
2
|
Johnell O and Kanis JA: An estimate of the
worldwide prevalence and disability associated with osteoporotic
fractures. Osteoporos Int. 17:1726–1733. 2006. View Article : Google Scholar
|
|
3
|
Egermann M, Baltzer AW, Adamaszek S, Evans
C, Robbins P, Schneider E and Lill CA: Direct adenoviral transfer
of bone morphogenetic protein-2 cDNA enhances fracture healing in
osteoporotic sheep. Hum Gene Ther. 17:507–517. 2006. View Article : Google Scholar
|
|
4
|
Noordin S and Glowacki J: Parathyroid
hormone and its receptor gene polymorphisms: Implications in
osteoporosis and in fracture healing. Rheumatol Int. 36:1–6. 2016.
View Article : Google Scholar
|
|
5
|
Mizuguchi T, Furuta I, Watanabe Y,
Tsukamoto K, Tomita H, Tsujihata M, Ohta T, Kishino T, Matsumoto N,
Minakami H, et al: LRP5, low-density-lipoprotein-receptor-related
protein 5, is a determinant for bone mineral density. J Hum Genet.
49:80–86. 2004. View Article : Google Scholar
|
|
6
|
Kato M, Patel MS, Levasseur R, Lobov I,
Chang BH, Glass DA II, Hartmann C, Li L, Hwang TH, Brayton CF, et
al: Cbfa1-independent decrease in osteoblast proliferation,
osteopenia, and persistent embryonic eye vascularization in mice
deficient in Lrp5, a Wnt coreceptor. J Cell Biol. 157:303–314.
2002. View Article : Google Scholar :
|
|
7
|
Mao B, Wu W, Davidson G, Marhold J, Li M,
Mechler BM, Delius H, Hoppe D, Stannek P, Walter C, et al: Kremen
proteins are Dickkopf receptors that regulate Wnt/beta-catenin
signalling. Nature. 417:664–667. 2002. View Article : Google Scholar
|
|
8
|
Schulze J, Seitz S, Saito H, Schneebauer
M, Marshall RP, Baranowsky A, Busse B, Schilling AF, Friedrich FW,
Albers J, et al: Negative regulation of bone formation by the
transmembrane Wnt antagonist Kremen-2. PLoS One. 5:e103092010.
View Article : Google Scholar :
|
|
9
|
Liedert A, Röntgen V, Schinke T, Benisch
P, Ebert R, Jakob F, Klein-Hitpass L, Lennerz JK, Amling M and
Ignatius A: Osteoblast-specific Krm2 overexpression and Lrp5
deficiency have different effects on fracture healing in mice. PLoS
One. 9:e1032502014. View Article : Google Scholar :
|
|
10
|
Gautier L, Cope L, Bolstad BM and Irizarry
RA: affy-analysis of Affymetrix GeneChip data at the probe level.
Bioinformatics. 20:307–315. 2004. View Article : Google Scholar
|
|
11
|
Carlson M: org.Hs.eg.db: Genome wide
annotation for Human. R package version 3.4.0. 2015.
|
|
12
|
Dunning M, Lynch A and Eldridge M:
illuminaHumanv3.db: Illumina HumanHT12v3 annotation data (chip
illuminaHumanv3). R package version 1.26.0. 2015.
|
|
13
|
Ritchie ME, Phipson B, Wu D, Hu Y, Law CW,
Shi W and Smyth GK: limma powers differential expression analyses
for RNA-sequencing and microarray studies. Nucleic Acids Res.
43:e472015. View Article : Google Scholar :
|
|
14
|
Glueck DH, Mandel J, Karimpour-Fard A,
Hunter L and Muller KE: Exact calculations of average power for the
Benjamini-Hochberg procedure. Int J Biostat. 4:Article 112008.
View Article : Google Scholar
|
|
15
|
Oliveros JC: VENNY. An interactive tool
for comparing lists with Venn Diagrams. 2007, http://bioinfogp.cnb.csic.es/tools/venny/index.htmlNovember
20–2013
|
|
16
|
Huang DW, Sherman BT, Tan Q, Collins JR,
Alvord WG, Roayaei J, Stephens R, Baseler MW, Lane HC and Lempicki
RA: The DAVID gene functional classification tool: A novel
biological module-centric algorithm to functionally analyze large
gene lists. Genome Biol. 8:R1832007. View Article : Google Scholar :
|
|
17
|
Szklarczyk D, Franceschini A, Wyder S,
Forslund K, Heller D, Huerta-Cepas J, Simonovic M, Roth A, Santos
A, Tsafou KP, et al: STRING v10: Protein-protein interaction
networks, integrated over the tree of life. Nucleic Acids Res.
43(Database issue): D447–D452. 2015. View Article : Google Scholar
|
|
18
|
Kohl M, Wiese S and Warscheid B:
Cytoscape: Software for visualization and analysis of biological
networks. Methods Mol Biol. 696:291–303. 2011. View Article : Google Scholar
|
|
19
|
Jeong H, Mason SP, Barabási AL and Oltvai
ZN: Lethality and centrality in protein networks. Nature.
411:41–42. 2001. View Article : Google Scholar
|
|
20
|
Goh KI, Oh E, Kahng B and Kim D:
Betweenness centrality correlation in social networks. Phys Rev E
Stat Nonlin Soft Matter Phys. 67:0171012003. View Article : Google Scholar
|
|
21
|
Estrada E and Rodriguez-Velázquez JA:
Subgraph centrality in complex networks. Phys Rev E Stat Nonlin
Soft Matter Phys. 71:0561032005. View Article : Google Scholar
|
|
22
|
Tang Y, Li M, Wang J, Pan Y and Wu FX:
CytoNCA: A cytoscape plugin for centrality analysis and evaluation
of protein interaction networks. Biosystems. 127:67–72. 2015.
View Article : Google Scholar
|
|
23
|
Suzuki R and Shimodaira H: Pvclust: An R
package for assessing the uncertainty in hierarchical clustering.
Bioinformatics. 22:1540–1542. 2006. View Article : Google Scholar
|
|
24
|
Adler J and Parmryd I: Quantifying
colocalization by correlation: The Pearson correlation coefficient
is superior to the Mander's overlap coefficient. Cytometry A.
77:733–742. 2010. View Article : Google Scholar
|
|
25
|
LaBell TL, Milewicz DJ, Disteche CM and
Byers PH: Thrombospondin II: Partial cDNA sequence, chromosome
location, and expression of a second member of the thrombospondin
gene family in humans. Genomics. 12:421–429. 1992. View Article : Google Scholar
|
|
26
|
Alford AI and Hankenson KD: Matricellular
proteins: Extracellular modulators of bone development, remodeling,
and regeneration. Bone. 38:749–757. 2006. View Article : Google Scholar
|
|
27
|
Hankenson KD, Bain SD, Kyriakides TR,
Smith EA, Goldstein SA and Bornstein P: Increased marrow-derived
osteoprogenitor cells and endosteal bone formation in mice lacking
thrombospondin 2. J Bone Miner Res. 15:851–862. 2000. View Article : Google Scholar
|
|
28
|
Delany AM and Hankenson KD:
Thrombospondin-2 and SPARC/osteonectin are critical regulators of
bone remodeling. J Cell Commun Signal. 3:227–238. 2009. View Article : Google Scholar :
|
|
29
|
Ishikawa-Brush Y, Powell JF, Bolton P,
Miller AP, Francis F, Willard HF, Lehrach H and Monaco AP: Autism
and multiple exostoses associated with an X;8 translocation
occurring within the GRPR gene and 3′ to the SDC2 gene. Hum Mol
Genet. 6:1241–1250. 1997. View Article : Google Scholar
|
|
30
|
Modrowski D, Baslé M, Lomri A and Marie
PJ: Syndecan-2 is involved in the mitogenic activity and signaling
of granulocyte-macrophage colony-stimulating factor in osteoblasts.
J Biol Chem. 275:9178–9185. 2000. View Article : Google Scholar
|
|
31
|
Ishikawa Y, Vranka J, Wirz J, Nagata K and
Bächinger HP: The rough endoplasmic reticulum-resident
FK506-binding protein FKBP65 is a molecular chaperone that
interacts with collagens. J Biol Chem. 283:31584–31590. 2008.
View Article : Google Scholar
|
|
32
|
Venturi G, Monti E, Carbonare L Dalle,
Corradi M, Gandini A, Valenti MT, Boner A and Antoniazzi F: A novel
splicing mutation in FKBP10 causing osteogenesis imperfecta with a
possible mineralization defect. Bone. 50:343–349. 2012. View Article : Google Scholar
|
|
33
|
Schwarze U, Cundy T, Pyott SM,
Christiansen HE, Hegde MR, Bank RA, Pals G, Ankala A, Conneely K,
Seaver L, et al: Mutations in FKBP10, which result in Bruck
syndrome and recessive forms of osteogenesis imperfecta, inhibit
the hydroxylation of telopeptide lysines in bone collagen. Hum Mol
Genet. 22:1–17. 2013. View Article : Google Scholar
|
|
34
|
Wathelet MG, Clauss IM, Content J and Huez
GA: The IFI-56K and IFI-54K interferon-inducible human genes belong
to the same gene family. FEBS Lett. 231:164–171. 1988. View Article : Google Scholar
|
|
35
|
McDermott JE, Vartanian KB, Mitchell H,
Stevens SL, Sanfilippo A and Stenzel-Poore MP: Identification and
validation of Ifit1 as an important innate immune bottleneck. PLoS
One. 7:e364652012. View Article : Google Scholar :
|
|
36
|
Woeckel VJ, Eijken M, van de Peppel J,
Chiba H, van der Eerden BC and van Leeuwen JP: IFNβ impairs
extracellular matrix formation leading to inhibition of
mineralization by effects in the early stage of human osteoblast
differentiation. J Cell Physiol. 227:2668–2676. 2012. View Article : Google Scholar
|
|
37
|
Perwitasari O, Cho H, Diamond MS and Gale
M Jr: Inhibitor of κB kinase epsilon (IKK(epsilon)), STAT1, and
IFIT2 proteins define novel innate immune effector pathway against
West Nile virus infection. J Biol Chem. 286:44412–44423. 2011.
View Article : Google Scholar :
|
|
38
|
Zhu J, Ghosh A and Sarkar SN: OASL-a new
player in controlling antiviral innate immunity. Curr Opin Virol.
12:15–19. 2015. View Article : Google Scholar :
|