Introduction
Breast cancer is the most commonly diagnosed
malignant cancer in women. Generally, adjuvant therapy is an
effective way to improve patient survival and affect patient
quality of life (1). However, drug
resistance and metastasis are still important problems during
breast cancer therapy. Therefore, uncovering the metastatic
molecular mechanisms of breast cancer cells may be useful for
breast cancer therapy and is urgently required.
Many successful efforts have investigated the
metastatic nature of breast cancer through basic research
(molecular and genetic analyses), and various novel genes that are
involved breast cancer cell metastasis have been identified
(2–4). Although individual a gene or protein
alone can have an important role in the metastasis of breast cancer
cell, determining individual gene expression levels does not
facilitate a comprehensive understanding of cancer cell metastasis
(5).
Weighted gene co-expression network analysis (WGCNA)
(6) is a powerful tool to examine
the potential gene correlation structures within the gene
expression data. The weighted gene co-expression network is an
intuitive network concept in which ‘nodes’ represent gene
expression vectors over tissues/conditions and ‘edges’ are weighted
by correlations (typically the Pearson correlation coefficient)
between the connected nodes. WGCNA can be used for identifying
modules of highly correlated genes without pre-assigning a ‘hard’
threshold to decide whether an edge should be drawn between two
nodes, for summarizing the identified modules by the module
eigengene, for relating eigengene network to one another and to
external sample traits, and for calculating module membership
measures (7). WGCNA has been
successfully applied in various types of cancer, including
glioblastoma (8), breast cancer
(9), prostate cancer (10) and lung cancer (11). In breast cancer, Presson et
al (9) applied WGCNA to
investigate the relationship between tissue microarray data and
clinic traits in 2011. The study identified a rule for predicting
survival outcome of patients with breast cancer (9). Clarke et al (12) utilized WGCNA to identify 11
coregulated gene clusters across 2,342 breast cancer samples in
2013. In addition, the study found several upregulated genes; for
example, the potassium channel subfamily K member 5 was correlated
with a poor outcome for patients with breast cancer. In the same
study, an online database was developed to allow users to retrieve
co-expression patterns and the survival analysis (12). Hua et al (13) used WGCNA to identify specialized
microRNA-microRNA networks for two breast cancer subtypes in 2013.
However, to the best of our knowledge, no study has previous
compared the co-expression network of aggressive breast cancer
cells with those of nonaggressive breast cancer cells.
In the present study, a WGCNA was used to reveal
shared and unique properties of aggressive and non-aggressive
breast cancer groups by comparing the co-expression networks of
these two groups. Modules within the gene expression data of
aggressive and non-aggressive breast cancer were identified. The
aggressive group had six modules and the non-aggressive group had
three modules. Gene Ontology (GO) enrichment demonstrated that blue
and red modules in the metastatic breast cancer group were closely
associated with tumor aggressive. To analyze the signature
co-expression network in aggressive group, the genes of blue and
red modules in aggressive group were selected to identify the
corresponding genes in co-expression network in the non-aggressive
group. Additionally, the hub genes (the nodes that had five
strongest connections with other nodes) were filtered to analyze
the difference between the aggressive and non-aggressive cell
lines. It was aimed to identify the most significantly different
networks between two groups. The results demonstrated that certain
genes in the blue module were associated with metastasis, including
gap junction γ-1 protein (GJC1), Annexin A3 (ANXA3)
and Twist-related protein 1 (TWIST1), which were present in
the aggressive group and absent in the non-aggressive group. In the
red module, the aggressive suppressor gene, Dickkopf-related
protein 3 (DKK3), had a weak connection in the aggressive
group and a strong connection in the non-aggressive group.
Therefore, this study provides a new insight into understanding the
differences in the co-expression networks between aggressive and
non-aggressive breast cancer. Furthermore, the genes obtained from
WGCNA are validated by data from breast cancer patients in The
Cancer Genomic Atlas (TCGA) and Gene Expression Omnibus (GEO)
databases.
Materials and methods
Sample collection
Generally, lymph-node metastasis and distant
metastasis is considered as marker for aggressive and
non-aggressive. Other studies considered the relapse of tumor as a
marker of metastasis and non-metastasis (5). In fact, patient tissues are so
complex that it is difficult to distinguish metastatic and
non-metastatic cancer. Thus, breast cancer cell lines that are
easily separated into aggressive and non-aggressive groups were
used in the current study. We divided the breast cancer cell lines
into an aggressive group (HCC202, Hs578T, MDA-MB-453, BT549 and
MDA-MB-231) and non-aggressive group (BT474, MCF7, MDA-MB-435,
SUM225 and SKBR3) by SATB1 expression (14). The raw expression data of breast
cancer cell lines were obtained from the GEO database (www.ncbi.nlm.nih.gov/geo) under the Affymetrix
Human Genome U133 Plus 2.0 Array (HG-U133_Plus_2) platform
(15). In summary, we found 27
aggressive breast cancer cell line samples and 38 non-aggressive
breast cancer cell line samples. The list of all samples is
presented in Table I.
 | Table I.All samples of aggressive and
non-aggressive breast cancer cell lines. |
Table I.
All samples of aggressive and
non-aggressive breast cancer cell lines.
| A,
Non-aggressive |
|---|
|
|---|
| GEO no. | Cell line name |
|---|
| GSM1067677 | MCF7 |
| GSM1230317 | MCF7 |
| GSM1230347 | BT474 |
| GSM1273928 | MCF7 |
| GSM1273929 | MCF7 |
| GSM1298685 | MCF7 |
| GSM1298686 | MCF7 |
| GSM1298687 | MCF7 |
| GSM1374661 | MDA-MB-453 |
| GSM156771 | MCF10A |
| GSM212661 | MCF7 |
| GSM286756 | MCF7 |
| GSM286757 | MCF7 |
| GSM286758 | MCF7 |
| GSM286762 | MCF7 |
| GSM286763 | MCF7 |
| GSM286764 | MCF7 |
| GSM286768 | MCF7 |
| GSM286769 | MCF7 |
| GSM286770 | MCF7 |
| GSM297803 | MCF7 |
| GSM436499 | MCF7 |
| GSM436500 | MCF7 |
| GSM436501 | MCF7 |
| GSM678802 | MCF7 |
| GSM678803 | MCF7 |
| GSM678804 | MCF7 |
| GSM699776 | MCF7 |
| GSM699777 | MCF7 |
| GSM803623 | MCF7 |
| GSM803682 | MCF7 |
| GSM803741 | MCF7 |
| GSM820808 | HMEC |
| GSM820809 | HMEC |
| GSM820810 | HMEC |
| GSM984494 | BT474 |
| GSM984498 | MCF7 |
| GSM984499 | SKBR3 |
|
| B, Aggressive |
|
| GEO no. | Cell line name |
|
| GSM1374510 | HCC202 |
| GSM1374550 | Hs578T |
| GSM573291 | MDA-MB-231 |
| GSM573292 | MDA-MB-231 |
| GSM573293 | MDA-MB-231 |
| GSM596523 | MDA-MB-231 |
| GSM596524 | MDA-MB-231 |
| GSM596525 | MDA-MB-231 |
| GSM803625 | MDA-MB-231 |
| GSM803626 | MDA-MB-435 |
| GSM803684 | MDA-MB-231 |
| GSM803685 | MDA-MB-435 |
| GSM803744 | MDA-MB-435 |
| GSM820814 | MDA-MB-231 |
| GSM820815 | MDA-MB-231 |
| GSM820816 | MDA-MB-231 |
| GSM839353 | MDA-MB-231 |
| GSM839354 | MDA-MB-231 |
| GSM839355 | MDA-MB-231 |
| GSM843477 | BT549 |
| GSM843478 | BT549 |
| GSM843479 | BT549 |
| GSM870207 | MDA-MB-231 |
| GSM870208 | MDA-MB-231 |
| GSM870209 | MDA-MB-231 |
| GSM870210 | MDA-MB-231 |
| GSM984501 | Hs578T |
Data pre-processing
The software Affymetrix Expression Console was
applied to normalize the raw data with the approach of Robust
Multi-array Average algorithm. For computational reasons, network
analysis was limited to the most varying 4,000 gene sets. Although
some genes are represented in multiple gene sets and other gene
sets are not fully annotated, for consistency, gene sets as are
referred to as ‘genes’ throughout the study, unless otherwise
noted. Although the validation data was performed on Affymetrix
Human Genome U133 Plus 2.0 Array (HG-U133_Plus_2), the
pre-processing method was the same as the cell line samples.
Construction of WGCNA
The WGCNA implemented in the R software package
(http://www.r-project.org/) is employed
to construct the gene co-expression network and identify the
co-expression modules (6,16,17).
Highly connective module genes are represented and summarized by
their first principal component, and it has been called the module
eigengene (7). The data sets used
for gene co-expression network construction consisted of 27
aggressive and 38 non-aggressive samples, respectively. The network
analysis is applied to breast cancer data set, a signed weighted
network adjacency matrix id defined as:
aij=|1+cor(xi,xj)2|β(1)
xi and xj
represent the expression value of gene expressions that are numeric
vector whose entries report the β values across the individuals. To
construct sample networks, a measure of connection strength, or
adjacency, is defined for each pair of genes i and j
and denoted by aij. A mathematical constraint on
aij is that its values must be between 0 and 1. The
power βT is a soft-thresholding parameter that can be used to
emphasize high positive correlations at the expense of low
correlations. The β is a parameter of adjacency function. The
function of β is to construct a weighted network. In fact, β is a
threshold parameter that needs to be determined. In WGCNA theory
(only consider the parameter values that lead to a network
satisfying scale-free topology at least approximately), the scale
free topology fitting index (R2) depends on thresholds
(β). A major advantage of weighted correlation networks is that
they are highly robust with regard to the choice of β (16).
Generally, the topology of the weighted gene
co-expressing network is constructed based on the hypothesis of
scale-free network. In the present study, when the thresholds of
power in gene expression of aggressive and non-aggressive breast
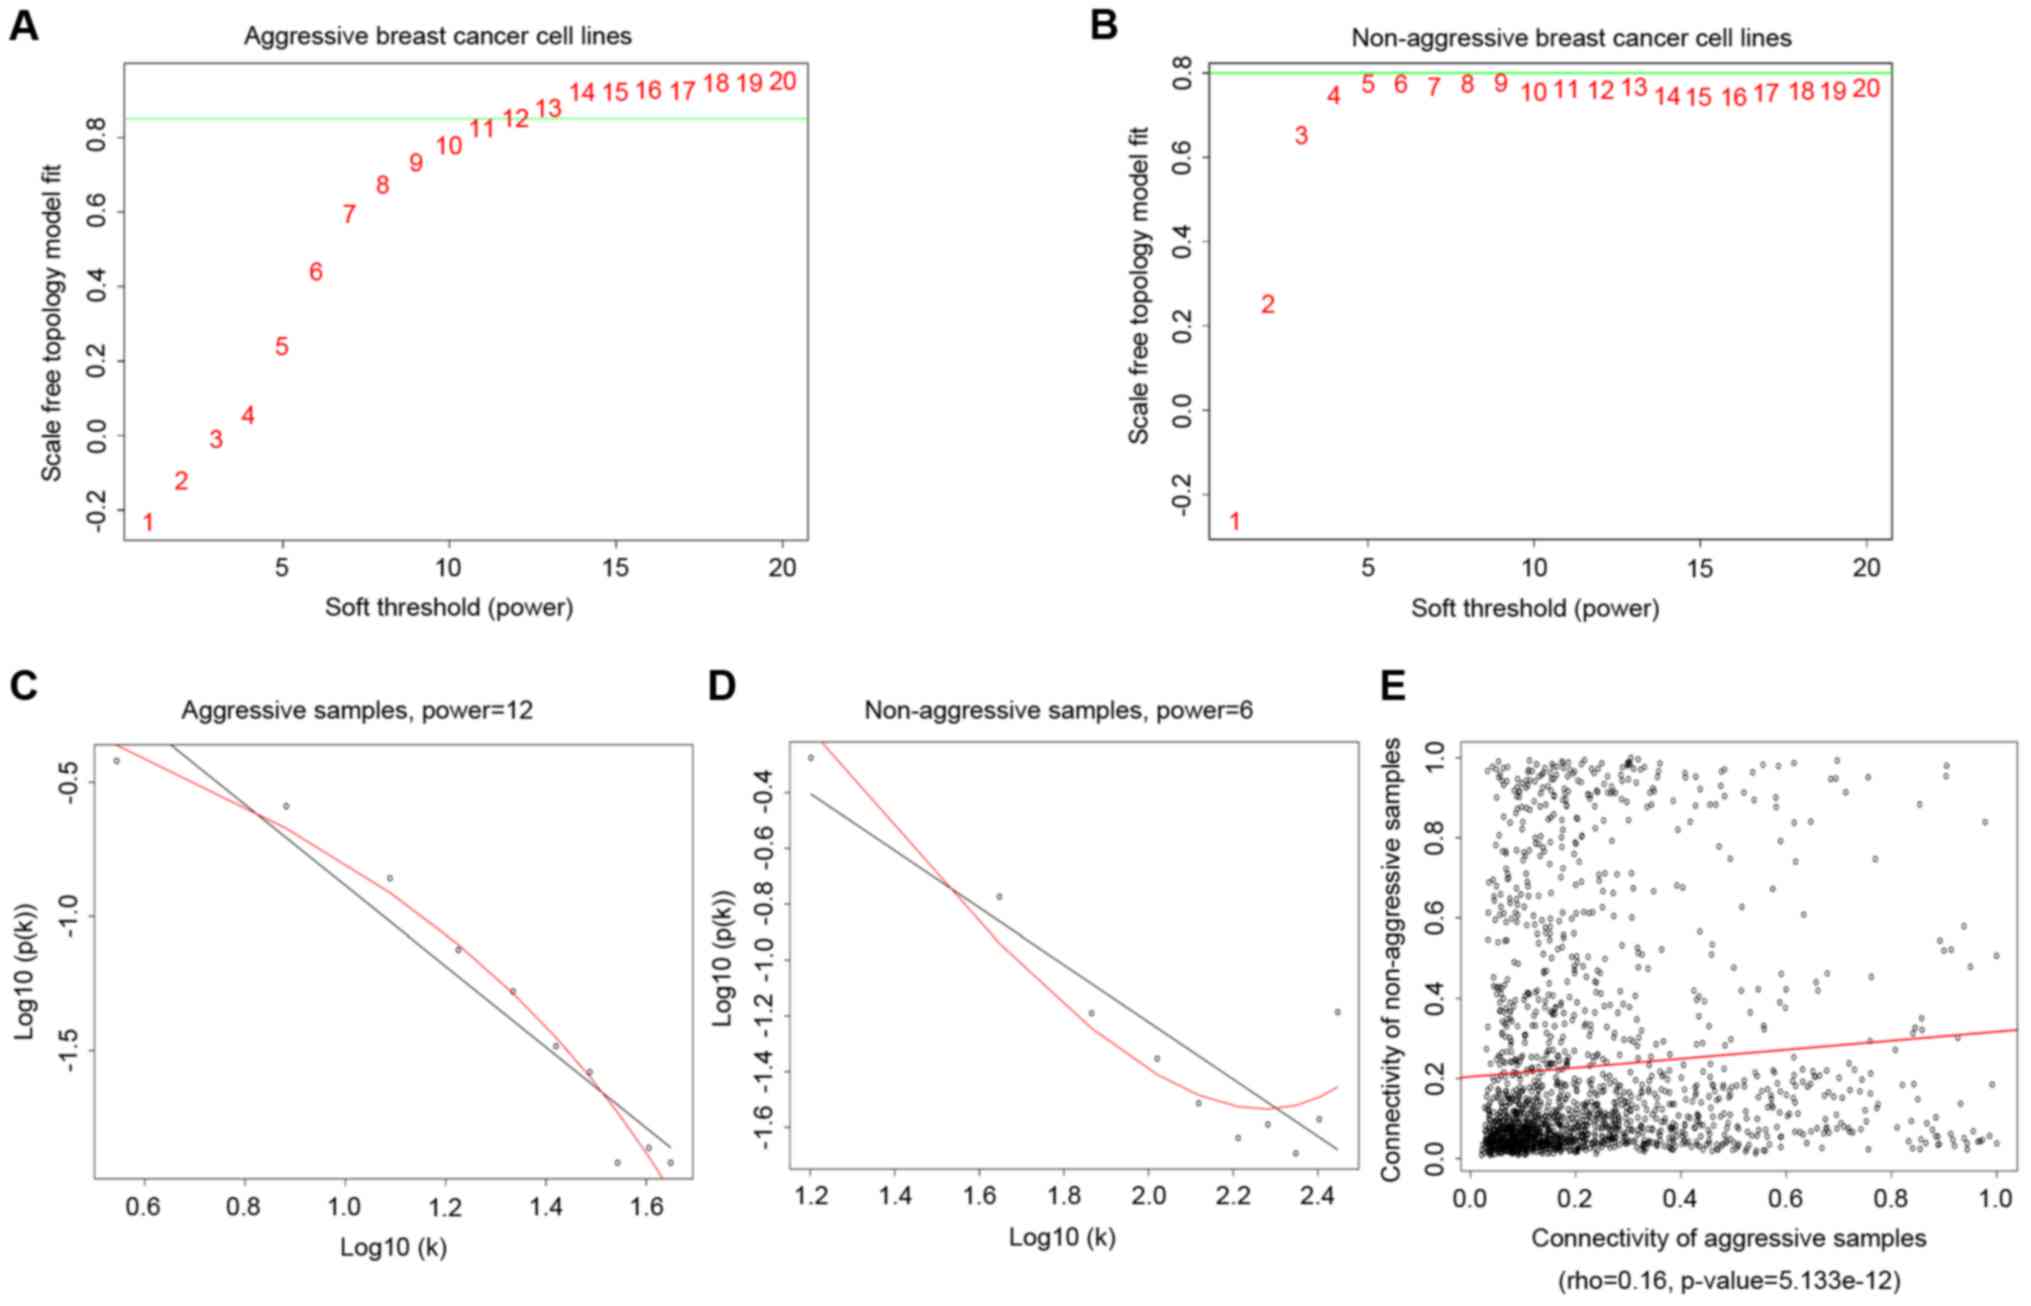
cancer lines were 12 and 6, the topology of the two weighted gene
co-expression networks were consistent with the topological
structure of scale-free networks. Thus, power=12 and power=6 were
selected as the final parameter for two groups of breast cancer
lines.
In the co-expression network, the genes represent
the nodes and the aij represent the edges. The value of
aij represents the strength connectivity of the edges. The
overall connectivity for each gene (k) is the sum of the connection
strengths (|correlation|β) between that gene and all other 1,810
genes in the network, scaled between 0 and 1. The intramodular
connectivity for each gene (kin) is the sum of
the connection strengths between that gene and all genes in its
module, scale to between 0 and 1.
Gene Ontology (GO) enrichment
The annotations and functions of proteins were
obtained from the Database for Annotation, Visualization and
Integrated Discovery (DAVID) Bioinformatics Resources 6.7
(http://david.abcc.ncifcrf.gov/home.jsp) (18,19).
GO terms assigned a Benjamini-Hochberg adjusted P<0.05 by DAVID
were deemed to be enriched over the background gene set. In this
study, each module of the aggressive group was submitted into DAVID
for GO enrichment.
Specific network analysis and
visualization
To identify pairs of genes with high ‘topological
overlap’ (TO) in aggressive breast cancer (agg) and low TO in
non-aggressive breast cancer (nonagg) in given modules, for each
pair of genes i and j we defined the aggressive group
specificity measure (ASij) as follows:
ASij=TOij[agg]/mean(TO[agg])TOij[agg]/mean(TO[agg]+TOij[nonagg])/mean(TO[nonagg])(2)
where mean (TO) represents the mean pairwise TO
value in a given module for aggressive breast cancer or
non-aggressive breast cancer. Connections for which the value of
this ratio exceeded 0.8 were deemed present in aggressive group and
absent in non-aggressive group.
Filter and restrict co-expression
network
For further improving the identification of strength
connection in given modules, the analysis was restricted by
retaining only those genes for which k was >0.5. Furthermore,
for the network in given modules the top 20% weight of pairs of
genes were selected.
Hub genes validation in clinical
data
Breast cancer gene expression and clinical data were
downloaded from The Cancer Genome Atlas (TCGA; https://cancergenome.nih.gov/) on April 2, 2016. Each
sample represents a case in the TCGA data set. The three criteria
used to select desired samples were as follows: i) Patients both
with clinical data and gene expression were selected; ii) survival
time of patients was more than 30 days; iii) all gene expressions
were assayed by next-generation sequencing technologies. The three
criteria resulted in 1,132 samples.
The validation data set was obtained from GEO
(GSE3494) that contains 262 tissue samples of patients with breast
cancer. The validation data set was divided into metastatic and
non-metastatic groups by the clinical traits of positive and
negative lymph node metastasis. The groups contained 84 metastatic
samples and 178 non-metastatic samples.
Survival analysis of hub genes
The univariate Cox proportional hazard regression as
used to compute the hazard ratio (HR) and P-value for each hub gene
obtained from co-expression network analysis. P≤0.05 was considered
to indicate significant association with survival. Genes that had a
HR>1 were considered to be high-risk genes, while a HR<1 were
defined as risk-reducing genes. The Wald test was employed to
assess the difference between two groups associated with time to an
event endpoint (20).
Prognosis index (PI) is an integrated indicator of
hub genes for each breast cancer patient in the TCGA or GEO
database. The value of PI is a linear combination of coefficient
and gene expression. The PI was calculated from linear combination
of the expression value of the gene expressions multiply by
univariate Cox regression coefficients. For integrating indicators
of genes for each patient, a weighted prognostic index (WPI) was
defined as follows (21):
PI=coef1·X1+Coef2·X2+···+Coefi·Xi(3),
WPI=PI–mean(PI)SD(PI)(4)
Where Coefi represents the Cox
regression coefficient of the ith gene and
Xi represents the value of the ith gene
expression. Mean (PI) and standard deviation (PI) represent the
mean value and standard deviation of the PI, respectively. Where
Xi is the log2-transformed expression
value of each gene and is Coefi the univariate
Cox proportional hazards regression coefficient of the ith
gene.
Results
Co-expression network of aggressive
group and non-aggressive group
The gene co-expression networks are constructed from
microarray data consisting of 27 aggressive cell lines and 38
non-aggressive cell lines (Table
I). For examining the difference of the two groups of breast
cancer, the overlap between two groups was determined. A total of
1,811 genes were derived from the 4,000 genes with the most
variance. All possible pairwise correlations were calculated for
1,811 genes in aggressive and non-aggressive cell line in parallel
and converted into measures of connection strength by taking their
absolute values and raising them to a power, β (16). Summing the connection strengths for
each gene with all other genes resulted in a number that termed
network connectivity (k). The connectivity represents how strongly
that gene is connected to all other genes in the network. For
identifying the modules of co-expression genes, the genes with
similar patterns of connection strengths to other genes or high TO
was calculated (22). WGCNA is
employed to calculate TO and clustered genes on the basis for
aggressive and non-aggressive groups, identifying six distinct gene
co-expression modules in aggressive samples and three co-expression
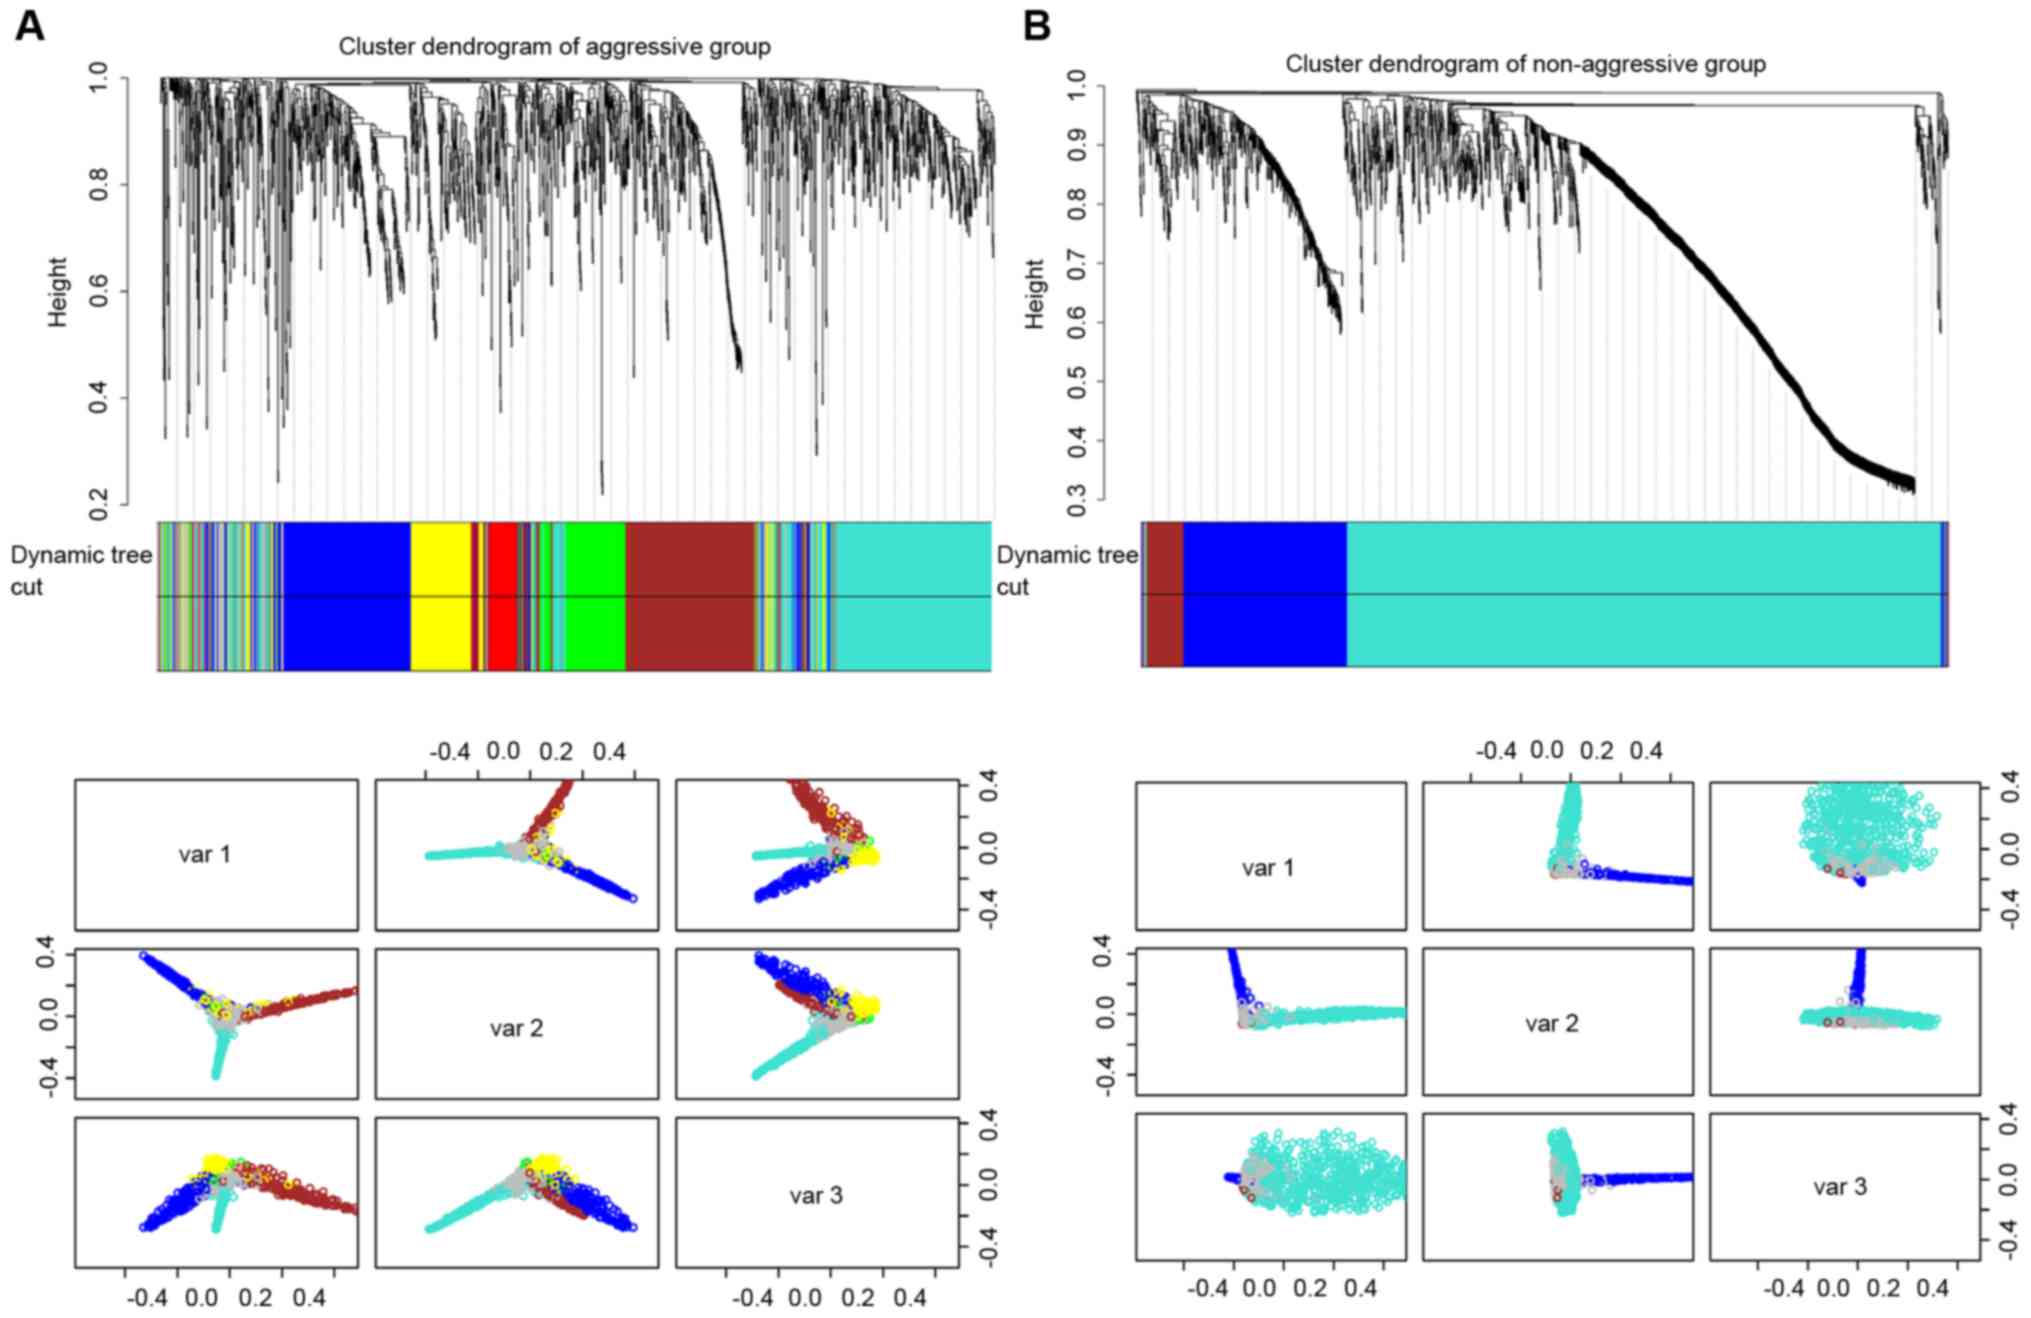
modules in non-aggressive samples (Fig. 1).
As presented in Fig.
1, there were 1,811 overlapping genes in the different clusters
in aggressive and non-aggressive groups. In the present study, the
size was restricted to a minimum of 30 genes in one module. The
aggressive group contained six modules (excluding the grey color
module) and non-aggressive group contained three modules (excluding
grey color module). For investigation of the topology of the
co-expression network difference between aggressive and
non-aggressive cell lines, the connectivity of both groups was
calculated using the R and WGCNA package (Fig. 2).
As shown in Fig. 2,
rho=0.16 and P=5.133×10⁻¹², which represent a
significant linear correlation between the two types of cell lines.
This association was examined further using Pearson correlation.
The analysis produced a correlation coefficient of 0.060 and
P=0.010. Although, P<0.05, the correlation coefficient
demonstrated that they have a weak positive correlation. The
results indicated that two types of cell lines have specific
co-expression networks.
GO enrichment for both groups
For investigating the biological process of each
module in aggressive and non-aggressive cell lines, DAVID was used
for analysis. Table II presents
the top five GO terms in each module. The six modules were
distributed in different biological processes.
| Table II.List of the top GO terms in the most
significant the Database for Annotation, Visualization and
Integrated Discovery functional clusters for each network
module. |
Table II.
List of the top GO terms in the most
significant the Database for Annotation, Visualization and
Integrated Discovery functional clusters for each network
module.
| A, Aggressive
breast cancer cell lines |
|---|
|
|---|
| Top five terms | No. of genes in
ME | P-value | FDR |
|---|
| Blue module | 363 |
|
|
|
GO:0001501:skeletal system
development |
|
1.05×10⁻⁸ |
1.83×10⁻⁵ |
|
GO:0007155:cell adhesion |
|
7.15×10⁻⁸ |
1.25×10⁻⁴ |
|
GO:0022610:biological
adhesion |
|
7.39×10⁻⁷ |
1.29×10⁻³ |
|
GO:0001568:blood vessel
development |
|
3.27×10⁻⁶ |
5.70×10⁻³ |
|
GO:0001944:vasculature
development |
|
3.73×10⁻⁶ |
6.50×10⁻³ |
| Brown module | 359 |
|
|
|
GO:0048545:response to steroid
hormone stimulus |
|
5.91×10⁻⁹ |
9.53×10⁻⁶ |
|
GO:0008285:negative regulation
of cell proliferation |
|
6.08×10⁻⁹ |
9.82×10⁻⁶ |
|
GO:0009725:response to hormone
stimulus |
|
1.27×10⁻⁶ |
2.04×10⁻³ |
|
GO:0042127:regulation of cell
proliferation |
|
6.36×10⁻⁶ |
1.02×10⁻² |
|
GO:0009719:response to
endogenous stimulus |
|
8.54×10⁻⁵ |
1.39×10⁻¹ |
| Green module | 183 |
|
|
|
GO:0007167:enzyme linked
receptor protein signaling pathway |
|
4.76×10⁻⁴ |
7.57×10⁻¹ |
|
GO:0001525:angiogenesis |
|
6.42×10⁻⁴ | 1.02 |
|
GO:0009611:response to
wounding |
|
7.10×10⁻⁴ | 1.13 |
|
GO:0048514:blood vessel
morphogenesis |
|
1.04×10⁻³ | 1.64 |
|
GO:0001568:blood vessel
development |
|
1.8×10⁻³ | 2.85 |
| Red module | 74 |
|
|
|
GO:0030030:cell projection
organization |
|
4.04×10⁻⁵ |
6.34×10⁻² |
|
GO:0034329:cell junction
assembly |
|
1.37×10⁻⁴ |
2.14×10⁻¹ |
|
GO:0006928:cell motion |
|
2.24×10⁻⁴ |
3.50×10⁻¹ |
|
GO:0034330:cell junction
organization |
|
2.30×10⁻³ | 3.54 |
|
GO:0000904:cell morphogenesis
involved in differentiation |
|
2.49×10⁻³ | 3.83 |
| Turquoise
module | 196 |
|
|
|
GO:0046907:intracellular
transport |
|
2.89×10⁻⁵ |
5.04×10⁻² |
|
GO:0016192:vesicle-mediated
transport |
|
1.72×10⁻⁴ |
2.99×10⁻¹ |
|
GO:0051270:regulation of cell
motion |
|
3.15×10⁻⁴ |
5.46×10⁻¹ |
|
GO:0001701:in utero embryonic
development |
|
4.69×10⁻⁴ |
8.14×10⁻¹ |
|
GO:0010033:response to organic
substance |
|
4.69×10⁻⁴ |
8.14×10⁻¹ |
| Yellow module | 191 |
|
|
|
GO:0048732:gland
development |
|
1.61×10⁻⁵ |
2.61×10⁻² |
|
GO:0042981:regulation of
apoptosis |
|
1.83×10⁻⁵ |
2.97×10⁻² |
|
GO:0043067:regulation of
programmed cell death |
|
1.92×10⁻⁵ |
3.11×10⁻² |
|
GO:0010941:regulation of cell
death |
|
2.61×10⁻⁴ |
4.21×10⁻¹ |
|
GO:0009611:response to
wounding |
|
5.23×10⁻⁴ |
8.43×10⁻¹ |
|
| B, Non-aggressive
breast cancer cell lines |
|
| Top five terms | No. of genes in
ME | P-value | FDR |
|
| Blue module | 374 |
|
|
|
GO:0006796:phosphate metabolic
process |
|
2.79×10⁻⁴ |
4.80×10⁻¹ |
|
GO:0006793:phosphorus
metabolic process |
|
2.79×10⁻⁴ |
4.80×10⁻¹ |
|
GO:0000075:cell cycle
checkpoint |
|
2.91×10⁻⁴ |
4.99×10⁻¹ |
|
GO:0010033:response to organic
substance |
|
4.34×10⁻⁴ |
7.43×10⁻¹ |
|
GO:0046907:intracellular
transport |
|
5.63×10⁻⁴ |
9.65×10⁻¹ |
| Brown module | 90 |
|
|
|
GO:0007178:transmembrane
receptor protein serine/threonine kinase signaling pathway |
|
6.48×10⁻³ | 9.26 |
|
GO:0051789:response to protein
stimulus |
|
7.02×10⁻³ | 10.24 |
|
GO:0009615:response to
virus |
|
7.58×10⁻³ | 10.75 |
|
GO:0030509:BMP signaling
pathway |
|
1.11×10⁻² | 15.84 |
|
GO:0006955:immune
response |
|
1.29×10⁻² | 17.61 |
| Turquoise
module | 1,345 |
|
|
|
GO:0007155:cell adhesion |
|
8.22×10⁻¹² |
1.49×10⁻⁸ |
|
GO:0022610:biological
adhesion |
|
8.85×10⁻¹² |
1.61×10⁻⁸ |
|
GO:0009611:response to
wounding |
|
1.83×10⁻¹¹ |
3.32×10⁻⁸ |
|
GO:0048732:gland
development |
|
3.85×10⁻¹¹ |
6.98×10⁻⁸ |
|
GO:0001568:blood vessel
development |
|
4.20×10⁻¹¹ |
7.63×10⁻⁸ |
From Table II, the
GO enrichment demonstrated that biological process of distribution
of modules in the aggressive and non-aggressive group. The results
demonstrated the difference in biological processes in both groups.
Previous publications have reported that tumor metastasis is
closely associated with cell adhesions (23,24),
cytoskeletal development (25),
cell growth (26) and the
glycolysis pathway (5). Therefore,
the modules of blue and red in the aggressive group were considered
to be associated with metastasis.
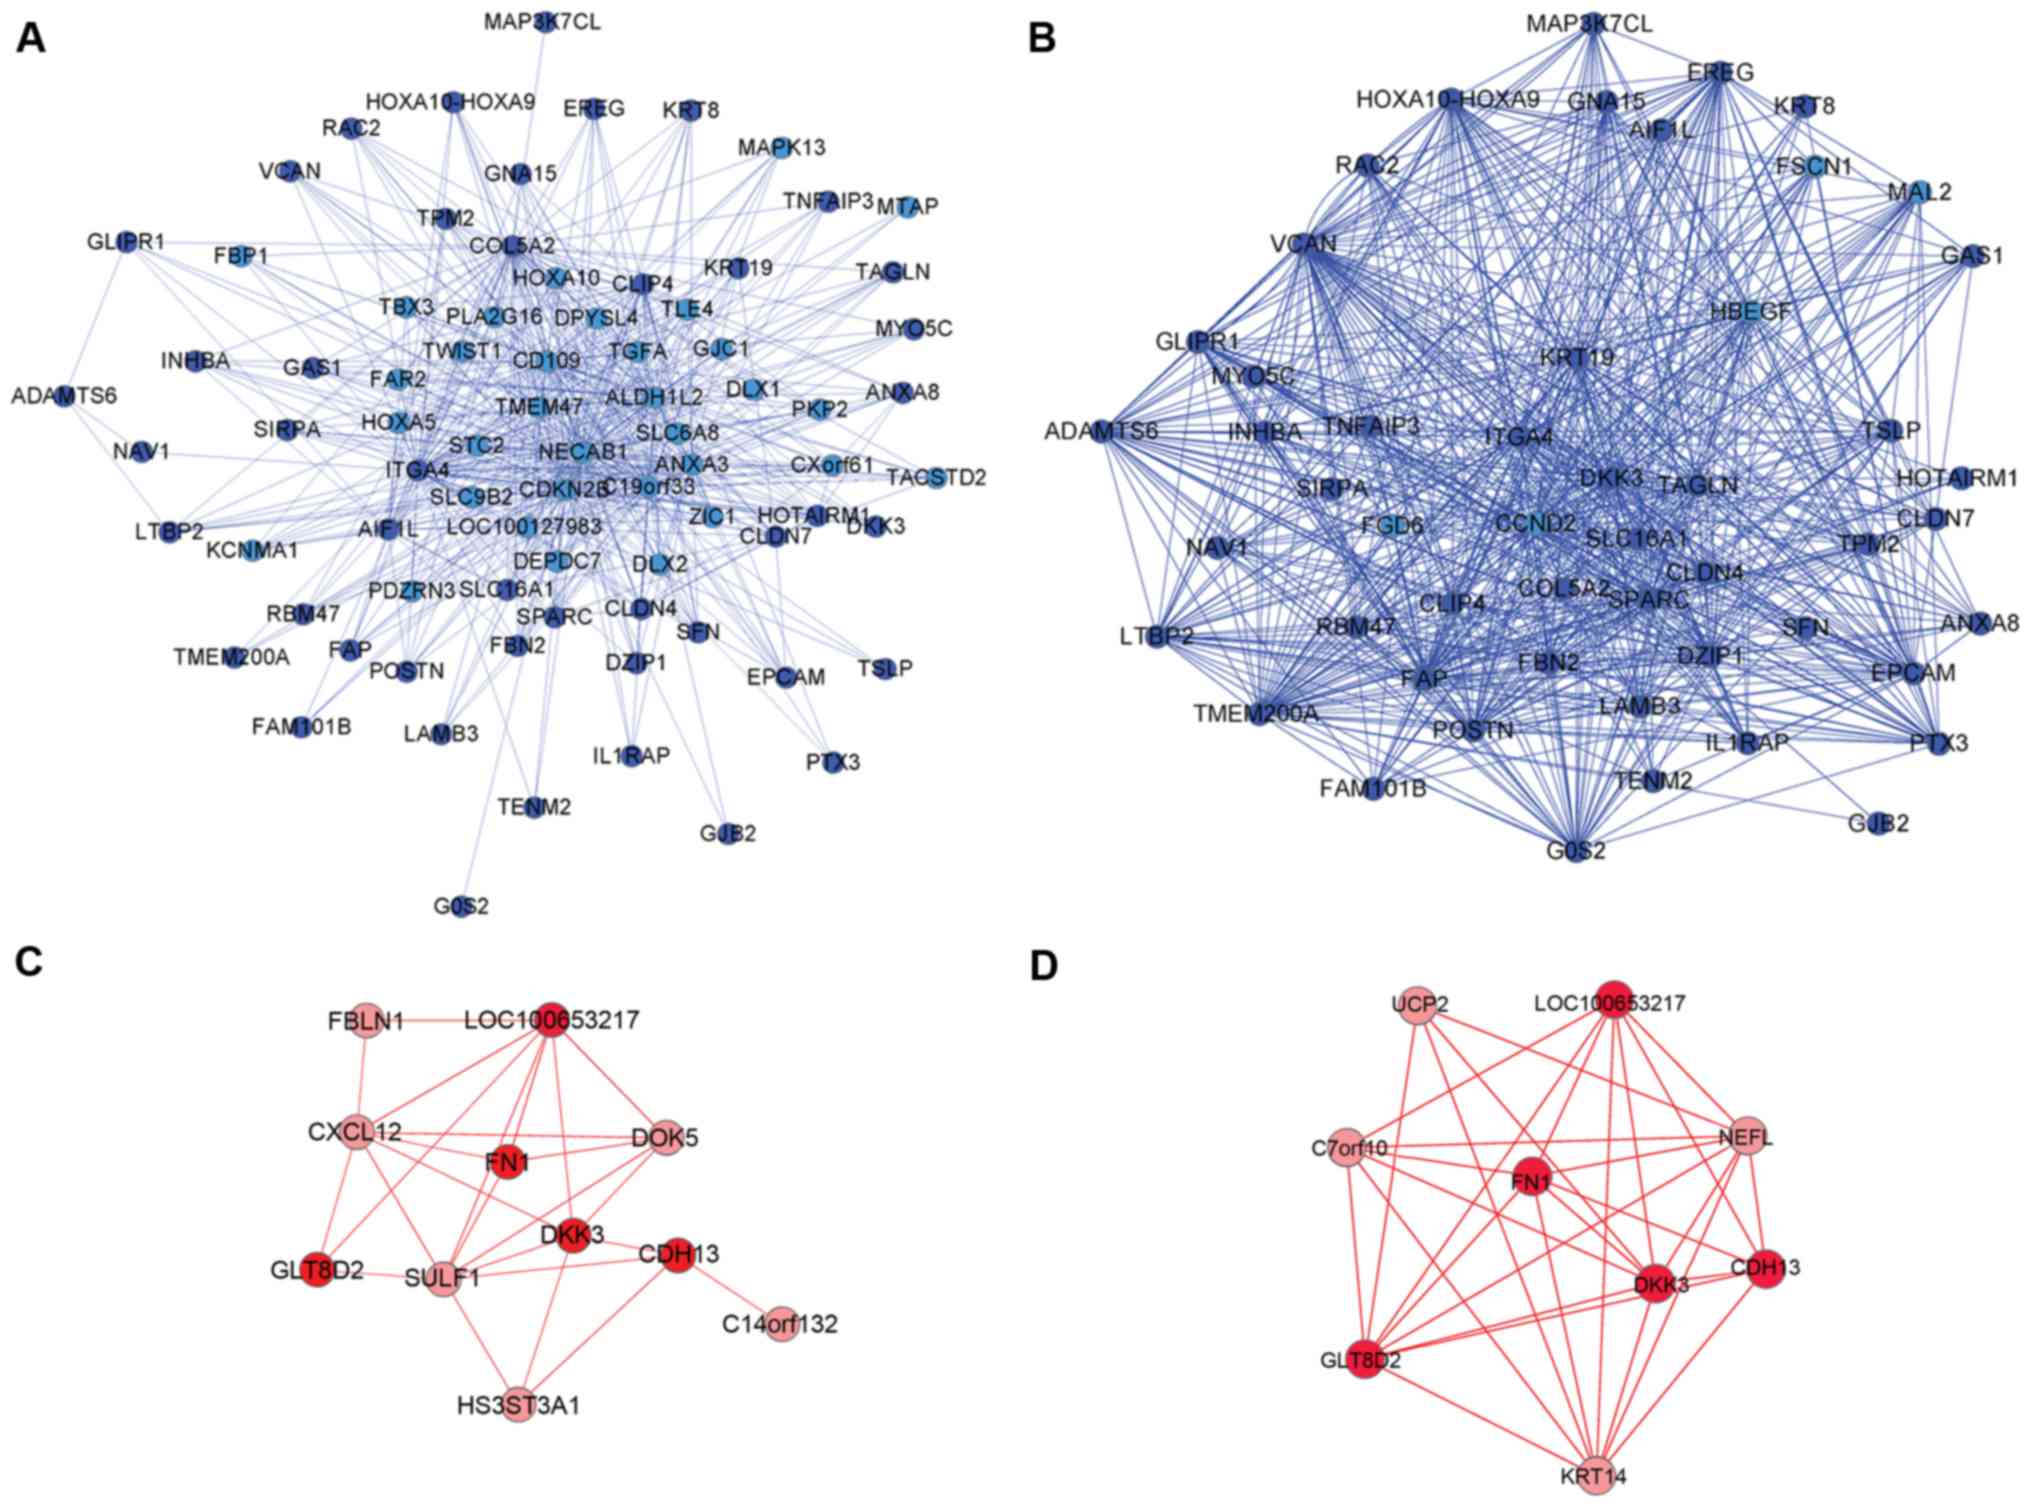
Visualization of intramodular network
construction for identification of hub genes and specific network
connections of breast cancer metastasis
To identify the metastasis specific network, the
greatest TO in metastatic breast cancer was depicted in the blue
and red modules by using Cytoscape 3.01 (27). The specific network of metastatic
breast cancer (ASij>0.8) was obtained using the
previously described equation (2).
Subsequently, the hub genes (strongest connections with other
genes) generally represent the important function in biological
networks (28,29). Fig.
3 presents the specific co-expression network in the blue and
red modules.
Fig. 3A and B
presents the comparison of the specific co-expression network of
the blue module in aggressive breast cancer and non-aggressive
breast cancer. These were filtered to obtain the top 20% greatest
TO of aggressive breast cancer and non-aggressive cancer. The
overlapping nodes (dark blue nodes) were arranged into similar
locations in the network and the nodes demonstrated the difference
in connectivity between the aggressive group and non-aggressive
group in the blue module. The aggressive group had the sparse
connectivity and the non-aggressive group had the dense
connectivity. In Fig. 3C and D,
the red module network also demonstrated the difference in network
topology between aggressive group and non-aggressive group. For
further investigation of the difference of the modules networks,
hub genes were selected for analysis. Table III presents the top five genes
with high intramodule connectivity (kin) as hub
genes in the aggressive group.
| Table III.List of top five genes with high
kin as hub genes in blue and red modules. |
Table III.
List of top five genes with high
kin as hub genes in blue and red modules.
| A, Blue module of
aggressive group |
|---|
|
|---|
| Gene symbol | Accession of
uniprot | Gene name |
kin (normalized) |
|---|
| TMEM47 | Q9BQJ4 | Transmembrane
protein 47 | 1.000 |
| GJC1 | P36383 | Gap junction γ-1
protein | 0.929 |
| ANXA3 | P12429 | Annexin A3 | 0.925 |
| TWIST1 | Q15672 | Twist-related
protein 1 | 0.917 |
|
C19orf33 | Q9GZP8 | Immortalization
upregulated protein | 0.905 |
|
| B, Red module of
non-aggressive group |
|
| Gene symbol | Accession of
uniprot | Gene name |
kin (normalized) |
|
|
LOC100653217 |
|
Neurotrimin-like | 1.000 |
| CXCL12 | P48061 | Stromal
cell-derived factor 1 | 0.958 |
| SULF1 | Q8IWU6 | Sulfatase 1 | 0.936 |
| DOK5 | Q9P104 | Docking protein
5 | 0.819 |
| DKK3 | Q9UBP4 | Dickkopf-related
protein 3 | 0.782 |
The greatest kin values in the
aggressive group are presented in Table III. The hub genes in the blue
module of aggressive group were all absent in the non-aggressive
group. The hub genes included stromal cell-derived factor 1
(CXCL12) and docking protein 5 (DOK5) in the
aggressive group red module were present in the non-aggressive
group. The genes GJC1, ANXA3 and TWIST1 have
been previously reported to be associated with metastatic tumor
(30–32). GJC1 is associated with
breast cancer, which was associated with amplification of ERBB2
receptor tyrosine kinase 2 (ERBB2) that is an important breast
cancer marker (33). ANXA3
was previously reported as a novel biomarker for lymph node
metastasis and prognosis in lung cancer (31). TWIST1 is an extensively
studied regulator associated with breast cancer metastasis.
TWIST1 is considered to be a master regulator of embryonic
morphogenesis and has an essential role in metastasis (32,34,35).
Transmembrane protein 47 (TMEM47) and immortalization
upregulated protein (C19orf33) are not reported to be
involved in breast cancer metastasis, to the best of our knowledge.
In the red module, CXCL12, sulfatase 1 (SULF1),
DOK5 and DKK3 are all reported to be closely
associated with breast cancer metastasis. CXCL12 possesses
angiogenic properties and is involved in the outgrowth and
metastasis of C-X-C motif chemokine receptor 4-expressing tumors
and certain inflammatory autoimmune disorders (36). SULF1 overexpression is
considered as a prognostic and metastasis predictive marker in
human gastric cancer (37).
DOK5 expression is indicated to cause a significant
enhancement in the metastatic potential of the B16F10 cell line
(38). DKK3 expression
increased cell-cell adhesion and decreased cell migration (39). The function of neurotrimin-like
(LOC100653217) is currently unclear.
For validation of the hub genes using clinical data,
invasive breast carcinoma data was retrieved from the TCGA and GEO
databases. HR and P-value from Cox regression analysis were
calculated and presented in Table
IV.
| Table IV.Nine hub genes predictive of survival
in patients with breast in the Cancer Genome Atlas database. |
Table IV.
Nine hub genes predictive of survival
in patients with breast in the Cancer Genome Atlas database.
| Gene symbol | Gene name | Hazard ratio | Cox P-value | Confidence interval
(95%) |
|---|
| TMEM47 | Transmembrane
protein 47 | 1.161 | 0.004 | 1.049–1.286 |
| GJC1 | Gap junction γ-1
protein | 1.192 | 0.025 | 1.022–1.390 |
| ANXA3 | Annexin A3 | 1.114 | 0.016 | 1.021–1.214 |
| TWIST1 | Twist-related
protein 1 | 1.145 | 0.019 | 1.022–1.283 |
|
C19orf33 | Immortalization
upregulated protein | 0.956 | 0.118 | 0.903–1.012 |
| CXCL12 | Stromal
cell-derived factor 1 | 1.203 | 0.001 | 1.076–1.345 |
| SULF1 | Sulfatase 1 | 0.950 | 0.375 | 0.848–1.064 |
| DOK5 | Docking protein
5 | 1.045 | 0.395 | 0.944–1.158 |
| DKK3 | Dickkopf-related
protein 3 | 1.194 | 0.004 | 1.059–1.344 |
Table IV
demonstrates that C19orf33, SULF1 and DOK5 had
P>0.05. Other genes were significantly associated with the
survival time of patients with breast cancer and they are high-risk
genes (HR>1). Of these genes, TMEM47, CXCL12 and
TWIST1 have been demonstrated to be closely associated with
breast cancer aggression in previous studies (40–42).
Other genes with P<0.05 may also be promising biomarkers for the
prediction of survival in patients with breast cancer, in which
further study is required.
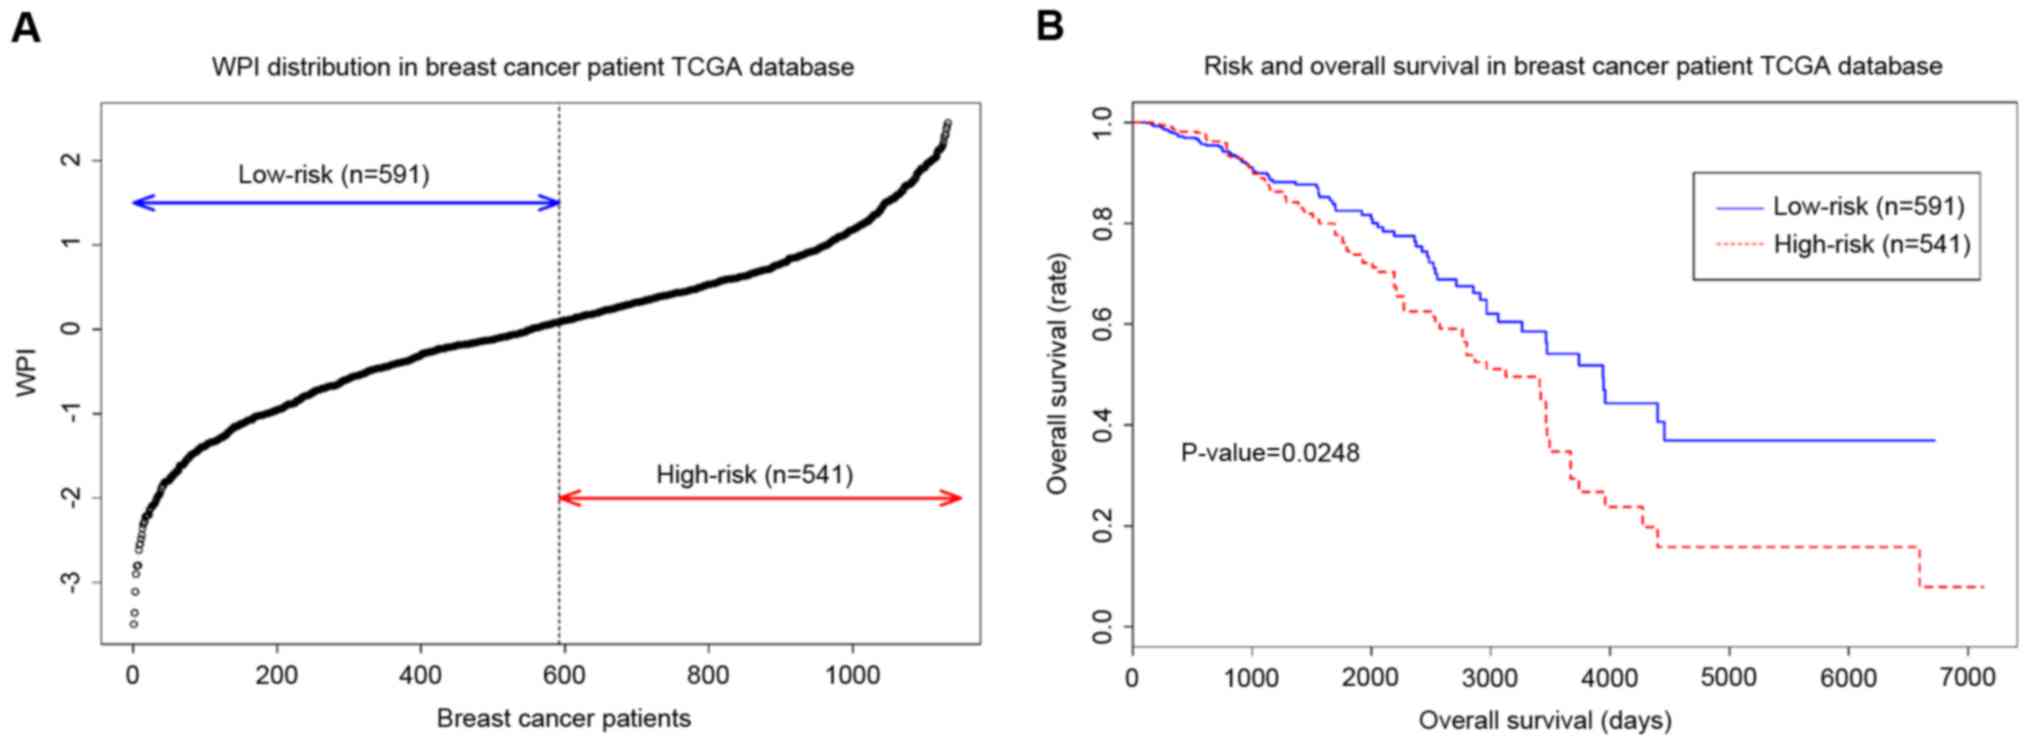
Generally, breast cancer aggressiveness is closely
associated with overall survival or disease relapse (43). Thus, the highest
kin hubs in two modules were tested by survival
analysis according to their expression. LOC100653217 was not
found in the TCGA database. Therefore, Cox regression and survival
analysis was used to determine the prognostic index of nine genes.
The WPI obtained from nine genes and 1,132 samples from the TCGA as
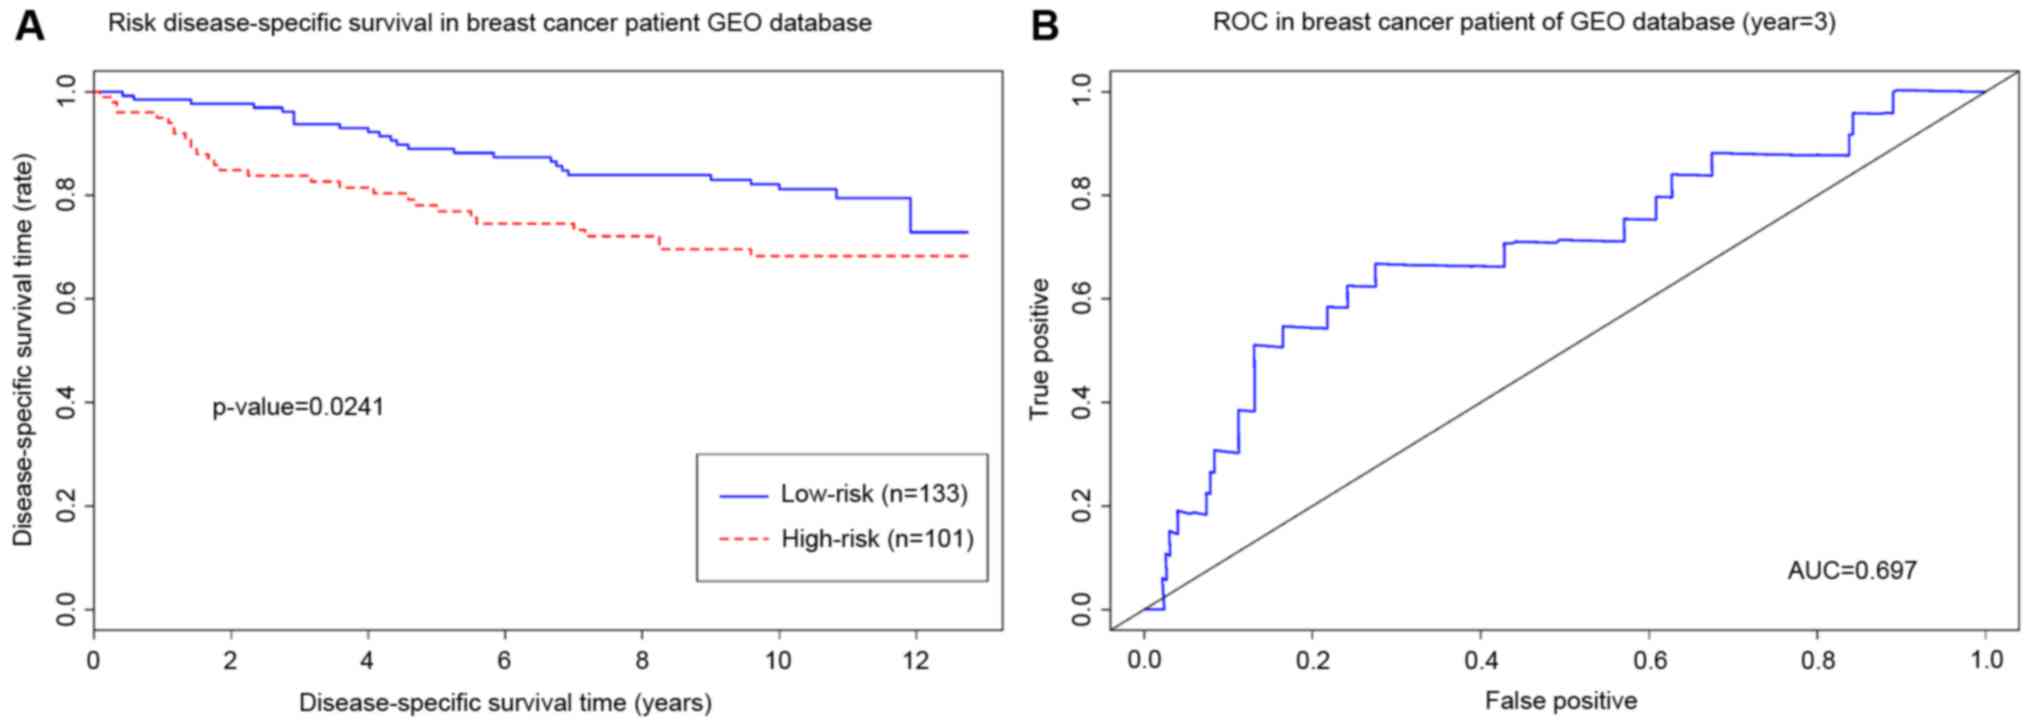
applied to classify low-risk and high-risk groups (Fig. 4A). Log-rank test (Fig. 4B) demonstrated that the two groups
classified by hub genes have significantly significant difference
(log-rank test, P<0.05, hazard ratio=1.231, 95% confidence
interval=1.058–1.433; Wald test, P=0.0071). Additionally, the
recurrence of cancer is another important indicator for estimating
the aggressiveness. Thus, the GSE3494 dataset that includes cancer
relapse data of patients with breast cancer was used to validate
the hub genes. The results of log-rank testing demonstrated that
high-risk group patients had a significantly shorter relapse time
compared with patients in the low-risk group (log-rank test,
P<0.05). The area under the curve of the receiver operating
characteristic was 0.697, which suggests that the integrative hub
genes are good predictors of breast cancer relapse (Fig. 5).
Discussion
The current study used WGCNA to explore gene
co-expression between aggressive breast cancer and non-aggressive
breast cancer cell lines. Network depictions can provide immediate
functional insights by revealing associations between genes and
biological processes. Comparative network analysis can also
prioritize genes for further investigation on the basis of
different connectivity, with previous studies supporting that gene
connectivity is a measure of functional relevance (44,45).
The current study is based on previous reports of
classification in aggressive and non-aggressive breast cell lines.
However, whether the MDA-MB-435 cell line is a breast cancer cell
line or a melanoma cell line has raised some controversy (46–48).
Rae et al (46) and
Capes-Davis et al (47)
reported that the cell line was a melanoma cell line, due to
karyotype and gene expression pattern similarity to melanoma cells.
Whereas, Chambers (48) considered
both the cell lines to be of breast cancer origin. According to Han
et al (14), the MDA-MB-435
cell line indeed represents a poorly differentiated, aggressive
breast tumor line indicated by overexpression of the SATB homeobox
1 (STAB1) gene. The present study focused on the co-expression
network of aggressive and non-aggressive breast cancer cells.
Therefore, the MDA-MB-435 cell line was included as an aggressive
breast cancer cell line.
Breast cancer is the most common malignant disease
and the various types have been extensively investigated.
Co-expression network analysis as a powerful tool is also applied
to study breast cancer. In previous studies, WGCNA was used to
analyze the association between gene expression in breast cancer
and the clinical traits in patients (9). In this study, the WGCNA was applied
to construct a co-expression network between aggressive and
non-aggressive breast cancer lines. The blue module and red module
were closely associated with an aggressive phonotype according to
previous publications. According to the current literature
regarding metastatic breast cancer, the biological mechanisms of
aggressiveness are associated with cell adhesions (23,24),
cytoskeletal development (25),
cell growth (26) and the
glycolysis pathway (5). The
results of the current study demonstrated that the blue module and
red module were closely associated with above biological process,
excluding glycolysis. Following filtering of data, the hub genes in
the blue and red modules were identified. From the finding of
previous studies, many of the hub genes have been previously
demonstrated to be associated with metastasis. However, the
association of these genes, and difference of these genes
co-expression between aggressive and non-aggressive breast cancer
are unclear. In the red module network, genes such as DKK3,
glycosyltransferase 8 domain containing 2, fibronectin 1, cadherin
13 and LOC100653217 were all present in the aggressive group
and non-aggressive group; however, these genes had different
connections in each group. For example, DKK3 as a hub gene
is present in the aggressive group and non-aggressive group, but
had different connectivity in the two groups. The connectivity of
DKK3 in the non-aggressive group as stronger than in the
aggressive group. According to previous publications, DKK3
expression can inhibit tumor metastasis (39,49).
Although the P-value from Cox regression of DKK3 was
<0.05, the stronger connection of DKK3 in non-aggressive
cell lines and weaker connection of DKK3 in aggressive cell
lines indicated that this gene may be a potential biomarker for
breast cancer aggressiveness.
In the blue module network, the top five hub genes
were all absent in the non-aggressive group. The overlapping genes
in both groups also had a difference in connection. The
non-aggressive group had more dense connection than the aggressive
group. The result indicated that the most of the top five hub genes
were associated with tumor metastasis. Although the function of
certain genes in tumor metastasis was unclear, the high
connectivity and HR may indicate that they have important roles in
metastasis. Previous studies have identified various markers for
breast cancer metastasis and prognosis. For example, SATB1 is
considered to be an important gene for breast cancer metastasis and
prognosis (14). ERBB2,
plasminogen activator urokinase and plasminogen activator inhibitor
1 are also important markers in breast cancer prognosis (1). Other research identified the p53,
Na-K ATPase-β1 and transforming growth factor-β receptor 2 are
associated with survival (9).
Although the individual gene function can reflect some issue of
metastasis, the metastasis and cancer is a multi-step cascade
(50). The gene expressions
analysis may provide more accurate information and underlying
mechanisms. In the current study, the different connections may
provide more information than individual gene expression
differences. Different connection can reflect the difference
cellular mechanisms between aggressive and non-aggressive breast
cancer. The data analysis may provide a potential candidate
biomarker for metastasis. Finally, PI was used to integrate these
hub genes, which were then investigated in clinical data obtained
from TCGA and GEO. The results demonstrate that the PI of hub genes
can significantly predict clinical outcome. In further study, other
potential genes are expected to be validated. The results may
provide new insight into understanding the potential mechanism of
aggressiveness of breast cancer.
Acknowledgements
The present study was supported by National Nature
Science Foundation of China (grant no. 61463046), Gansu Province
Science Foundation (grant no. 1606RJZA016) and Fundamental Research
Funds for the Central Universities (grant nos. 31920160003 and
31920170141).
References
|
1
|
Weigelt B, Peterse JL and van't Veer LJ:
Breast cancer metastasis: Markers and models. Nat Rev Cancer.
5:591–602. 2005. View Article : Google Scholar : PubMed/NCBI
|
|
2
|
Slamon DJ, Clark GM, Wong SG, Levin WJ,
Ullrich A and McGuire WL: Human breast cancer: Correlation of
relapse and survival with amplification of the HER-2/neu oncogene.
Science. 235:177–182. 1987. View Article : Google Scholar : PubMed/NCBI
|
|
3
|
Foekens JA, Peters HA, Look MP, Portengen
H, Schmitt M, Kramer MD, Brünner N, Jänicke F, Meijer-van Gelder
ME, Henzen-Logmans SC, et al: The urokinase system of plasminogen
activation and prognosis in 2780 breast cancer patients. Cancer
Res. 60:636–643. 2000.PubMed/NCBI
|
|
4
|
Ma XJ, Wang Z, Ryan PD, Isakoff SJ,
Barmettler A, Fuller A, Muir B, Mohapatra G, Salunga R, Tuggle JT,
et al: A two-gene expression ratio predicts clinical outcome in
breast cancer patients treated with tamoxifen. Cancer Cell.
5:607–616. 2004. View Article : Google Scholar : PubMed/NCBI
|
|
5
|
Wang X, Qian H and Zhang S: Discovery of
significant pathways in breast cancer metastasis via module
extraction and comparison. IET Syst Biol. 8:47–55. 2014. View Article : Google Scholar : PubMed/NCBI
|
|
6
|
Langfelder P and Horvath S: WGCNA: An R
package for weighted correlation network analysis. BMC
Bioinformatics. 9:5592008. View Article : Google Scholar : PubMed/NCBI
|
|
7
|
Langfelder P and Horvath S: Eigengene
networks for studying the relationships between co-expression
modules. Bmc Syst Biol. 1:542007. View Article : Google Scholar : PubMed/NCBI
|
|
8
|
Xiang Y, Zhang CQ and Huang K: Predicting
glioblastoma prognosis networks using weighted gene co-expression
network analysis on TCGA data. BMC Bioinformatics. 13 Suppl
2:S122012.PubMed/NCBI
|
|
9
|
Presson AP, Yoon NK, Bagryanova L, Mah V,
Alavi M, Maresh EL, Rajasekaran AK, Goodglick L, Chia D and Horvath
S: Protein expression based multimarker analysis of breast cancer
samples. BMC Cancer. 11:2302011. View Article : Google Scholar : PubMed/NCBI
|
|
10
|
Wang L, Tang H, Thayanithy V, Subramanian
S, Oberg AL, Cunningham JM, Cerhan JR, Steer CJ and Thibodeau SN:
Gene networks and microRNAs implicated in aggressive prostate
cancer. Cancer Res. 69:9490–9497. 2009. View Article : Google Scholar : PubMed/NCBI
|
|
11
|
Udyavar AR, Hoeksema M, Diggins K, Irish
J, Massion PP and Quaranta V: Abstract B27: Phenotypic plasticity
and heterogeneity in small cell lung cancer (SCLC): Novel molecular
subtypes and potential for targeted therapy. Clin Cancer Res.
20:B27. 2014. View Article : Google Scholar
|
|
12
|
Clarke C, Madden SF, Doolan P, Aherne ST,
Joyce H, O'Driscoll L, Gallagher WM, Hennessy BT, Moriarty M, Crown
J, et al: Correlating transcriptional networks to breast cancer
survival: A large-scale coexpression analysis. Carcinogenesis.
34:2300–2308. 2013. View Article : Google Scholar : PubMed/NCBI
|
|
13
|
Hua L, Zhou P, Li L, Liu H and Yang Z:
Prioritizing breast cancer subtype related miRNAs using miRNA-mRNA
dysregulated relationships extracted from their dual expression
profiling. J Theor Biol. 331:1–11. 2013. View Article : Google Scholar : PubMed/NCBI
|
|
14
|
Han HJ, Russo J, Kohwi Y and
Kohwi-Shigematsu T: SATB1 reprogrammes gene expression to promote
breast tumour growth and metastasis. Nature. 452:187–193. 2008.
View Article : Google Scholar : PubMed/NCBI
|
|
15
|
Barrett T, Troup DB, Wilhite SE, Ledoux P,
Rudnev D, Evangelista C, Kim IF, Soboleva A, Tomashevsky M and
Edgar R: NCBI GEO: Mining tens of millions of expression
profiles-database and tools update. Nucleic Acids Res. 35(Database
issue): D760–D765. 2007. View Article : Google Scholar : PubMed/NCBI
|
|
16
|
Zhang B and Horvath S: A general framework
for weighted gene co-expression network analysis. Stat Appl Genet
Mol Biol. 4:Article172005. View Article : Google Scholar : PubMed/NCBI
|
|
17
|
Keller MP, Choi Y, Wang P, Davis DB,
Rabaglia ME, Oler AT, Stapleton DS, Argmann C, Schueler KL, Edwards
S, et al: A gene expression network model of type 2 diabetes links
cell cycle regulation in islets with diabetes susceptibility.
Genome Res. 18:706–716. 2008. View Article : Google Scholar : PubMed/NCBI
|
|
18
|
da DW Huang, Sherman BT and Lempicki RA:
Systematic and integrative analysis of large gene lists using DAVID
bioinformatics resources. Nat Protoc. 4:44–57. 2009.PubMed/NCBI
|
|
19
|
da DW Huang, Sherman BT and Lempicki RA:
Bioinformatics enrichment tools: Paths toward the comprehensive
functional analysis of large gene lists. Nucleic Acids Res.
37:1–13. 2009. View Article : Google Scholar : PubMed/NCBI
|
|
20
|
Cox DR: Regressions models and life
tables. J Royal Statistical Soc. 34:187–200. 1972.
|
|
21
|
Xiong J, Bing Z, Su Y, Deng D and Peng X:
An integrated mRNA and microRNA expression signature for
glioblastoma multiforme prognosis. PLoS One. 9:e984192014.
View Article : Google Scholar : PubMed/NCBI
|
|
22
|
Ravasz E, Somera AL, Mongru DA, Oltvai ZN
and Barabási AL: Hierarchical organization of modularity in
metabolic networks. Science. 297:1551–1555. 2002. View Article : Google Scholar : PubMed/NCBI
|
|
23
|
Hermans TM, Pilans D, Huda S, Fuller P,
Kandere-Grzybowska K and Grzybowski BA: Motility efficiency and
spatiotemporal synchronization in non-metastatic vs. metastatic
breast cancer cells. Integr Biol (Camb). 5:1464–1473. 2013.
View Article : Google Scholar : PubMed/NCBI
|
|
24
|
DiMilla PA, Barbee K and Lauffenburger DA:
Mathematical model for the effects of adhesion and mechanics on
cell migration speed. Biophys J. 60:15–37. 1991. View Article : Google Scholar : PubMed/NCBI
|
|
25
|
Fife CM, McCarroll JA and Kavallaris M:
Movers and shakers: Cell cytoskeleton in cancer metastasis. Br J
Pharmacol. 171:5507–5523. 2014. View Article : Google Scholar : PubMed/NCBI
|
|
26
|
Chambers AF, Groom AC and MacDonald IC:
Dissemination and growth of cancer cells in metastatic sites. Nat
Rev Cancer. 2:563–572. 2002. View
Article : Google Scholar : PubMed/NCBI
|
|
27
|
Shannon P, Markiel A, Ozier O, Baliga NS,
Wang JT, Ramage D, Amin N, Schwikowski B and Ideker T: Cytoscape: A
software environment for integrated models of biomolecular
interaction networks. Genome Res. 13:2498–2504. 2003. View Article : Google Scholar : PubMed/NCBI
|
|
28
|
Hahn MW and Kern AD: Comparative genomics
of centrality and essentiality in three eukaryotic
protein-interaction networks. Mol Biol Evol. 22:803–806. 2005.
View Article : Google Scholar : PubMed/NCBI
|
|
29
|
Zotenko E, Mestre J, O'Leary DP and
Przytycka TM: Why do hubs in the yeast protein interaction network
tend to be essential: Reexamining the connection between the
network topology and essentiality. PLoS Comput Biol.
4:e10001402008. View Article : Google Scholar : PubMed/NCBI
|
|
30
|
King TJ and Bertram JS: Connexins as
targets for cancer chemoprevention and chemotherapy. Biochim
Biophys Acta. 1719:146–160. 2005. View Article : Google Scholar : PubMed/NCBI
|
|
31
|
Liu YF, Xiao ZQ, Li MX, Li MY, Zhang PF,
Li C, Li F, Chen YH, Yi H, Yao HX and Chen ZC: Quantitative
proteome analysis reveals annexin A3 as a novel biomarker in lung
adenocarcinoma. J Pathol. 217:54–64. 2009. View Article : Google Scholar : PubMed/NCBI
|
|
32
|
Croset M, Goehrig D, Frackowiak A,
Bonnelye E, Ansieau S, Puisieux A and Clézardin P: TWIST1
expression in breast cancer cells facilitates bone metastasis
formation. J Bone Miner Res. 29:1886–1899. 2014. View Article : Google Scholar : PubMed/NCBI
|
|
33
|
Marchiò C, Natrajan R, Shiu KK, Lambros
MB, Rodriguez-Pinilla SM, Tan DS, Lord CJ, Hungermann D, Fenwick K,
Tamber N, et al: The genomic profile of HER2-amplified breast
cancers: The influence of ER status. J Pathol. 216:399–407. 2008.
View Article : Google Scholar : PubMed/NCBI
|
|
34
|
Yang J, Mani SA, Donaher JL, Ramaswamy S,
Itzykson RA, Come C, Savagner P, Gitelman I, Richardson A and
Weinberg RA: Twist, a master regulator of morphogenesis, plays an
essential role in tumor metastasis. Cell. 117:927–939. 2004.
View Article : Google Scholar : PubMed/NCBI
|
|
35
|
Zhong J, Ogura K, Wang Z and Inuzuka H:
Degradation of the transcription factor Twist, an oncoprotein that
promotes cancer metastasis. Discov Med. 15:7–15. 2013.PubMed/NCBI
|
|
36
|
Liekens S, Schols D and Hatse S:
CXCL12-CXCR4 axis in angiogenesis, metastasis and stem cell
mobilization. Curr Pharm Des. 16:3903–3920. 2010. View Article : Google Scholar : PubMed/NCBI
|
|
37
|
Hur K, Han TS, Jung EJ, Yu J, Lee HJ, Kim
WH, Goel A and Yang HK: Up-regulated expression of sulfatases
(SULF1 and SULF2) as prognostic and metastasis predictive markers
in human gastric cancer. J Pathol. 228:88–98. 2012.PubMed/NCBI
|
|
38
|
Pothlichet J, Mangeney M and Heidmann T:
Mobility and integration sites of a murine C57BL/6 melanoma
endogenous retrovirus involved in tumor progression in vivo. Int J
Cancer. 119:1869–1877. 2006. View Article : Google Scholar : PubMed/NCBI
|
|
39
|
Kuphal S, Lodermeyer S, Bataille F,
Schuierer M, Hoang BH and Bosserhoff AK: Expression of Dickkopf
genes is strongly reduced in malignant melanoma. Oncogene.
25:5027–5036. 2006. View Article : Google Scholar : PubMed/NCBI
|
|
40
|
Burnett RM, Craven KE, Krishnamurthy P,
Goswami CP, Badve S, Crooks P, Mathews WP, Bhat-Nakshatri P and
Nakshatri H: Organ-specific adaptive signaling pathway activation
in metastatic breast cancer cells. Oncotarget. 6:12682–12696. 2015.
View Article : Google Scholar : PubMed/NCBI
|
|
41
|
Lv ZD, Kong B, Liu XP, Dong Q, Niu HT,
Wang YH, Li FN and Wang HB: CXCL12 chemokine expression suppresses
human breast cancer growth and metastasis in vitro and in vivo. Int
J Clin Exp Pathol. 7:6671–6678. 2014.PubMed/NCBI
|
|
42
|
Sosseyalaoui K, Pluskota E, Davuluri G,
Bialkowska K, Das M, Lindner D and Plow EF: Abstract 2088:
Kindlin-3 enhances breast cancer metastasis through upregulation of
Twist-mediated tumor angiogenesis. Cancer Res. 74:2088. 2014.
View Article : Google Scholar
|
|
43
|
Handerson T, Camp R, Harigopal M, Rimm D
and Pawelek J: Beta1,6-branched oligosaccharides are increased in
lymph node metastases and predict poor outcome in breast carcinoma.
Clin Cancer Res. 11:2969–2973. 2005. View Article : Google Scholar : PubMed/NCBI
|
|
44
|
Jeong H, Mason SP, Barabási AL and Oltvai
ZN: Lethality and centrality in protein networks. Nature.
411:41–42. 2001. View Article : Google Scholar : PubMed/NCBI
|
|
45
|
Schadt EE, Lamb J, Yang X, Zhu J, Edwards
S, Guhathakurta D, Sieberts SK, Monks S, Reitman M, Zhang C, et al:
An integrative genomics approach to infer causal associations
between gene expression and disease. Nat Genet. 37:710–717. 2005.
View Article : Google Scholar : PubMed/NCBI
|
|
46
|
Rae JM, Creighton CJ, Meck JM, Haddad BR
and Johnson MD: MDA-MB-435 cells are derived from M14 melanoma
cells-a loss for breast cancer, but a boon for melanoma research.
Breast Cancer Res Treat. 104:13–19. 2007. View Article : Google Scholar : PubMed/NCBI
|
|
47
|
Capes-Davis A, Theodosopoulos G, Atkin I,
Drexler HG, Kohara A, MacLeod RA, Masters JR, Nakamura Y, Reid YA,
Reddel RR and Freshney RI: Check your cultures! A list of
cross-contaminated or misidentified cell lines. Int J Cancer.
127:1–8. 2010. View Article : Google Scholar : PubMed/NCBI
|
|
48
|
Chambers AF: MDA-MB-435 and M14 cell
lines: Identical but not M14 melanoma? Cancer Res. 69:5292–5293.
2009. View Article : Google Scholar : PubMed/NCBI
|
|
49
|
Katase N, Gunduz M, Beder L, Gunduz E,
Lefeuvre M, Hatipoglu OF, Borkosky SS, Tamamura R, Tominaga S,
Yamanaka N, et al: Deletion at Dickkopf (dkk)-3 locus (11p15.2) is
related with lower lymph node metastasis and better prognosis in
head and neck squamous cell carcinomas. Oncol Res. 17:273–282.
2008. View Article : Google Scholar : PubMed/NCBI
|
|
50
|
Stracke ML and Liotta LA: Multi-step
cascade of tumor cell metastasis. In Vivo. 6:309–316.
1992.PubMed/NCBI
|