Introduction
Budd-Chiari syndrome (BCS) is a rare disease
(1), which occurs in 1/100,000 of
the general population worldwide (2). BCS is characterized by the occlusion
or obstruction of the hepatic venous outflow (3), which located at the hepatic veins or
on the suprahepatic portion of inferior vena cava (4). The hepatic veno-occlusive disease as
well as the obstruction induced by congestive heart failure is
excluded from this definition. The main symptoms of the BCS are
abdominal pain, hepatomegaly and ascites (5).
BCS is a multifactorial disease and its etiology and
underlying mechanism is not fully understood. However, a
hypercoagulable state and thrombosis with increased blood viscosity
are suspected to be the most common pathophysiological mechanism
(6). Myeloproliferative disorders
(MPDs) including polycythemia vera, essential thrombocythemia and
paroxysmal nocturnal hemoglobinemia are prothrombotic disorders
(4) that induce a hypercoagulable
state (7,8), which are the major causes of BCS, and
account for 40% of BCS cases (9).
In addition, antiphospholipid syndrome, hyperhomocysteinemia,
pregnancy, the use of oral contraceptive pills and deficiency in
antithrombin III proteins C and S, may also increase the risk of
BCS (10,11). Several gene mutations including the
JAK2 V617F, and the factor V Leiden are also associated with BCS
(12,13).
The 1-year spontaneous mortality rate of BCS is up
to 70% (14). Since there is a
lack of accurate and effective diagnosis and treatment in the early
stages of BCS, the mortality rate still remains high, despite the
current surgical approach (14).
Therefore, it is crucial to develop a novel strategy for an
accurate and sensitive diagnosis, and an effective therapy.
Differentially expressed genes (DEGs) in BCS
patients compared with the normal controls can make a contribution
to discovering the pathological progress and develop novel
diagnostic biomarkers for BCS. High-throughput technologies which
generate millions of reads in a short time and at a low cost were
developed rapidly in recent years (15). RNA deep-sequencing (RNA-seq) can
sequence cDNA and determine the RNA content in a sample by using
next-generation sequencing technologies (16). RNA-seq is a powerful method to
decipher global gene expression patterns and identify DEGs which
have been used in many research areas (17) while this technique has not been
performed to analyze and characterize the BCS transcriptome.
In the present study, RNA-seq was used to identify
DEGs in the BCS and functional annotation analysis and
Protein-Protein Interaction (PPI) networks construction were
performed to find the BCS-associated genes and pathways. This may
provide clues to pathological mechanisms, diagnostic and
therapeutic strategy for BCS.
Materials and methods
Patients
Blood samples were obtained from three patients
(patients 1–3) who were diagnosed with BCS, and from three healthy
individuals (normal controls; NC 1–3). Patient 1 was male, 31 years
old, and had been admitted to the hospital because of dizziness and
fatigue for 50 days and platelet reduction for 20 days and was
diagnosed with BCS (occlusion of inferior vena cava located above
the hepatic vein with many collateral circulations) with
splenomegaly and anemia. Patient 2 was female, 49 years old, and
was hospitalized for occasional swelling of the upper abdomen, and
was diagnosed with BCS (occlusion of inferior vena cava located
above the hepatic vein with many collateral circulations). Patient
3 was male, 68 years old, and had been admitted to the hospital
because of swelling of lower limbs and infections of lower limb
ulcerations for 1 year, and was diagnosed with BCS (occlusion of
inferior vena cava located near right atrium with many collateral
circulations) with infections of lower limbs ulcerations,
rheumatoid arthritis and chronic bronchitis. None of these three
patients had prior history of medication and family history. All
the participants submitted the written informed consent and the
protocol was approved by the ethical committee of Shandong Jining
No. 1 People's Hospital, Shandong, China.
RNA isolation and sequencing
According to the manufacturer's protocol, total RNA
was isolated from blood samples using TRIzol (Invitrogen; Thermo
Fisher Scientific Inc., Waltham, MA, USA). An RNeasy mini kit
(Qiagen Inc., Valencia, CA, USA) was used to purify the total RNA.
The quantity and integrity of purified RNA was checked using a
Nanodrop ND-2000 spectrophotometer (Thermo Fisher Scientific, Inc.)
and an Agilent 2100 Bioanalyzer. With a TruSeq RNA library
preparation kit (Illumina Inc., San Diego, CA, USA), messenger RNA
was purified from the samples (RIN>7), through oligo-d(T) probes
for polyA selection. qPCR was performed using a QIAquick PCR kit
(Qiagen Inc.) and the RNA-seq library was constructed. Sequencing
was performed on a HiSeqTM 2500 platform (Illumina Inc.).
Identification of DEGs
By using FastQC (version 0.11.4; Babraham Institute,
Cambridge, UK), the quality control of fastq data was performed
(Read QC). To obtain the high quality clean data, Cutadapt version
1.9.1 (http://cutadapt.readthedocs.io/en/stable/changes.html#v1-9-1-2015-12-02)
was used to remove low quality sequences, including ambiguous
nucleotides and adaptor sequences. The alignment between the
cleaned sequencing reads were aligned to the human genome
(GRCh38.p7 assembly) by Tophat version 2.1.1 (http://ccb.jhu.edu/software/tophat/index.shtml) using
the genome human University of California Santa Cruz reference
annotation (www.ucsc.edu/). Cuffdiff (cole-trapnell-lab.github.io/cufflinks/cuffdiff/index.html)
was used to assemble transcript and determine transcript abundance.
Fragments per kilobase of exon per million fragments were mapped to
determine the transcription abundancy of each gene.
Functional annotation
To further investigate the biological function of
DEGs, Gene Ontology (GO) enrichment analysis, using the ‘Biological
Process and Molecular Function’ tools, and the Kyoto Encyclopedia
of Genes and Genomes (KEGG) pathway analysis were performed by
using the online software GeneCodis
(genecodis.cnb.csic.es/analysis). A false discovery rate
(FDR)<0.05 was defined as the criteria for statistical
significance.
PPI network construction
The PPI network makes a contribution to discovering
the disease-associated pathways and reforming the strategy for drug
design, which is superior to the simple activation and inhibition
analysis of a single protein. In the present study, the top 20
upregulated and downregulated DEGs were used to construct the PPI
network by using Biological General Repository for Interaction
Datasets (BioGRID) (thebiogrid.org/) and Cytoscape (www.cytoscape.org/). Proteins were represented using
nodes and the interactions between two proteins were represented by
edges.
Statistical analysis
Student's t-test was performed to identify the
differentially expressed genes (DEGs). P<0.05 and abs
(count_1-count_2)>100 was considered to indicate a statistically
significant difference.
Results
RNA-sequencing and identification of
DEGs
Blood samples from three BCS patients and three
healthy controls were subjected to RNA sequencing. In total,
2.73×10⁷, 2.77×10⁷ and 2.73×10⁷
sequencing reads from BCS blood, and 2.74×10⁷,
2.68×10⁷ and 2.69×10⁷ reads from healthy
blood respectively, were generated. In addition, 90.2, 89.6 and
91.3% reads from BCS blood, and 87.7, 89 and 89.8% reads from
healthy blood, respectively, were mapped (Table I).
 | Table I.RNA sequencing results. |
Table I.
RNA sequencing results.
| Sample | Clean reads | Clean bases | Read length (bp) | Q20 (%) | GC (%) | Mapped (%) |
|---|
| A1 | 27,352,176 | 4,102,826,400 | 150 | 98.86;96.96 | 59.11 | 90.2 |
| A2 | 27,749,880 | 4,162,482,000 | 150 | 98.85;97.35 | 58.16 | 89.6 |
| A3 | 27,330,906 | 4,099,635,900 | 150 | 98.89;97.01 | 61.04 | 91.3 |
| B1 | 27,420,208 | 4,113,031,200 | 150 | 98.71;96.98 | 55.60 | 87.7 |
| B2 | 26,909,146 | 4,036,371,900 | 150 | 98.72;97.17 | 55.76 | 89 |
| B3 | 26,754,504 | 4,013,175,600 | 150 | 98.82;97.02 | 57.73 | 89.8 |
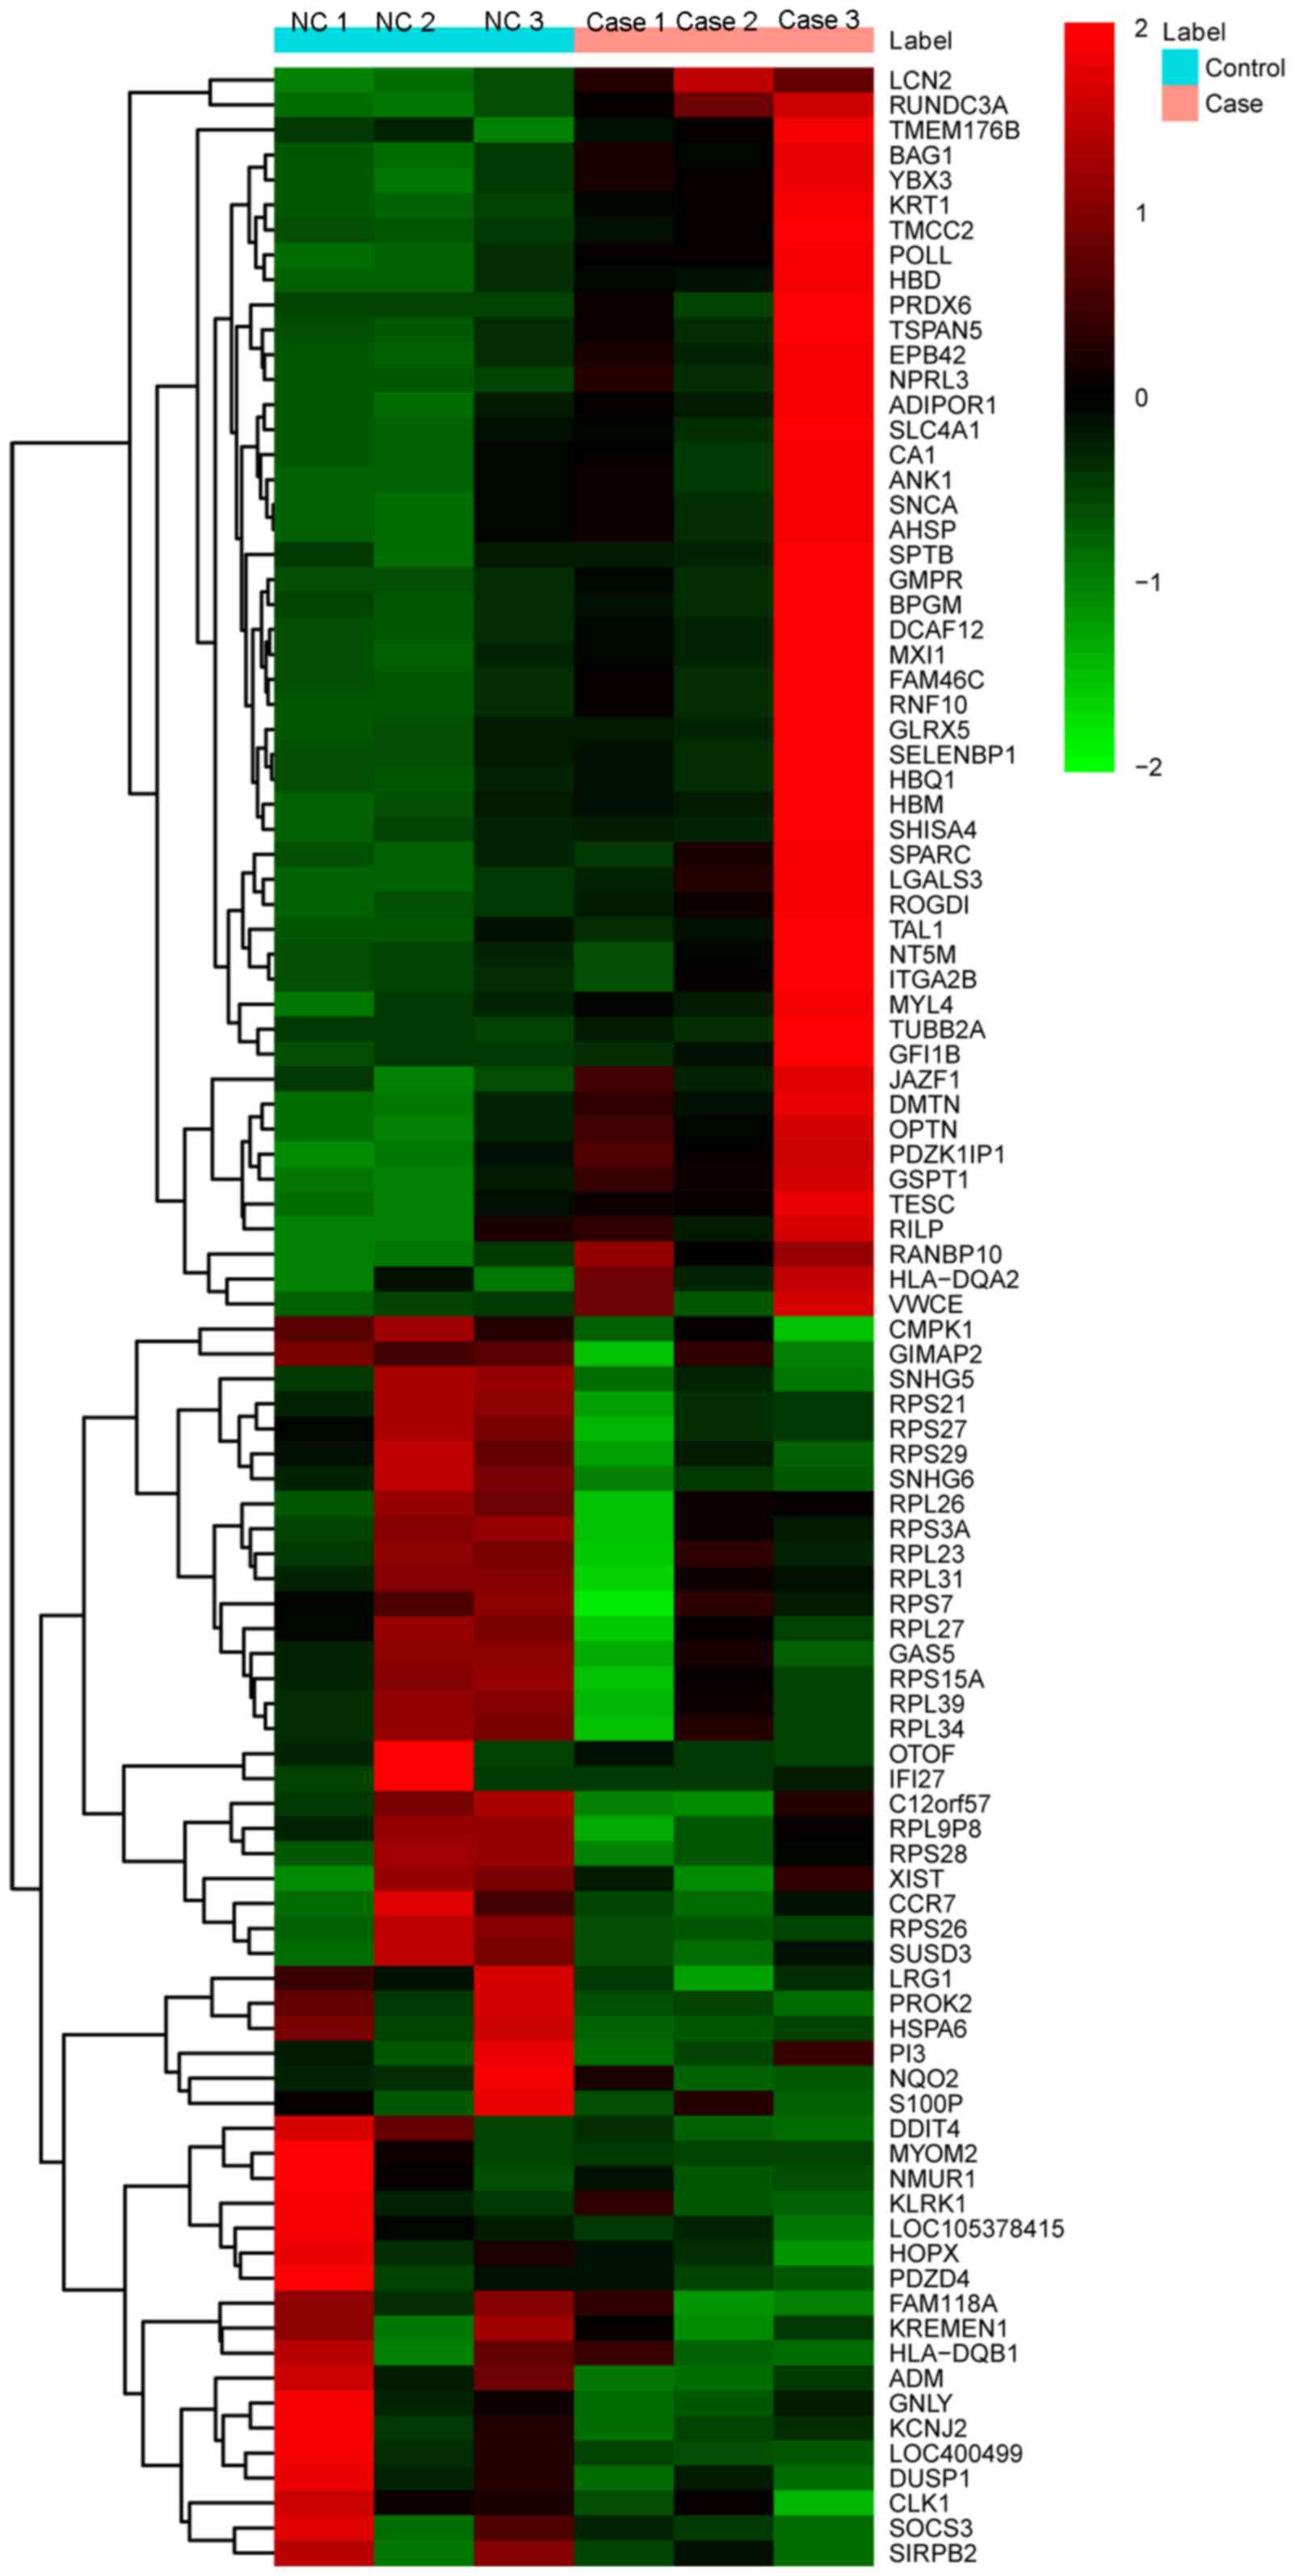
In total, 405 DEGs were identified, including 317
upregulated and 88 downregulated DEGs with P<0.05 and abs
(count_1-count_2)>100. The top 20 upregulated and downregulated
DEGs are displayed in Table II.
The heat-map of the top 100 DEGs is illustrated in Fig. 1.
| Table II.Top 20 upregulated and downregulated
differentially expressed genes in the BCS samples. |
Table II.
Top 20 upregulated and downregulated
differentially expressed genes in the BCS samples.
| Gene ID | Gene | NC count | BCS count | log2FC | P-value |
|---|
| 60675 | PROK2 | 521.102 | 178.57 | −1.44204 |
5.00×10⁵ |
| 387066 | SNHG5 | 435.639 | 148.469 | −1.62065 |
5.00×10⁵ |
| 9172 | MYOM2 | 472.403 | 32.4931 | −3.86276 |
5.00×10⁵ |
| 6231 | RPS26 | 2,135.57 | 583.471 | −1.90969 |
5.00×10⁵ |
| 6235 | RPS29 | 1,462.01 | 820.173 | −1.19722 |
5.00×10⁵ |
| 9381 | OTOF | 161.644 | 41.5735 | −2.01754 |
5.00×10⁵ |
| 133 | ADM | 363.37 | 174.728 | −1.08298 | 0.0001 |
| 3429 | IFI27 | 369.492 | 120.606 | −1.81854 | 0.0001 |
| 6227 | RPS21 | 2,030.92 | 1,169.11 | −1.0646 | 0.00015 |
| 10578 | GNLY | 1,866.86 | 911.448 | −1.09558 | 0.00015 |
| 254948 | RPL9P8 | 629.595 | 300.206 | −1.04615 | 0.0002 |
| 400499 | LOC400499 | 674.824 | 290.442 | −1.3079 | 0.00025 |
| 84525 | HOPX | 194.717 | 92.5097 | −1.02509 | 0.0003 |
| 55007 | FAM118A | 305.302 | 147.011 | −1.04756 | 0.00035 |
| 105378415 | LOC105378415 | 214.944 | 95.7043 | −1.01748 | 0.0004 |
| 3759 | KCNJ2 | 333.635 | 163.374 | −0.89589 | 0.00055 |
| 54541 | DDIT4 | 510.538 | 284.93 | −0.88093 | 0.00065 |
| 83999 | KREMEN1 | 286.922 | 149.081 | −0.94533 | 0.0009 |
| 60674 | GAS5 | 259.73 | 133.546 | −0.9557 | 0.00095 |
| 6170 | RPL39 | 1,460.23 | 905.571 | −0.86872 | 0.001 |
| 6622 | SNCA | 565.441 | 2,083.61 | 1.94496 |
5.00×10⁵ |
| 10098 | TSPAN5 | 137.195 | 527.282 | 2.02604 |
5.00×10⁵ |
| 10158 | PDZK1IP1 | 375.33 | 1,593.21 | 2.02767 |
5.00×10⁵ |
| 6886 | TAL1 | 88.6704 | 284.49 | 1.74036 |
5.00×10⁵ |
| 6678 | SPARC | 297.068 | 709.309 | 1.31365 |
5.00×10⁵ |
| 7280 | TUBB2A | 22.716 | 543.469 | 4.50119 |
5.00×10⁵ |
| 2766 | GMPR | 164.324 | 1,066.46 | 2.69842 |
5.00×10⁵ |
| 3118 | HLA-DQA2 | 37.4776 | 192.71 | 2.3648 |
5.00×10⁵ |
| 221895 | JAZF1 | 127.371 | 274.85 | 1.20758 |
5.00×10⁵ |
| 669 | BPGM | 101.964 | 238.092 | 1.33635 |
5.00×10⁵ |
| 28959 | TMEM176B | 481.731 | 1,453.35 | 1.57701 |
5.00×10⁵ |
| 2039 | DMTN | 1,493.17 | 5,665.35 | 1.86345 |
5.00×10⁵ |
| 286 | ANK1 | 72.7907 | 251.764 | 1.73898 |
5.00×10⁵ |
| 759 | CA1 | 59.5486 | 213.457 | 1.92874 |
5.00×10⁵ |
| 54855 | FAM46C | 148.663 | 514.282 | 1.91142 |
5.00×10⁵ |
| 573 | BAG1 | 1,319.88 | 4,566.92 | 1.85414 |
5.00×10⁵ |
| 25853 | DCAF12 | 628.567 | 2,552.27 | 2.10923 |
5.00×10⁵ |
| 3934 | LCN2 | 20.686 | 141.522 | 2.75439 |
5.00×10⁵ |
| 8328 | GFI1B | 58.8981 | 188.993 | 1.65276 |
5.00×10⁵ |
| 10133 | OPTN | 604.938 | 1,309.79 | 1.19751 |
5.00×10⁵ |
Functional annotation
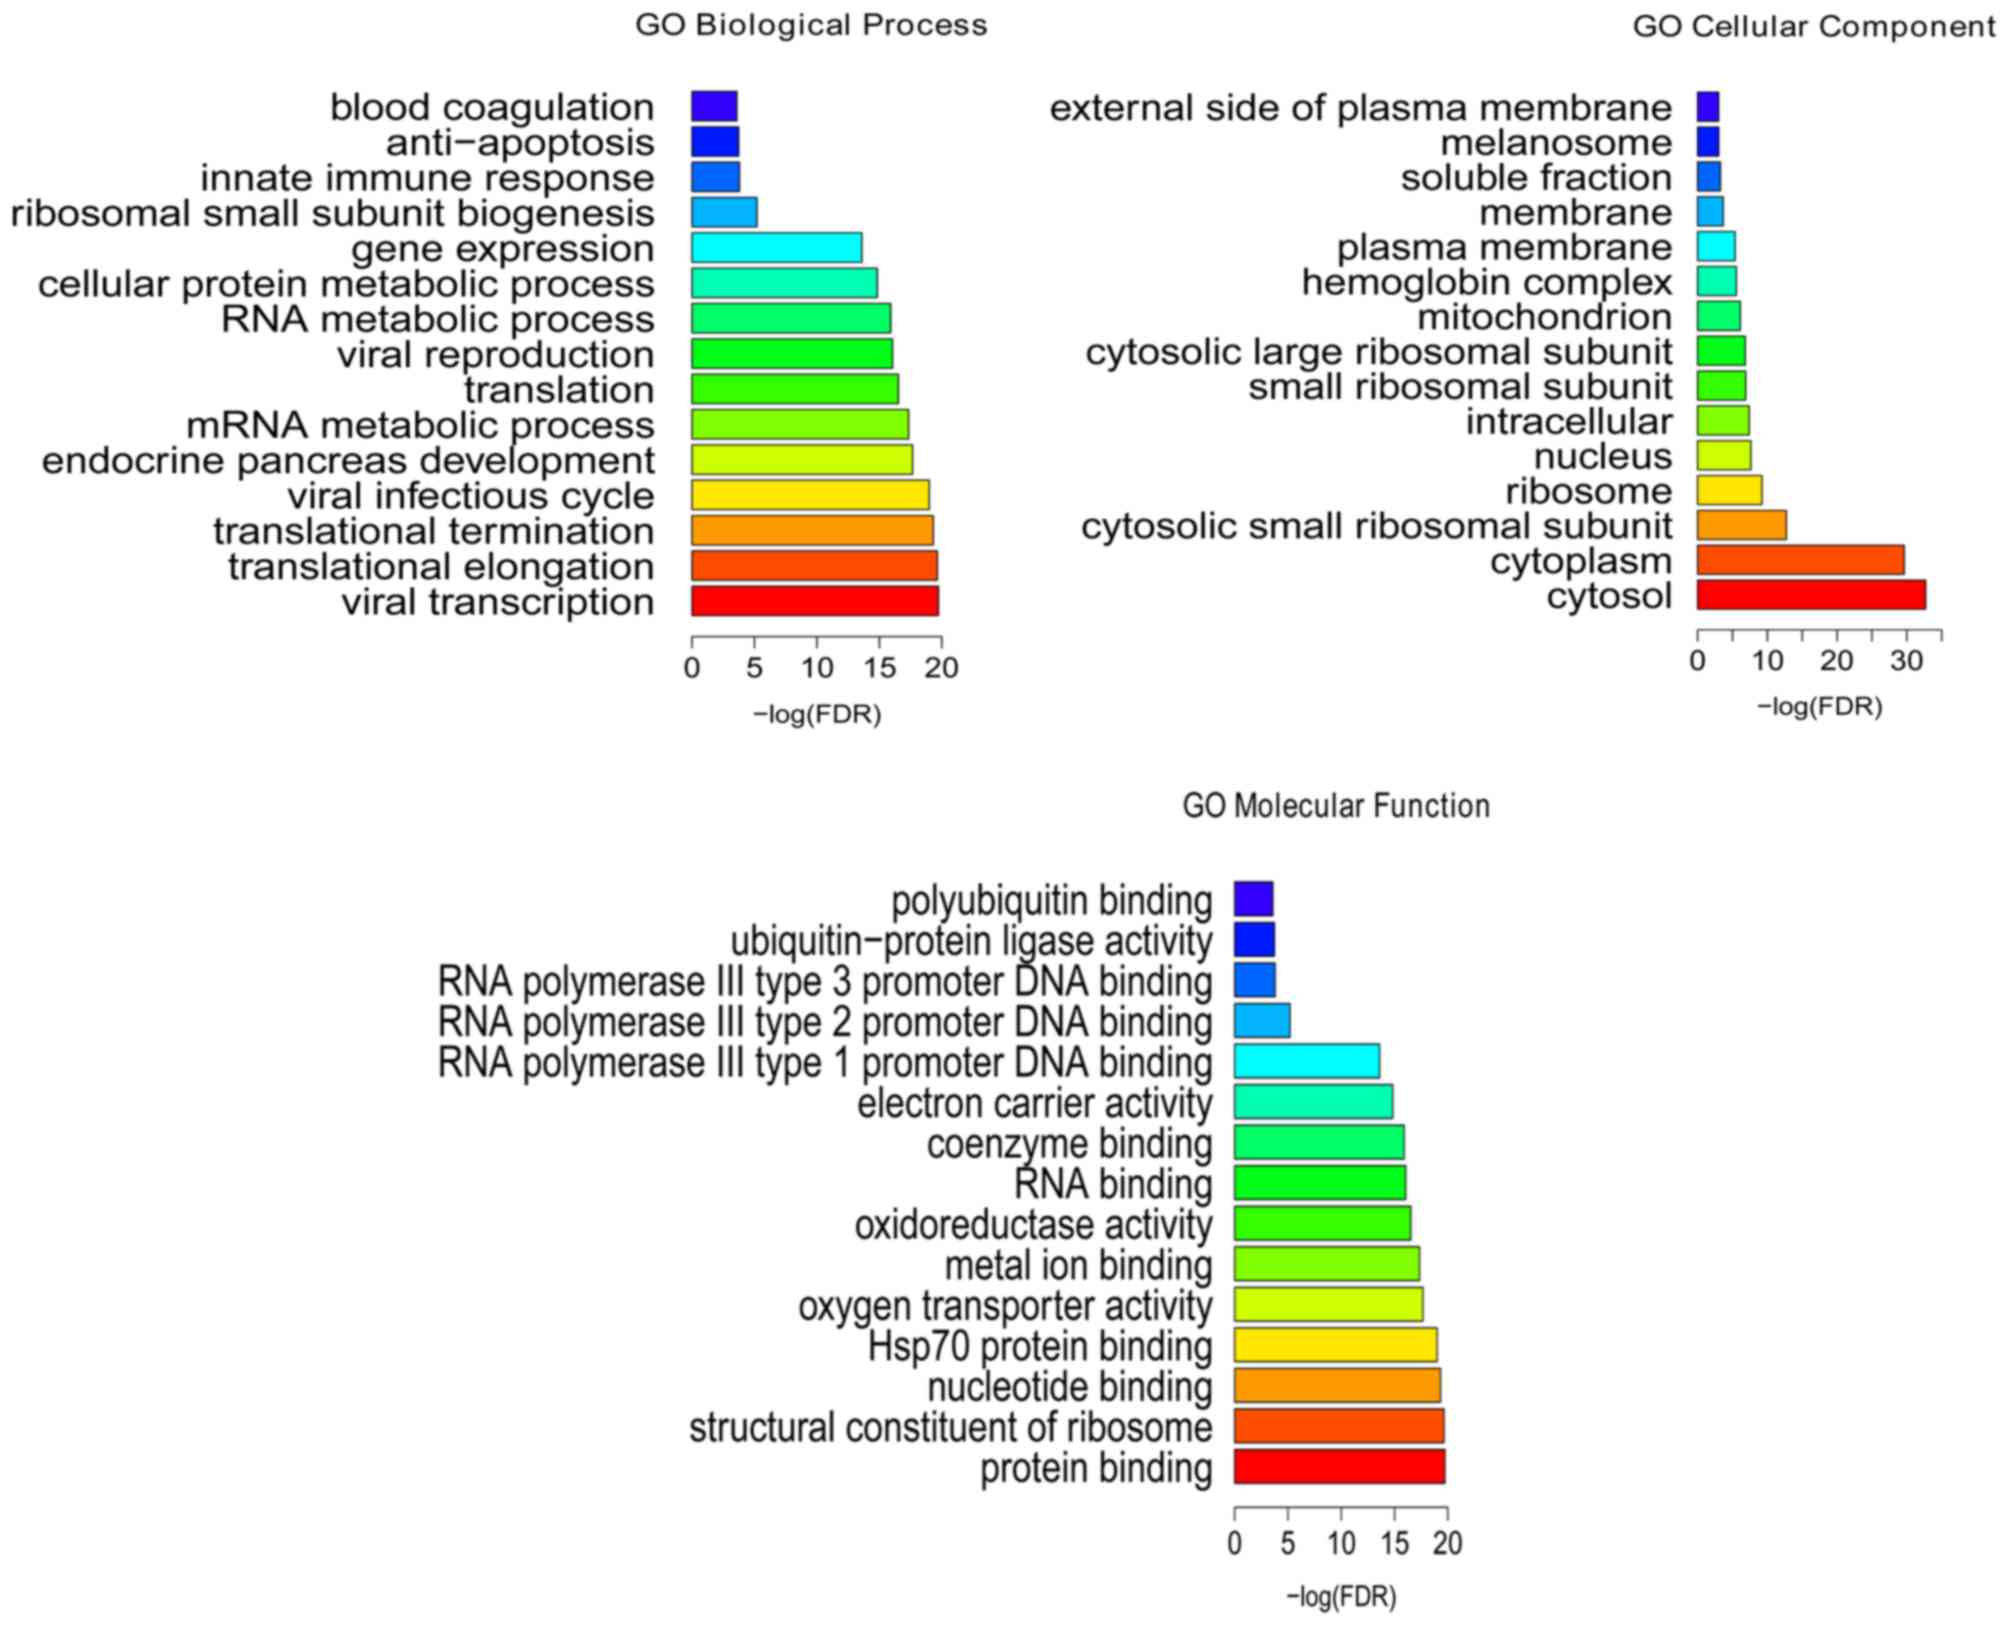
Following the GO enrichment analysis, viral
transcription (FDR=1.86E-20), translational elongation
(FDR=2.28E-20), protein binding (FDR=7.42E-31), structural
constituent of ribosome (FDR=7.52E-16), cytosol (FDR=2.02E-33) and
cytoplasm (FDR=2.38E-30) were the most significantly enriched GO
terms of DEGs in the BCS samples (Fig.
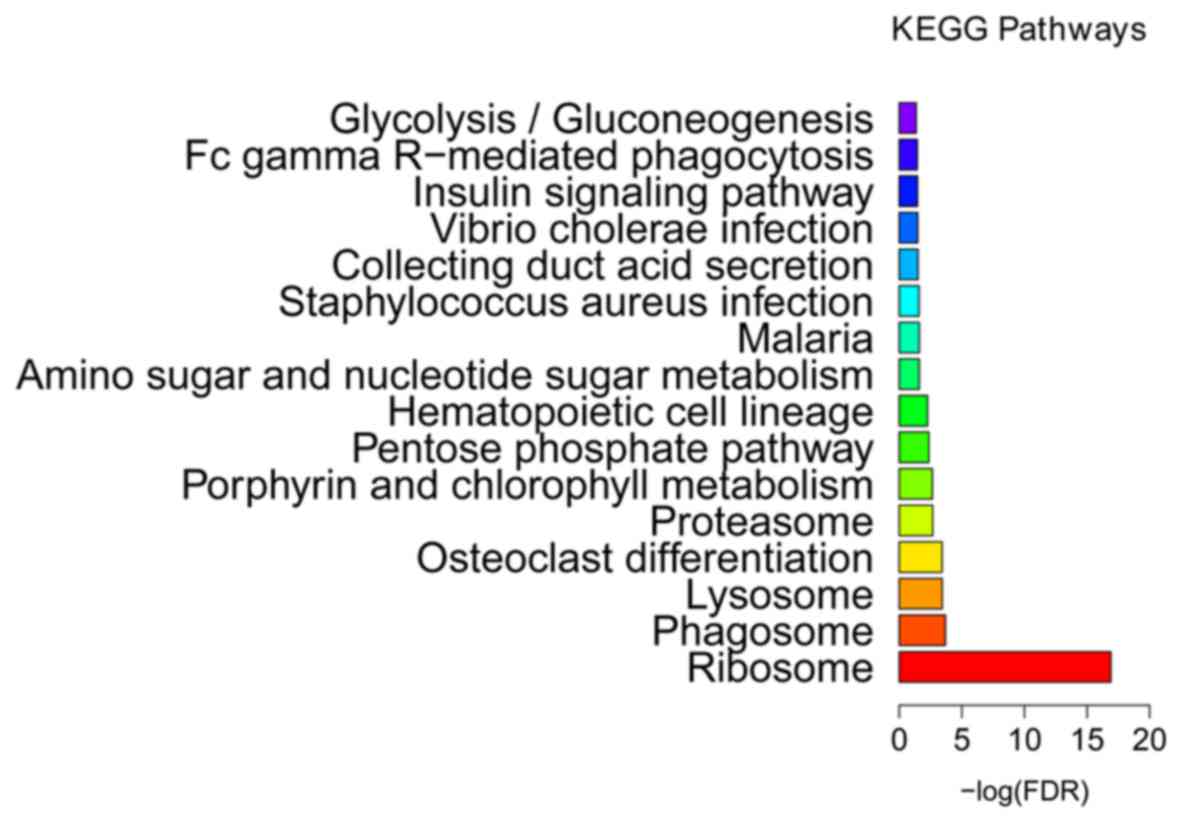
2). KEGG enrichment analysis (Fig.
3 and Table III) indicated
that ribosome (FDR=1.25E-17), phagosome (FDR=0.000204) and lysosome
(FDR=0.000368) were the most significantly enriched pathways in the
BCS samples. The proteasome (FDR=0.002124) was another
significantly enriched pathway in BCS, including DEGs such as the
proteasome subunit β type (PSMB) −2 and −10, proteasome subunit α
type-6 (PSMA6), proteasome inhibitor PI31 subunit (PSMF1) and 26S
proteasome non-ATPase regulatory subunit 2 (PSMD2).
| Table III.Most enriched pathways identified in
the BCS samples. |
Table III.
Most enriched pathways identified in
the BCS samples.
| KEGG ID | KEGG term | No. of genes | FDR | Gene list |
|---|
| hsa03010 | Ribosome | 19 | 1.25E-17 | RPS15A, RPS26,
RPS3A, RPS25, RPL17, RPS7, RPL30, RPS21, RPL31, RPL35, RPS28,
RPL26, RPL39, RPL23, RPS29, RPS27, RPL34, RPS24, RPL27 |
| hsa04145 | Phagosome | 10 | 0.000204 | HLA-DMA, NCF1,
ATP6V0A1, TUBB2A, DYNC1H1, RILP, CYBB, ATP6V0C, FCGR1A,
HLA-DQB1 |
| hsa04142 | Lysosome | 9 | 0.000368 | MCOLN1, GM2A, TPP1,
ATP6V0A1, GUSB, DNASE2, SORT1, ATP6V0C, AP1B1 |
| hsa04380 | Osteoclast
differentiation | 9 | 0.000384 | NCF1, PLCG2, RELB,
LILRB1, SOCS3, CSF1R, CYBB, LILRB4, FCGR1A |
| hsa03050 | Proteasome | 5 | 0.002124 | PSMB10, PSMA6,
PSMF1, PSMB2, PSMD2 |
| hsa00860 | Porphyrin and
chlorophyll metabolism | 5 | 0.002248 | FECH, GUSB, BLVRB,
HMBS, ALAS2 |
| hsa00030 | Pentose phosphate
pathway | 4 | 0.00423 | FBP1, GPI, G6PD,
PGD |
| hsa04640 | Hematopoietic cell
lineage | 6 | 0.005515 | CD22, GP1BB,
ITGA2B, CSF1R, FCGR1A, CD2 |
| hsa00520 | Amino sugar and
nucleotide sugar metabolism | 4 | 0.024957 | HK1, GPI, TSTA3,
RENBP |
| hsa05144 | Malaria | 4 | 0.024957 | HBD, KLRK1, GYPC,
LRP1 |
| hsa05150 | Staphylococcus
aureus infection | 4 | 0.02602 | HLA-DMA, FPR2,
FCGR1A, HLA-DQB1 |
| hsa04966 | Collecting duct
acid secretion | 3 | 0.031755 | SLC4A1, ATP6V0A1,
ATP6V0C |
| hsa05110 | Vibrio cholerae
infection | 4 | 0.032999 | PLCG2, ATP6V0A1,
ATP6V0C, GNAS |
| hsa04910 | Insulin signaling
pathway | 6 | 0.034042 | HK1, FBP1, RPTOR,
SOCS3, PPP1R3B, INPP5K |
| hsa04666 | Fc gamma R-mediated
phagocytosis | 5 | 0.035841 | NCF1, PLCG2, GSN,
WASF2, FCGR1A |
| hsa00010 |
Glycolysis/Gluconeogenesis | 4 | 0.043693 | HK1, FBP1, GPI,
BPGM |
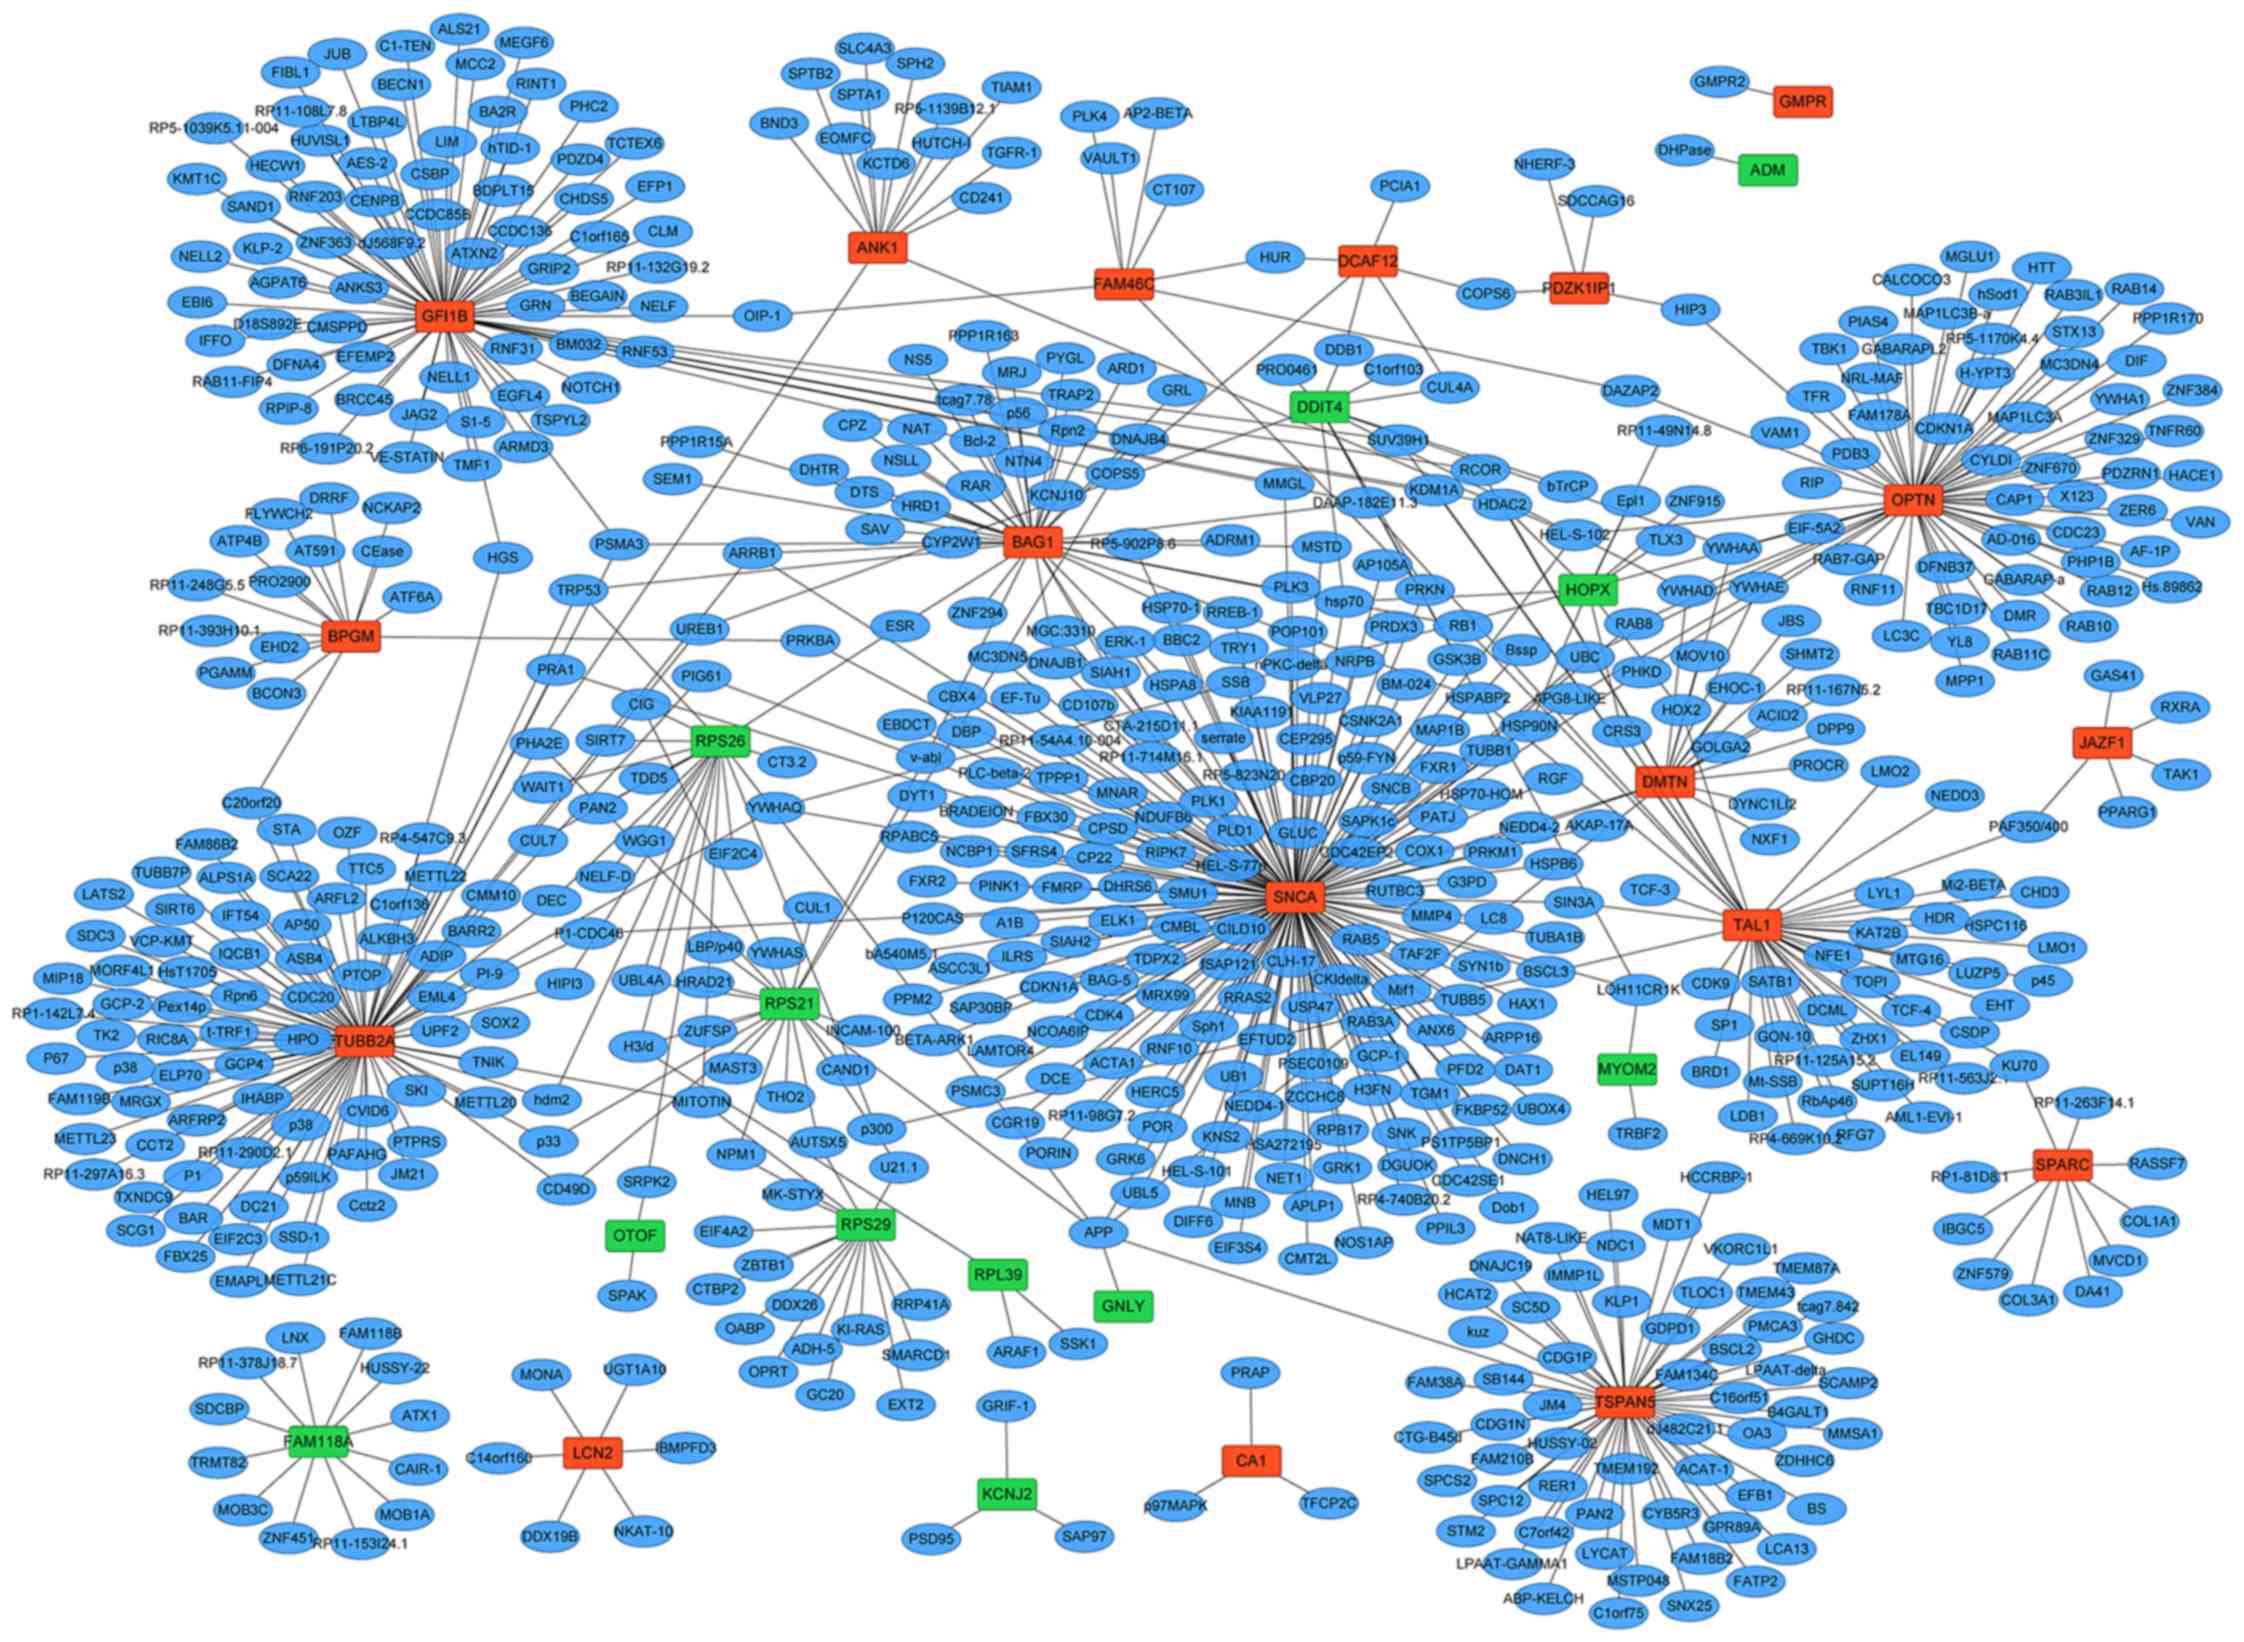
PPI network
The PPI network of 30 DEGs (18 upregulated and 12
downregulated DEGs) were constructed including 685 nodes and 747
edges (Fig. 4). According to the
PPI network, synuclein α (SNCA; degree=177), tubulin β-2A (TUBB2A;
degree=89) and zinc finger protein GFI-1b (GFI1B; degree=76) were
the three most significant hub proteins.
Discussion
In order to elucidate the pathogenesis of BCS at the
molecular level, RNA-sequencing was performed to analyze the
transcriptome of BCS patients compared with the healthy controls. A
total of 405 DEGs including 317 upregulated and 88 downregulated
DEGs, were identified.
Since myeloproliferative diseases (MPDs) are a
leading cause for BCS (9) genes
associated with MPDs may serve an important role in BCS.
A total of three MPDs-associated DEGs were
identified. Secreted protein acidic and cysteine rich (SPARC)
encodes a matrix-associated protein, which is involved with the
maintenance and restoration of tissue homeostasis (18). Recently, SPARC was reported to
serve an essential role in bone marrow stromal response to
myeloproliferation. Deficiency of SPARC can induce myelofibrosis
(MF), can suppress the activity in primary MF and enhance the
myeloproliferative response to thrombopoietin (19,20).
Hence, SPAR1 is a key gene which is associated with MPDs. In the
present study, SPACR was upregulated in the BCS patients compared
with the controls, confirming that SPACR may serve a key role in
BCS as well as in MPDs. Lipocalin-2 (LCN2) is an inflammatory
cytokine which is localized to myeloid cells within MF marrow cells
(21). LCN2 was reported to be
involved in the pathophysiological progress of MPDs (9). Compared with the controls,
upregulated LCN2 was detected in the plasma of multiple MPDs
patients including primary MF, PV-MF, and ET-MF patients (9). According to the present study, LCN2
was upregulated in the BCS patients as well. Another
MPDs-associated DEG identified, was interferon-inducible gene 27
(IFI27). IFI27 was reported to be upregulated in the patients with
MPDs (22), which was
downregulated in BCS patients in the present study, but requires
further investigation. Therefore, it can be speculated that
dysregulation of LCN2 and IFI27 may also serve an essential role in
BCS affecting the progress of MPDs.
Based on the PPI network, three hub genes including
SNCA, TUBB2A and GFI1B were identified. Among
them, the GFI1B gene is a member of growth factor
independence 1 gene family which is expressed in hematopoietic stem
cells and myeloid progenitors (23). Previous studies have speculated
that GFI1B may serve an important role in MPDs too (9). Because GFI1B is another DEG which
identified among the top 20 upregulated DEGs it can be concluded
that it may also be involved in the BCS possibly through its role
function in MPDs.
According to the KEGG enrichment analysis,
proteasome was a significantly enriched pathway in BCS. Proteasome
was reported to support stimulated platelet function and
thrombosis, and its inhibition can induce a hypothrombotic state
and reduce thrombosis (10). Since
the hypothrombotic state is a major mechanism of BCS, it can be
concluded that proteasome may serve an essential role in BCS by
regulating thrombosis, and the proteasome-associated DEGs including
PSMB10, PSMA6, PSMF1, PSMB2 and PSMD2 may be closely associated
with the pathological process of BCS.
In conclusion, several DEGs were identified in the
BCS samples using RNA-seq, including SPARC, LCN2, IFI27 and GFI1B.
Proteasome-associated DEGs may be involved in BCS through
regulating the thrombosis. The results of the present study may
provide a contribution to uncovering the underlying pathogenesis of
BCS and to developing novel strategies for its diagnosis and
treatment.
Acknowledgements
The present study was supported by the Study of the
Coagulation Function and Related Genes for Budd-Chiari syndrome in
Jining (grant no. 2014jnwk10).
Glossary
Abbreviations
Abbreviations:
|
APS
|
antiphospholipid syndrome
|
|
BCS
|
Budd-Chiari syndrome
|
|
DEGs
|
differentially expressed genes
|
|
ET
|
essential thrombocythemia
|
|
GFI1B
|
growth factor independent 1B
transcriptional repressor
|
|
GO
|
Gene Ontology
|
|
IFI27
|
interferon-inducible gene 27
|
|
IVC
|
inferior vena cava
|
|
KEGG
|
Kyoto Encyclopedia of Genes and
Genomes
|
|
LCN2
|
lipocalin-2
|
|
MF
|
myelofibrosis
|
|
MPDs
|
myeloproliferative disorders
|
|
PNH
|
paroxysmal nocturnal
hemoglobinemia
|
|
PPI
|
protein-protein interaction
|
|
PV
|
polycythemia vera
|
|
SNCA
|
synuclein α
|
|
SPARC
|
secreted protein acidic and cysteine
rich
|
|
TUBB2A
|
tubulin β 2A class IIa
|
References
|
1
|
Aydinli M and Bayraktar Y: Budd-Chiari
syndrome: Etiology, pathogenesis and diagnosis. World J
Gastroenterol. 13:2693–2696. 2007. View Article : Google Scholar : PubMed/NCBI
|
|
2
|
Valla DC: The diagnosis and management of
the Budd-Chiari syndrome: Consensus and controversies. Hepatology.
38:793–803. 2003. View Article : Google Scholar : PubMed/NCBI
|
|
3
|
Slakey DP, Klein AS, Venbrux AC and
Cameron JL: Budd-Chiari syndrome: Current management options. Ann
Surg. 233:522–527. 2001. View Article : Google Scholar : PubMed/NCBI
|
|
4
|
Rautou PE, Plessier A, Condat B and Valla
D: Primary Budd-Chiari syndrome. Sang Thrombose Vaisseaux.
22:201–208. 2010.
|
|
5
|
Pati S, Bhattacharya S and Rakshit VM:
Pregnancy complicated by Budd-Chiari syndrome and antiphospholipid
syndrome. J Obstet Gynaecol. 29:145–146. 2009. View Article : Google Scholar : PubMed/NCBI
|
|
6
|
Valla D, Casadevall N, Lacombe C, Varet B,
Goldwasser E, Franco D, Maillard JN, Pariente EA, Leporrier M and
Rueff B: Primary myeloproliferative disorder and hepatic vein
thrombosis. A prospective study of erythroid colony formation in
vitro in 20 patients with Budd-Chiari syndrome. Ann Intern Med.
103:329–334. 1985. View Article : Google Scholar : PubMed/NCBI
|
|
7
|
Denninger MH, Chait Y, Casadevall N,
Hillaire S, Guillin MC, Bezeaud A, Erlinger S, Briere J and Valla
D: Cause of portal or hepatic venous thrombosis in adults: The role
of multiple concurrent factors. Hepatology. 31:587–591. 2000.
View Article : Google Scholar : PubMed/NCBI
|
|
8
|
Usui T, Kitano K, Midorikawa T, Yoshizawa
K, Kobayashi H, Tanaka E, Matsunami H, Kawasaki S and Kiyosawa K:
Budd-Chiari syndrome caused by hepatic vein thrombosis in a patient
with myeloproliferative disorder. Intern Med. 35:871–875. 1996.
View Article : Google Scholar : PubMed/NCBI
|
|
9
|
Patel RK, Lea NC, Heneghan MA, Westwood
NB, Milojkovic D, Thanigaikumar M, Yallop D, Arya R, Pagliuca A,
Gaken J, et al: Prevalence of the activating JAK2, tyrosine kinase
mutation V617F in the Budd-Chiari syndrome. Gastroenterology.
130:2031–2038. 2006. View Article : Google Scholar : PubMed/NCBI
|
|
10
|
Pieri G, Theocharidou E and Burroughs AK:
Liver in haematological disorders. Best Prac Res Clin
Gastroenterol. 27:513–530. 2013. View Article : Google Scholar
|
|
11
|
Espinosa G, Font J, Garcia-Pagan JC,
Tassies D, Reverter JC, Gaig C, Cervantes F, Cervera R, Bosch J and
Ingelmo M: Budd-Chiari syndrome secondary to antiphospholipid
syndrome: Clinical and immunologic characteristics of 43 patients.
Medicine (Baltimore). 80:345–354. 2001. View Article : Google Scholar : PubMed/NCBI
|
|
12
|
Qi X, Yang Z, Bai M, Shi X, Han G and Fan
D: Meta-analysis: The significance of screening for JAK2V617F
mutation in Budd-Chiari syndrome and portal venous system
thrombosis. Aliment Pharmacol Ther. 33:1087–1103. 2011. View Article : Google Scholar : PubMed/NCBI
|
|
13
|
Janssen HL, Meinardi JR, Vleggaar FP, van
Uum SH, Haagsma EB, van Der Meer FJ, van Hattum J, Chamuleau RA,
Adang RP, Vandenbroucke JP, et al: Factor V Leiden mutation,
prothrombin gene mutation, and deficiences in coagulation
inhibitors associated with Budd-Chiari syndrome and portal vein
thrombosis: Results of a case-control study. Blood. 96:2364–2368.
2000.PubMed/NCBI
|
|
14
|
Plessier A, Sibert A, Hakime A, Consigny
Y, Zappa M, Denninger MH, Condat B, Farges O, Chagneau C, de
Ledinghen V, et al: Aiming at minimal invasiveness as a therapeutic
strategy for Budd-Chiari syndrome. Hepatology. 44:1308–1316. 2006.
View Article : Google Scholar : PubMed/NCBI
|
|
15
|
Wang L, Feng Z, Wang X, Wang X and Zhang
X: DEGseq: An R package for identifying differentially expressed
genes from RNA-seq data. Bioinformatics. 26:136–138. 2010.
View Article : Google Scholar : PubMed/NCBI
|
|
16
|
Nagalakshmi U, Waern K and Snyder M:
RNA-Seq: A method for comprehensive transcriptome analysis. Curr
Protoc Mol Biol Chapter. 4:4.11.1–14.11.13. 2010.
|
|
17
|
Zhao S, Fung-Leung WP, Bittner A, Ngo K
and Liu X: Comparison of RNA-Seq and microarray in transcriptome
profiling of activated T cells. PloS One. 9:e786442014. View Article : Google Scholar : PubMed/NCBI
|
|
18
|
Chiodoni C, Colombo MP and Sangaletti S:
Matricellular proteins: From homeostasis to inflammation, cancer,
and metastasis. Cancer Metastasis Rev. 29:295–307. 2010. View Article : Google Scholar : PubMed/NCBI
|
|
19
|
Tripodo C, Sangaletti S, Guarnotta C,
Piccaluga PP, Cacciatore M, Giuliano M, Franco G, Chiodoni C,
Sciandra M, Miotti S, et al: Stromal SPARC contributes to the
detrimental fibrotic changes associated with myeloproliferation
whereas its deficiency favors myeloid cell expansion. Blood.
120:3541–3554. 2012. View Article : Google Scholar : PubMed/NCBI
|
|
20
|
Livun A, Manshouri T, Kušec R, Zhang Y,
Kantarjian HM and Verstovšek S: Expression of a set of cell-stroma
interacting genes in patients with primary myelofibrosis.
Proceedings of the 14th Congress of European Hematology
Association, Berlin. 2009;
|
|
21
|
Lu M, Xia L, Liu YC, Hochman T, Bizzari L,
Aruch D, Lew J, Weinberg R, Goldberg JD and Hoffman R: Lipocalin
produced by myelofibrosis cells affects the fate of both
hematopoietic and marrow micro environmental cells. Blood.
126:972–982. 2015. View Article : Google Scholar : PubMed/NCBI
|
|
22
|
Skov V, Larsen TS, Thomassen M, Riley CH,
Jensen MK, Bjerrum OW, Kruse TA and Hasselbalch HC: Molecular
profiling of peripheral blood cells from patients with polycythemia
vera and related neoplasms: Identification of deregulated genes of
significance for inflammation and immune surveillance. Leuk Res.
36:1387–1392. 2012. View Article : Google Scholar : PubMed/NCBI
|
|
23
|
Vassen L, Okayama T and Moroy T: Gfi1b:
Green fluorescent protein knock-in mice reveal a dynamic expression
pattern of Gfi1b during hematopoiesis that is largely complementary
to Gfi1. Blood. 109:2356–2364. 2007. View Article : Google Scholar : PubMed/NCBI
|