Introduction
Intervertebral disc degeneration (IDD) is
characterized by increased extracellular matrix breakdown and
abnormal matrix synthesis leading to reduced hydration, loss of
disc height, and decreased ability to absorb load (1,2). It
is considered to be the primary source of chronic lower back pain
and spine-associated disease, which leads to major economic and
social burdens that affect millions of individuals globally
(3). The major clinical
manifestations of IDD are disc herniation, vertebral instability
and spinal stenosis. The ability to treat IDD effectively is
hindered by an incomplete understanding of the biological processes
that control intervertebral disc development, function and disease.
At present, IDD continues to be treated with symptomatic
interventions, which do not lead to substantially improved
outcomes, as no disease-modifying drugs are currently available
(4). Consequently, the clinical
management of IDD pathologies remains severely limited, with no
options at present for early intervention or predictive patient
screening. Therefore, an improved understanding of the
pathophysiology and molecular mechanisms underlying IDD is
essential for diagnosis and the development of novel therapeutic
approaches.
Although the etiology of IDD is likely to be
multifactorial, genetic factors are considered to be the greatest
contributors (5). Recently, the
molecular basis of degenerative disc disease has received increased
attention in research, which has substantially improved the
understanding of the biology underlying this process. Studies that
employed classic experimental approaches to investigate the
molecular changes associated with the pathophysiology of IDD have
established criteria to define degenerative intervertebral discs
(5,6). While helpful, these criteria involve
relatively few factors. In recent years, there has been an increase
in the use of transcriptomic approaches to identify the large
spectrum of factors that exhibit altered expression during IDD. For
instance, Chen et al (7)
identified mitogen-activated protein kinase kinase 6 and
Rho-related BTB domain-containing 2 as two specific therapeutic
molecular targets in the treatment of IDD. Periostin was proven to
be upregulated in the progression of human IDD (8). Furthermore, high-throughput screening
of human patient samples may identify potential biomarkers of IDD,
leading to more precise diagnostic criteria, classification of
disease progression and prognosis (9).
The intervertebral disc is composed of specialized
connective tissue structures that link adjacent vertebral bodies
along the spine and confer flexibility and mechanical stability to
the body trunk during axial compression. There are three
morphologically distinct regions in the intervertebral disc; the
nucleus pulposus (NP), annulus fibrosis (AF) and cartilaginous
endplates (10). Previous
microarray analysis of mRNA isolated from AF cells identified
differential expression of insulin-like growth factor binding
protein 3 and interferon-induced protein with tetratricopeptide
repeats 3 in the AF of IDD samples when compared with the control
samples (11). However, the
results obtained were limited as the study did not contain samples
from NP, which is an important region of the human intervertebral
disc. Therefore, the reanalysis of the gene expression profile by
applying bioinformatics methods remains necessary to identify
differentially expressed genes (DEGs) in IDD and further elucidate
the potential pathogenesis mechanisms of the disease.
The present study aimed to identify the DEGs and
further analyze their functions and pathways associated with the
progression of IDD by utilizing a bioinformatics method to analyze
microarray expression profiles from the NP and AF, and to obtain
additional insights regarding the mechanisms of IDD.
Materials and methods
Microarray data
The gene expression dataset GSE70362 was downloaded
from the Gene Expression Omnibus database (http://www.ncbi.nlm.nih.gov/geo) (11). It contained two groups of gene
expression profiles, including 16 NP samples from patients with IDD
and 8 from controls, and 16 AF samples from patients with IDD and 8
from controls. The platform was GPL17810 [HG-U133_Plus_2]
Affymetrix Human Genome U133A Plus 2.0 array (Affymetrix; Thermo
Fisher Scientific, Inc., Waltham, MA, USA). Probe annotation files
were also acquired.
Preprocessing and differential
analysis
Raw data were converted into a recognizable format
with the package affy of R (http://bioconductor.org/packages/release/bioc/html/affy.html,
version 1.54.0), and missing values were then inferred by a method
based on k-nearest neighbors (k-NN). The k-NN-based
method selects genes with expression profiles similar to the
gene of interest to infer missing values (12). Following background correction and
data normalization with the median method (13), differential analysis between
degeneration samples and controls was performed using the limma
package (version 3.32.5) (14).
The design matrix indicates which RNA samples have been applied to
each array, and the contrast matrix specifies the comparisons one
would like to make between the RNA samples. For statistical
analysis and the assessment of differential expression, limma
employs an empirical Bayes method to moderate the standard errors
of the estimated log-fold changes. The basic statistic used for
significance analysis is the moderated t-statistic, which is
computed for each probe and for each contrast. Moderated
t-statistics lead to P-values in the same way as ordinary
t-statistics, except that the degrees of freedom are increased,
reflecting the greater reliability associated with the smoothed
standard errors. Limma includes the functions top Table and decide
Tests, which summarize the results of the linear model, perform
hypothesis tests and adjust the P-values for multiple testing. The
results obtained include (log) fold changes, standard errors,
t-statistics and P-values (15).
Log |(fold change)| >1 and P<0.05 were set as the cut-offs to
screen out DEGs.
Gene Ontology (GO) functional
enrichment analysis of DEGs
In order to identify disturbed biological functions
in IDD and to understand the importance of genes, GO classification
was performed, which included the following categories: BP_Fat
(biological process); CC_Fat (cellular component); and MF_Fat
(molecular function). GO functional enrichment analysis was
performed for DEGs using the Database for Annotation, Visualization
and Integrated Discovery (DAVID; https://david.ncifcrf.gov/) with a threshold of
P<0.05 (16). DAVID provides a
comprehensive set of functional annotation tools for the
investigation of the biological context of large lists of
genes.
Pathway enrichment analysis of
DEGs
The Kyoto Encyclopedia of Genes and Genomes (KEGG;
http://www.genome.jp/kegg) database is a
collection of online databases consisting of genomes, enzymatic
pathways and biological chemicals (17). The present study performed KEGG
pathway enrichment analysis to determine the function of DEGs using
KOBAS 2.0 with a threshold of P<0.05. KOBAS 2.0 is a web server
that provides a comprehensive functional annotation tool for
associating biological pathways with genes based on mapping to
genes with established annotations, and also performs statistical
testing to identify statistically significantly enriched pathways
and diseases (18).
Comparison of DEGs between NP and
AF
Common DEGs from two regions of intervertebral disc
(NP and AF) were obtained using the package Venn of R verson:1.2
(https://cran.r-project.org/web/packages/venn/index.html).
A Venn diagram demonstrated the numbers of genes significant in
each comparison and extracted the same genes from them.
Protein-protein interaction network
modules construction
Although a number of enrichment analysis tools
support protein-protein interaction network-based enrichment
analysis, the majority typically rely on gene sets derived from
network decomposition at a single level, without considering the
hierarchical structure of the network. However, it is established
that hierarchical organization is a critical intrinsic property of
complex systems such as biological networks (19). The present study employed
WebGestalt (http://www.webgestalt.org) (20) to construct hierarchical protein
interaction network modules with common DEGs and modules with
adjusted P<0.05 were selected.
Establishing interaction network
between common DEGs and microRNAs (microRNAs/miRs)
The miRNAs that targeted the common DEGs were
retrieved with WebGestalt. WebGestalt is based on an Oracle
relational database, GeneKeyDB (http://www.webgestalt.org/option.php). It supports 7
gene identifiers from a number of public databases for human and
mouse, including Entrez Gene ID, Gene Symbol, RefSeq for DNA,
RefSeq for Protein, Unigene, Ensemble ID and Uniprot ID, and it has
added regulatory modules defined as sets of genes sharing common
transcription factors or microRNA binding sites, which have been
inferred from comparative genomic analysis and made available
through MSigDB (19). miRNAs with
adjusted P<0.05 were selected. The regulatory network between
DEGs and miRNAs, and interactions between DEGs were then visualized
with Cytoscape version 3.4.0 (http://www.cytoscape.org).
Results
Identification of DEGs
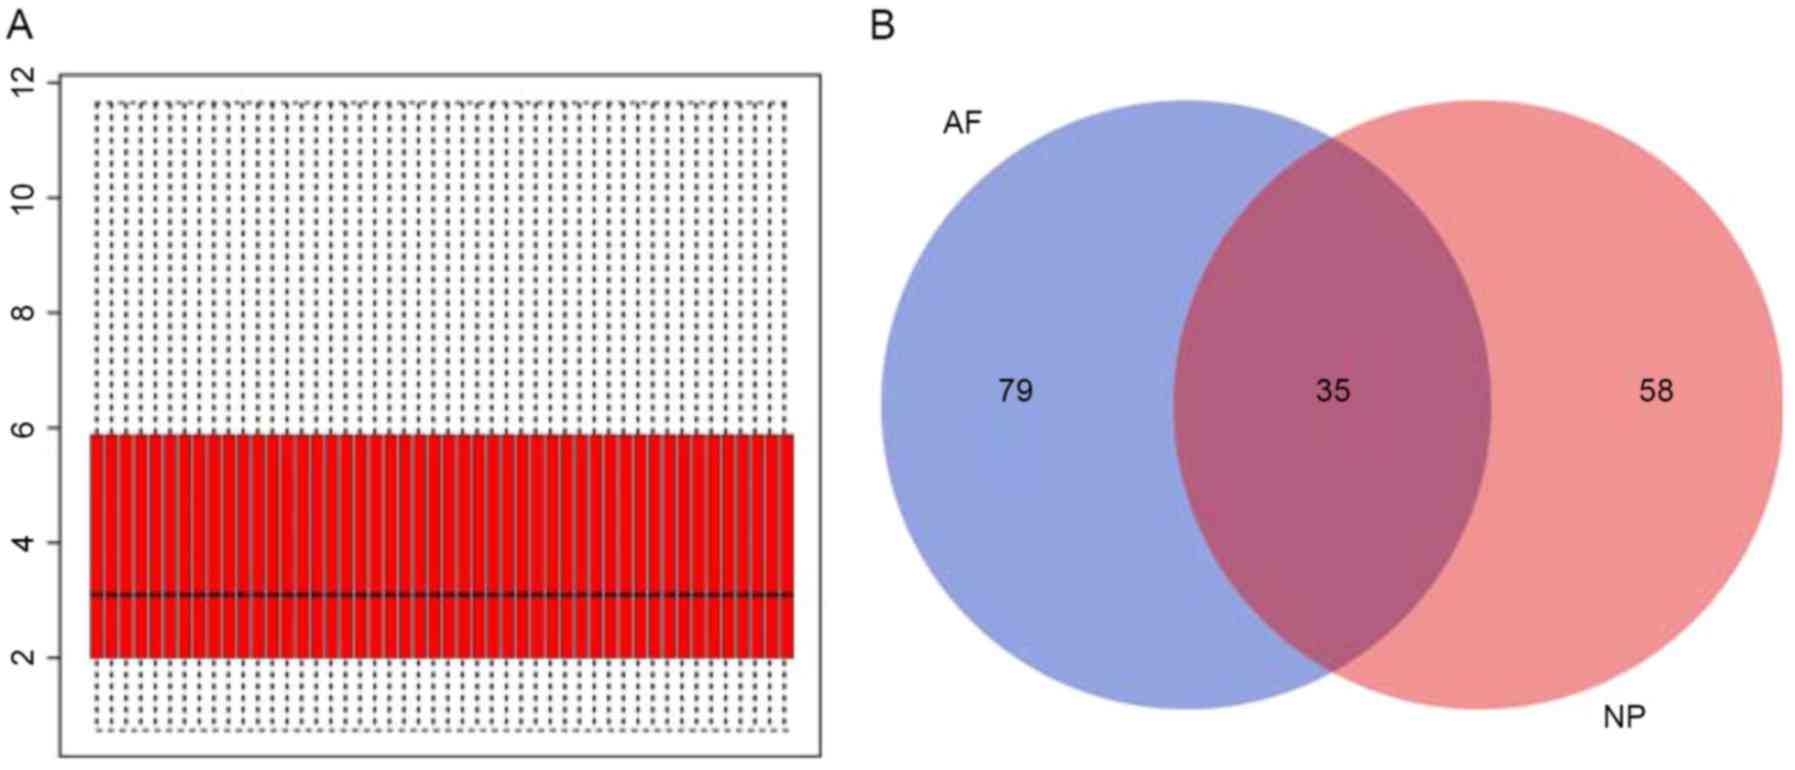
Following gene expression data normalization
(Fig. 1A), 93 NP and 114 AF DEGs
were identified by comparison between the samples from patients
with IDD and controls. As demonstrated in Fig. 1B, 35 common DEGs present in NP and
AF of patients with IDD were extracted from these identified DEGs
(Table I).
 | Table I.The 35 common differentially
expressed genes present in the nucleus pulposus and annulus
fibrosis of patients with intervertebral disc degeneration. |
Table I.
The 35 common differentially
expressed genes present in the nucleus pulposus and annulus
fibrosis of patients with intervertebral disc degeneration.
| Gene symbol | Entrez_gene_ID | Gene name |
|---|
| COL6A2 | 1292 | Collagen, type VI,
α2 |
| LYVE1 | 10894 | Lymphatic vessel
endothelial hyaluronan receptor 1 |
| IRX5 | 10265 | Iroquois homeobox
5 |
| SOX4 | 6659 | Sex determining
region Y-box 4 |
| GATA6 | 2627 | GATA binding
protein 6 |
| IBSP | 3381 | Integrin-binding
sialoprotein |
| VAMP8 | 8673 | Vesicle-associated
membrane protein 8 (endobrevin) |
| FOXF2 | 2295 | Forkhead box
F2 |
| IFIT1 | 3434 | Interferon-induced
protein with tetratricopeptide repeats 1 |
| IFIT2 | 3433 | Interferon-induced
protein with tetratricopeptide repeats 2 |
| SCGB2A2 | 4250 | Secretoglobin,
family 2A, member 2 |
| IGFBP3 | 3486 | Insulin-like growth
factor binding protein 3 |
| IFIT3 | 3437 | Interferon-induced
protein with tetratricopeptide repeats 3 |
| NANOS1 | 340719 | Nanos homolog 1
(Drosophila) |
| CCND1 | 595 | Cyclin D1 |
| ZFP36L1 | 677 | Zinc finger protein
36, C3H type-like 1 |
| TFPI | 7035 | Tissue factor
pathway inhibitor (lipoprotein-associated coagulation
inhibitor) |
| RAP1A | 5906 | RAP1A, member of
RAS oncogene family |
| ITGBL1 | 9358 | Integrin, β-like 1
(with EGF-like repeat domains) |
| S100A2 | 6273 | S100 calcium
binding protein A2 |
| GBP1 | 2633 | Guanylate binding
protein 1, interferon-inducible, 67 kDa |
| PTHLH | 5744 | Parathyroid
hormone-like hormone |
| GREM1 | 26585 | Gremlin 1, cysteine
knot superfamily, homolog (Xenopus laevis) |
| MGST1 | 4257 | Microsomal
glutathione S-transferase 1 |
| Hyal1 | 3373 |
Hyaluronoglucosaminidase 1 |
| IRX3 | 79191 | Iroquois homeobox
3 |
| C5ORF62 | 85027 | Mstp150 |
| SLITRK4 | 139065 | SLIT and NTRK-like
family, member 4 |
| GDF15 | 9518 | Growth
differentiation factor 15 |
| SCGB1D2 | 10647 | Secretoglobin,
family 1D, member 2 |
| CHST10 | 9486 | Carbohydrate
sulfotransferase 10 |
| LY75 | 4065 | CD302 molecule;
lymphocyte antigen 75 |
| ZNF185 | 7739 | Zinc finger protein
185 (LIM domain) |
| MT1G | 4495 | Metallothionein 1G
(MT1G) |
| CLEC3A | 10143 | C-type lectin
domain family 3 member A (CLEC3A) |
GO functional enrichment and pathway
enrichment analysis of DEGs
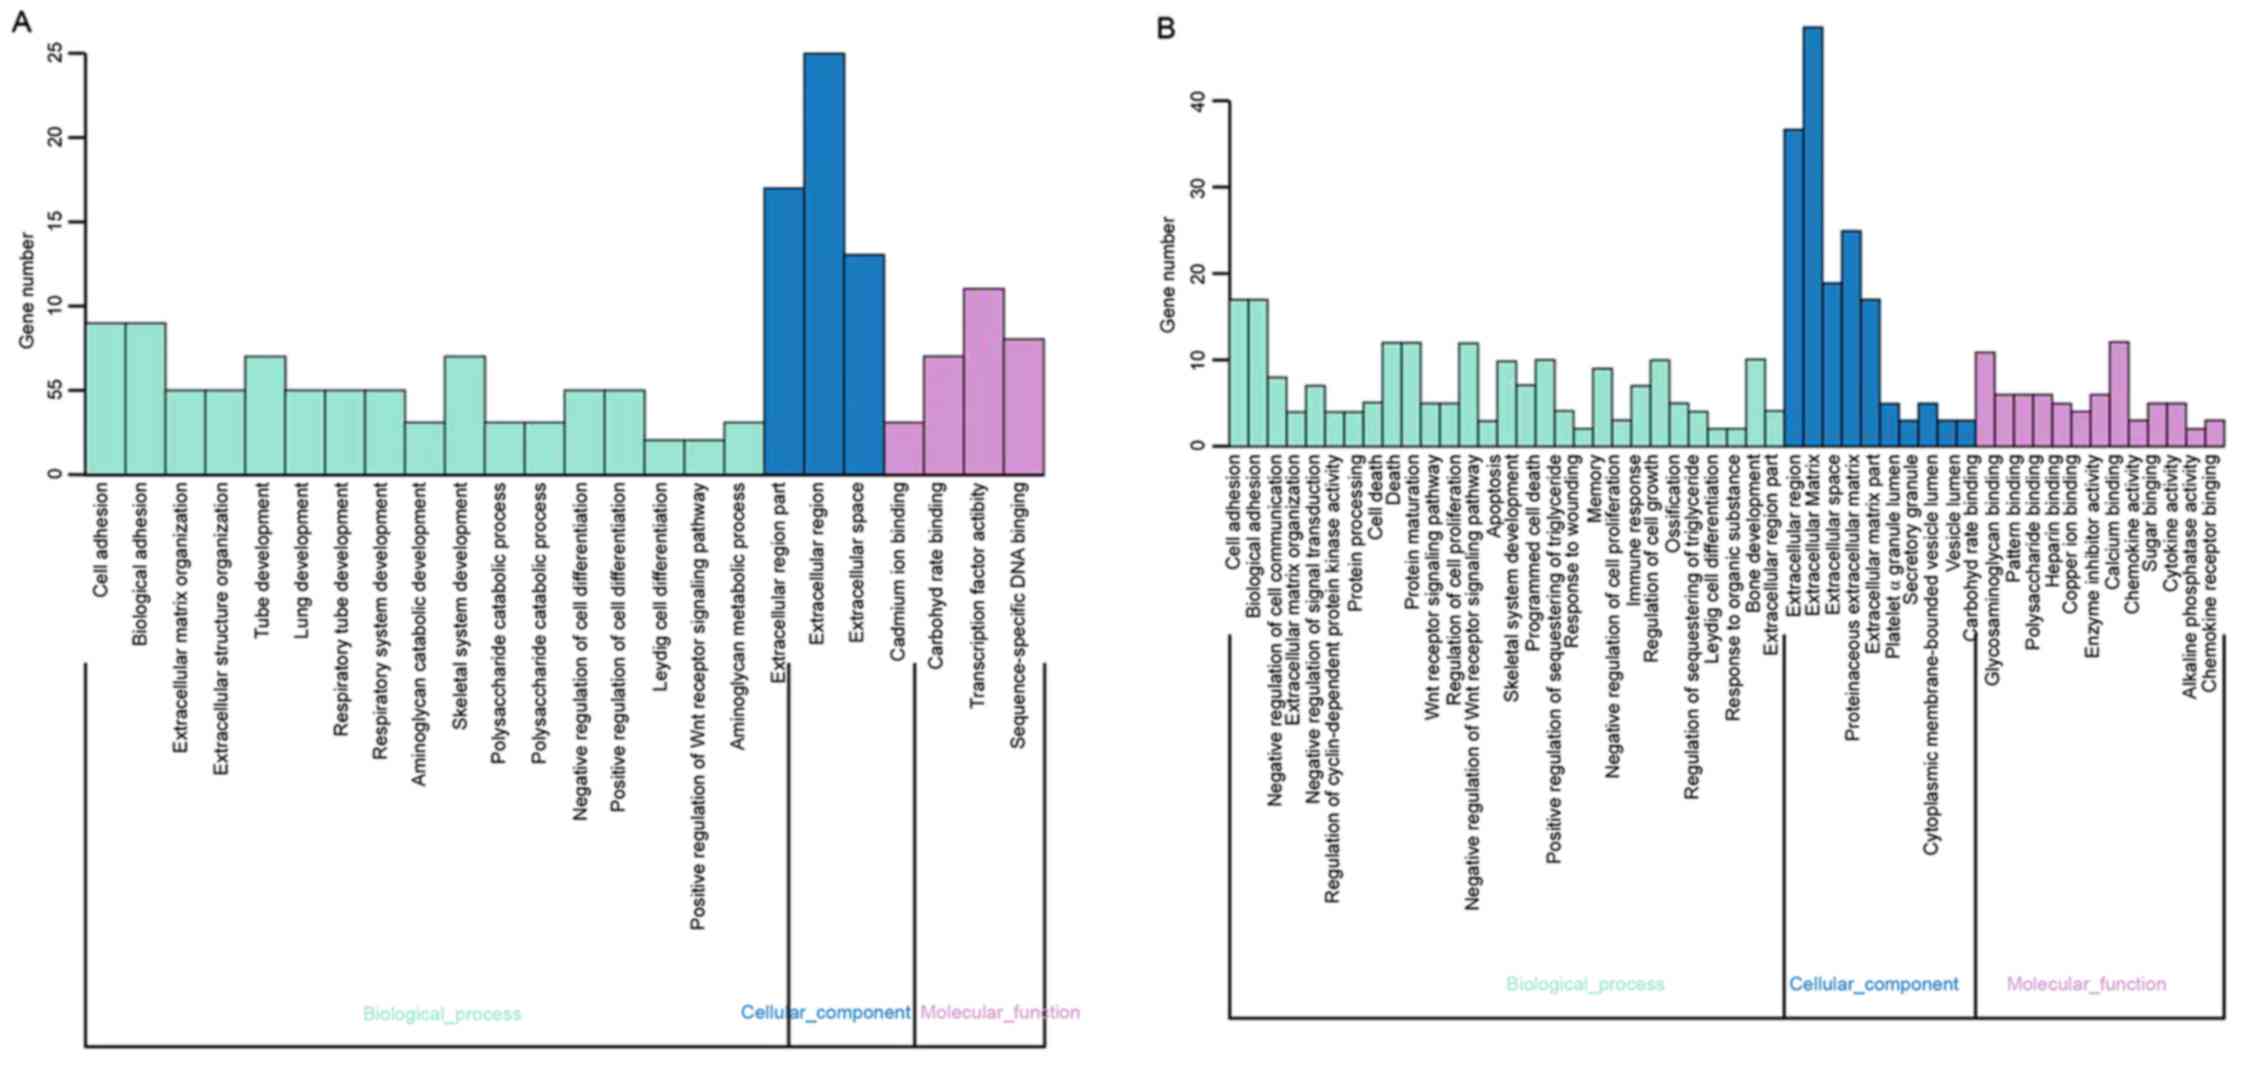
The present study used function annotation for the
DEGs, and the clustering groups were obtained by GO function
enrichment analysis. A total of 24 and 50 GO terms were enriched
among the DEGs in NP and AF, respectively (Fig. 2), and DEGs from NP and AF appeared
to share similar biological processes, including cell adhesion,
biological adhesion and extracellular matrix organization.
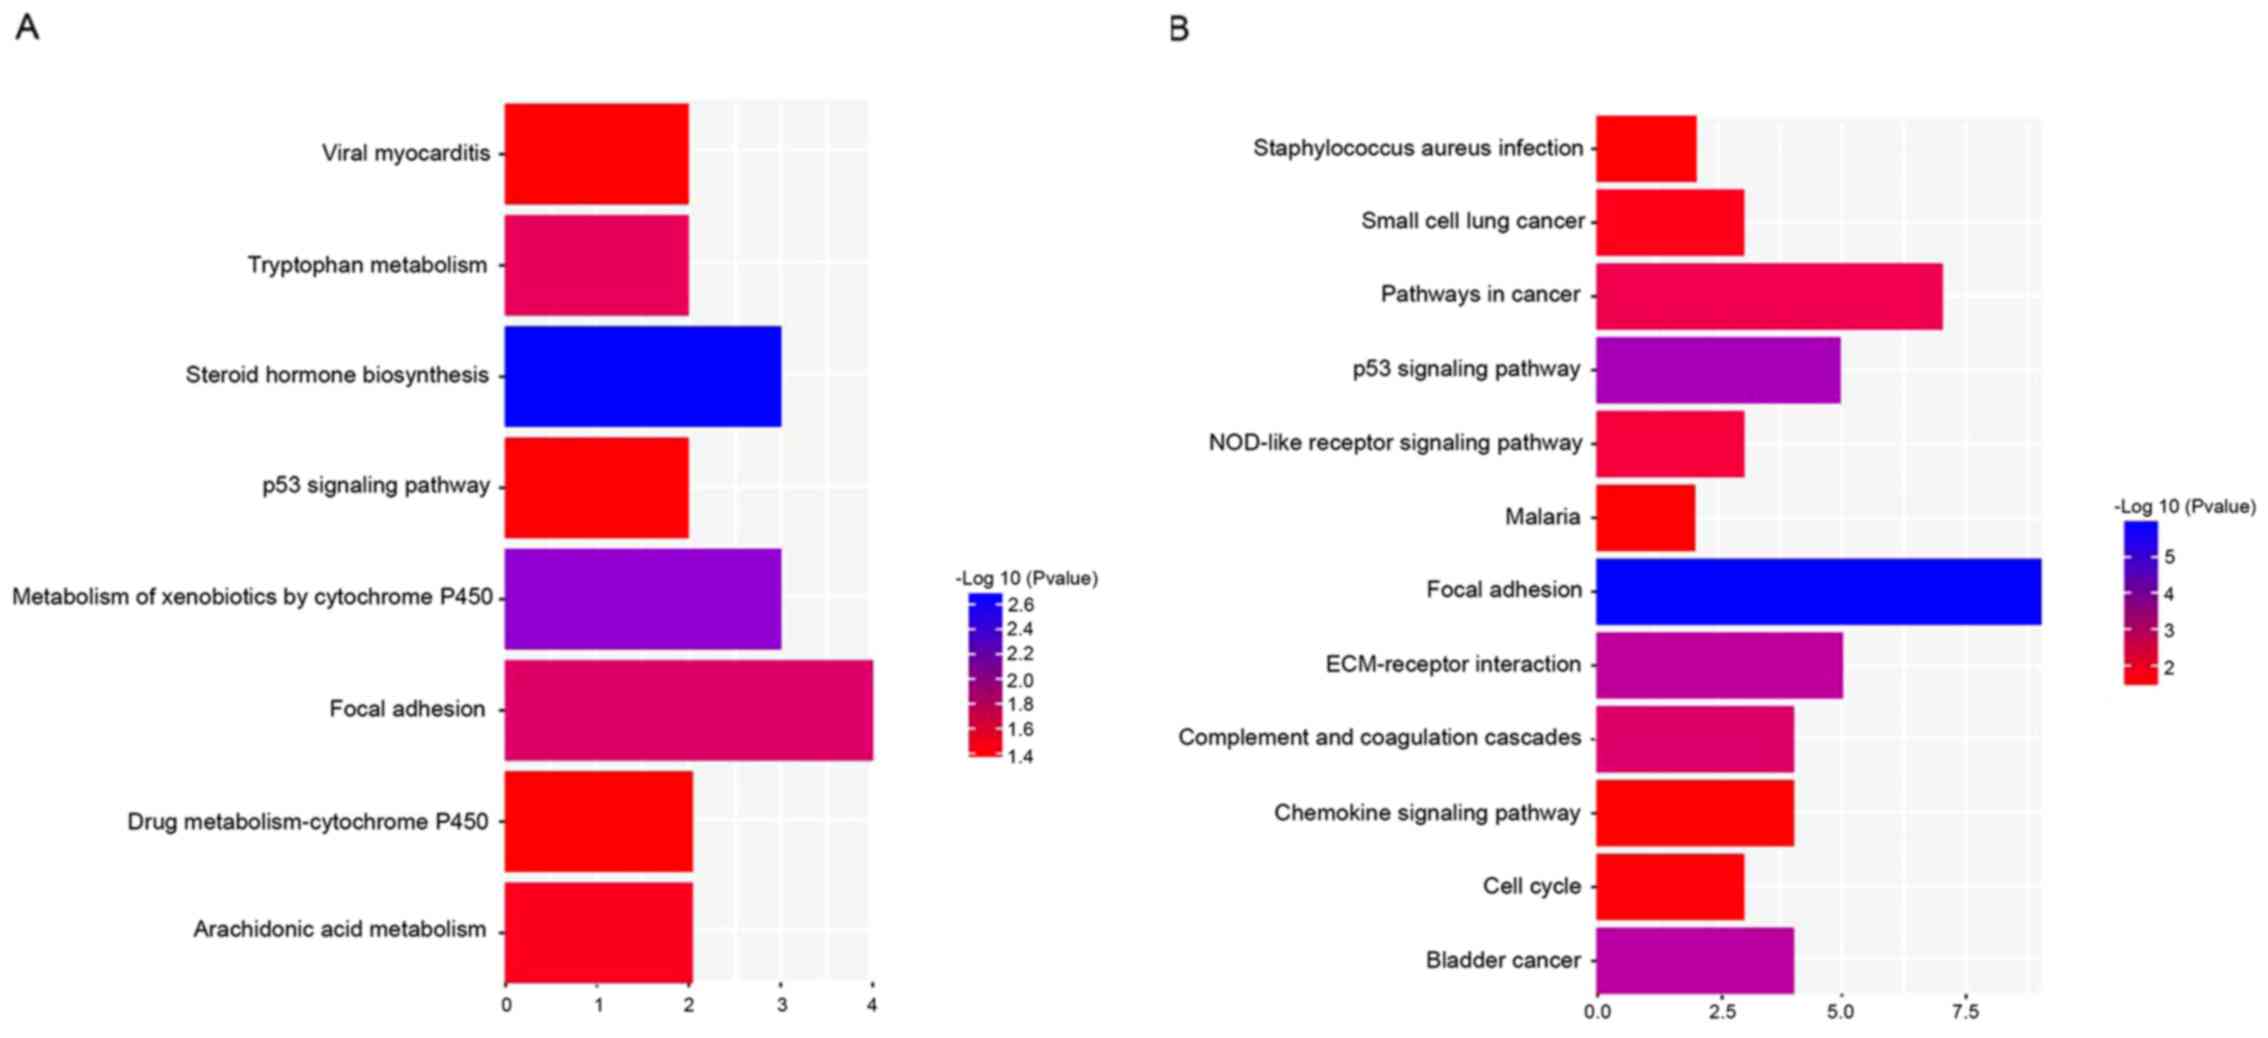
A total of 8 and 12 pathways were disclosed for DEGs
by KEGG pathway enrichment analysis in NP and AF, respectively
(Fig. 3), and DEGs from NP and AF
contained similar pathways, including focal adhesion and the p53
signaling pathway.
Protein-protein interaction network
modules
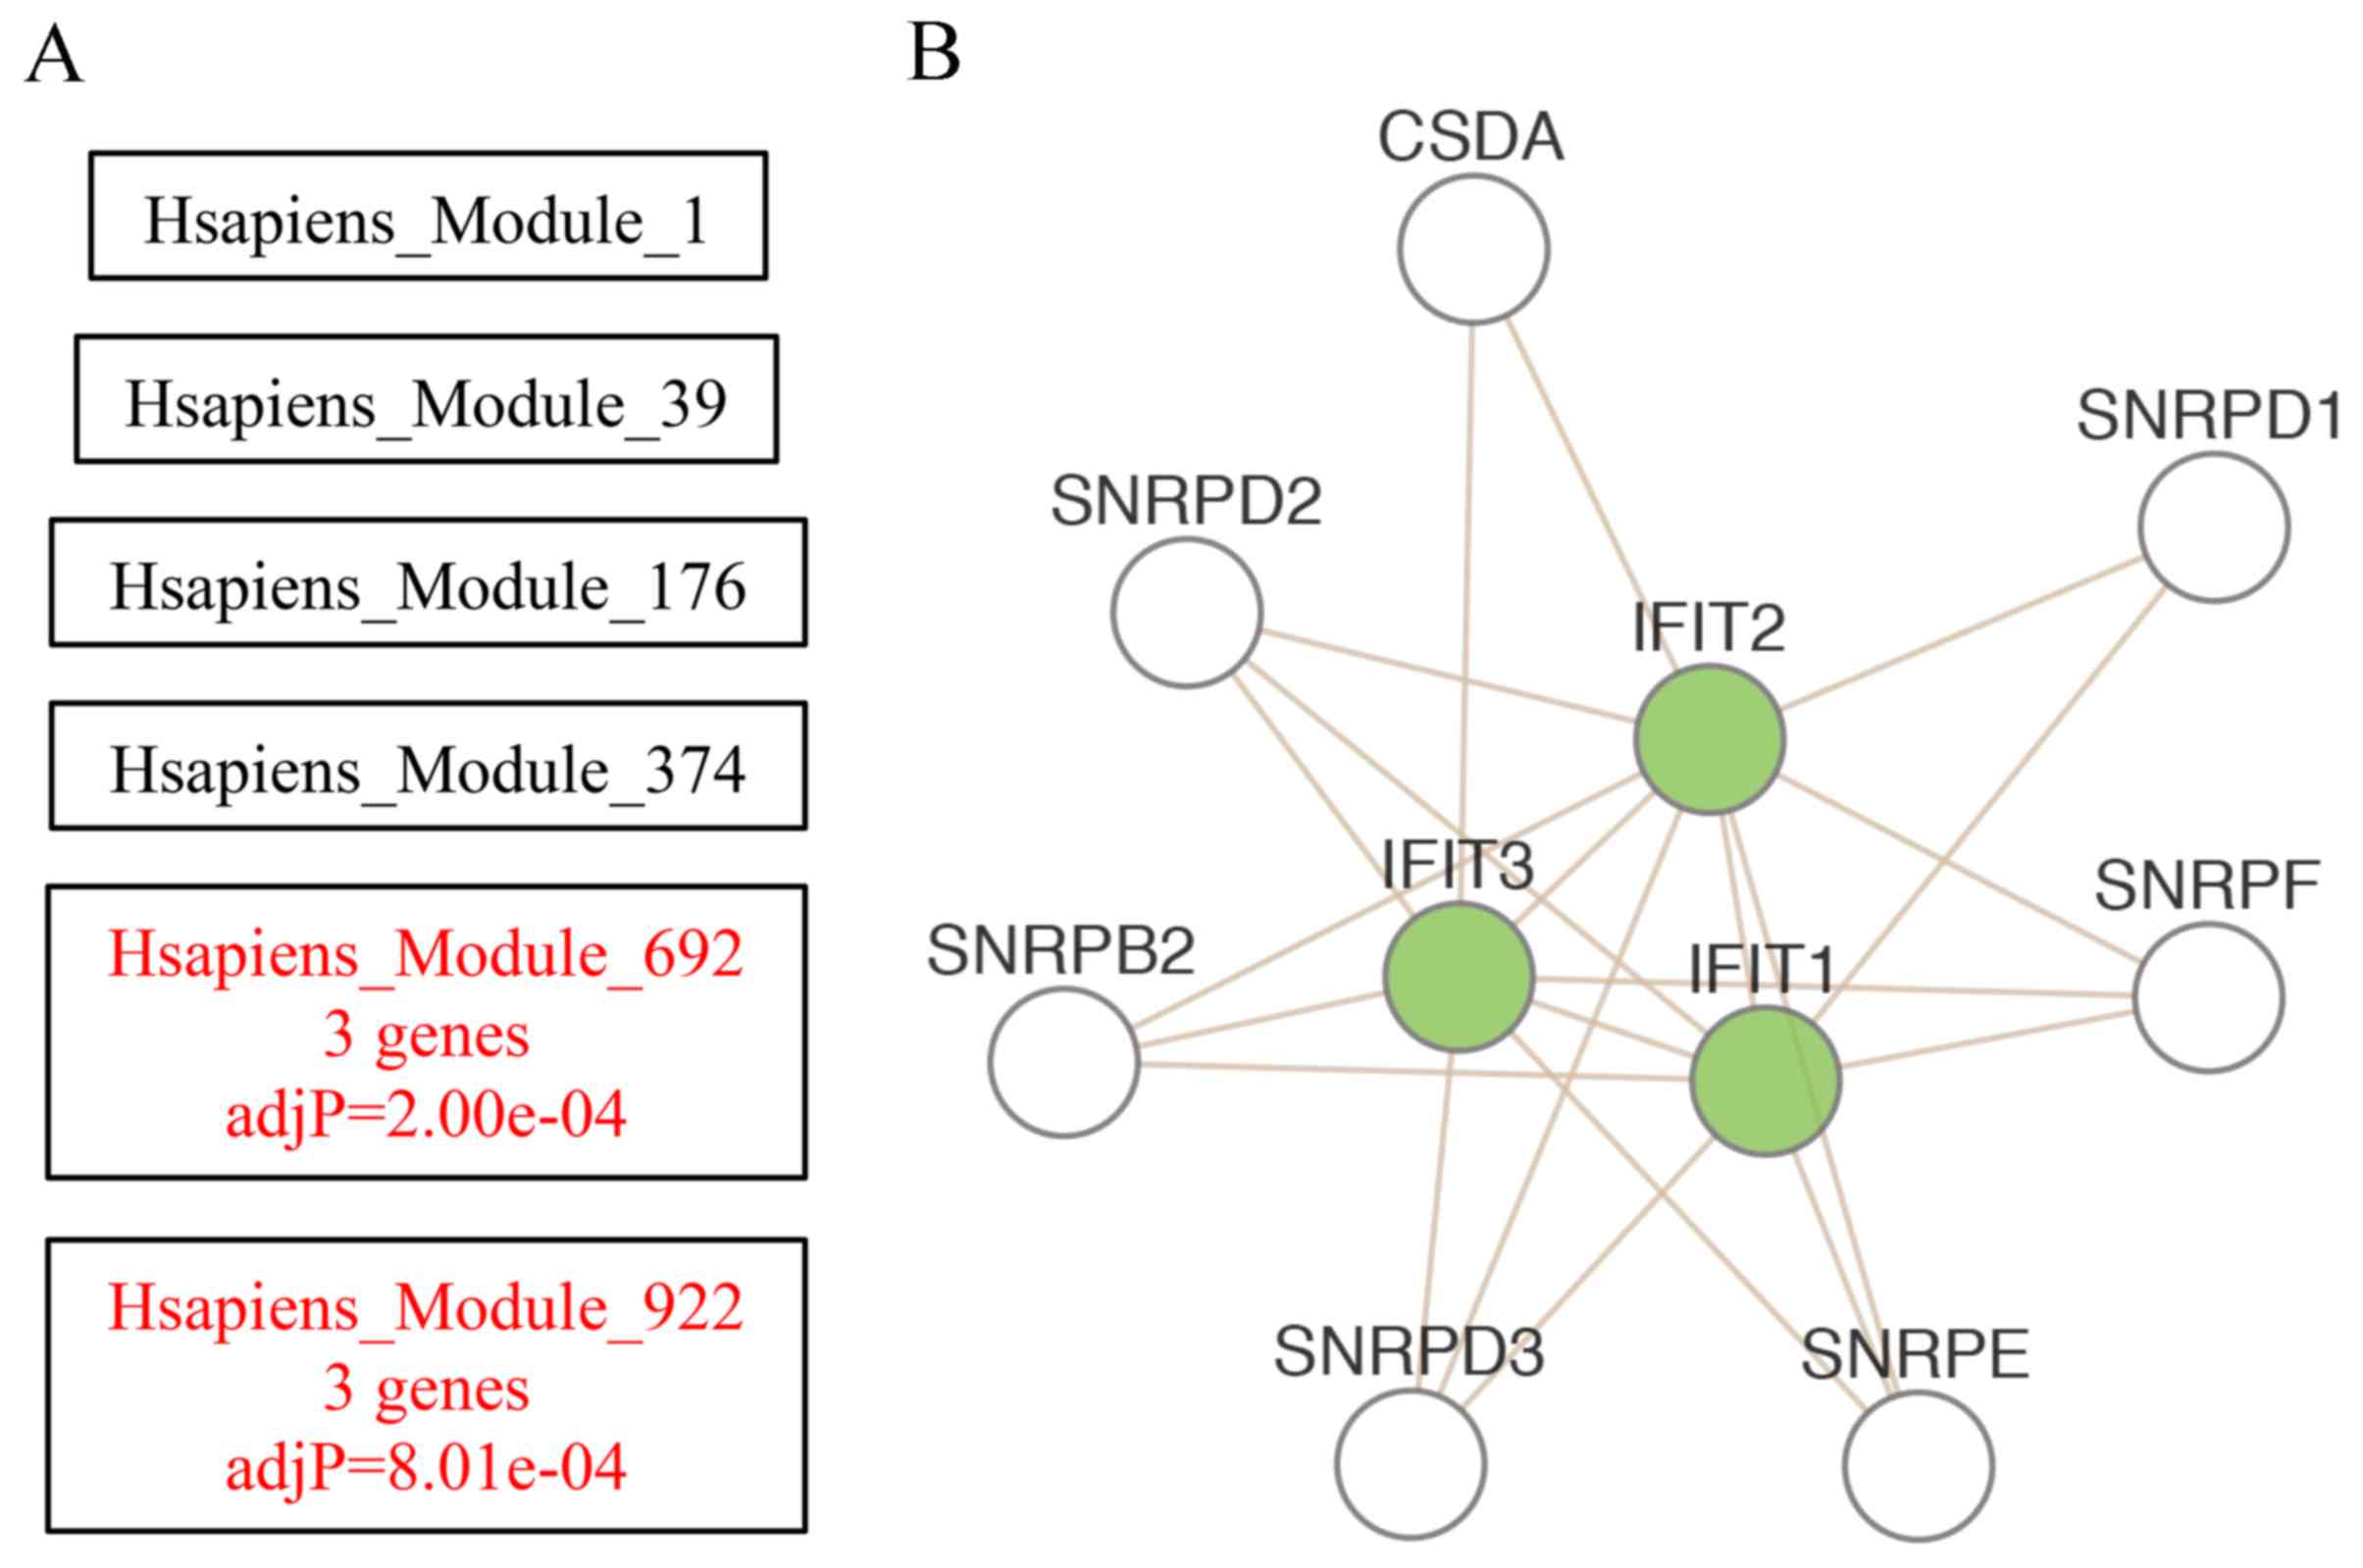
As demonstrated in Fig.
4A, the enriched directly acyclic graph revealed enriched
network modules in red and their non-enriched parents in black.
Enriched modules were identified at different hierarchical levels
and the Hsapiens_module_922 was the most enriched hierarchical
network module. To reveal associations among genes within the most
enriched network module, the Cytoscape Web plug in was used to
visualize in a network graph the input genes (in green) and their
direct neighbors (in white). As demonstrated in Fig. 4B, interferon-induced protein with
tetratricopeptide repeats (IFIT) 1, IFIT2 and IFIT3 were the hub
genes of the network, which indicated that the inflammatory
cytokine interferon signaling may serve an important role in
degenerative human intervertebral disc.
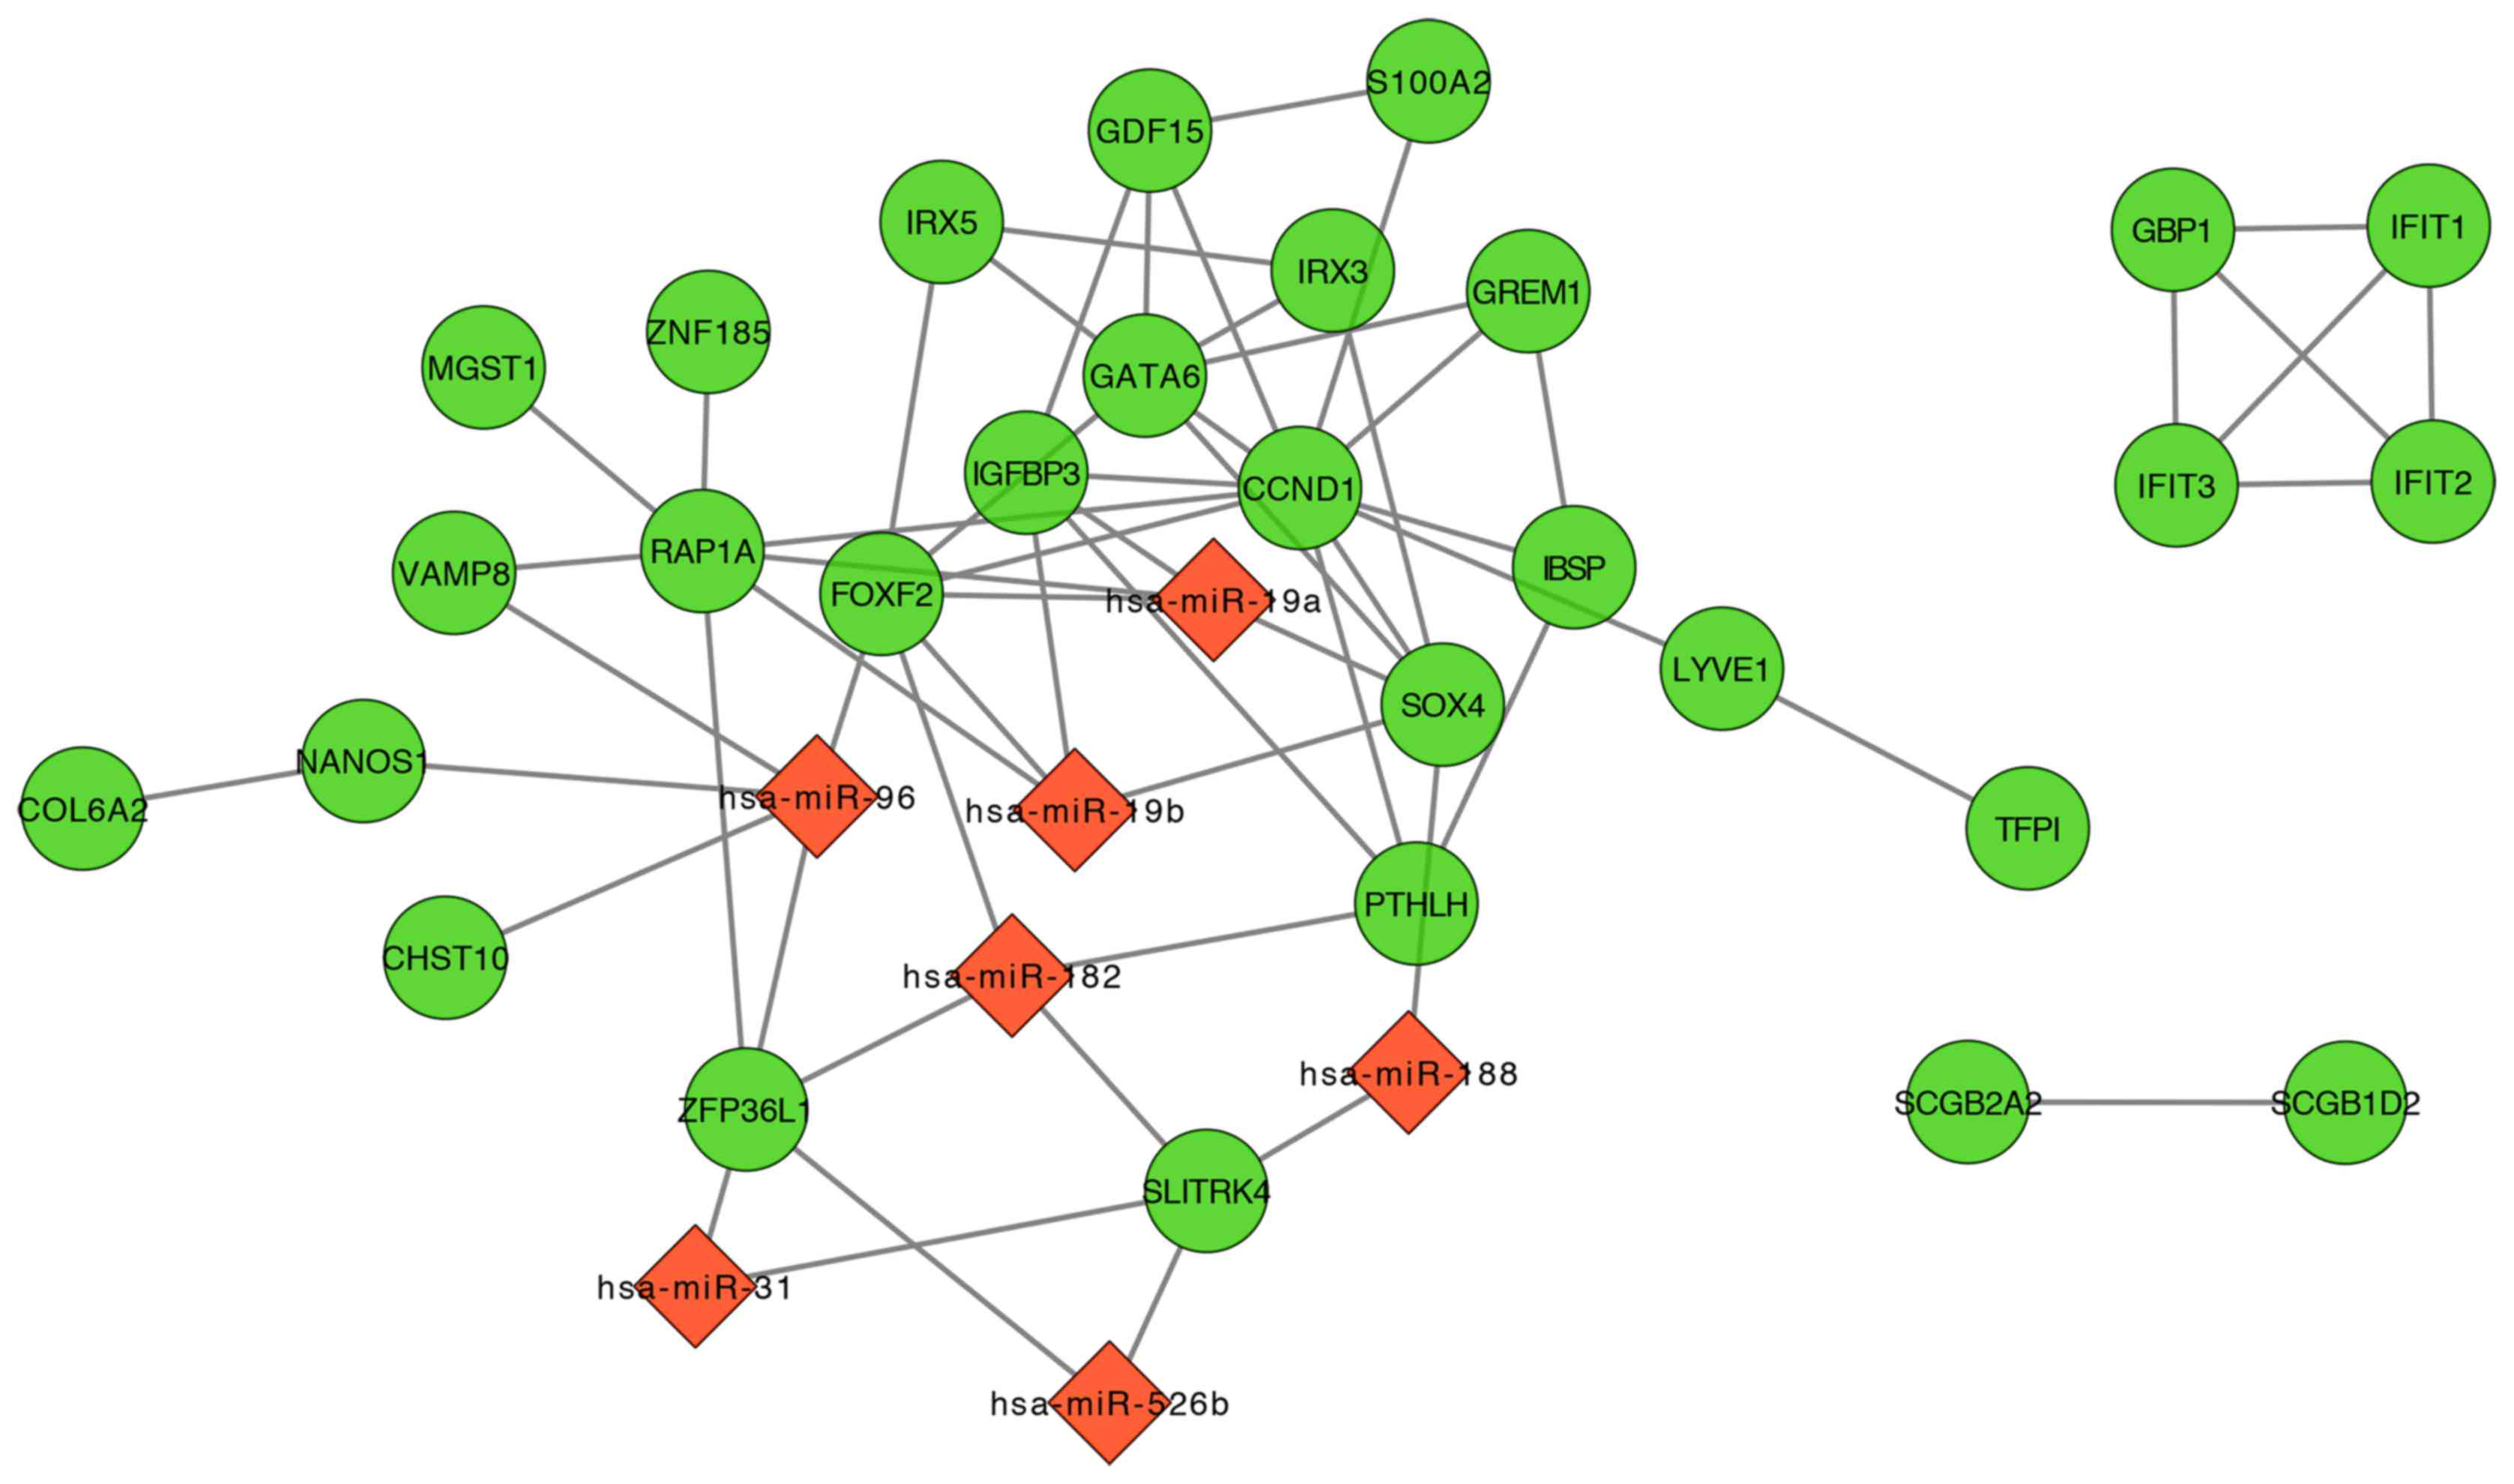
miRNAs and gene regulatory
network
A total of 6 relevant clusters of miRNAs were
retrieved with WebGestalt for the common DEGs (Table II). Subsequently, the miRNA-DEG
regulatory network and DEG-DEG interaction network were visualized
with Cytoscape (Fig. 5).
Functional annotation was applied on the genes in the network, in
which 11 GO terms and 4 pathways were revealed (Tables III and IV), among which the extracellular matrix
organization was the most significant disrupted cellular component
and focal adhesion the most significant dysregulated pathway.
| Table II.Relevant miRNAs for the 35 common
differentially expressed genes. |
Table II.
Relevant miRNAs for the 35 common
differentially expressed genes.
|
|
| Parameters |
|
|---|
|
|
|
|
|
|---|
| miRNA | DB_ID | O | rawP | adjP | Target genes |
|---|
| hsa_GTGCCAA,
miR-96 | 821 | 5 | 0.0002 | 0.0052 | FOXF2, CHST10,
ZFP36l1, VAMP8, NANOS1 |
| hsa_TTGCCAA,
miR-182 | 757 | 4 | 0.0022 | 0.0286 | FOXF2, ZFP36l1,
PTHLH, SLITRK4 |
| hsa_ATCTTGC,
miR-31 | 870 | 2 | 0.0070 | 0.0385 | SLITRK4,
ZFP36l1 |
| hsa_CTCAAGA,
miR-526B | 779 | 2 | 0.0072 | 0.0385 | SLITRK4,
ZFP36l1 |
| hsa_AAGGGAT,
miR-188 | 871 | 2 | 0.0074 | 0.0385 | SLITRK4, SOX4 |
| hsa_TTTGCAC,
miR-19A, miR-19B | 696 | 4 | 0.0112 | 0.0485 | FOXF2, SOX4, RAP1A,
IGFBP3 |
| Table III.GO functional enrichment analysis for
the regulatory network. |
Table III.
GO functional enrichment analysis for
the regulatory network.
| GO term | P-value | Gene sets |
|---|
| Extracellular
matrix organization | 0.012232 | IBSP, FOXF2,
COL6A2 |
| Ossification | 0.014810 | IBSP, PTHLH,
IGFBP3 |
| Bone
development | 0.016820 | IBSP, PTHLH,
IGFBP3 |
| Wnt receptor
signaling pathway through β-catenin | 0.027305 | CCND1, SOX4 |
| Extracellular
structure organization | 0.028464 | IBSP, FOXF2,
COL6A2 |
| Endoderm
development | 0.028889 | PTHLH, GATA6 |
| Regulation of
cellular protein metabolic process | 0.040149 | ZFP36L1, CCND1,
NANOS1, IGFBP3 |
| Posttranscriptional
regulation of gene expression | 0.045585 | ZFP36L1, NANOS1,
SOX4 |
| Negative regulation
of cell differentiation | 0.047545 | PTHLH, IRX3,
CCND1 |
| Tube
development | 0.049135 | PTHLH, GATA6,
GREM1 |
| Negative regulation
of signal transduction | 0.049536 | CCND1, GREM1,
IGFBP3 |
| Table IV.KEGG pathway enrichment analysis for
the regulatory network. |
Table IV.
KEGG pathway enrichment analysis for
the regulatory network.
| KEGG pathway | P-value | Gene sets |
|---|
| Focal adhesion | 0.0003 | CCND1, COL6A2,
RAP1A, IBSP |
| p53 signaling
pathway | 0.0055 | CCND1, IGFBP3 |
| ECM-receptor
interaction | 0.0084 | COL6A2, IBSP |
| Platelet
activation | 0.0453 | VAMP8, RAP1A |
Discussion
Despite years of investigation, the pathogenesis
underlying IDD remains poorly understood and continues to require
further investigation. The emergence of bioinformatics methods has
accelerated the progress of research on the mechanisms of human
disease. The present study identified 93 and 114 DEGs in the NP and
AF respectively, through the comparative analysis of the
transcriptome between degenerative intervertebral disc samples and
controls. The analysis identified 35 common DEGs in the two
regions, and protein-protein interaction network modules
demonstrated that the inflammatory cytokine interferon signaling
may serve an important role in human IDD. In addition, a total of 6
associated miRNAs (miR-96, miR-182, miR-31, miR-526B, miR-188 and
miR-19) were identified, which targeted these common DEGs.
Alterations in the production of extracellular
matrix and inflammatory cytokines by intervertebral discs have an
important role in the pathogenesis of IDD (5). In the present study, functional
enrichment analysis indicated a number of DEGs involved in
biological processes, including cell adhesion, biological adhesion
and extracellular matrix organization, in the two regions of the
intervertebral disc. Pathway enrichment analysis demonstrated that
focal adhesion and the p53 signaling pathway were disrupted in NP
and AF. In addition, 3 common DEGs in the regulatory network were
enriched in extracellular matrix organization and 4 common DEGs in
the regulatory network were enriched in the focal adhesion
signaling pathway.
The extracellular matrix is a component of all
mammalian tissues, and is a network that consists predominantly of
the fibrous proteins collagen, elastin and fibronectin. In addition
to a structural function, the extracellular matrix exhibits a
number of other roles; as a major component of the cellular
microenvironment, it affects various cell behaviors, which include
proliferation, adhesion and migration, and also regulates cell
differentiation and death (21).
Extracellular matrix composition is particularly heterogeneous and
dynamic, and abnormal extracellular matrix dynamics may lead to
dysregulated cell proliferation, cell death failure and loss of
cell differentiation, which subsequently results in congenital
defects and pathological processes such as tissue fibrosis and
cancer (22). It has been reported
that during IDD, the ability of intervertebral disc cells to
produce extracellular matrix reduces, however, the production of
degradative enzymes does not change; this phenomenon is
hypothesized to accelerate the degeneration by degrading the
extracellular matrix of the disc, ultimately resulting in the
macroscopic changes of the intervertebral disc (6).
Collagen, which gives tissues the ability to recover
following stretching, is the most abundant fibrous protein within
the extracellular matrix. It has been identified that the
integrin-binding sialoprotein (IBSP) interacts with collagen and
appears to modulate cell-matrix interactions (23). Cell-matrix adhesions have essential
roles in a number of important biological processes, including cell
motility, proliferation and differentiation, and the regulation of
gene expression and cell survival; at contact points between the
cell and extracellular matrix, specialized structures termed focal
adhesions are formed (24).
The RAP1A gene encodes a member of the Ras family of
small GTPases. Alterations in the conformation and activity of the
protein encoded by RAP1A occur depending on whether GTP or GDP is
bound to the protein, which are involved in regulating signaling
pathways that affect cell proliferation and adhesion (25,26).
Therefore, the dysregulation of collagen type VI α2 (COL6A2), IBSP
and RAP1A in human intervertebral discs may induce de-adhesion,
characterized by disruption of extracellular matrix organization
and focal adhesions, which accelerates the degeneration of
intervertebral discs.
Since the discovery of interferons, they have been
investigated widely in a large number of studies, and considerable
progress has been made in describing the nature of the cytokines
themselves (27). Originally,
interferons were known for their antiviral properties, however,
interferons are currently better known for their distinct cellular
functions, which include inhibition of proliferation and
angiogenesis, induction of differentiation and regulation of the
immune system (28). Previous
research has demonstrated that IFIT3 may lead to AF cell growth
arrest via its antiproliferative activity, which negatively
regulates the cell cycle and directly or indirectly induces cell
apoptosis (11,29,30).
This is similar to the results of the present study. However, the
difference and innovation of the present study primarily lies in
the different groups included in the differential analysis. The
present study included two sets of differential analysis, between
the NP and control groups and the AF and control groups,
respectively, while in the study by Kazezian et al (11), the differential analysis was only
conducted between the NP and AF groups, and so the DEGs were not
exactly the same. According to the results of protein-protein
interaction network modules presented in the present study, three
interferon-induced genes (IFIT1, IFIT2 and IFIT3) were enriched in
the degenerative human discs. Therefore, based on the above
information, the upregulated IFITs may negatively regulate the cell
cycle, and thus reduce the disc cell number, subsequently
accelerating degeneration.
miRNAs are considered to serve a crucial role in
gene expression, which affects numerous biological processes,
including cell differentiation, proliferation, metabolism,
apoptosis and tumorigenesis, and have become therapeutic targets
for diseases such as IDD (31–33).
To investigate the potential molecular targets, miRNAs interacting
with the common DEGs were retrieved in the present study and a
regulatory network was also constructed. Aberrant expression of
miR-96 or miR-182 has been reported in a number of human diseases,
including pulmonary arterial hypertension and cancer (34–37).
The results of the present study, and of previous studies, have
demonstrated that forkhead transcription factor F2 (FOXF2) may be
regulated by miR-96 or miR-182 (38,39).
FOX is a super family of transcriptional regulators that exhibit
numerous functions in human diseases (38–40).
The FOXF subfamily consists of two members, FOXF1 and FOXF2. A
previous study indicated that FOXF2 promoted extracellular matrix
production, and in FOXF2 mutant animals, the extracellular matrix,
particularly collagens, was severely reduced, which causes tissue
disintegration (41). In addition,
FOXF2 may act as a mesenchymal factor that controls cell
proliferation and survival (42).
Therefore, we hypothesized that FOXF2, miR-96 and miR-182 are
worthy of further investigation to determine their specific roles
in IDD.
In conclusion, the present study provides integrated
network insight into the pathogenesis of IDD and offers potential
therapeutic targets for controlling the disease. The dysregulation
of COL6A2, IBSP, RAP1A and FOXF2 in NP and AF are associated with
IDD progression by disrupting the extracellular matrix organization
and focal adhesions pathway. In addition, IFIT1, IFIT2 and IFIT3
may negatively regulate the cell cycle, and thus decrease the
number of disc cells, eventually accelerating degeneration of
intervertebral discs. However, further experiments, clinical and
mechanistic, are required to confirm the results of the present
study.
Acknowledgements
The present study was supported by the State Key
Program of National Nature Science Foundation of China (grant no.
81330042), the Special Program for Sino-Russian Joint Research
Sponsored by the Ministry of Science and Technology, China (grant
no. 2014DFR31210) and the Key Program Sponsored by the Tianjin
Science and Technology Committee, China (grant nos. 13RCGFSY19000
and 14ZCZDSY00044).
References
|
1
|
Buckwalter JA: Aging and degeneration of
the human intervertebral disc. Spine (Phila Pa 1976). 20:1307–1314.
1995. View Article : Google Scholar : PubMed/NCBI
|
|
2
|
Costi JJ, Stokes IA, Gardner-Morse MG and
Iatridis JC: Frequency-dependent behavior of the intervertebral
disc in response to each of six degree of freedom dynamic loading:
Solid phase and fluid phase contributions. Spine (Phila Pa 1976).
33:1731–1738. 2008. View Article : Google Scholar : PubMed/NCBI
|
|
3
|
Kalichman L and Hunter DJ: The genetics of
intervertebral disc degeneration. Familial predisposition and
heritability estimation. Joint Bone Spine. 75:383–387. 2008.
View Article : Google Scholar : PubMed/NCBI
|
|
4
|
Friedman BW, O'Mahony S, Mulvey L, Davitt
M, Choi H, Xia S, Esses D, Bijur PE and Gallagher EJ: One-week and
3-month outcomes following an emergency department visit for
undifferentiated musculoskeletal low back pain. Ann Emerg Med.
59:128–133. 2012. View Article : Google Scholar : PubMed/NCBI
|
|
5
|
Kepler CK, Ponnappan RK, Tannoury CA,
Risbud MV and Anderson DG: The molecular basis of intervertebral
disc degeneration. Spine J. 13:318–330. 2013. View Article : Google Scholar : PubMed/NCBI
|
|
6
|
Gopal D, Ho AL, Shah A and Chi JH:
Molecular basis of intervertebral disc degeneration. Adv Exp Med
Biol. 760:114–133. 2012. View Article : Google Scholar : PubMed/NCBI
|
|
7
|
Chen Y, Chen K, Li M, Li C, Ma H, Bai YS,
Zhu XD and Fu Q: Genes associated with disc degeneration identified
using microarray gene expression profiling and bioinformatics
analysis. Genet Mol Res. 12:1431–1439. 2013. View Article : Google Scholar : PubMed/NCBI
|
|
8
|
Tsai TT, Lai PL, Liao JC, Fu TS, Niu CC,
Chen LH, Lee MS, Chen WJ, Fang HC, Ho NY and Pang JH: Increased
periostin gene expression in degenerative intervertebral disc
cells. Spine J. 13:289–298. 2013. View Article : Google Scholar : PubMed/NCBI
|
|
9
|
He J, Xue R, Li S, Lv J, Zhang Y, Fan L,
Teng Y and Wei H: Identification of the potential molecular targets
for human intervertebral disc degeneration based on bioinformatic
methods. Int J Mol Med. 36:1593–1600. 2015. View Article : Google Scholar : PubMed/NCBI
|
|
10
|
Choi YS: Pathophysiology of degenerative
disc disease. Asian Spine J. 3:39–44. 2009. View Article : Google Scholar : PubMed/NCBI
|
|
11
|
Kazezian Z, Gawri R, Haglund L, Ouellet J,
Mwale F, Tarrant F, O'Gaora P, Pandit A, Alini M and Grad S: Gene
expression profiling identifies interferon signalling molecules and
IGFBP3 in human degenerative annulus fibrosus. Sci Rep.
5:156622015. View Article : Google Scholar : PubMed/NCBI
|
|
12
|
Troyanskaya O, Cantor M, Sherlock G, Brown
P, Hastie T, Tibshirani R, Botstein D and Altman RB: Missing value
estimation methods for DNA microarrays. Bioinformatics. 17:520–525.
2001. View Article : Google Scholar : PubMed/NCBI
|
|
13
|
Fujita A, Sato JR, Lde O Rodrigues,
Ferreira CE and Sogayar MC: Evaluating different methods of
microarray data normalization. BMC Bioinformatics. 7:4692006.
View Article : Google Scholar : PubMed/NCBI
|
|
14
|
Ritchie ME, Phipson B, Wu D, Hu Y, Law CW,
Shi W and Smyth GK: Limma powers differential expression analyses
for RNA-sequencing and microarray studies. Nucleic Acids Res.
43:e472015. View Article : Google Scholar : PubMed/NCBI
|
|
15
|
Smyth GK: Linear models and empirical
bayes methods for assessing differential expression in microarray
experiments. Stat Appl Genet Mol Biol. 3:Article 3, 2004. doi:
10.2202/1544-6115.1027. PubMed/NCBI
|
|
16
|
da W Huang, Sherman BT and Lempicki RA:
Systematic and integrative analysis of large gene lists using DAVID
bioinformatics resources. Nat Protoc. 4:44–57. 2009.PubMed/NCBI
|
|
17
|
Kanehisa M and Goto S: KEGG: Kyoto
Encyclopedia of Genes and Genomes. Nucleic Acids Res. 28:27–30.
2000. View Article : Google Scholar : PubMed/NCBI
|
|
18
|
Xie C, Mao X, Huang J, Ding Y, Wu J, Dong
S, Kong L, Gao G, Li CY and Wei L: KOBAS 2.0: A web server for
annotation and identification of enriched pathways and diseases.
Nucleic Acids Res. 39:W316–W322. 2011. View Article : Google Scholar : PubMed/NCBI
|
|
19
|
Wang J, Duncan D, Shi Z and Zhang B:
WEB-based GEne SeT AnaLysis Toolkit (WebGestalt): Update 2013.
Nucleic Acids Res. 41:W77–W83. 2013. View Article : Google Scholar : PubMed/NCBI
|
|
20
|
Zhang B, Kirov S and Snoddy J: WebGestalt:
An integrated system for exploring gene sets in various biological
contexts. Nucleic Acids Res. 33:W741–W748. 2005. View Article : Google Scholar : PubMed/NCBI
|
|
21
|
Hynes RO: The extracellular matrix: Not
just pretty fibrils. Science. 326:1216–1219. 2009. View Article : Google Scholar : PubMed/NCBI
|
|
22
|
Frantz C, Stewart KM and Weaver VM: The
extracellular matrix at a glance. J Cell Sci. 123:4195–4200. 2010.
View Article : Google Scholar : PubMed/NCBI
|
|
23
|
Bornstein P: Matricellular proteins: An
overview. J Cell Commun Signal. 3:163–165. 2009. View Article : Google Scholar : PubMed/NCBI
|
|
24
|
Mitra SK, Hanson DA and Schlaepfer DD:
Focal adhesion kinase: In command and control of cell motility. Nat
Rev Mol Cell Biol. 6:56–68. 2005. View
Article : Google Scholar : PubMed/NCBI
|
|
25
|
Xiang J, Bian C, Wang H, Huang S and Wu D:
miR-203 down-regulates Rap1A and suppresses cell proliferation,
adhesion and invasion in prostate cancer. J Exp Clin Cancer Res.
34:82015. View Article : Google Scholar : PubMed/NCBI
|
|
26
|
Mott HR and Owen D: Structures of Ras
superfamily effector complexes: What have we learnt in two decades?
Crit Rev Biochem Mol Biol. 50:85–133. 2015. View Article : Google Scholar : PubMed/NCBI
|
|
27
|
Sadler AJ and Williams BR:
Interferon-inducible antiviral effectors. Nat Rev Immunol.
8:559–568. 2008. View
Article : Google Scholar : PubMed/NCBI
|
|
28
|
Brierley MM and Fish EN: Review:
IFN-alpha/beta receptor interactions to biologic outcomes:
Understanding the circuitry. J Interferon Cytokine Res. 22:835–845.
2002. View Article : Google Scholar : PubMed/NCBI
|
|
29
|
Foser S, Redwanz I, Ebeling M, Heizmann CW
and Certa U: Interferon-alpha and transforming growth factor-beta
co-induce growth inhibition of human tumor cells. Cell Mol Life
Sci. 63:2387–2396. 2006. View Article : Google Scholar : PubMed/NCBI
|
|
30
|
Kiepe D, Ulinski T, Powell DR, Durham SK,
Mehls O and Tönshoff B: Differential effects of insulin-like growth
factor binding proteins-1, −2, −3 and −6 on cultured growth plate
chondrocytes. Kidney Int. 62:1591–1600. 2002. View Article : Google Scholar : PubMed/NCBI
|
|
31
|
Pritchard CC, Cheng HH and Tewari M:
MicroRNA profiling: Approaches and considerations. Nat Rev Genet.
13:358–369. 2012. View
Article : Google Scholar : PubMed/NCBI
|
|
32
|
Xu YQ, Zhang ZH, Zheng YF and Feng SQ:
Dysregulated miR-133a mediates loss of type II collagen by directly
targeting matrix metalloproteinase 9 (MMP9) in human intervertebral
disc degeneration. Spine (Phila Pa 1976). 41:E717–E724. 2016.
View Article : Google Scholar : PubMed/NCBI
|
|
33
|
Ji ML, Zhang XJ, Shi PL, Lu J, Wang SZ,
Chang Q, Chen H and Wang C: Downregulation of microRNA-193a-3p is
involved in invertebral disc degeneration by targeting MMP14. J Mol
Med (Berl). 94:457–468. 2016. View Article : Google Scholar : PubMed/NCBI
|
|
34
|
Wallace E, Morrell NW, Yang XD, Long L,
Stevens H, Nilsen M, Loughlin L, Mair KM, Baker AH and MacLean MR:
A sex-specific microRNA-96/5-hydroxytryptamine 1B axis influences
development of pulmonary hypertension. Am J Respir Crit Care Med.
191:1432–1442. 2015. View Article : Google Scholar : PubMed/NCBI
|
|
35
|
Wu L, Pu X, Wang Q, Cao J, Xu F, Xu LI and
Li K: miR-96 induces cisplatin chemoresistance in non-small cell
lung cancer cells by downregulating SAMD9. Oncol Lett. 11:945–952.
2016.PubMed/NCBI
|
|
36
|
Yu S, Lu Z, Liu C, Meng Y, Ma Y, Zhao W,
Liu J, Yu J and Chen J: miRNA-96 suppresses KRAS and functions as a
tumor suppressor gene in pancreatic cancer. Cancer Res.
70:6015–6025. 2010. View Article : Google Scholar : PubMed/NCBI
|
|
37
|
Bian DL, Wang XM, Huang K, Zhai QX, Yu GB
and Wu CH: Expression and regulatory effects of microRNA-182 in
osteosarcoma cells: A pilot study. Oncol Lett. 11:3040–3048.
2016.PubMed/NCBI
|
|
38
|
Kundu ST, Byers LA, Peng DH, Roybal JD,
Diao L, Wang J, Tong P, Creighton CJ and Gibbons DL: The miR-200
family and the miR-183~96~182 cluster target Foxf2 to inhibit
invasion and metastasis in lung cancers. Oncogene. 35:173–186.
2016. View Article : Google Scholar : PubMed/NCBI
|
|
39
|
Zhang Y, Wang X, Wang Z, Tang H, Fan H and
Guo Q: miR-182 promotes cell growth and invasion by targeting
forkhead box F2 transcription factor in colorectal cancer. Oncol
Rep. 33:2592–2598. 2015. View Article : Google Scholar : PubMed/NCBI
|
|
40
|
Kong PZ, Yang F, Li L, Li XQ and Feng YM:
Decreased FOXF2 mRNA expression indicates early-onset metastasis
and poor prognosis for breast cancer patients with histological
grade II tumor. PLoS One. 8:e615912013. View Article : Google Scholar : PubMed/NCBI
|
|
41
|
Van der Heul-Nieuwenhuijsen L, Dits N, Van
Ijcken W, de Lange D and Jenster G: The FOXF2 pathway in the human
prostate stroma. Prostate. 69:1538–1547. 2009. View Article : Google Scholar : PubMed/NCBI
|
|
42
|
Ormestad M, Astorga J, Landgren H, Wang T,
Johansson BR, Miura N and Carlsson P: Foxf1 and Foxf2 control
murine gut development by limiting mesenchymal Wnt signaling and
promoting extracellular matrix production. Development.
133:833–843. 2006. View Article : Google Scholar : PubMed/NCBI
|