Introduction
Intracranial aneurysm (IA) is a cerebrovascular
disorder characterized by a regional ballooning of intracranial
arteries. IAs are classified into saccular aneurysms, fusiform
aneurysms, and micro-aneurysms according to their size and shape.
IA is a frequently occurring condition with a prevalence of 2–5% in
the global population, and ~0.7–1.9% of cases transform into
subarachnoid hemorrhage (SAH) (1).
SAH, which constitutes 1–7% of all strokes, has high mortality and
morbidity rates, even though diagnosis and treatment with modern
medical technologies are available (2). Currently, imaging methods including
digital subtraction angiography, computed tomography (CT) and CT
angiography are the primary IA diagnostic methods, however there is
no available preventive treatment of IA prior to rupture, except
for surgical procedures and endovascular therapy. However, these
treatment methods often result in further complications. The
requirement to develop novel therapeutic strategies for IA is of
primary concern, and understanding the underlying molecular
mechanism of its initiation will aid this research.
Recently, numerous studies have been conducted to
identify the pathogenesis of IA formation and rupture. Based on
affymetrix microarray data from 3 unruptured IAs and a control
superficial temporal artery, Li et al (3) demonstrated that upregulated genes are
extracellular matrix (ECM)-associated genes and downregulated genes
are enriched in the immune/inflammation response. Based on data
obtained from 8 ruptured IAs, 6 unruptured IAs and 5 control
intracranial arteries, Pera et al (4) demonstrated that upregulated genes are
enriched in the immune/inflammatory response and downregulated
genes are enriched in the muscle system and cell adhesion. Based on
data from 11 ruptured IAs and 8 unruptured IAs, Kurki et al
(5) demonstrated that upregulated
genes are enriched in chemotaxis, leukocyte migration, oxidative
stress, vascular remodeling, ECM degradation and the response to
turbulent blood flow. In addition, Yagi et al (6) demonstrated that phosphodiesterase-4
is involved in inflammatory diseases and blocking it reduces
macrophage migration and inhibits the progression of cerebral
aneurysms (CA). Aoki et al (7) revealed that v-ets avian
erythroblastosis virus E26 oncogene homolog EST-1 is
over-expressed in vascular smooth muscle cells (VSMCs) in CA walls,
and thus promotes CA progression.
The present study firstly downloaded gene expression
profiling data. The raw data were then analyzed to identify
differentially expressed genes (DEGs) between IA and normal
superficial temporal artery tissue. Following this, pathway and
functional enrichment analyses were conducted to investigate the
functions of the identified DEGs. A protein-protein interaction
(PPI) network was then constructed and visualized, from which a
transcription factor regulatory network was identified.
Materials and methods
Obtaining and preprocessing of
microarray data
Gene expression profiles of IA and normal
superficial temporal artery samples were obtained from the National
Center of Biotechnology Information (NCBI) Gene Expression Omnibus
(GEO; www.ncbi.nlm.nih.gov/geo/) database. The access number
is GSE26969, and this dataset included a total of 6 samples; 3 IA
and 3 normal superficial temporal artery samples. The platform used
was the Affymetrix Human Genome U133 Plus 2.0 Array (GPL570;
Affymetrix; Thermo Fisher Scientific, Inc., Waltham, MA, USA).
Firstly, the original data at the probe symbol level were converted
into expression values at the gene symbol level. For each sample,
the expression values of all probes mapped to a given gene symbol
were averaged. Then, missing data were inserted and median data
normalization performed by using the robust multichip averaging
(RMA) method (8).
DEG screening and clustering
analysis
The limma package (http://www.bioconductor.org/packages/2.9/bioc/html/limma.html)
(9) in R language with multiple
testing correction based on the Benjamini & Hochberg method
(10) was employed to identify
DEGs between IA and normal superficial temporal artery samples.
P-value <0.01 and |log2 fold change (FC) |≥1 were
used as the thresholds for this analysis. Then, the pheatmap
package (https://cran.rproject.org/web/packages/pheatmap/index.html)
(11) in R language was used to
cluster the identified DEGs.
Enrichment analysis of DEGs
To study DEGs at a functional level, GO (Gene
Ontology) functional enrichment analysis (12) and KEGG (Kyoto Encyclopedia of Gene
and Genomes) pathway enrichment (13) analysis were performed using the
online biological tool, database for the annotation, visualization
and integrated discovery (DAVID version 6.7; https://david-d.ncifcrf.gov/) (14). DAVID software has been extensively
used to identify biological processes involving a given list of
genes. In the present study, fold change discovery (FDR) ≤0.05 was
set as the cut-off criterion for enrichment analysis.
PPI network construction
PPIs are important for all biological processes. The
present study constructed a PPI network among DEGs based on the
biomolecular interaction network (BIND) database (http://binddb.org) (15). BIND is available for querying,
viewing and submitting records regarding molecular interactions,
complexes and pathway information. Additionally, ClusterONE
software (http://www.paccanarolab.org/cluster-one/) (16) was used to perform sub-network
clustering analysis and then GO functional enrichment analysis was
then performed for DEGs in each sub-network.
Results
Data preprocessing and DEG
screening
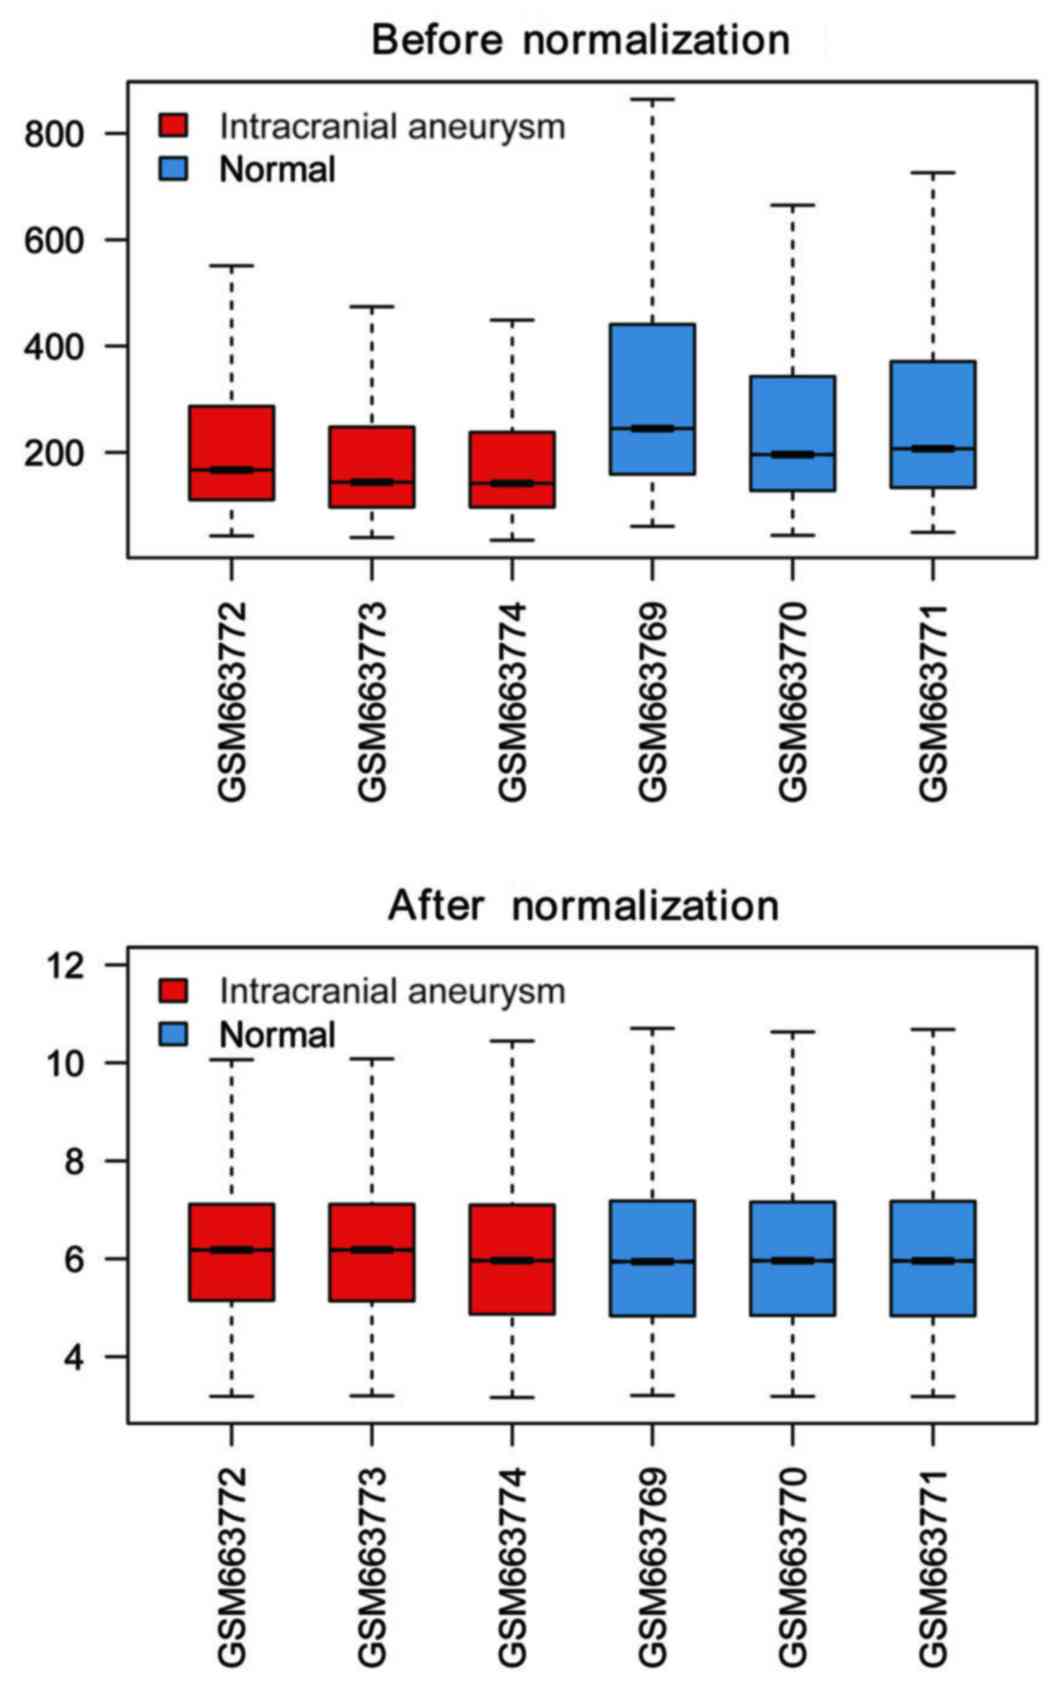
Data prior to and following normalization are
presented in Fig. 1. Following
normalization, gene expression values of differing samples ranged
almost uniformly, which indicated that all of the 6 chips were
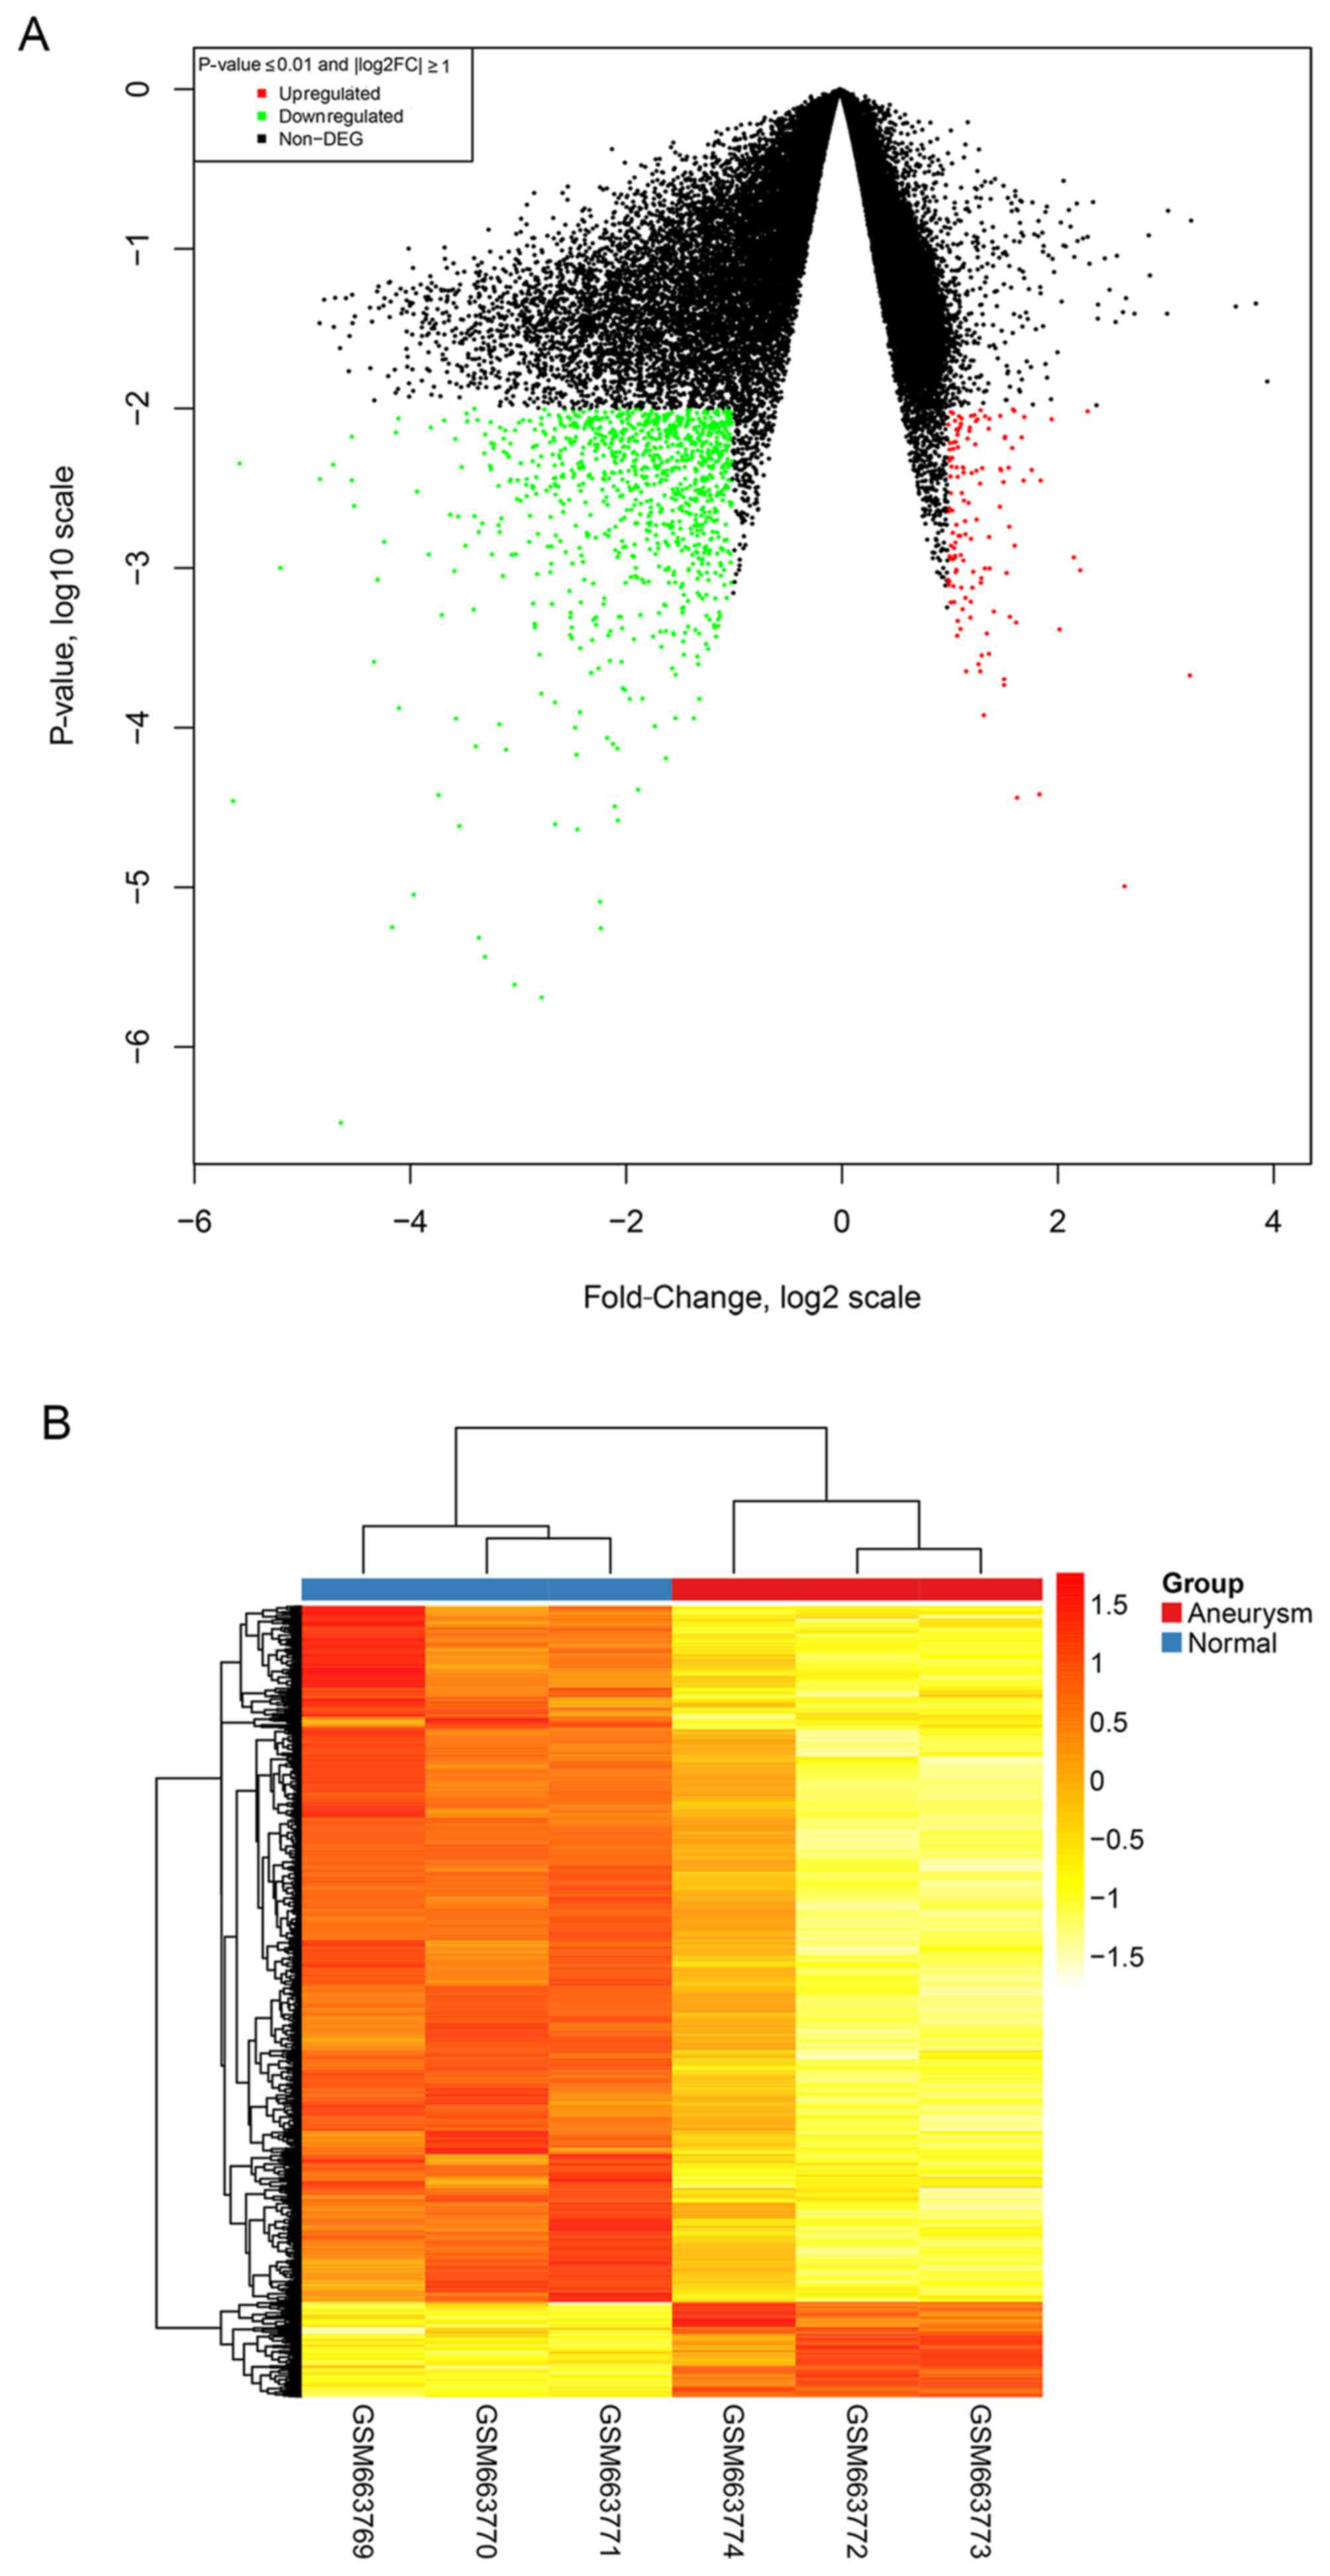
available for further analysis. Following DEG screening using the
limma package, a total of 1124 DEGs (|log2 FC|≥1 and
P-value ≤0.01) were identified, of which 989 DEGs were upregulated
and 135 DEGs downregulated (Fig.
2A). In addition, the top 5 upregulated and top 5 downregulated
DEGs are presented in Table I.
 | Table I.Top 5 upregulated and downregulated
differentially expressed genes. |
Table I.
Top 5 upregulated and downregulated
differentially expressed genes.
| Gene | Average expression
value | Log2
FC | P-value | Expression
alteration |
|---|
| PLN |
8.622363 | −5.62222 |
3.47×10⁻⁵ | Downregulated |
| ADH1C |
8.253548 | −5.56344 |
4.51×10⁻³ | Downregulated |
| PLN |
7.481133 | −5.18628 |
1.00×10⁻³ | Downregulated |
| MYL9 |
9.273575 | −4.81707 |
3.61×10⁻³ | Downregulated |
| SORBS1 |
8.440836 | −4.69688 |
4.44×10⁻³ | Downregulated |
| MMP16 |
7.516438 | 2.166793 |
1.17×10⁻³ | Upregulated |
| SOX4 |
9.123515 | 2.227376 |
9.69×10⁻⁴ | Upregulated |
| NUFIP2 |
8.381299 | 2.294707 |
9.57×10⁻³ | Upregulated |
| TWIST1 |
6.786085 | 2.636303 |
1.01×10⁻⁵ | Upregulated |
| COL5A2 | 10.29836 |
3.242704 |
2.12×10⁻⁴ | Upregulated |
Clustering analysis
A clustering analysis was performed using the
pheatmap package in R language and 1124 DEGs were divided into two
major clusters (Fig. 2B). The DEGs
in the upper cluster were significantly downregulated, whereas the
DEGs in the lower cluster were significantly downregulated. The
separation of the clusters into two differing categories indicated
that the identified DEGs were significantly differentially
expressed between IA and normal superficial temporal artery
samples.
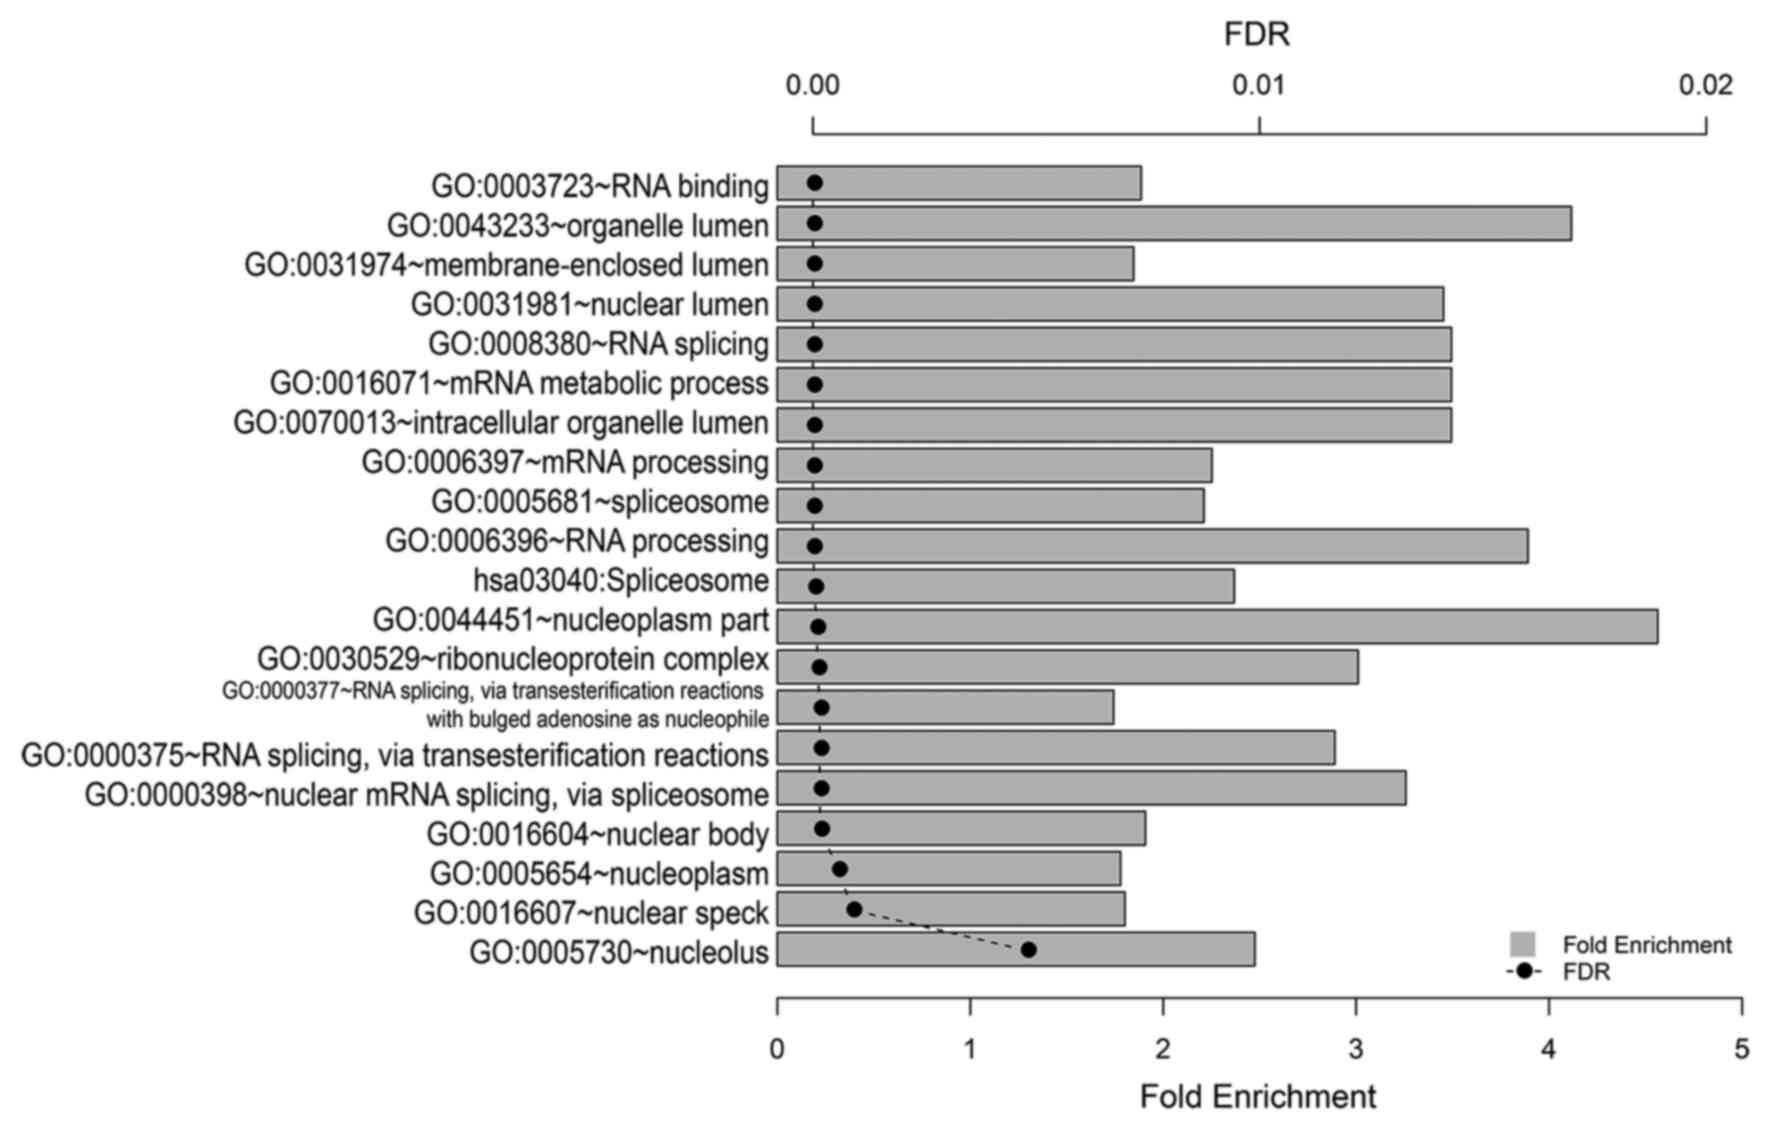
Enrichment analysis of DEGs
KEGG pathway and GO functional enrichment analyses
demonstrated that 1124 DEGs were enriched in 1 KEGG pathway
(hsa03040: spliceosome, FDR≤0.05) and 20 GO functions (FDR≤0.05;
Fig. 3). These GO functions were
primarily associated with RNA splicing and the spliceosome, RNA
processing and the mRNA metabolic process.
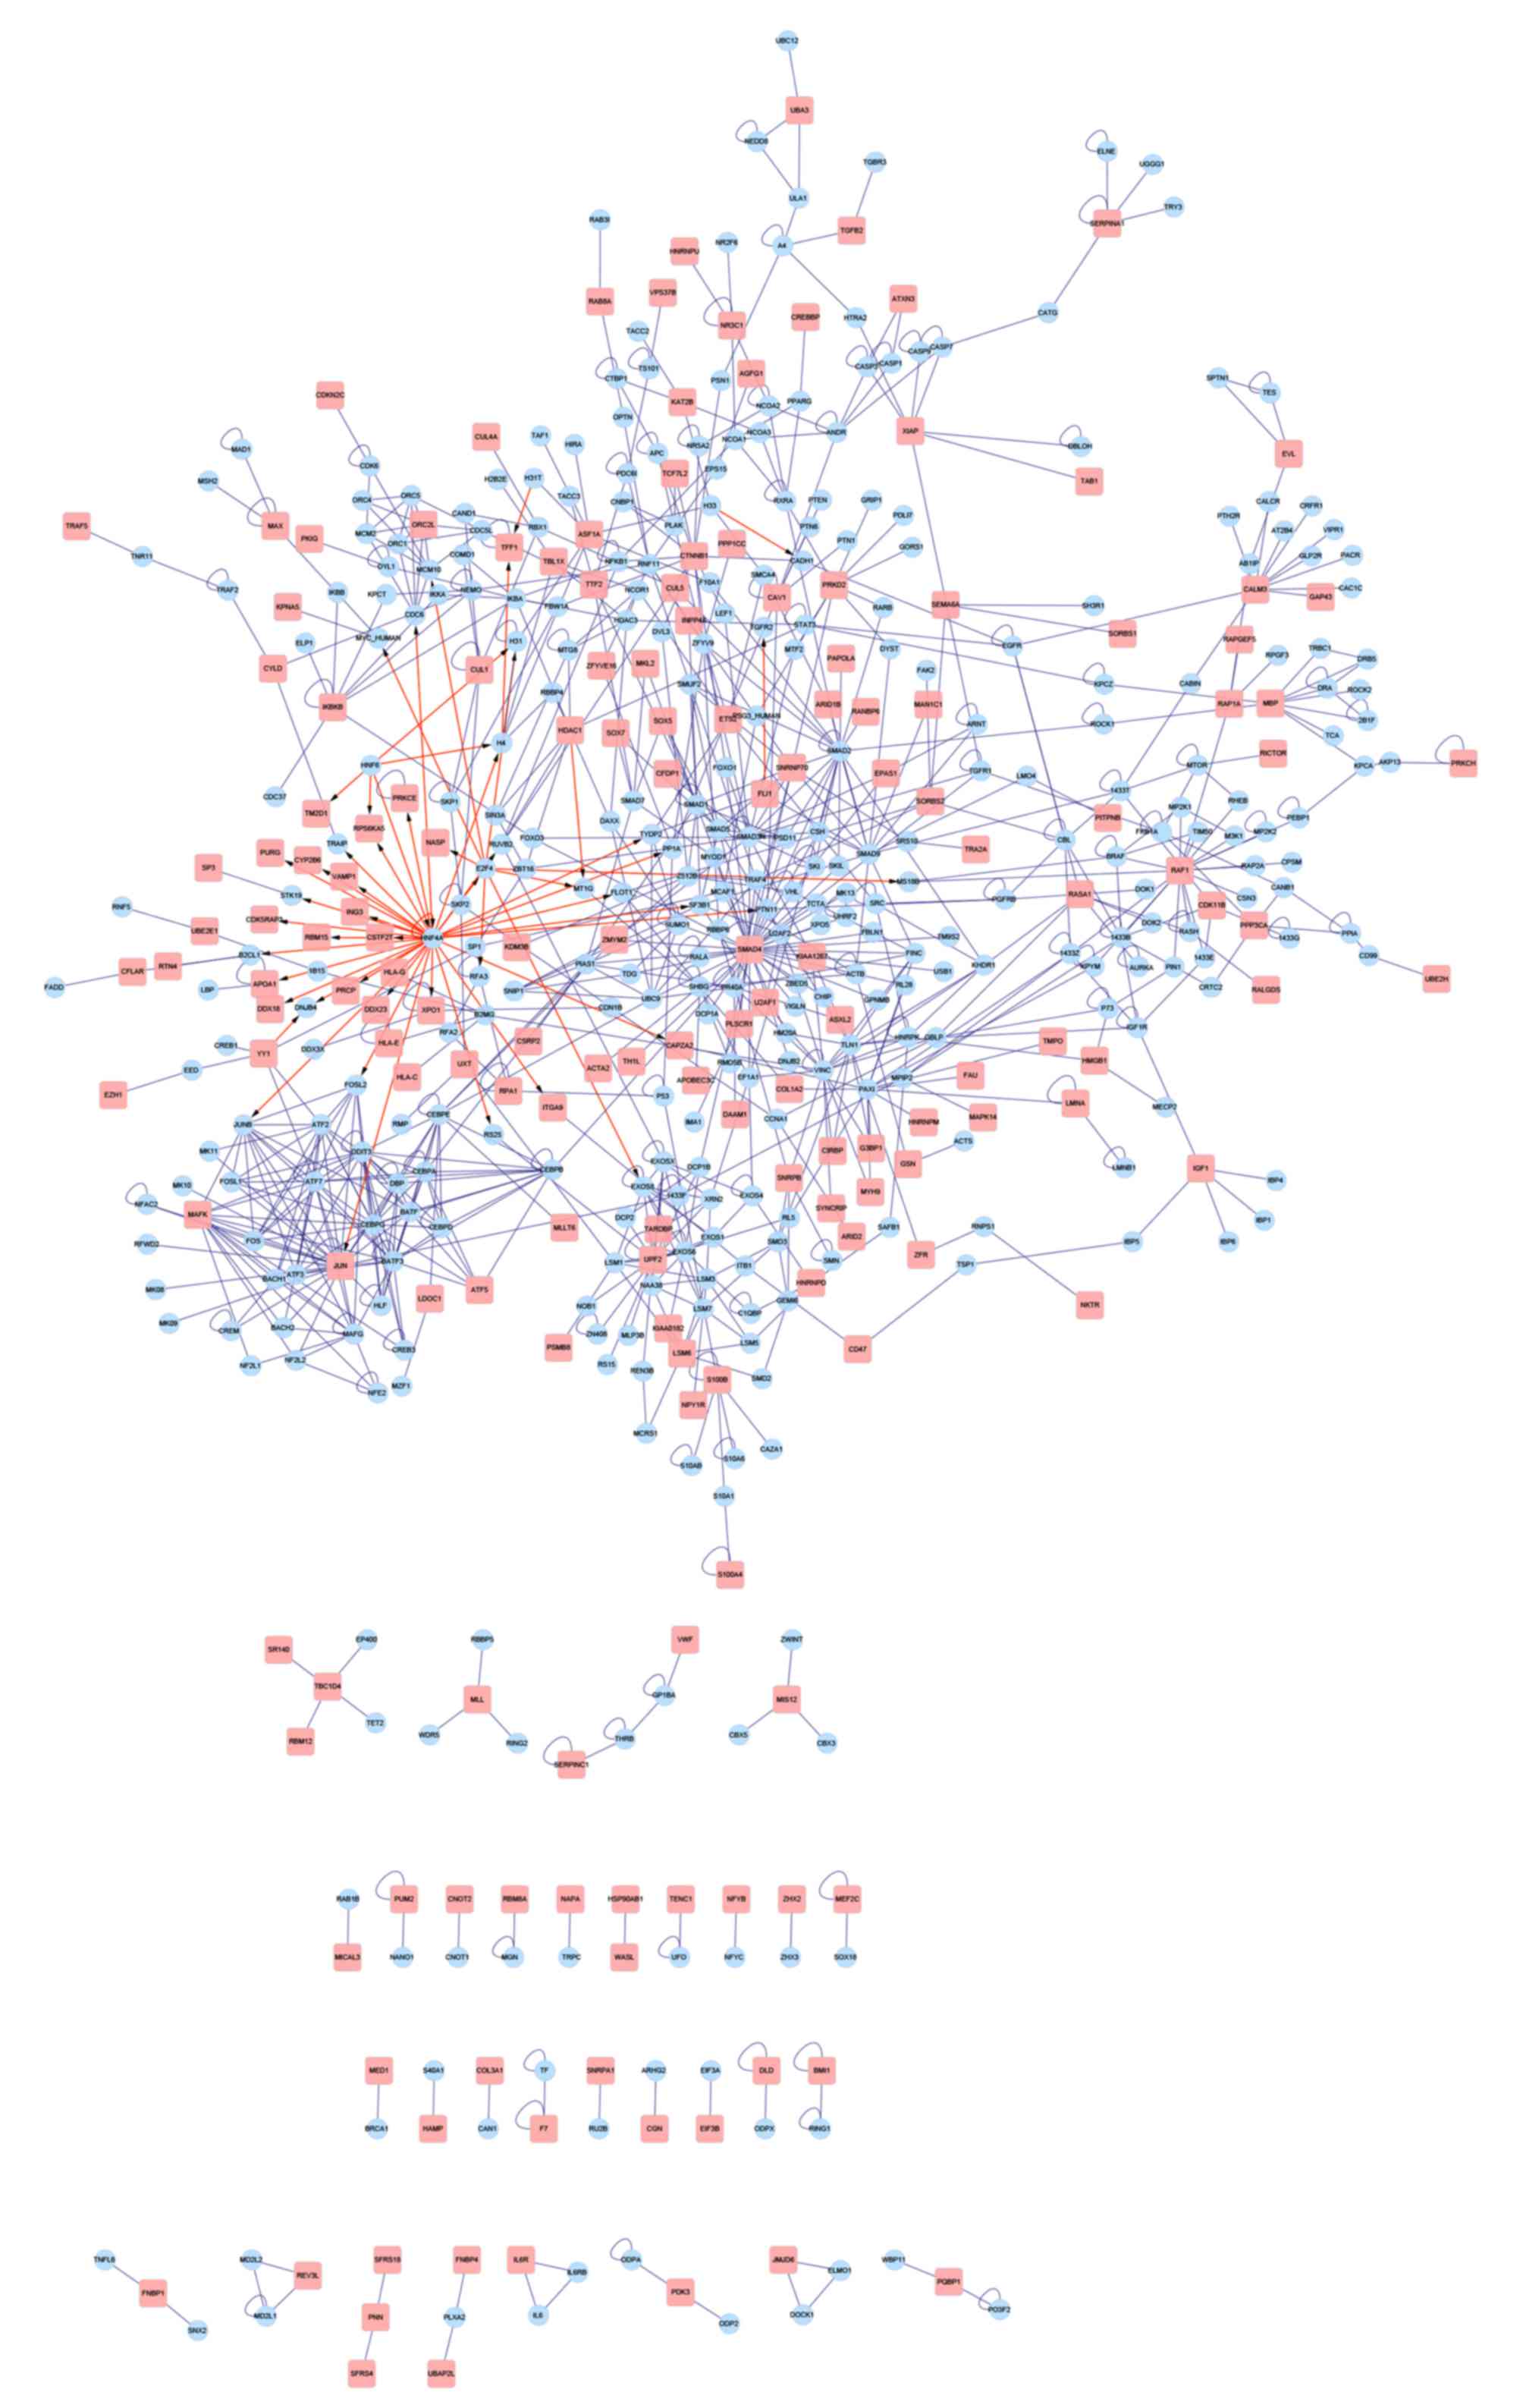
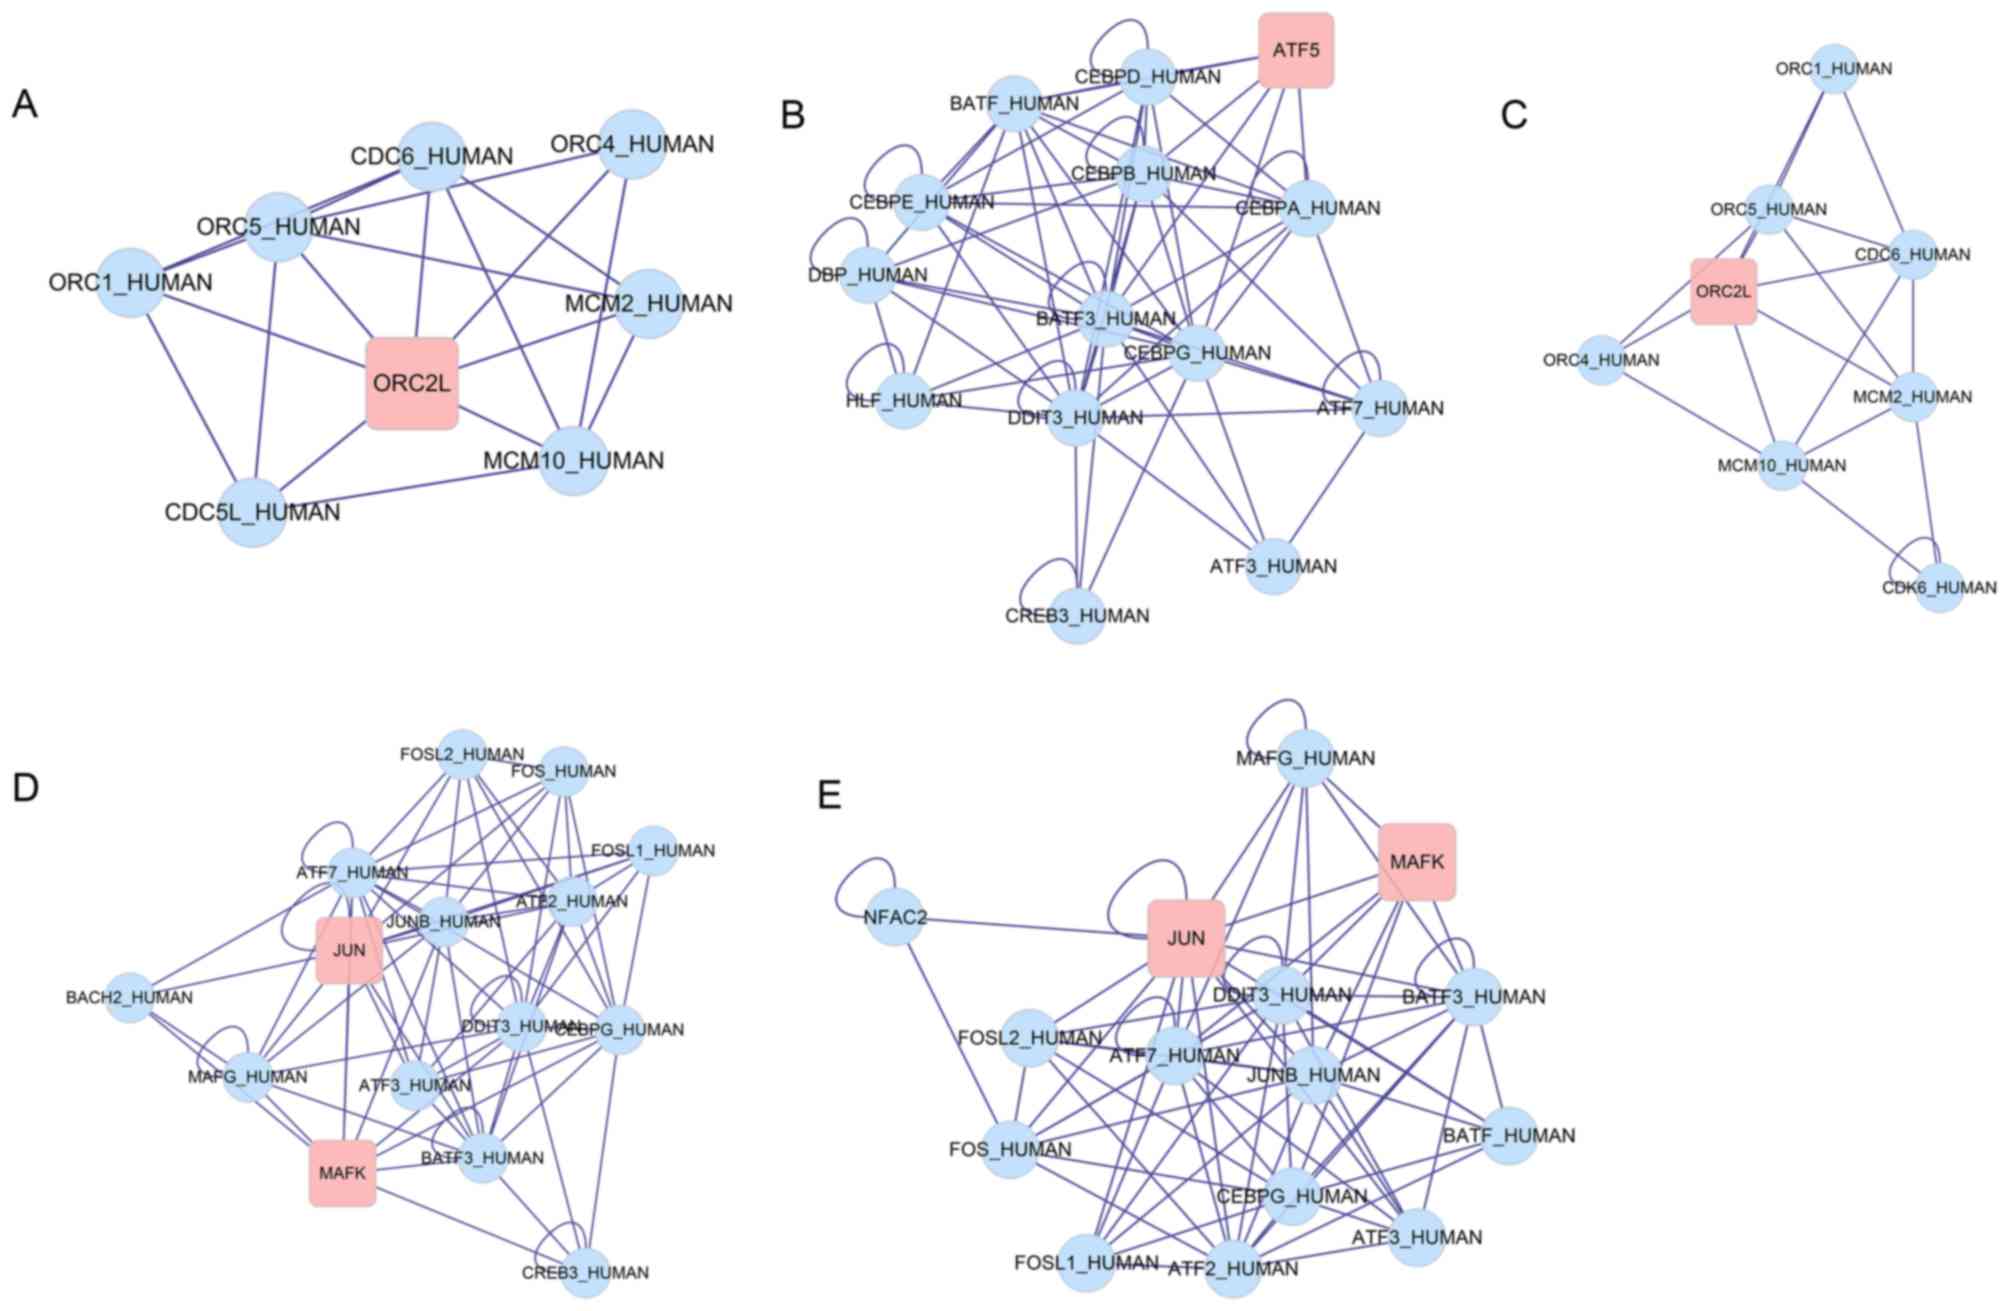
PPI network construction
A PPI network was then constructed using the BIND
database (Fig. 4), in which a
hepatocyte nuclear factor (HNF) 4A (transcription
factor)-centered regulatory network was identified. In addition, a
sub-network clustering analysis was performed using ClusterONE
software and 5 DEG-centered sub-networks were identified (Fig. 5A-E) and significantly enriched in 3
GO functions (Table II). The
central DEGs observed in the sub-networks were origin recognition
complex subunit 2 (ORC2L), activating transcription factor 5
(ATF5), MAF BZIP transcription factor K (MAFK) and
Jun proto-oncogene, activator protein-1 transcription factor
subunit (JUN).
| Table II.Sub-networks from protein-protein
interaction network. |
Table II.
Sub-networks from protein-protein
interaction network.
|
| Sub-network 1 | Sub-network 2 | Sub-network 3 | Sub-network 4 | Sub-network 5 |
|---|
| Nodes | 8 | 14 | 8 | 15 | 15 |
| Density | 0.679 | 0.615 | 0.607 | 0.6 | 0.6 |
| Quality | 0.792 | 0.560 | 0.708 | 0.525 | 0.496 |
| P-value |
4.552×10⁻⁴ |
5.069×10⁻⁴ |
5.367×10⁻⁴ |
1.00×10⁻³ |
3.00×10⁻³ |
| Genes | MCM10 | CEBPE | CDK6 | MAFK | MAFK |
|
| MCM2 | DDIT3 | MCM10 | JUN | JUN |
|
| CDC6 | CEBPG | MCM2 | DDIT3 | DDIT3 |
|
| ORC2L | CEBPB | CDC6 | CEBPG | CEBPG |
|
| ORC1 | DBP | ORC2L | MAFG | MAFG |
|
| ORC5 | CEBPD | ORC1 | CREB3 | NFAC2 |
|
| CDC5L | ATF5 | ORC5 | FOSL1 | FOSL1 |
|
| ORC4 | CEBPA | ORC4 | FOS | FOS |
|
|
| CREB3 |
| FOSL2 | FOSL2 |
|
|
| HLF |
| ATF3 | ATF3 |
|
|
| ATF3 |
| JUNB | JUNB |
|
|
| BATF3 |
| BATF3 | BATF3 |
|
|
| ATF7 |
| ATF7 | ATF7 |
|
|
| BATF |
| ATF2 | ATF2 |
|
|
|
|
| BACH2 | BATF |
| Top
significant | GO:0006260~ | GO:0046983~ | GO:0006260~ | GO:0043565~ | GO:0043565~ |
| GO term | DNA
replication | protein
dimerization | DNA
replication |
sequence-specific |
sequence-specific |
|
|
| activity |
| DNA binding | DNA binding |
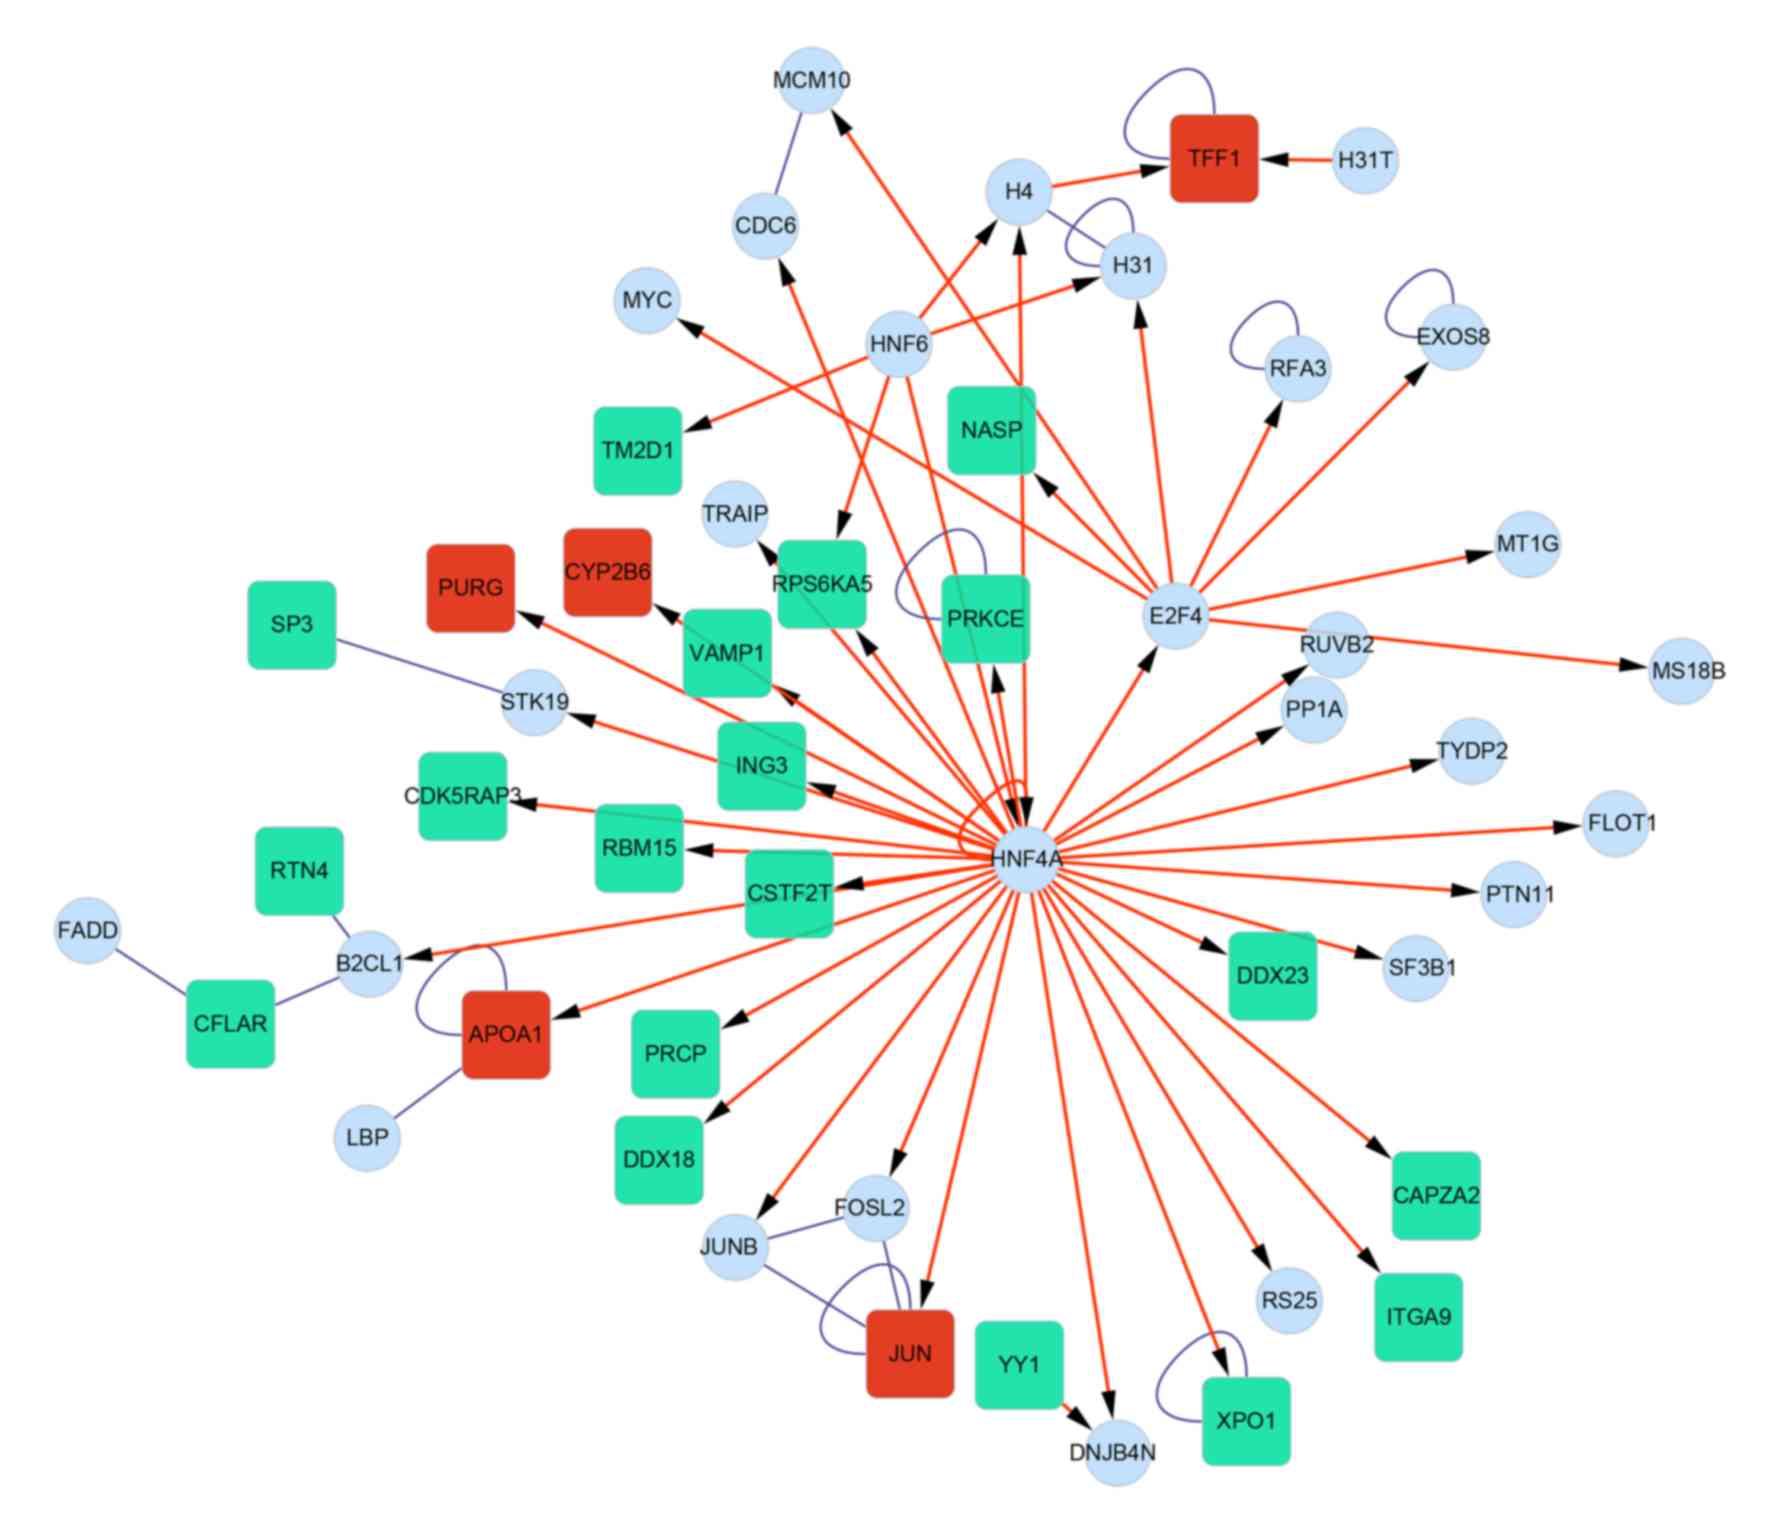
Transcription factor regulatory
network construction
The interactions between DEGs and transcription
factors were identified from the PPI network, and presented in
Fig. 6. A total of 6 transcription
factors (HNF6, HNF4A, E2F4, YY1,
H4 and H31T) and 24 DEGs (5 upregulated and 19
downregulated genes) were involved in the transcription factor
regulatory network. It was observed that HNF4A exhibited the
ability to regulate the DEGs, including prolylcarboxypeptidase
(PRCP) and caspase-8 and Fas associated via death
domain-like apoptosis regulator (CFLAR).
Discussion
IA is a severe clinical condition and as of yet,
there is no current effective therapy. In the present study,
bioinformatic analyses were conducted to investigate the potential
molecular mechanism underlying the occurrence of IA. Consequently,
1,124 DEGs were identified between IA and normal superficial
temporal artery tissue. The DEGs primarily participated in RNA
splicing and the spliceosome, RNA processing, and mRNA metabolic
processing. Following this, a PPI network was constructed and 5
DEG-centered sub-networks were revealed, involving 4 DEGs
(ORC2L, ATF5, MAFK and JUN).
Furthermore, a transcription factor regulatory network was
abstracted, and 6 transcription factors (HNF6, HNF4A,
E2F4, YY1, H4 and H31T) and 24 DEGs
(including PRCP and CFLAR) were involved.
From the results of the sub-pathway clustering
analysis, the PPI network was divided into 5 DEG-centered
sub-networks, involving 4 DEGs (ORC2L, ATF5,
MAFK and JUN). Various DEGs identified included
ATF5 (sub-network 2), which is a stress-response
transcription factor and is highly expressed in various tumors
(17). CCAAT/enhancer binding
protein β (CEBPB) interacts with ATF5 and encodes a
basic-region leucine zipper transcription factor (bZIP).
CEBPB participates in the regulation of the immune and
inflammatory response, and thus may participate in the pathogenesis
of IA (18,19). Therefore, ATF5 may participate in
IA via its interaction with CEBPB. Furthermore, JUN
(sub-network 4 and 5) is a bZIP transcription factor involved in
numerous cellular processes, such as cell growth and apoptosis
(20), and tumor necrosis factor
(TNF)-α has been demonstrated to stimulate prolonged activation of
JUN and interleukin (IL)-1β gene expression (21). TNF-α is known to activate matrix
metalloproteinase which is important in IA pathology (22,23).
In addition, Moriwaki et al (24) demonstrated that IL-1β is important
for the progression of IA via the induction of VSMC apoptosis.
Therefore, JUN may participate in the progression of IA by
responding to TNF-α and IL-1β.
The HNF4A-centered transcription factor
regulatory network led to the identification of the regulatory
pathway HNF6-HNF4A-E2F4. HNF6 encodes a transcription
factor that has been demonstrated to influence a variety of
cellular processes, including cell proliferation, cell-matrix
adhesion and inflammation (25).
The pathological pathway for IA involves endothelial
dysfunction/injury, the mounting inflammatory response, VSMC
phenotypic modulation, extra-cellular matrix remodeling, subsequent
cell death and vessel wall degeneration (26). Therefore, HNF6 may
participate in IA via induction of inflammation. HNF4A
encodes a transcription factor that participates in lipid metabolic
processes. Frösen et al (27) demonstrated that accumulation of
lipids and oxidation in the saccular intracranial aneurysm (sIA)
wall are associated with its degeneration, resulting in fatal SAH
(27). Therefore, HNF4A may
participate in the progression of IA via regulation of vessel wall
remodeling and damage. Furthermore, E2F4 encodes E2F
transcription factor 4 which participates in the cell cycle and
tumor suppression. E2F4 participates in the transforming
growth factor (TGF)-β signaling pathway which is involved in cell
differentiation, cell growth and apoptosis. It has previously been
reported that the TGF-β signaling pathway is important in IA
(28). Therefore, E2F4 may
be involved in IA progression via its participation in the TGF-β
signaling pathway.
Of the DEGs regulated by HNF4A, PRCP
encodes an enzyme which cleaves COOH-terminal amino acids linked to
proline, in peptides including angiotension II (29). Angiotensin II, a part of the
renin-angiotensin system (RAS), is a potent vasoconstrictor and
pro-inflammatory stimulant. Shoja et al (30) demonstrated that RAS is associated
with the pathogenesis of IA. Therefore, PRCP was predicted
to participate in IA progression via the regulation of RAS. In
addition, CFLAR encodes the caspase-8 and Fas associated via
death domain-like apoptosis regulator (31), involved in the TNF-α/nuclear factor
(NF)-κB signaling pathway. NF-κB recruits macrophages into the
vessel walls involved in IA, initiating inflammation and
participating in aneurysm formation (32). Therefore, CFLAR was
hypothesized to participate in IA progression via the TNF-α/NF-κB
signaling pathway.
In conclusion, the results of the present study
revealed that inflammation may be an important factor in AI
development. In order to elucidate the pathology of IA, gene
expression profiling data of 6 samples were downloaded and
analyzed. Following a sub-network clustering analysis, 5
sub-networks were identified, involving 4 DEGs (ORC2L,
ATF5, MAFK and JUN). ATF5 and
JUN served crucial roles in the immune and inflammatory
response and VSMC apoptosis during AI development. In addition, the
regulatory pathway HNF6-HNF4-E2F4 was identified as an
important mechanism involved in the development of AI via the
regulation of inflammation, the TGF-β signaling pathway, the
renin-angiotensin system and the TNF-α/NF-κB signaling pathway.
However, these results were derived from in silico analysis;
thus, further experimental studies are required to verify the
results of the present study.
References
|
1
|
Alg VS, Sofat R, Houlden H and Werring DJ:
Genetic risk factors for intracranial aneurysms: A meta-analysis in
more than 116,000 individuals. Neurology. 80:2154–2165. 2013.
View Article : Google Scholar : PubMed/NCBI
|
|
2
|
Bakke SJ and Lindegaard KF: Subarachnoid
haemorrhage-diagnosis and management. Tidsskr Nor Laegeforen.
127:1074–1078. 2007.(In Norwegian). PubMed/NCBI
|
|
3
|
Li L, Yang X, Jiang F, Dusting GJ and Wu
Z: Transcriptome-wide characterization of gene expression
associated with unruptured intracranial aneurysms. Eur Neurol.
62:330–337. 2009. View Article : Google Scholar : PubMed/NCBI
|
|
4
|
Pera J, Korostynski M, Krzyszkowski T,
Czopek J, Slowik A, Dziedzic T, Piechota M, Stachura K, Moskala M,
Przewlocki R and Szczudlik A: Gene expression profiles in human
ruptured and unruptured intracranial aneurysms: What is the role of
inflammation? Stroke. 41:224–231. 2010. View Article : Google Scholar : PubMed/NCBI
|
|
5
|
Kurki MI, Hakkinen SK, Frosen J, Tulamo R,
von und zu Fraunberg M, Wong G, Tromp G, Niemelä M, Hernesniemi J,
Jääskeläinen JE and Ylä-Herttuala S: Upregulated signaling pathways
in ruptured human saccular intracranial aneurysm wall: An emerging
regulative role of Toll-like receptor signaling and nuclear
factor-κB, hypoxia-inducible factor-1A and ETS transcription
factors. Neurosurgery. 68:1666–1675. 2011. View Article : Google Scholar
|
|
6
|
Yagi K, Tada Y, Kitazato KT, Tamura T,
Satomi J and Nagahiro S: Ibudilast inhibits cerebral aneurysms by
down-regulating inflammation-related molecules in the vascular wall
of rats. Neurosurgery. 66:551–559. 2010. View Article : Google Scholar : PubMed/NCBI
|
|
7
|
Aoki T, Kataoka H, Nishimura M, Ishibashi
R, Morishita R and Miyamoto S: Ets-1 promotes the progression of
cerebral aneurysm by inducing the expression of MCP-1 in vascular
smooth muscle cells. Gene Ther. 17:1117–1123. 2010. View Article : Google Scholar : PubMed/NCBI
|
|
8
|
Irizarry RA, Hobbs B, Collin F,
Beazer-Barclay YD, Antonellis KJ, Scherf U and Speed TP:
Exploration, normalization and summaries of high density
oligonucleotide array probe level data. Biostatistics. 4:249–264.
2003. View Article : Google Scholar : PubMed/NCBI
|
|
9
|
Gentleman RC, Carey VJ, Bates DM, Bolstad
B, Dettling M, Dudoit S, Ellis B, Gautier L, Ge Y, Gentry J, et al:
Bioconductor: Open software development for computational biology
and bioinformatics. Genome Biol. 5:R802004. View Article : Google Scholar : PubMed/NCBI
|
|
10
|
Reiner A, Yekutieli D and Benjamini Y:
Identifying differentially expressed genes using false discovery
rate controlling procedures. Bioinformatics. 19:368–375. 2003.
View Article : Google Scholar : PubMed/NCBI
|
|
11
|
Kolde R: Pheatmap: Pretty heatmaps. R
package version 0.6. 1:2012.
|
|
12
|
Ashburner M, Ball CA, Blake JA, Botstein
D, Butler H, Cherry JM, Davis AP, Dolinski K, Dwight SS, Eppig JT,
et al: Gene ontology: Tool for the unification of biology. The Gene
Ontology Consortium. Nat Genet. 25:25–29. 2000. View Article : Google Scholar : PubMed/NCBI
|
|
13
|
Kanehisa M and Goto S: KEGG: kyoto
encyclopedia of genes and genomes. Nucleic Acids Res. 28:27–30.
2000. View Article : Google Scholar : PubMed/NCBI
|
|
14
|
Huang da W, Sherman BT and Lempicki RA:
Systematic and integrative analysis of large gene lists using DAVID
bioinformatics resources. Nat Protoc. 4:44–57. 2009. View Article : Google Scholar : PubMed/NCBI
|
|
15
|
Bader GD, Betel D and Hogue CW: BIND: The
biomolecular interaction network database. Nucleic Acids Res.
31:248–250. 2003. View Article : Google Scholar : PubMed/NCBI
|
|
16
|
Nepusz T, Yu H and Paccanaro A: Detecting
overlapping protein complexes in protein-protein interaction
networks. Nat Methods. 9:471–472. 2012. View Article : Google Scholar : PubMed/NCBI
|
|
17
|
Greene LA, Lee HY and Angelastro JM: The
transcription factor ATF5: Role in neurodevelopment and neural
tumors. J Neurochem. 108:11–22. 2009. View Article : Google Scholar : PubMed/NCBI
|
|
18
|
Schoenen H, Huber A, Sonda N, Zimmermann
S, Jantsch J, Lepenies B, Bronte V and Lang R: Differential control
of mincle-dependent cord factor recognition and macrophage
responses by the transcription factors C/EBPβ and HIF1α. J Immunol.
2014. View Article : Google Scholar : PubMed/NCBI
|
|
19
|
Chalouhi N, Ali MS, Jabbour PM,
Tjoumakaris SI, Gonzalez LF, Rosenwasser RH, Koch WJ and Dumont AS:
Biology of intracranial aneurysms: Role of inflammation. J Cereb
Blood Flow Metab. 32:1659–1676. 2012. View Article : Google Scholar : PubMed/NCBI
|
|
20
|
Wisdom R, Johnson RS and Moore C: c-Jun
regulates cell cycle progression and apoptosis by distinct
mechanisms. EMBO J. 18:188–197. 1999. View Article : Google Scholar : PubMed/NCBI
|
|
21
|
Brenner DA, O'Hara M, Angel P, Chojkier M
and Karin M: Prolonged activation of jun and collagenase genes by
tumour necrosis factor-alpha. Nature. 337:661–663. 1989. View Article : Google Scholar : PubMed/NCBI
|
|
22
|
Polavarapu R, Gongora MC, Winkles JA and
Yepes M: Tumor necrosis factor-like weak inducer of apoptosis
increases the permeability of the neurovascular unit through
nuclear factor-kappa B pathway activation. J Neurosci.
25:10094–10100. 2005. View Article : Google Scholar : PubMed/NCBI
|
|
23
|
Thomson EM, Williams A, Yauk CL and
Vincent R: Overexpression of tumor necrosis factor-α in the lungs
alters immune response, matrix remodeling and repair and
maintenance pathways. Am J Pathol. 180:1413–1430. 2012. View Article : Google Scholar : PubMed/NCBI
|
|
24
|
Moriwaki T, Takagi Y, Sadamasa N, Aoki T,
Nozaki K and Hashimoto N: Impaired progression of cerebral
aneurysms in interleukin-1beta-deficient mice. Stroke. 37:900–905.
2006. View Article : Google Scholar : PubMed/NCBI
|
|
25
|
Wang K and Holterman AX: Pathophysiologic
role of hepatocyte nuclear factor 6. Cell Signal. 24:9–16. 2012.
View Article : Google Scholar : PubMed/NCBI
|
|
26
|
Jayaraman T, Paget A, Shin YS, Li X, Mayer
J, Chaudhry H, Niimi Y, Silane M and Berenstein A:
TNF-alpha-mediated inflammation in cerebral aneurysms: A potential
link to growth and rupture. Vasc Health Risk Manag. 4:805–817.
2008. View Article : Google Scholar : PubMed/NCBI
|
|
27
|
Frösen J, Tulamo R, Heikura T, Sammalkorpi
S, Niemelä M, Hernesniemi J, Levonen AL, Hörkkö S and Ylä-Herttuala
S: Lipid accumulation, lipid oxidation and low plasma levels of
acquired antibodies against oxidized lipids associate with
degeneration and rupture of the intracranial aneurysm wall. Acta
Neuropathol Commun. 1:712013. View Article : Google Scholar : PubMed/NCBI
|
|
28
|
Ruigrok YM, Tan S, Medic J, Rinkel GJ and
Wijmenga C: Genes involved in the transforming growth factor beta
signalling pathway and the risk of intracranial aneurysms. J Neurol
Neurosurg Psychiatry. 79:722–724. 2008. View Article : Google Scholar : PubMed/NCBI
|
|
29
|
Tan F, Morris PW, Skidgel RA and Erdos EG:
Sequencing and cloning of human prolylcarboxypeptidase
(angiotensinase C). Similarity to both serine carboxypeptidase and
prolylendopeptidase families. J Biol Chem. 268:16631–16638.
1993.PubMed/NCBI
|
|
30
|
Shoja MM, Agutter PS, Tubbs RS, Payner TD,
Ghabili K and Cohen-Gadol AA: The role of the renin-angiotensin
system in the pathogenesis of intracranial aneurysms. J Renin
Angiotensin Aldosterone Syst. 12:262–273. 2011. View Article : Google Scholar : PubMed/NCBI
|
|
31
|
Dutton A, Young LS and Murray PG: The role
of cellular FLICE inhibitory protein (c-FLIP) in the pathogenesis
and treatment of cancer. Expert Opin Ther Targets. 10:27–35. 2006.
View Article : Google Scholar : PubMed/NCBI
|
|
32
|
Aoki T, Kataoka H, Morimoto M, Nozaki K
and Hashimoto N: Macrophage-derived matrix metalloproteinase-2 and
−9 promote the progression of cerebral aneurysms in rats. Stroke.
38:162–169. 2007. View Article : Google Scholar : PubMed/NCBI
|