Introduction
Gastric cancer (GC) is a common malignant neoplasm
that is derived from gastric epithelial dysplasia and intestinal
metaplasia (1); GC is the third
leading cause of malignant neoplasm-related mortalities worldwide,
with ~989,600 new cases and ~738,000 mortalities in 2008 (2). GC has high heterogeneity with
histopathologic and epidemiologic characteristics (3), and can be divided into several
classifications, including proximal nondiffuse, diffuse and distal
nondiffuse GC (4). A previous
study identified DNA content heterogeneity in 12 (33%) patients
with primary GC that were examined (5); however, DNA content heterogeneity was
independent of histological heterogeneity. The incidence and
mortality rates of GC are declining worldwide, owing to the notable
progress made in diagnosis, prevention and treatment; however, as
the rate of relapse is high and we do not completely understand the
pathogenesis, additional long-term studies are required if GC is to
be cured.
A number of previous studies have attempted to
identify new potential therapeutic targets of GC. For example, the
upregulated expression of the transcription factor hepatocyte
nuclear factor 4α by AMP-activated protein kinase signaling is a
main event in GC development (6).
Vestigial-like family member 4 (VGLL4) was reported to be a
promising therapeutic target for GC inhibition, as VGLL4 competes
with yes-associated protein (YAP) for binding with TEA domain
transcription factor 1, and YAP is involved in overgrowth and tumor
formation of multiple cancers (7).
microRNA (miRNA) miR-329 was also previously revealed to reduce the
expression of T-lymphoma invasion and metastasis-inducing 1, and
may be a potential therapeutic target for suppression of GC cell
invasion and proliferation (8). In
addition, miR-7 expression was reported to be significantly reduced
in highly metastatic GC cells, and insulin-like growth factor-1
receptor (IGF1R) oncogene overexpression, as a direct target of
miR-7, may attenuate the function of miR-7 in GC cells (9); thus, miR-7/IGF1R may be a therapeutic
approach to inhibit GC metastasis. Furthermore, several signaling
pathways have been revealed to be associated with GC. For example,
the inactivation of transforming growth factor-β and hedgehog
signaling pathways have been reported as useful therapeutic
pathways to prevent GC progression, by inhibiting the migration and
invasion of GC cells (10,11). However, these previous reports did
not identify the GC subtypes of the patients in their study and,
thus, the subtype-specific subpaths of miRNAs, their targeted genes
and related pathways remain unknown.
The present study reanalyzed the data set GSE13861
that was published by Cho et al (12). That study generated and analyzed
microarray data from 65 patients with GC to identify feature genes
related to relapse and subsequently predicted the relapse of
patients who received gastrectomy. Conversely, the present study
aimed to screen specific genes and to use those genes to divide the
patients into different subtypes; as well as to identify the
subtype-specific subpaths of miRNA-target pathway for comprehensive
understanding the mechanisms of GC through bioinformatical
prediction methods.
Materials and methods
Data access and data
preprocessing
The microarray raw data were downloaded from Gene
Expression Omnibus (https://www.ncbi.nlm.nih.gov/geo; accession number
GSE13861) database, which were based on the Illumina HumanWG-6 v3.0
Expression Beadchip platform. A total of 90 samples were obtained,
comprising 65 samples from primary gastric adenocarcinoma (PGD)
tissues, 6 samples from gastrointestinal stromal tumor (GIST)
tissues and 19 samples from normal gastric tissues. The probes were
transformed to corresponding gene symbols and merged according to
the application programing of Python. Mean expression values of the
same gene were obtained and all expression values were revised
using Z-score (13).
Differentially expressed genes (DEGs)
analysis
Owing to high heterogeneity, the changes of
expression in some important genes that may induce GC only occur in
heterogeneous populations. Thus, to capture those important genes
within a group, a new method, detection of imbalanced differential
signal (DIDS), was adopted to identify subgroup DEGs in
heterogeneous populations (14).
Based on the DIDS algorithm, the normal reference interval of each
gene expression value was stipulated between the maximum and
minimum value, and they were respectively calculated as the
corresponding mean values in the normal group ±1.96 × standard
deviation. Subsequently, random disturbance was conducted and
multiple testing adjustments were performed by Benjamini-Hochberg
method, which revised the raw P-value into the false discovery rate
(FDR) (15). FDR <0.01 was used
as the cut-off criterion to filter DEGs.
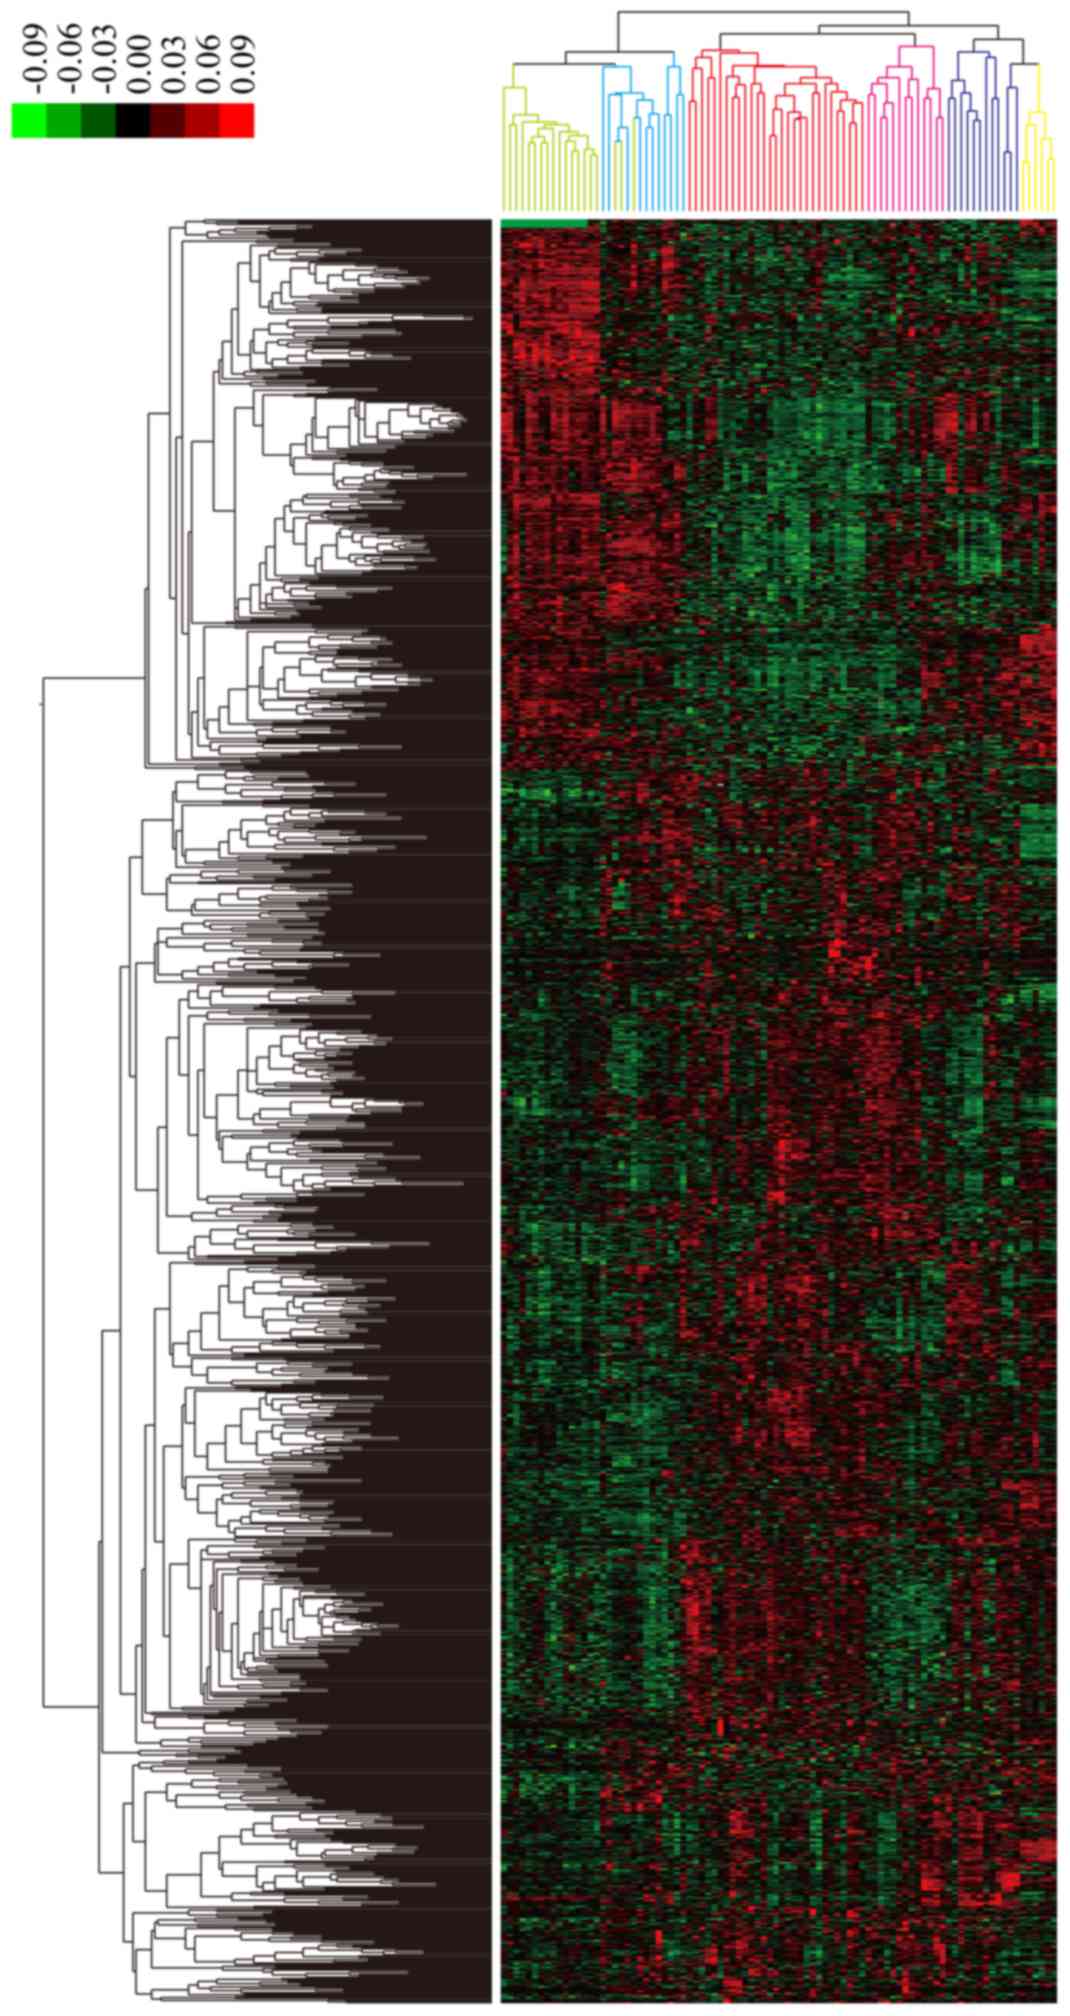
Hierarchical clustering
Cluster and TreeView are programs that offer
computational and graphical analyses of the results from DNA
microarray data (16). In the
present study, hierarchical clustering analysis was performed among
the 90 PGD samples, and the processing of expression profile data,
including filtering the data and data normalization, were conducted
by Cluster software (17–19). Based on the clusters of genes
similarly expressed, the results of hierarchical clustering were
used to identify the different GC subtypes and were displayed as a
heatmap (Version 1.2.0; http://www.bioconductor.org/packages/release/bioc/html/heatmaps.html).
Identification of specific genes in
each subtype
Following identification of the subtypes of GC that
were based on hierarchical clustering analysis, the specific gene
expressions in each subtype was examined. First, the mean
expression values of genes were distributed in each subtype.
Second, to estimate whether an identified DEG was a specific gene
for a certain subtype, the following formulas were used:
U=max–min(ifU>U′);and{Xi>max–γxU(ifscore>0)Xi<min–γxU(ifscore<0)
For each gene, score represented the deviation from
normal range, and score >0 indicated that the DEG was
upregulated in the PGD samples, and score <0 indicated that the
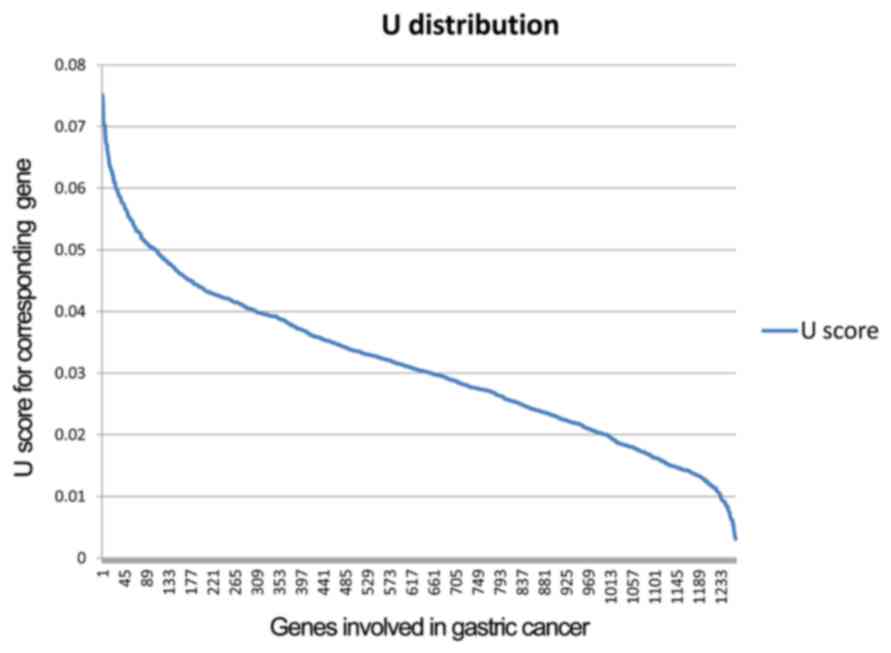
DEG was downregulated in the PGD samples. The U distribution of
genes related to GC is provided in Fig. 1. Specific genes were identified
from the DEGs with the cut-off criterion of U >0.04, otherwise
the DEG was considered as common gene. For example, one gene was
indicated as ‘g’ and the mean expression value of this gene in GC
subtypes was indicated as ‘X1’, ‘X2’… ‘Xi’ and ‘Xm’. ‘Max’
represented the maximum mean expression values in those GC
subtypes, whereas ‘min’ represented the minimum mean expression
values among those GC subtypes. ‘Xi’ represented the mean
expression values of one gene in subtype i, and it was evaluated if
this gene was specific to subtype i with the aforementioned
formulas. If Xi>max-γ × U, the gene was specific to subtype i.
Where γ is the threshold value, and γ=1/m, in which m represents
the number of GC subtypes.
Pathway enrichment analysis
The Molecular Signatures Database (MSigDB;
http://software.broadinstitute.org/gsea/msigdb/index.jsp)
is a collection of annotated gene sets used to perform gene set
enrichment analysis (20). A total
of 186 Kyoto Encyclopedia of Genes and Genomes (KEGG) pathways and
their related gene sets data from MSigDB were downloaded. By
combing the pathway data, specific genes were identified in PGD
samples, and pathway enrichment analysis was performed on specific
genes of each subtype using Fisher's exact test. Significant
pathway terms were selected with the threshold of P<0.05.
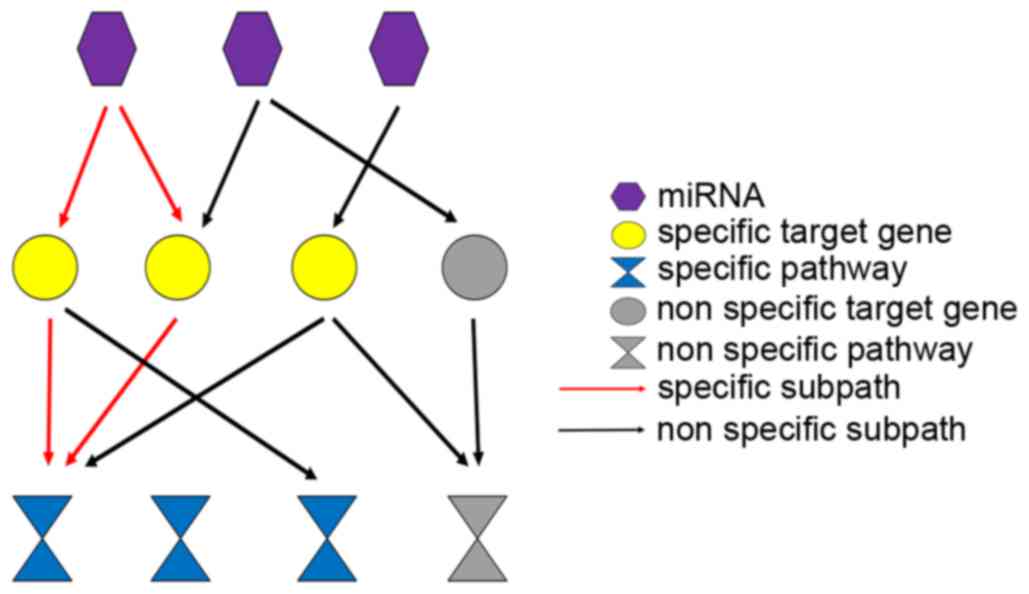
Identification of subtype-specific
subpaths of miRNA-target pathway
Significant drugs to diseases were predicted using
causal inference as previously described (21); this method was used to construct
CauseNet for the identification of subtype-specific subpath of
miRNA-target pathways. A layered network from miRNAs to specific
pathways is presented in Fig. 2.
Relationships between miRNAs, their targets genes, specific genes,
target-related pathways and specific KEGG pathways were calculated.
If a miRNA regulated several specific genes that were enriched in
several significant KEGG pathways, those subpaths of miRNA-target
pathway may be important subpaths for explaining the development of
different subtypes of GC.
To identify those important subpaths, the following
algorithms were used:
weight=1+P|G|P|G*|;andscore=log10(weight1
× weight × weight3)
Where weight1 is the weight of miRNA of each
subpath, P|G*| is the whole number of specific genes and P|G| is
the number of specific genes regulated by the miRNA. Weight2
represents the weight of a target gene, in which P|G*| is the total
KEGG pathways number in which all targets participated and P|G| is
the KEGG pathways number that was this target participated. Weight3
is the weight of a pathway, in which P|G*| is total gene number
enriched in this pathway and P|G| represents the number of specific
genes. In addition, the scores of all the subpaths in each subtype
were repeatedly calculated following the course of 1,000 times
random disturbance, and the subpath with the max score in a certain
subtype was chosen as the specific subpath of this subtype with the
cut-off criteria of P<0.05. Furthermore, subpath analysis among
the specific genes was conducted to identify the subtype-specific
regulation relationship of miRNA-target pathway.
Helicobacter pylori infection rate in
each GC subtype
H. pylori infection is a known risk factor
for GC progression (22); however,
whether H. pylori infection is a subtype-specific pathway
for our predicted GC subtype is unknown. Thus, a series of
bioinformatics methods and clinic information of GC samples with
H. pylori infection were combined to calculate the H.
pylori rate in each of the predicted GC subtypes. The
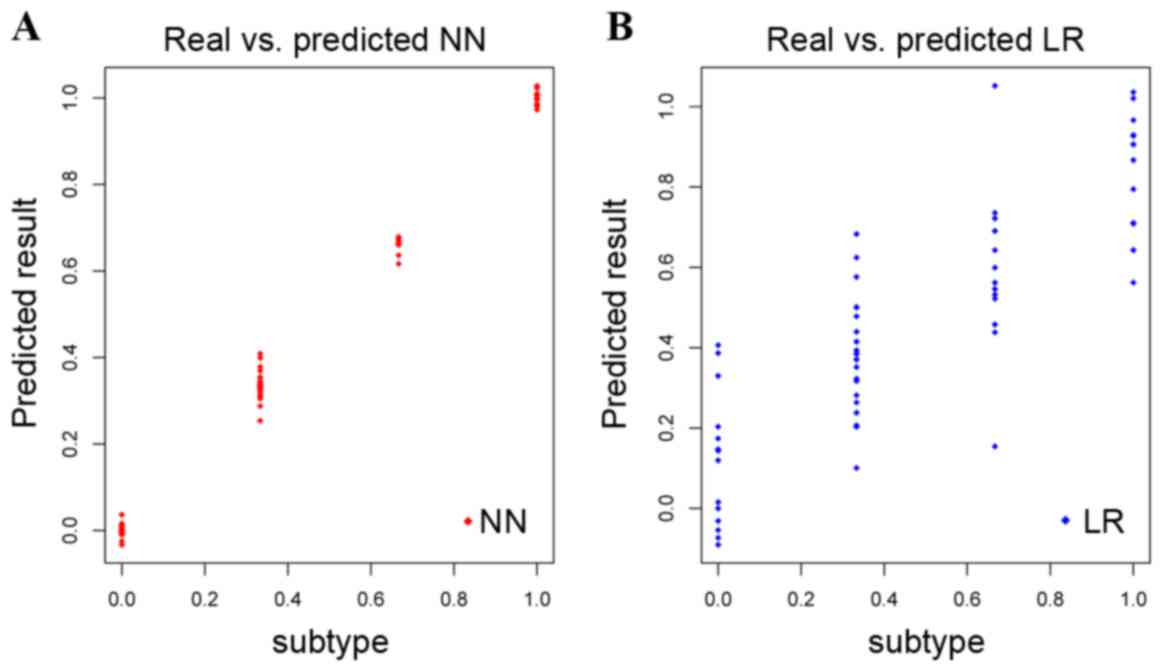
identified specific genes in each subtype were used as characters
to build a neural network (NN) model using the neuralnet package in
R (Version 1.5.0; https://cran.r-project.org/web/packages/NeuralNetTools/index.html).
The input layer was 24 neurons (also designated 24 gene feature)
and the output layer was 1 neuron, which was used to decide which
subtype a certain neuron belonged. The hidden layer was set as two
layers that included eight and five neurons, respectively. Sigmoid
neural activation function was adopted for feed-forward neural
network and backward propagation was used for weight optimization.
The maximum number of iterations to convergence to its stationary
distribution. was 1,000. In addition, logistic regression (LR)
model was performed to compare with NN model. Through building a NN
model and training the NN with analysis data, the prediction for
the four GC subtypes may be achieved. Following forecast
classification of independent test data in The Cancer Genome Atlas
(TCGA; https://cancergenome.nih.gov/), four
testing-set subtypes were obtained. Subsequently, 100 GC samples
(including 46 H. pylori infection samples and 54 without
H. pylori infection samples) were downloaded from the
PMID:24816253 data set (23).
According to the clinical information regarding H. pylori
infection rate in TCGA and the distribution of H. pylori
infection samples in the four subtypes, the H. pylori
infection rate in each subtype was calculated.
Results
DEG screening and hierarchical
clustering
Based on the aforementioned criteria, a total of
1,263 DEGs that were related to GC were identified, including 392
downregulated genes and 871 upregulated genes in the PGD samples.
Additionally, hierarchy cluster analysis indicated that the 1,263
DEGs could be used to divide the 65 PGD samples into four subtypes
with correlated expression profiles. The four subtypes of GC were:
i) Subtype 1 in blue with 11 samples; ii) subtype 2 in red with 29
samples; iii) subtype 3 in pink with 13 samples; and iv) subtype 4
in purple with 12 samples. Although three of the normal samples
were wrongly identified as subtype 1, the other PGD, GIST and
normal samples were placed among different clusters and were
classified correctly. In addition, the results indicated that there
was no heterogeneity of gene expression within subtypes, but there
was high heterogeneity between different subtypes (Fig. 3).
Identification of specific genes in
each subtype
According to the formulas described in the Methods
section, specific genes of the four subtypes and common genes were
identified. A total of 33 specific genes were identified in subtype
1, 318 in subtype 2, 161 in subtype 3 and 157 in subtype 4. In
addition, a total of 631 common genes were detected, which were
significantly different between the GC group and normal group, but
exhibited no notable difference within the four subtypes.
KEGG pathway enrichment analysis
To explore the significant differences among the
four GC subtypes at the molecular level, four subtype-specific
pathway analyses were conducted. Five specific pathways, such as
renin-angiotensin system and H. pylori infection, were
associated with GC subtype 1 (Table
I); two specific pathways were identified in subtype 2,
including nuclear factor (NF)-κB signaling pathway and tight
junction. The specific genes related to GC subtype 3 were enriched
in six specific pathways that were mainly associated with metabolic
process, such as fatty acid metabolism, proteasome and
ubiquitin-mediated proteolysis; the data indicated that
carbohydrate metabolism may serve an important role in the
progression of GC subtype 3. The specific genes of GC subtype 4
were enriched in 14 specific pathways, including phosphoinositide 3
kinase/Akt signaling pathway, focal adhesion, vascular smooth
muscle contraction and cardiac muscle contraction.
 | Table I.Subtype-specific pathways related to
gastric cancer and common pathways of all subtypes. |
Table I.
Subtype-specific pathways related to
gastric cancer and common pathways of all subtypes.
| Subtype | KEGG pathway | Counta | Allb |
P-valuec |
|---|
| Subtype 1 | Renin-angiotensin
system | 3 | 17 | 0.007398 |
|
| Folate
biosynthesis | 2 | 10 | 0.014313 |
|
| Type II diabetes
mellitus | 1 | 9 | 0.01947 |
|
| Hedgehog signaling
pathway | 2 | 13 | 0.024601 |
|
| Helicobacter
pylori infection | 1 | 8 | 0.03013 |
| Subtype 2 | NF-κB signaling
pathway | 6 | 9 | 0.01016 |
|
| Tight junction | 4 | 5 | 0.015905 |
| Subtype 3 | Fatty acid
metabolism | 2 | 3 | 0.044476 |
|
| Ribosome biogenesis
in eukaryotes | 4 | 7 | 0.006553 |
|
| Proteasome | 5 | 10 | 0.004685 |
|
| Nucleotide excision
repair | 3 | 7 | 0.048337 |
|
| Cell cycle | 4 | 11 | 0.040908 |
|
| Ubiquitin mediated
proteolysis | 6 | 11 | 0.001051 |
| Subtype 4 | PI3K/Akt signaling
pathway | 9 | 22 | 0.000675 |
|
| Vascular smooth
muscle contraction | 5 | 10 | 0.004185 |
|
| Alzheimer's
disease | 4 | 7 | 0.00597 |
|
| Focal adhesion | 5 | 11 | 0.006911 |
|
| Cardiac muscle
contraction | 3 | 5 | 0.015628 |
|
| Pertussis | 3 | 5 | 0.015628 |
|
| Hypertrophic
cardiomyopathy | 4 | 10 | 0.026485 |
|
| Dilated
cardiomyopathy | 4 | 10 | 0.026485 |
|
| Long-term
depression | 3 | 6 | 0.028424 |
|
| Porphyrin and
chlorophyll metabolism | 2 | 3 | 0.042385 |
|
| Salmonella
infection | 2 | 3 | 0.042385 |
|
| Glioma | 2 | 3 | 0.042385 |
|
| Dopaminergic
synapse | 3 | 7 | 0.045265 |
|
| Melanoma | 3 | 7 | 0.045265 |
Identification of subtype-specific
subpath of miRNA-target pathway
According to the aforementioned Methods and
criteria, specific subpaths of each subtype were identified. Four
or five specific subpaths were identified for each subtype
(Table II). In subtype 1, ARF
GTPase-activating protein GIT1 was indicated to be regulated by
miR-199B, miR-122A and miR-199A through the H. pylori
infection pathway, and calcium voltage-gated channel subunit α1 E
(CACNA1E) was indicated as regulated by miR-202 through the
type II diabetes mellitus pathway. For subtype 2, protein inhibitor
of activated STAT 4 may be regulated by miR-198, and C-C motif
chemokine ligand 21 (CCL21) may be regulated by miR-338 and
miR-370 by participating in NF-κB signaling pathway; in addition,
miR-508 may regulate VAMP-associated protein A through tight
junction pathway. In GC subtype 3, miR-146B and miR-146A were
indicated to regulate proteasome 26S subunit, non-ATPase 3
(PSMD3) through the proteasome pathway. Five important
subpaths of subtype 3 were identified, including miR-429 and
miR-205 regulation of LDL receptor-related 1 through the
Salmonella infection pathway, and miR-34A, miR-34C and
miR-449 regulation of vinculin (VCL) through the focal
adhesion pathway.
| Table II.Subtype-specific subpaths of gastric
cancer. |
Table II.
Subtype-specific subpaths of gastric
cancer.
| Subtype | miRNA | Pathway | Targeta | Score | P-value |
|---|
| Subtype 1 | miR-199B | Helicobacter
pylori infection | GIT1 | 1.256062 | 0.0307 |
|
| miR-122A | Helicobacter
pylori infection | GIT1 | 1.256062 | 0.0314 |
|
| miR-199A | Helicobacter
pylori infection | GIT1 | 1.256062 | 0.0317 |
|
| miR-202 | Type II diabetes
mellitus | CACNA1E | 0.610109 | 0.0356 |
| Subtype 2 | miR-198 | NF-κB signaling
pathway | PIAS4 | 1.156533 | 0.0181 |
|
| miR-338 | NF-κB signaling
pathway | CCL21 | 1.170037 | 0.0195 |
|
| miR-370 | NF-κB signaling
pathway | CCL21 | 1.16555 | 0.0211 |
|
| miR-508 | Tight junction | VAPA | 1.857042 | 0.0372 |
| Subtype 3 | miR-146B | Proteasome | PSMD3 | 1.187736 | 0.008 |
|
| miR-524 | Nucleotide excision
repair | ERCC8 | 1.532384 | 0.009 |
|
| miR-146A | Proteasome | PSMD3 | 1.187736 | 0.011 |
|
| miR-193A | Fatty acid
metabolism | ACACA | 2.006123 | 0.049 |
| Subtype 4 | miR-429 | Salmonella
infection | LRP1 and
CACNA1C | 2.278013 | 0.022 |
|
| miR-34A | Focal adhesion | VCL | 0.760521 | 0.029 |
|
| miR-205 | Salmonella
infection | LRP1 | 1.085376 | 0.031 |
|
| miR-34C | Focal adhesion | VCL | 0.760521 | 0.032 |
|
| miR-449 | Focal adhesion | VCL | 0.760521 | 0.041 |
H. pylori infection rate in each GC
subtype
H. pylori infection rate in each GC subtype
was analyzed as aforementioned. The NN model was a more accurate
method to distinguish the four GC subtypes compared with the LR
model (Fig. 4A and B,
respectively); the NN model was therefore used to predict the GC
subtypes for all samples (Table
III), and all the GC samples were divided into the four
testing-set. Subsequently, the four testing-set was used to predict
the subtype of the 100 GC samples in the PMID:24816253 data set.
Notably, the H. pylori infection rate in subtype 1 was
higher than in other subtypes (Table
IV), indicating that there was an increased susceptibility to
H. pylori infection in subtype 1 compared with other
subtypes. This outcome was consistent with the aforementioned
analysis, which indicated that H. pylori infection may be a
specific pathway for GC subtype 1.
| Table III.Predicting gastric cancer subtypes
using the neural network model. |
Table III.
Predicting gastric cancer subtypes
using the neural network model.
|
| Predicted |
|---|
|
|
|
|---|
| Type | Subtype 1 | Subtype 2 | Subtype 3 | Subtype 4 |
|---|
| Observed |
|
|
|
|
| Subtype
1 | 11 | 1 | 1 | 1 |
| Subtype
2 | 0 | 25 | 0 | 2 |
| Subtype
3 | 1 | 3 | 9 | 0 |
| Subtype
4 | 1 | 0 | 0 | 13 |
| Table IV.Helicobacter pylori infection
rate of four gastric cancer subtypes. |
Table IV.
Helicobacter pylori infection
rate of four gastric cancer subtypes.
| Subtype | Infection
ratio | n |
|---|
| Subtype 1 | 0.67 | 24 |
| Subtype 2 | 0.34 | 29 |
| Subtype 3 | 0.58 | 19 |
| Subtype 4 | 0.32 | 28 |
Discussion
In the present study, a total of 1,263 DEGs in the
65 PGD samples were identified, which allowed the samples to be
divided into four subtypes based on hierarchy cluster analysis. In
addition, a total of 33 specific genes were screened in subtype 1,
318 in subtype 2, 161 in subtype 3 and 157 in subtype 4. The
subpaths miR-202/CACNA1E/type II diabetes mellitus,
miR-338/CCL21/NF-κB signaling,
miR-146B/PSMD3/proteasome, miR-34A/VCL/focal adhesion
and miR-34C/VCL/focal adhesion were identified more than
once and therefore may be important specific subpaths of the four
GC subtypes, respectively.
That H. pylori infection may serve a role in
the progression of GC is widely accepted (24). Notably, results from the present
study demonstrated that several specific genes of subtype 1 were
significantly enriched in H. pylori infection pathway and
that the H. pylori infection rate in GC subtype 1 was higher
than in other subtypes. Therefore, the present study hypothesized
that H. pylori infection was a specific pathway for GC
subtype 1.
CACNA1E encodes a Cav2.3 R-type
voltage-activated Ca2+ channel that is involved in gene
expression regulation, cell differentiation and cell death
(25). In addition, CACNA1E
has been reported to be upregulated in air pollution-associated
lung cancer (26), and the
abnormal expression of CACNA1E may be used to predict the
occurrence of cancers (27).
Results from the present study revealed that CACNA1E may be
a specific gene of GC subtype 1, and miR-202/CACNA1E/type II
diabetes mellitus was predicted to be an important subpath of
subtype 1. In addition, the downregulated expression of miR-202 may
suppress GC cell proliferation (28). Furthermore, CACNA1E
expression may increase the risk of the type 2 diabetes, and there
is close correlation between the metabolic syndrome and the
development of gastric adenocarcinoma (29,30).
Therefore, it was inferred that CACNA1E, as a target of
miR-202, may be related to GC subtype 1 by participating in the
type II diabetes mellitus related metabolic pathway.
For GC subtype 2, the results indicated that
miR-338-CCL21-NF-κB signaling was one of the important
subpaths. CCL21 encodes a C-C chemokine that is mainly
presented in lymphoid tissue and serves an important role in
dendritic cell recruitment and lymphoid neogenesis (31). In addition, NF-κB signaling is a
major link between cancer and inflammation, which is triggered by
proinflammatory cytokines such as CCL21 (32,33);
several previous studies have indicated that the activation of
NF-κB signaling is related to GC oncogenesis (34–36).
In addition, miR-338 was highly associated with GC through the
inhibition the GC cell proliferation (37), which is similar with the present
data. These results suggested that miR-338 may promote apoptosis of
GC subtype 2 cells by activating the NF-κB signaling pathway
through targeting CCL21.
Pathway enrichment analysis of the specific genes in
subtype 3 demonstrated that most of the identified pathways were
related to carbohydrate metabolism, such as fatty acid metabolism,
ribosome biogenesis, ubiquitin-mediated proteolysis and proteasome.
Proteasome is protein complex which degrades unneeded or damaged
proteins by proteolysis and mediates protein folding. In addition,
PSMD3 was identified as a proteasome-pathway related gene
that may be regulated by miR-146A. Previous studies reported that
PSMD3 was highly related to the progression of breast cancer
and lung cancer (38,39). In addition, it has been indicated
that miR-146A serves a key function in GC development by
suppressing proliferation of GC cells (40,41).
Therefore, the present study hypothesized that miR-146A may be
related to GC subtype 3 by targeting PSMD3.
VCL encodes a cytoskeletal protein that
contributes to the function of cell-cell and cell-matrix junctions,
and is predicted to be associated with GC (42). This was consistent with the present
results, which demonstrated that VCL was a specific gene for
GC subtype 4. In addition, it has been reported that VCL may
be a potential biomarker in many cancers, including GC, pancreatic
cancer and colorectal cancer, as the downregulated expression of
VCL may promote metastasis and tumor progression (43–45).
In addition, the miR-34 family/yin yang 1 axis was reported to
serve a crucial role in gastric carcinogenesis (46). Therefore, miR-34A and miR-34C may
depend on VCL to inhibit the spreading of GC subtype 4 cells
by improving focal adhesion.
In summary, GC was divided into four subtypes based
on the identified 1,263 DEGs in the PGD samples. Additionally,
specific genes such as CACNA1E, CCL21, PSMD3 and
VCL may be used as potential feature genes to identify
different types of GC. It was concluded that the subtype-specific
subpaths such as miR-202/CACNA1E/type II diabetes mellitus,
miR-338/CCL21/NF-κB signaling,
miR-146B/PSMD3/proteasome and miR-34A/VCL/focal
adhesion and miR-34C/VCL/focal adhesion may serve crucial
roles in the development of GC subtypes. Furthermore, the present
study speculated that H. pylori infection was a specific
pathway for GC subtype 1. However, further experimentation is
required to confirm these predicted outcomes.
References
|
1
|
Nogueira A, Cabral M, Salles P, Araujo L,
Rodrigues L, Rodrigues M, Oliveira C, Queiroz D, Rocha G and
Oliveira A: Role of intestinal metaplasia and epithelial dysplasia
in the pathogenesis of gastric carcinoma. Gastroenterology.
118:A14042000. View Article : Google Scholar
|
|
2
|
Jemal A, Bray F, Center MM, Ferlay J, Ward
E and Forman D: Global cancer statistics. CA Cancer J Clin.
61:69–90. 2011. View Article : Google Scholar : PubMed/NCBI
|
|
3
|
Massarrat S and Stolte M: Development of
gastric cancer and its prevention. Arch Iran Med. 17:514–520.
2014.PubMed/NCBI
|
|
4
|
Shah MA, Khanin R, Tang L, Janjigian YY,
Klimstra DS, Gerdes H and Kelsen DP: Molecular classification of
gastric cancer: A new paradigm. Clin Cancer Res. 17:2693–2701.
2011. View Article : Google Scholar : PubMed/NCBI
|
|
5
|
De Aretxabala X, Yonemura Y, Sugiyama K,
Hirose N, Kumaki T, Fushida S, Miwa K and Miyazaki I: Gastric
cancer heterogeneity. Cancer. 63:791–798. 1989. View Article : Google Scholar : PubMed/NCBI
|
|
6
|
Chang HR, Nam S, Kook MC, Kim KT, Liu X,
Yao H, Jung HR, Lemos R Jr, Seo HH, Park HS, et al: HNF4α is a
therapeutic target that links AMPK to WNT signalling in early-stage
gastric cancer. Gut. 65:19–32. 2016. View Article : Google Scholar : PubMed/NCBI
|
|
7
|
Jiao S, Wang H, Shi Z, Dong A, Zhang W,
Song X, He F, Wang Y, Zhang Z, Wang W, et al: A peptide mimicking
VGLL4 function acts as a YAP antagonist therapy against gastric
cancer. Cancer Cell. 25:166–180. 2014. View Article : Google Scholar : PubMed/NCBI
|
|
8
|
Li Z, Yu X, Wang Y, Shen J, Wu WK, Liang J
and Feng F: By downregulating TIAM1 expression, microRNA-329
suppresses gastric cancer invasion and growth. Oncotarget.
6:17559–17569. 2015.PubMed/NCBI
|
|
9
|
Zhao X, Dou W, He L, Liang S, Tie J, Liu
C, Li T, Lu Y, Mo P, Shi Y, et al: MicroRNA-7 functions as an
anti-metastatic microRNA in gastric cancer by targeting
insulin-like growth factor-1 receptor. Oncogene. 32:1363–1372.
2013. View Article : Google Scholar : PubMed/NCBI
|
|
10
|
Chen F, Zhuang M, Peng J, Wang X, Huang T,
Li S, Lin M, Lin H, Xu Y, Li J, et al: Baicalein inhibits migration
and invasion of gastric cancer cells through suppression of the
TGF-β signaling pathway. Mol Med Rep. 10:1999–2003. 2014.
View Article : Google Scholar : PubMed/NCBI
|
|
11
|
Yanai K, Nagai S, Wada J, Yamanaka N,
Nakamura M, Torata N, Noshiro H, Tsuneyoshi M, Tanaka M and Katano
M: Hedgehog signaling pathway is a possible therapeutic target for
gastric cancer. J Surg Oncol. 95:55–62. 2007. View Article : Google Scholar : PubMed/NCBI
|
|
12
|
Cho JY, Lim JY, Cheong JH, Park YY, Yoon
SL, Kim SM, Kim SB, Kim H, Hong SW, Park YN, et al: Gene expression
signature-based prognostic risk score in gastric cancer. Clin
Cancer Res. 17:1850–1857. 2011. View Article : Google Scholar : PubMed/NCBI
|
|
13
|
Diaz-Romero J, Romeo S, Bovée JV,
Hogendoorn PC, Heini PF and Mainil-Varlet P: Hierarchical
clustering of flow cytometry data for the study of conventional
central chondrosarcoma. J Cell Physiol. 225:601–611. 2010.
View Article : Google Scholar : PubMed/NCBI
|
|
14
|
De Ronde JJ, Rigaill G, Rottenberg S,
Rodenhuis S and Wessels LF: Identifying subgroup markers in
heterogeneous populations. Nucleic Acids Res. 41:e2002013.
View Article : Google Scholar : PubMed/NCBI
|
|
15
|
He L and Sarkar SK: On improving some
adaptive BH procedures controlling the FDR under dependence.
Electron J Stat. 7:2683–2701. 2013. View Article : Google Scholar
|
|
16
|
Guttula SV, Allam A and Gumpeny RS:
Analyzing microarray data of Alzheimer's using cluster analysis to
identify the biomarker genes. Int J Alzheimers Dis.
2012:6494562012.PubMed/NCBI
|
|
17
|
Di Pietro C, Di Pietro V, Emmanuele G,
Ferro A, Maugeri T, Modica E, Pigola G, Pulvirenti A, Purrello M,
Ragusa M, et al: AntiClustal: Multiple sequence alignment by
antipole clustering and linear approximate 1-median computation.
Proc IEEE Comput Soc Bioinform Conf. 2:pp. 326–336. 2003;
PubMed/NCBI
|
|
18
|
Su X, Song B, Wang X, Ma X, Xu J and Ning
K: Meta-Mesh: Metagenomic data analysis system. Sheng Wu Gong Cheng
Xue Bao. 30:6–17. 2014.(In Chinese). PubMed/NCBI
|
|
19
|
Yu T and Peng H: Hierarchical clustering
of high-throughput expression data based on general dependences.
IEEE/ACM Trans Comput Biol Bioinform. 10:1080–1085. 2013.
View Article : Google Scholar : PubMed/NCBI
|
|
20
|
Liberzon A: A description of the molecular
signatures database (MSigDB) web site. Methods Mol Biol.
1150:153–160. 2014. View Article : Google Scholar : PubMed/NCBI
|
|
21
|
Li J and Lu Z: Pathway-based drug
repositioning using causal inference. BMC Bioinformatics. 14 Suppl
16:S32013. View Article : Google Scholar : PubMed/NCBI
|
|
22
|
Choi IK, Sung HJ, Lee JH, Kim JS and Seo
JH: The relationship between Helicobacter pylori infection and the
effects of chemotherapy in patients with advanced or metastatic
gastric cancer. Cancer Chemother Pharmacol. 70:555–558. 2012.
View Article : Google Scholar : PubMed/NCBI
|
|
23
|
Wang K, Yuen ST, Xu J, Lee SP, Yan HH, Shi
ST, Siu HC, Deng S, Chu KM, Law S, et al: Whole-genome sequencing
and comprehensive molecular profiling identify new driver mutations
in gastric cancer. Nat Genet. 46:573–582. 2014. View Article : Google Scholar : PubMed/NCBI
|
|
24
|
Uemura N, Okamoto S and Yamamoto S: H.
pylori infection and the development of gastric cancer. Keio J Med.
51 Suppl 2:S63–S68. 2002. View Article : Google Scholar
|
|
25
|
Tang ZZ, Liang MC, Lu S, Yu D, Yu CY, Yue
DT and Soong TW: Transcript scanning reveals novel and extensive
splice variations in human l-type voltage-gated calcium channel,
Cav1.2 alpha1 subunit. J Biol Chem. 279:44335–44343. 2004.
View Article : Google Scholar : PubMed/NCBI
|
|
26
|
Yu XJ, Yang MJ, Zhou B, Wang GZ, Huang YC,
Wu LC, Cheng X, Wen ZS, Huang JY, Zhang YD, et al: Characterization
of somatic mutations in air pollution-related lung cancer.
EBioMedicine. 2:583–590. 2015. View Article : Google Scholar : PubMed/NCBI
|
|
27
|
Moler E, Rowe M, Tse C, Xu X and Yu G:
CACNA1E in cancer diagnosis detection and treatment. EP 2062591 A1.
2009.
|
|
28
|
Zhao Y, Li C, Wang M, Su L, Qu Y, Li J, Yu
B, Yan M, Yu Y, Liu B and Zhu Z: Decrease of miR-202-3p expression,
a novel tumor suppressor, in gastric cancer. PLoS One.
8:e697562013. View Article : Google Scholar : PubMed/NCBI
|
|
29
|
Holmkvist J, Tojjar D, Almgren P, Lyssenko
V, Lindgren CM, Isomaa B, Tuomi T, Berglund G, Renström E and Groop
L: Polymorphisms in the gene encoding the voltage-dependent Ca(2+)
channel Ca (V)2.3 (CACNA1E) are associated with type 2 diabetes and
impaired insulin secretion. Diabetologia. 50:2467–2475. 2007.
View Article : Google Scholar : PubMed/NCBI
|
|
30
|
Lindkvist B, Almquist M, Bjørge T, Stocks
T, Borena W, Johansen D, Hallmans G, Engeland A, Nagel G, Jonsson
H, et al: Prospective cohort study of metabolic risk factors and
gastric adenocarcinoma risk in the metabolic syndrome and cancer
project (Me-Can). Cancer Causes Control. 24:107–116. 2013.
View Article : Google Scholar : PubMed/NCBI
|
|
31
|
Luther SA, Bidgol A, Hargreaves DC,
Schmidt A, Xu Y, Paniyadi J, Matloubian M and Cyster JG: Differing
activities of homeostatic chemokines CCL19, CCL21, and CXCL12 in
lymphocyte and dendritic cell recruitment and lymphoid neogenesis.
J Immunol. 169:424–433. 2002. View Article : Google Scholar : PubMed/NCBI
|
|
32
|
Greten FR, Eckmann L, Greten TF, Park JM,
Li ZW, Egan LJ, Kagnoff MF and Karin M: IKKbeta links inflammation
and tumorigenesis in a mouse model of colitis-associated cancer.
Cell. 118:285–296. 2004. View Article : Google Scholar : PubMed/NCBI
|
|
33
|
Leibovich-Rivkin T, Lebel-Haziv Y, Lerrer
S, Weitzenfeld P and Ben-Baruch A: The versatile world of
inflammatory chemokines in cancer. Springer Neth. 1–175. 2014.
|
|
34
|
Sha M, Ye J, Zhang LX, Luan ZY, Chen YB
and Huang JX: Celastrol induces apoptosis of gastric cancer cells
by miR-21 inhibiting PI3K/Akt-NF-κB signaling pathway.
Pharmacology. 93:39–46. 2014. View Article : Google Scholar : PubMed/NCBI
|
|
35
|
Xia JT, Chen LZ, Jian WH, Wang KB, Yang
YZ, He WL, He YL, Chen D and Li W: MicroRNA-362 induces cell
proliferation and apoptosis resistance in gastric cancer by
activation of NF-κB signaling. J Transl Med. 12:332014. View Article : Google Scholar : PubMed/NCBI
|
|
36
|
Sha M, Ye J, Zhang L, Luan Z and Chen Y:
Celastrol induces apoptosis of gastric cancer cells by miR-146a
inhibition of NF-κB activity. Cancer Cell Int. 13:502013.
View Article : Google Scholar : PubMed/NCBI
|
|
37
|
Peng Y, Liu YM, Li LC, Wang LL and Wu XL:
MicroRNA-338 inhibits growth, invasion and metastasis of gastric
cancer by targeting NRP1 expression. PLoS One. 9:e944222014.
View Article : Google Scholar : PubMed/NCBI
|
|
38
|
Pang Y, Ball GR, Rakha EA, Powe DG, Caldas
C, Ellis IO and Green AR: O-37 SOX11 and PSMD3 expression in HER2
positive breast cancer. Eur J Cancer Suppl. 8:1–36. 2010.
View Article : Google Scholar
|
|
39
|
Qian J, Zou Y, Hoeksema M, Harris B, Chen
H and Massion P: Identification of FXR1-associated protein
complexes in lung cancer. Cancer Res. 76:28732016. View Article : Google Scholar
|
|
40
|
Hou Z, Li X, Yu L, Qian X and Liu B:
MicroRNA-146a is down-regulated in gastric cancer and regulates
cell proliferation and apoptosis. Med Oncol. 29:886–892. 2012.
View Article : Google Scholar : PubMed/NCBI
|
|
41
|
Dong HK, Chan JY, Jin KR, Middeldorp JM,
Woo JH and Chang MS: Epstein-Barr virus-encoded BARF1 downregulates
SMAD4 and increases miR-146a in gastric carcinoma cells. Cancer
Res. 75:27162015. View Article : Google Scholar : PubMed/NCBI
|
|
42
|
Jin GH, Wei X, Yang S and Wang LB:
Celecoxib exhibits an anti-gastric cancer effect by targeting focal
adhesion and leukocyte transendothelial migration-associated genes.
Oncol Lett. 12:2345–2350. 2016. View Article : Google Scholar : PubMed/NCBI
|
|
43
|
Zhang CH and Geng JS: Expression of
paxillin and vinculin in gastric carcinoma and precancerous lesion
and their effects on prognosis of gastric carcinoma. Chin J Diagn
Pathol. 14:377–380. 2007.
|
|
44
|
Wang Y, Kuramitsu Y, Ueno T, Suzuki N,
Yoshino S, Iizuka N, Zhang X, Akada J, Oka M and Nakamura K:
Proteomic differential display identifies upregulated vinculin as a
possible biomarker of pancreatic cancer. Oncol Rep. 28:1845–1850.
2012. View Article : Google Scholar : PubMed/NCBI
|
|
45
|
Li T, Guo H, Song Y, Zhao X, Shi Y, Lu Y,
Hu S, Nie Y, Fan D and Wu K: Loss of vinculin and membrane-bound
β-catenin promotes metastasis and predicts poor prognosis in
colorectal cancer. Mol Cancer. 13:2632014. View Article : Google Scholar : PubMed/NCBI
|
|
46
|
Wang AM, Huang TT, Hsu KW, Huang KH, Fang
WL, Yang MH, Lo SS, Chi CW, Lin JJ and Yeh TS: Yin Yang 1 is a
target of miR-34 family and contributes to gastric carcinogenesis.
Oncotarget. 5:5002–5016. 2014. View Article : Google Scholar : PubMed/NCBI
|